Abstract
In the domain of swine production, body weight (BW) and average daily gain (ADG) are recognized as the primary performance indicators. Nevertheless, the genetic architecture of ADG and BW in Dongliao black (DLB) pigs remains to be fully elucidated. In this study, we performed a genome-wide association analysis of BW, ADG, and body mass index (BMI) in 358 DLB pigs of different days of age. The genome-wide association study (GWAS) showed the following: (1) The most significant single nucleotide polymorphism (SNP) detected for BW was on Sus scrofa chromosome (SSC) 11:100,808 (p-value = 1.16 × 10⁻⁶) that was also the most significant SNP for ADG. (2) The most significant SNP associated with BMI was SSC17:51,463,521 (p-value = 5.16 × 10⁻⁸). (3) SNPs SSC10:6,523,844 and SSC17:23,852,682 were identified in both BW and ADG. A meta-analysis was conducted on BW at different days and demonstrated SSC5:39,028,335 (p-value = 8.37 × 10⁻⁶) which was not identified in the results of each single trait. The regions of two SNPs (SSC11:100,808, SSC4:10,703,277) exhibited considerable influence on both BW and ADG and the related regions were selected for linkage disequilibrium (LD) analyses that exhibited a notable linkage. In addition, several genes were identified that are associated with obesity and play roles in lipid metabolism, including MACROD2, PHLPP2, CYP2E1, and STT3B.
1. Introduction
Global pork consumption accounts for 31% of all meat in 2020 (https://www.fao.org/3/cb1993en/cb1993en_meat.pdf, accessed on 19 April 2024). In recent years, the demand for high-quality pork has been increasing [1]. The pig industry meets market demand with efficient meat productivity. Most of the economic traits of the pig have been significantly improved through continuous selection over time [2]. Body weight, a particularly important part of pig breeding, has received widespread attention [3]. Piglets with low birth weights are less able to suckle and do not have enough energy to withstand the cold, resulting in slow growth and high mortality [4]. The effect of average daily gain at different stages of pig productivity is an important indicator for assessing pig growth rate [5].
However, both body weight (BW) and average daily gain (ADG) are complex quantitative traits with moderately low heritability, regulated by multiple genes and influenced by genetic and environmental factors [6]. A study on the progeny of a cross between large white pig and European wild boar showed one quantitative trait locus (QTL) on Sus scrofa chromosome (SSC) 4 associated with growth traits [7]. The QTL associated with BW was found on multiple chromosomes in the progeny of a cross between Landrace and Korean native pigs [8]. Currently, abundant quantitative trait loci for BW and ADG have been identified in pigs. According to the animal QTL database (Release 53, https://www.animalgenome.org, accessed on 6 March 2025), among the 55,166 QTL from 819 publications found in pigs, a total of 637 and 926 QTL are associated with BW and ADG, respectively.
Genome-wide association study (GWAS) is a method for identifying variates that are associated with traits and exploring genetic ssvariation within the genome [9], which has been widely used in humans [10], plants [11], and animals [12]. The GWAS can be implemented with various statistical models, such as mixed linear models that incorporates one SNP at a time into the regression model to analyze the relationship between the marker and the target trait [13]. A number of studies determine genetic variation about BW and ADG in pigs through GWAS analysis. One study showed that seven SNPs that significantly associated with BW were identified on SSC 1, 3, 6, and 10 from Duroc × (Landrace × Yorkshire) hybrid pigs (DLY) [14]. The SNPs associated with ADG in Italian large white pigs were distributed on almost all chromosomes [5]. The GWAS result from progeny of Duroc × Erhualian crosses shown that NDUFAF6, TNS1, and HMGA1 are candidate genes of BW and ADG [15]. Although lots of studies about pig growth traits have existed and this research provides assistance in elucidating the genetic basis of conformational traits in pigs, there is almost no GWAS study about BW and ADG in Dongliao black (DLB) pigs.
The DLB pig is one of famous indigenous breed originated from North China with a black coat color, compact and sturdy body, medium-sized head, slightly wide forehead, wide and straight back, stout hooves. The DLB pigs exhibit strong adaptability, being able to withstand cold weather and tolerate roughage. In this study, we performed a GWAS of BW and ADG traits in different ages in DLB based on the China Chip-1 porcine SNP50K Bead Chip. Our results identified genetic variants and candidate genes that were significantly associated with BW and ADG in DLB pigs.
2. Results
2.1. The Descriptive Statistics of the BW, ADG, and BMI Traits for DLB Pigs
In this study, 18 growth-related traits of DLB were recorded, including BW traits at 1, 26, 60, and 90 days of age, six ADG traits between different days of age, and eight body mass index (BMI) traits. The 1-day-old body weight (BW1) had the lowest coefficient of variation (CV) at 17.86% and 90-day-old body weight (BW90) had the highest at 34.21%, which increased with age. The ADG26–60 stage had an average rate of 114.09 g/d, while the ADG from 60 to 90 days of age (ADG60–90) had the fastest growth rate of 189.65 g/d. The CV of ADG gradually increased from 26.62% at ADG1–26 to 52.77% at ADG60–90. The mean values of BMI between different days of age increased gradually with age and the CV ranged from 12.52% to 22.37%. Heritability between different days of age ranged from 0.22 to 0.83, with the highest performance at 60 days of age. The ADG between different days of age showed high heritability, ranging from 0.72 to 0.97. The heritability of BMI was generally low, except for BMI1-BH (0.79) versus BMI90-BH (0.99) (Table 1).

Table 1.
Variation of body weight conformation traits in DLB.
2.2. Relationship Among the Traits of the BW, ADG, and BMI
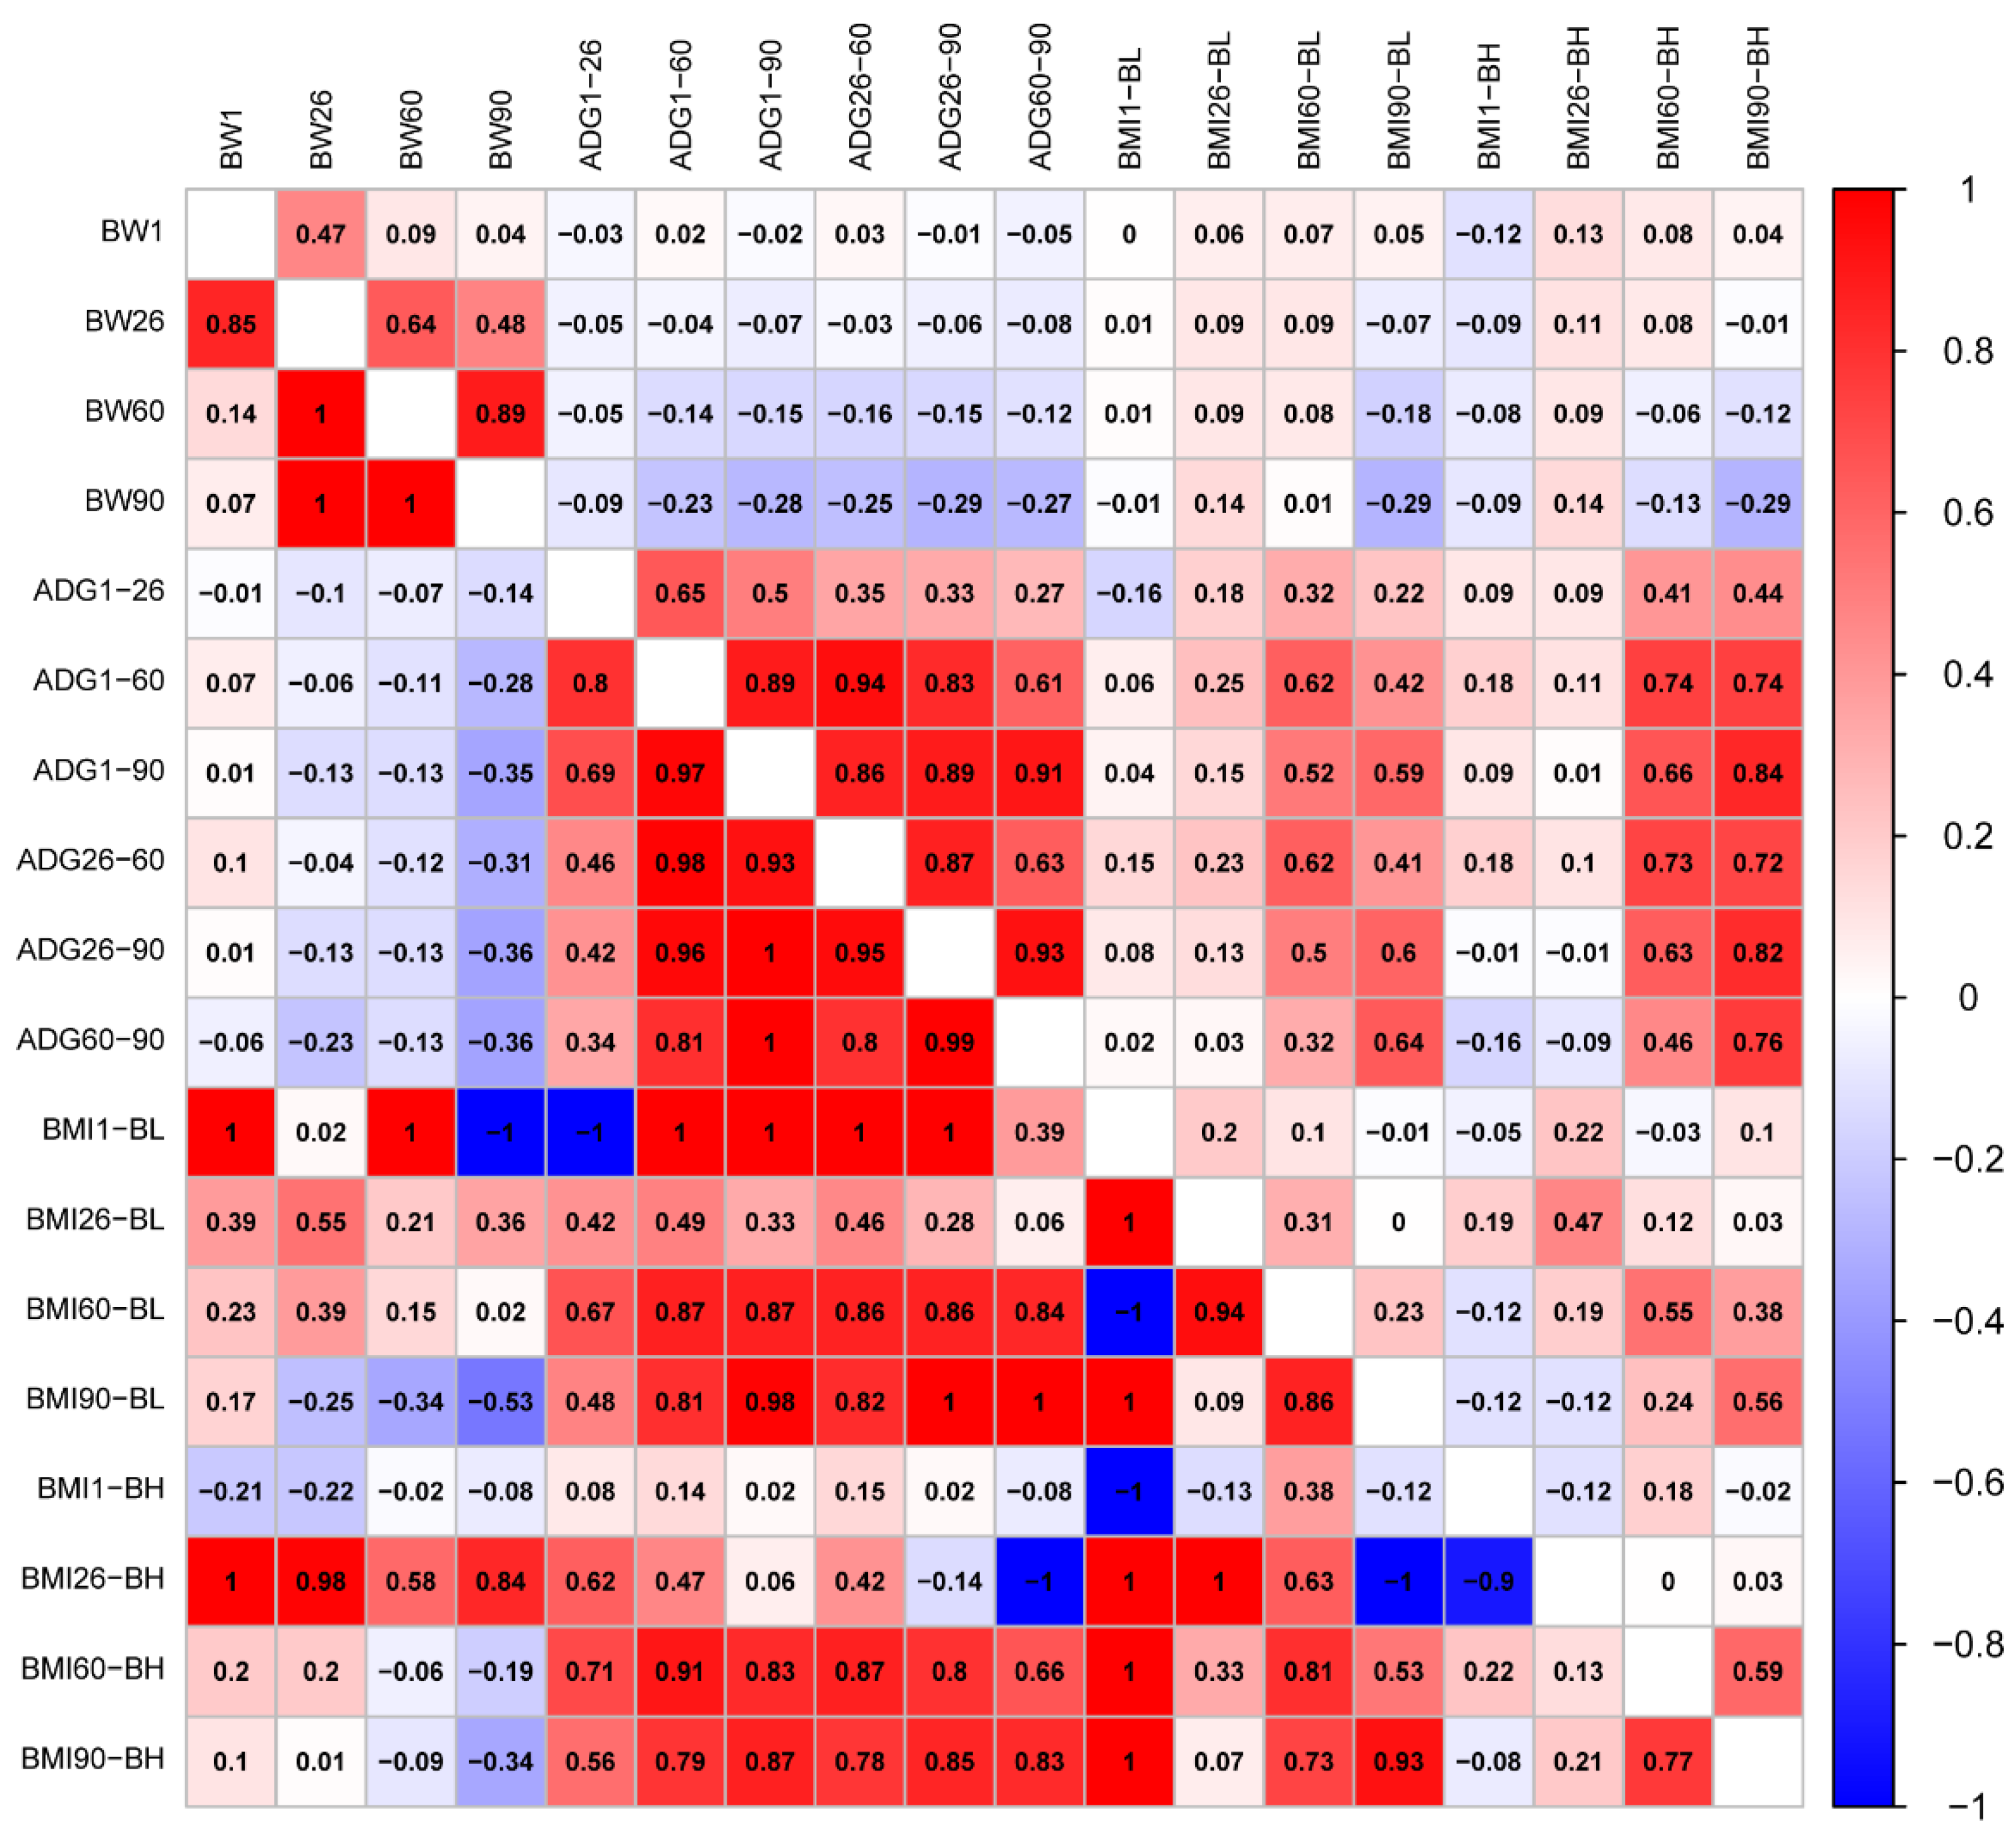
The traits generally conformed to a normal distribution (Figure S1). We calculated correlations of phenotype and genetics between BW, ADG, and BMI traits, respectively (Figure 1). The results showed that both phenotypic and genetic correlation coefficients between BW1 and BW60 were less than 0.14. There was a genetically perfect positive correlation between BW26, 60, and 90 (Genetic correlation, rg = 1). Phenotypic and genetic correlations of ADG between different days of age were positively correlated, with correlation coefficients over 0.27. A genetically perfect positive correlation (rg = 1) was found between ADG from 1 to 90 days of age (ADG1–90) and ADG from 26 to 90 days of age (ADG26–90), as well as ADG1–90 and ADG60–90. Phenotypic correlations of BMI were lower between days of age than that of BMI calculated from body height at 60 (BMI60-BH) and 90 days of age (BMI90-BH) with highest correlations (Phenotypic correlations, rp = 0.59). Body mass index was calculated from body length at 1 day of age (BMI1-BL) and body mass index calculated from body length at 60 days of age (BMI60-BL); the body mass index calculated from body height at 1 day of age (BMI1-BH) was genetically perfectly negatively correlated (rg = −1), but perfectly positively correlated with all other BMIs (rg = 1). BMI was calculated from body height at 26 days of age (BMI26-BH) and BMI was calculated from body length at 90 days of age (BMI90-BL); BMI1-BH was genetically highly negatively correlated (rg < −0.9). The phenotypes of BW and ADG were mostly genetically negatively correlated, but not significantly. However, BW90 and ADG26–60 had the highest correlations, as well as BW90 and ADG60–90 (rg = −0.36). There was a complete positive genetic correlation between BMI1-BL, and BW1, BW60 (rg = 1), but there was a complete negative correlation with BW90 (rg = −1). Heritability was also higher between BMI26-BH and BW (rg > 0.58). For the phenotype correlation between ADG and BMI60-BH, BMI90-BH was high (rp, 0.46–0.84). Genetically, BMI1-BL was fully negatively correlated with ADG from 1 to 26 days of age (ADG1–26, rg = −1). BMI1-BL was fully positively correlated with ADGs at all days of age except for a non-significant genetic correlation with ADG60–90 (rg = 1). BMI26-BH was genetically fully negatively correlated with ADG60–90 (rg = −1) (Figure 1).
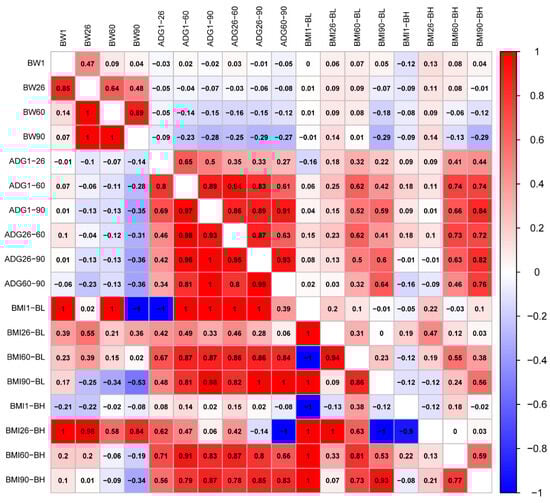
Figure 1.
Phenotypic correlations are shown above the diagonal. Below the diagonal is the genetic correlation.
2.3. Genome-Wide Association Study of BW, ADG, and BMI in DLB Pigs
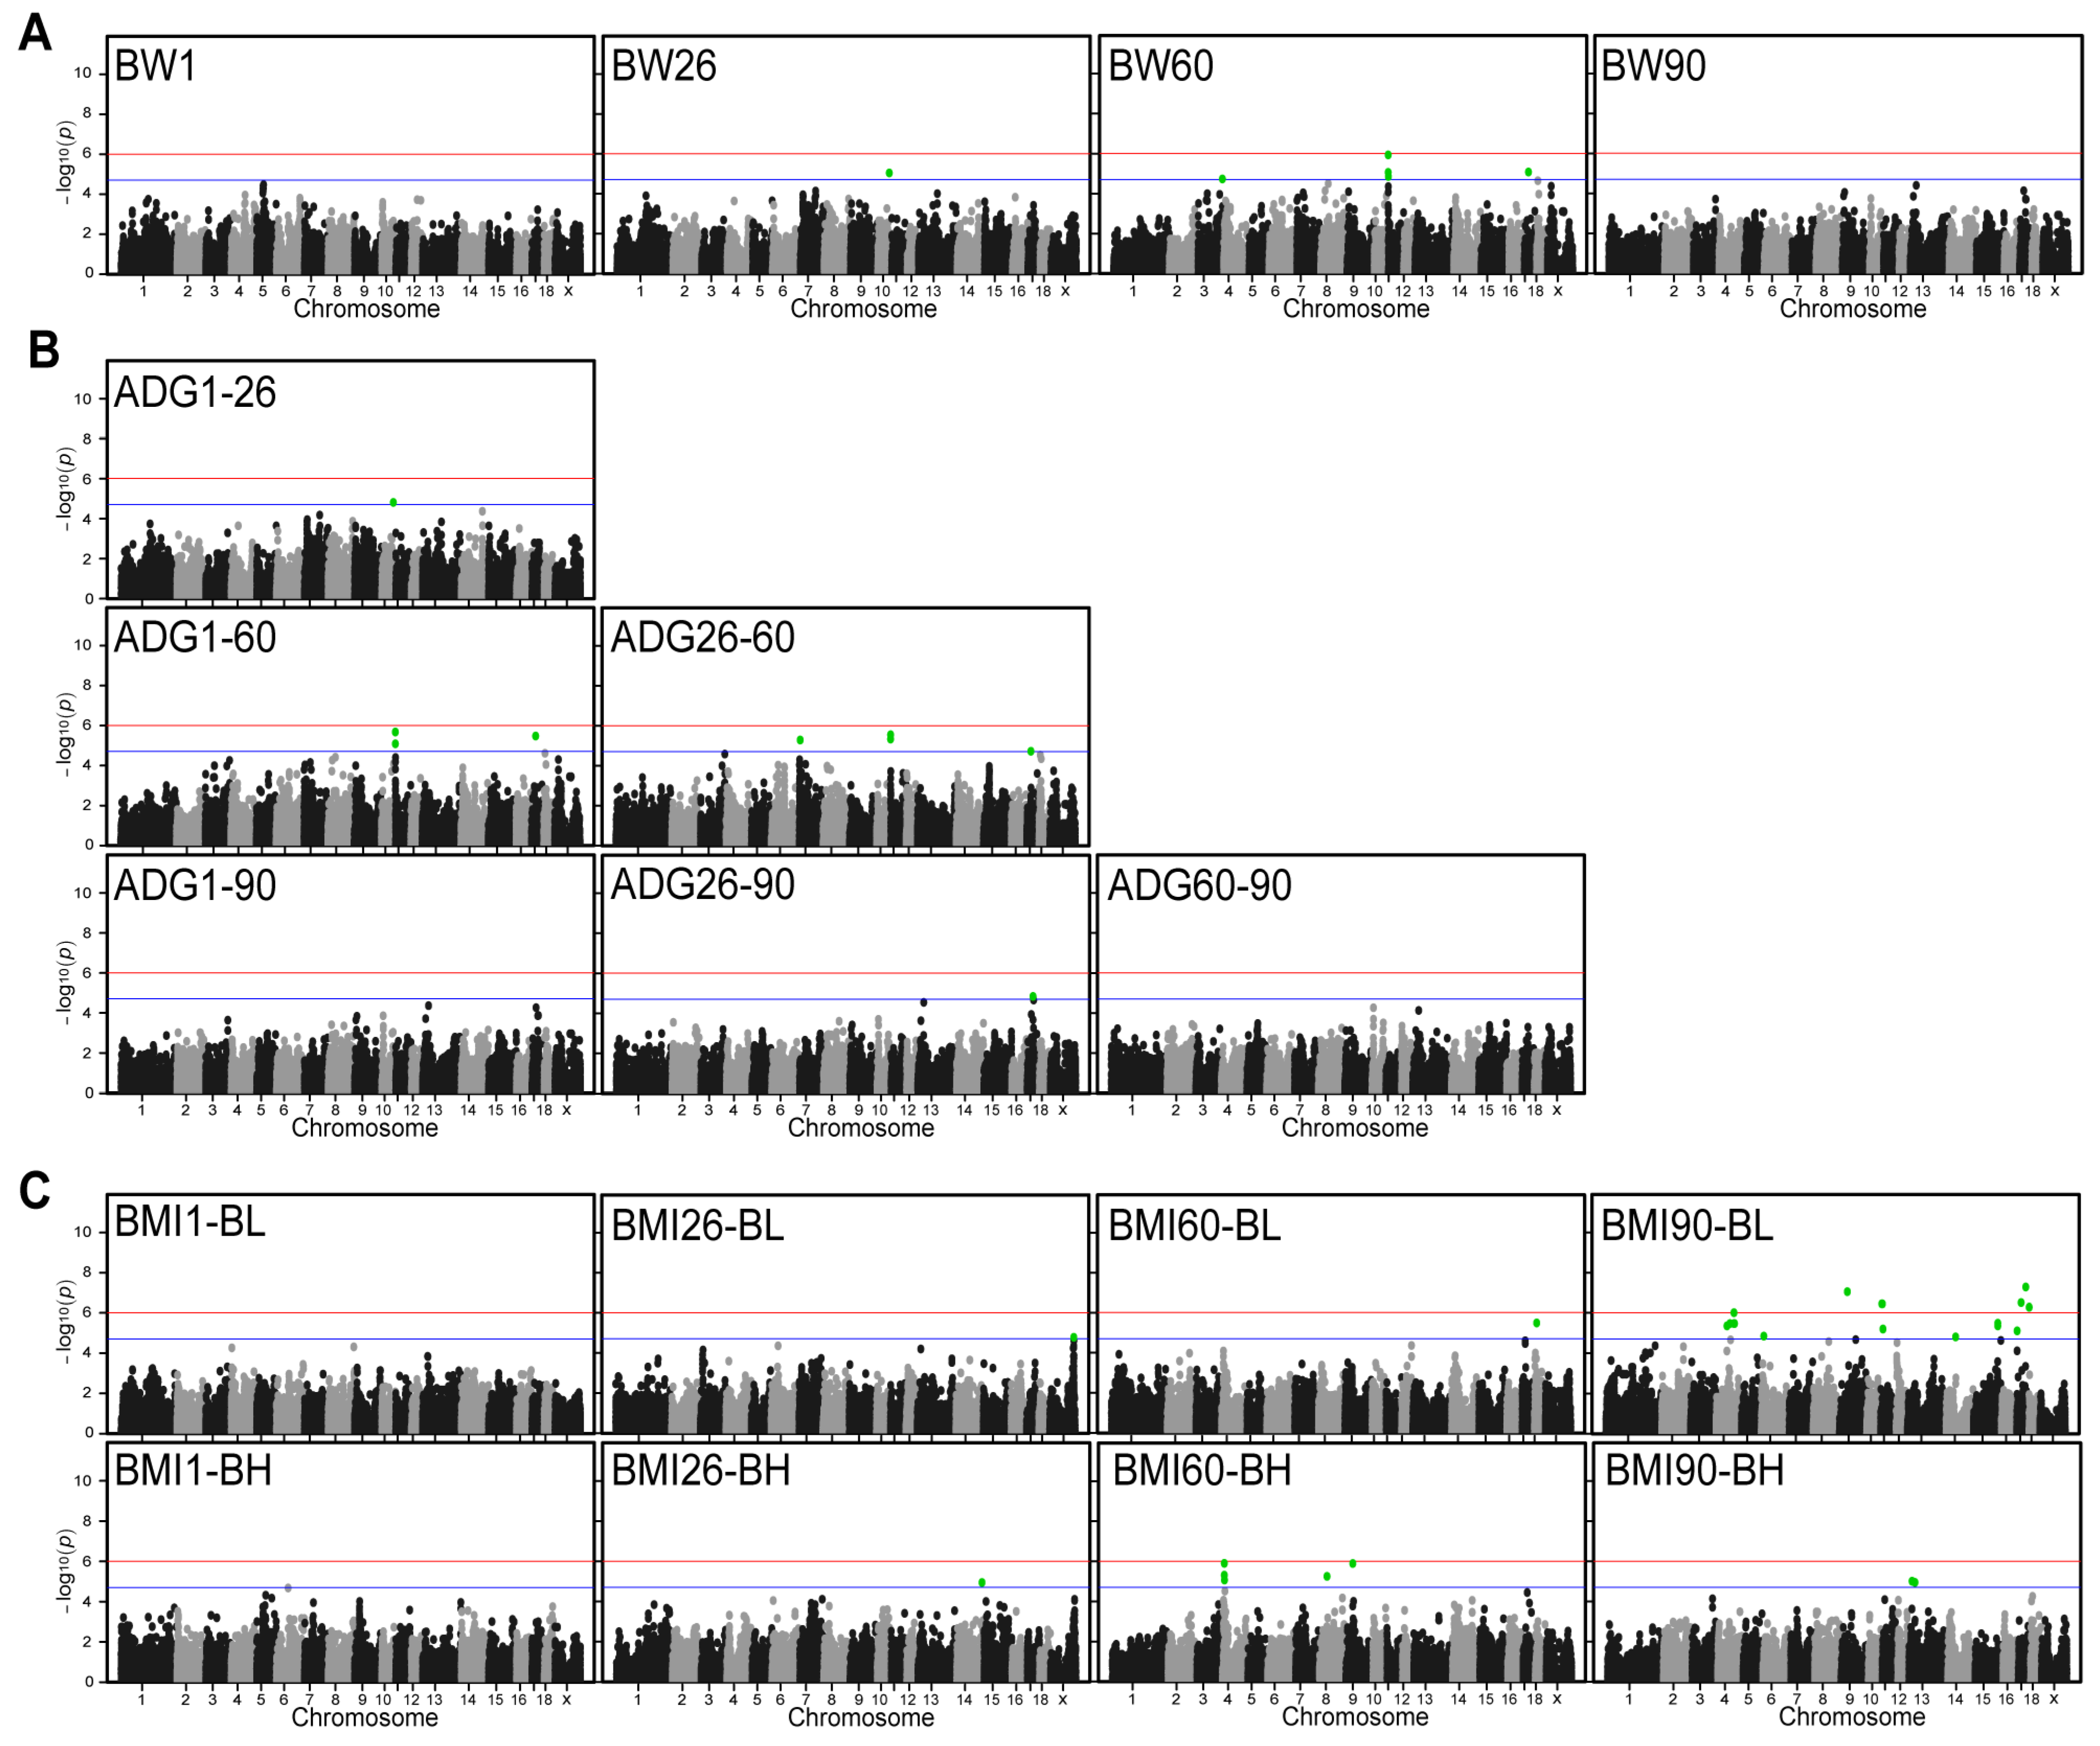
We performed GWAS analyses for these 18 traits. The results showed that Q-Q plots have no systematic inflation for all these traits (Figure S2). A total of 74 SNPs were detected in 18 traits in DLB at chromosome-wide significant levels (Figure 2). Among these SNPs, 6, 17, and 51 SNPs were significantly associated with BW, ADG, and BMI, of which, 30 annotated genes were obtained (Table 2). For the BW traits, six SNPs that were significantly associated with them were detected on SSC 3, 10, 11, and 17. The most significant SNP that located 13,517 bp downstream of ATP12A gene was on SSC11:100,808 with a p-value of 1.16 × 10⁻⁶ (Figure 2A). The analysis revealed a high level of significance for SNPs on SSC11 at the BW60, however, no significant SNPs identified for traits of BW1 and BW90. For the ADG, a total of 17 significant SNPs were detected on SSC7, 10, 11, and 17. The most significant SNP was SSC11:100,808 with a p-value of 2.10 × 10⁻⁶ (Figure 2B). This SNP was also detected in the BW60 trait and was the most significant SNP. The findings indicate that these SNPs exert a multitude of influences on disparate growth traits in DLB pigs. The GWAS results of ADG at different growth stages revealed that SNPs reaching statistical significance could be detected at the 60-day-old stage. However, no significant SNPs were detected at the 1-day-old and 90-day-old stages. For the BMI, 51 significant SNPs were detected on SSC 11. The most significant SNP was SSC17:51,463,521 with a p-value of 5.16 × 10⁻⁸. This SNP is the most significant SNP of all traits and is located on the annotated gene SLC9A8 (Figure 2C). For the different ages of BMI, it was observed that the significance SNP identified on SSC 4 was more favorable in BMI60-BH. However, a similar level of significance was not observed in other age groups.
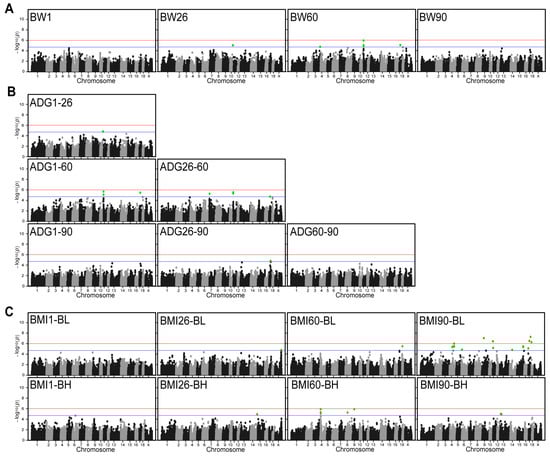
Figure 2.
Manhattan plots for genome-wide association analysis of the BW, ADG, and BMI. (A) Manhattan plots of weight traits at different days of age. (B) Manhattan plots of average daily body weight gain between different days of age. (C) Manhattan plots of BMI at different days of age. x-axis indicates chromosomes and y-axis indicates −log10 (p–value). The blue and red horizontal lines indicate the thresholds for suggestively (p–value = 1.97 × 10⁻⁵) and genome-wide (p–value = 9.85 × 10⁻⁷) significant SNPs, respectively. Green dots represent SNPs that reached the significance threshold.
Table 2.
Significant loci for BW, ADG, and BMI traits identified by China Chip-1 porcine SNP50K Bead Chip based genome-wide association studies.
2.4. Linkage Disequilibrium Block Analysis
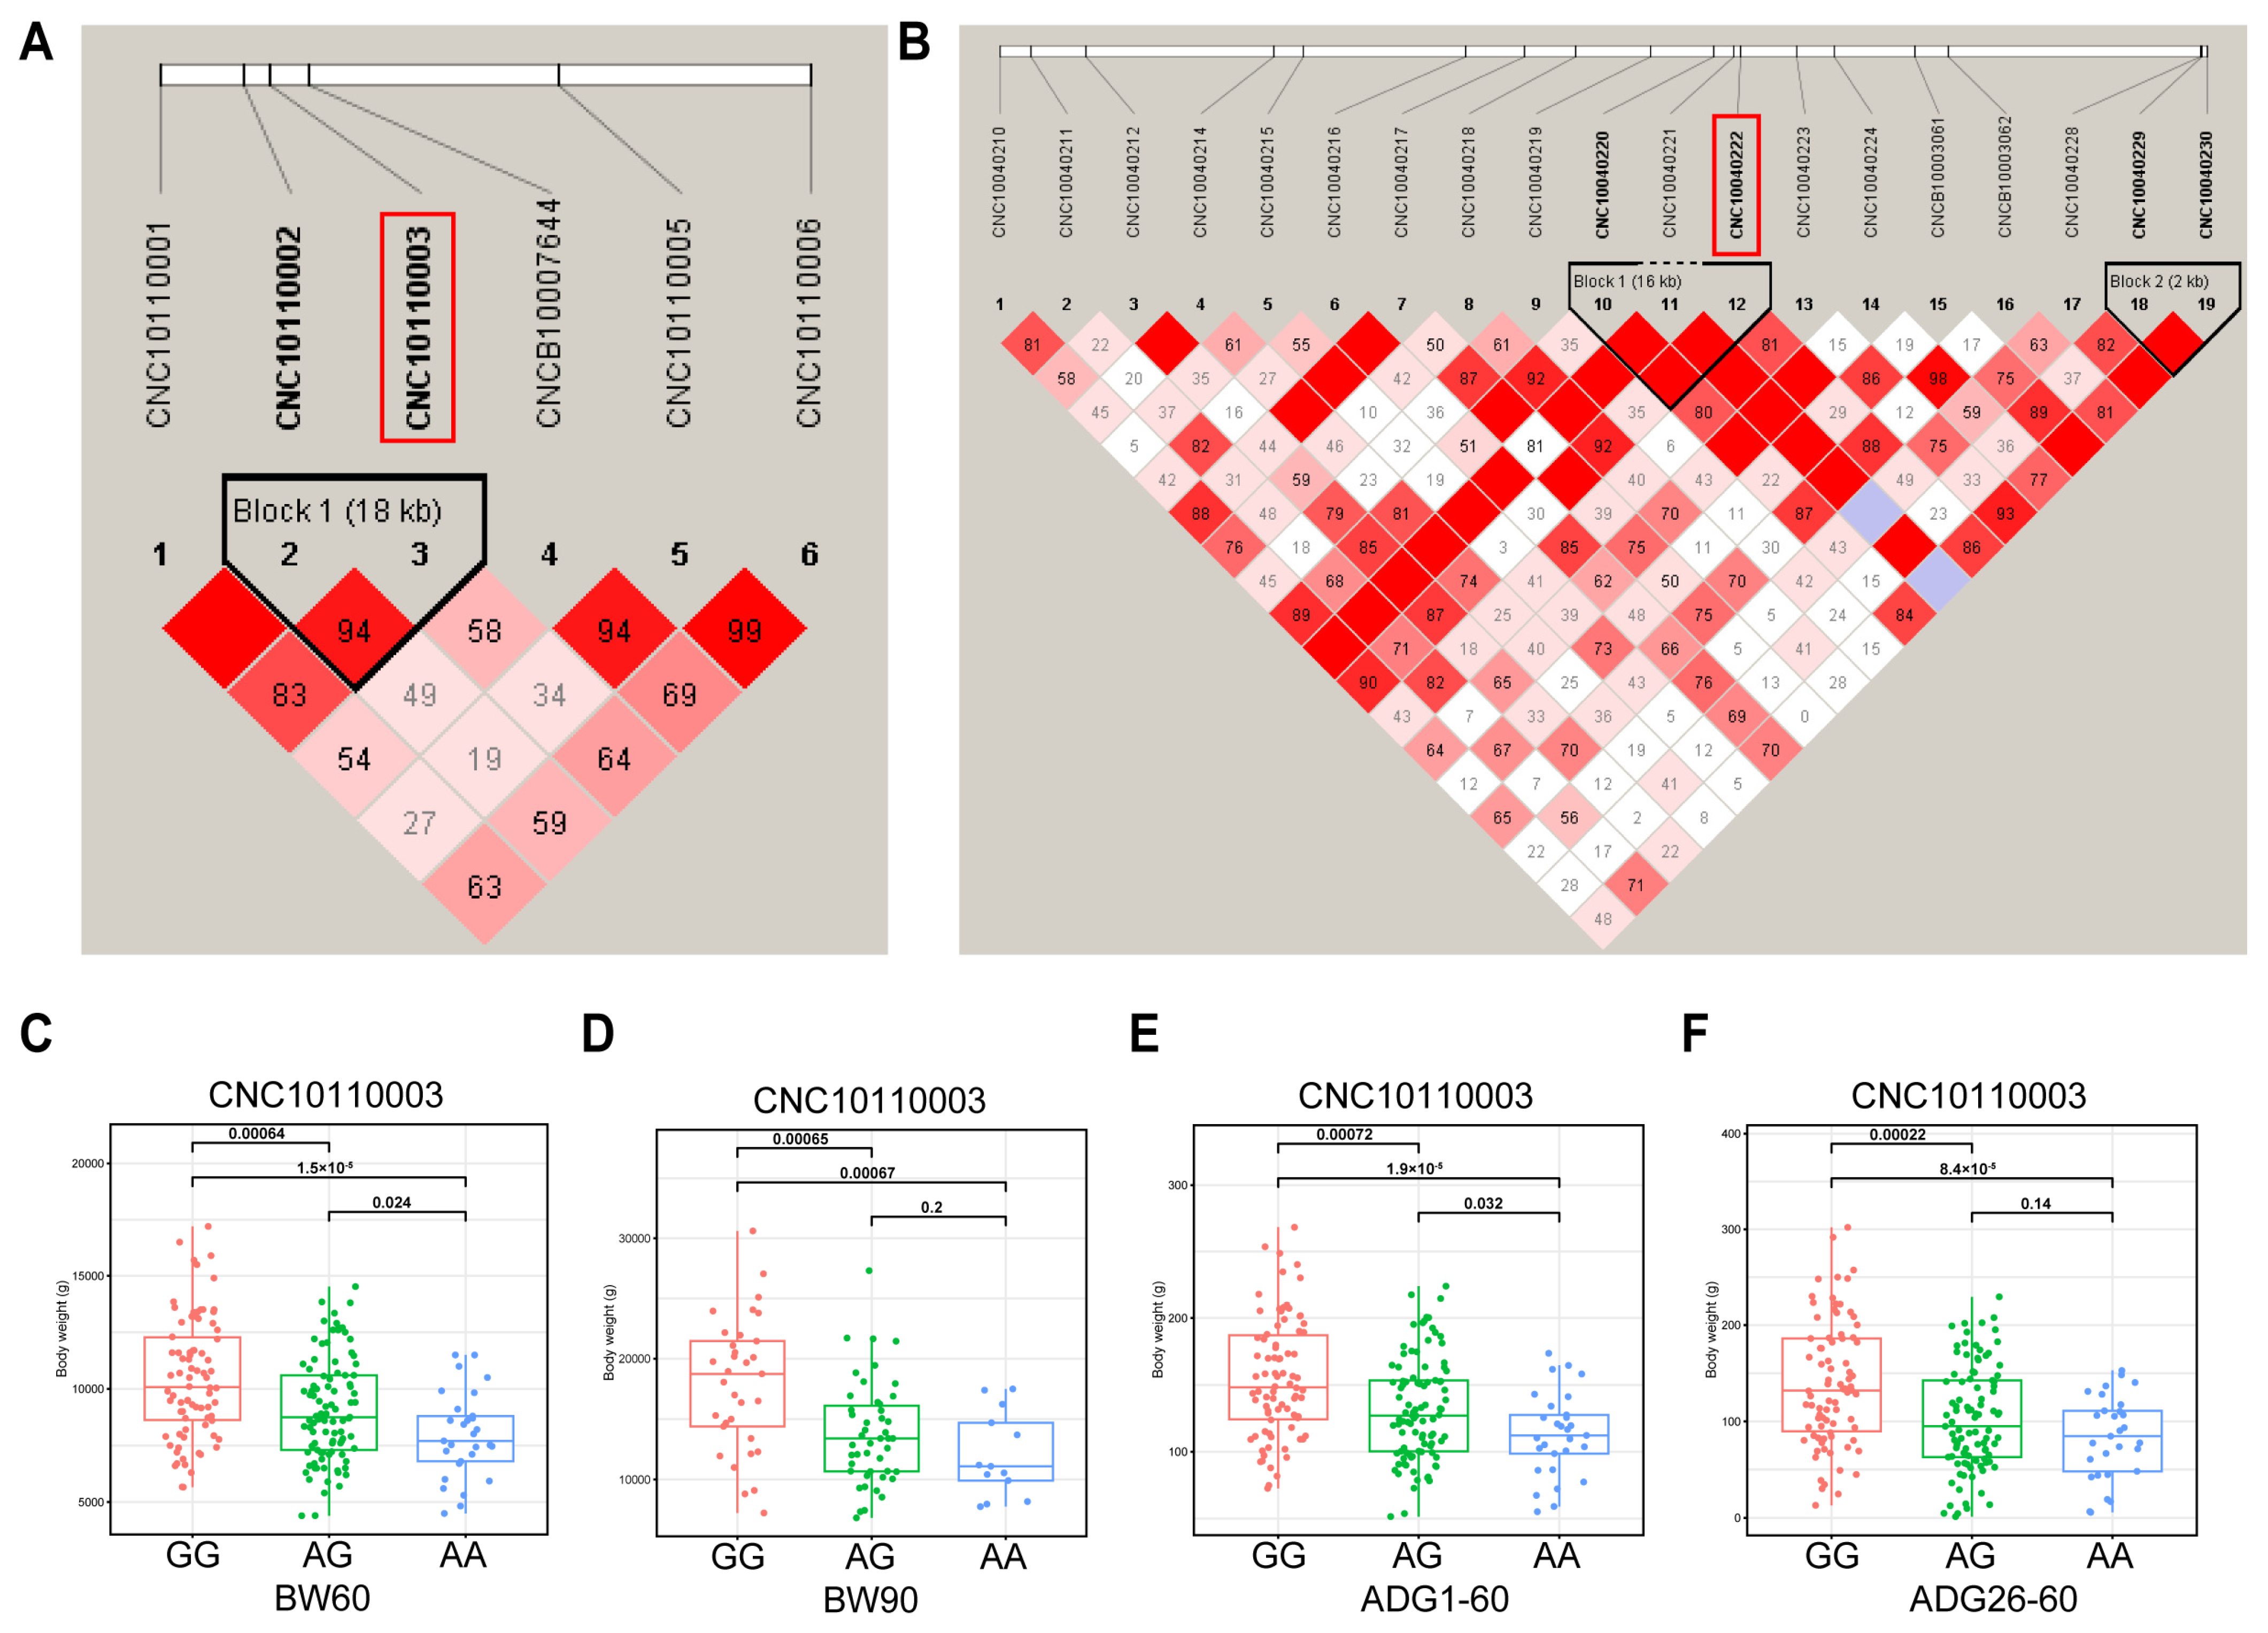
To test the presence of interlocking among significant SNPs, we analyzed interlocking unbalanced blocks in the regions where the major SNPs were located. We analyzed linkage disequilibrium (LD) in the regions where the two major SNPs (SSC11:100,808, SSC4:10,703,277) are located. The SNPs of SSC11:82,720 and SSC11:100,808 are located in an LD block of length 18 kb (Figure 3A). The 16 kb Block1 contains SNPs of SSC4:10,703,277, SSC4:10,699,548, and SSC4:10,686,323 and has r2 = 1.0. The 2 kb of Block2 contains SNPs of SSC4:10,999,856 and SSC4:11,002,675 and has r2 = 1.0 (Figure 3B). Further, we analyzed the genotypic distribution of CNC10110003 (SSC11:100,808). The genotype GG individuals of DLB pigs exhibit significantly greater body weights than those with the AG or AA (Figure 3C,D). The individuals with genotype AA exhibited the lowest body weight and the slowest growth rate (Figure 3E,F). The DLB pigs with the GG genotype were observed to exhibit a higher BMI than pigs with the GA and AA genotypes (Figure S3I,N).
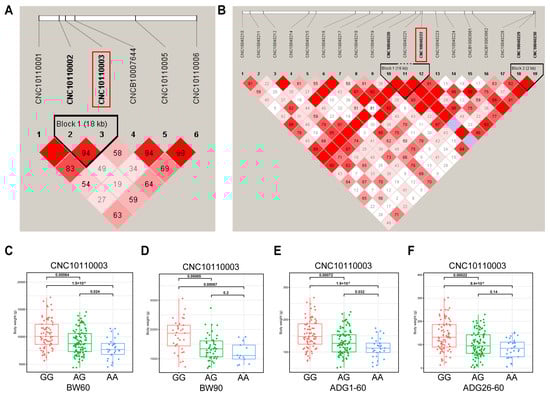
Figure 3.
The LD block region for the identified SNP. The LD blocks are colored in accordance with the standard Haploview color scheme: LOD > 2 and D’ = 1, red; LOD < 2 and D’ = 1, blue; LOD < 2 and D’ < 1, white (LOD is the log of the likelihood odds ratio, a measure of confidence in the value of D’). (A) The LD block analysis of the 18-kb region that surrounds the significant SNP of SSC11:100,808 for BW60. (B) The LD block analysis for the region identified by SNP of SSC4:10,703,277 for BMI60-BH. (C–F) The association between CNC10010003 (SSC11:100,808) and phenotypes of BW60, BW90, ADG1–60, and ADG26–90.
3. Discussion
3.1. Trait Analysis of BW, ADG, and BMI of DLB Pigs
The CV of BW gradually increased with the age in pigs, indicating that individual differences gradually increased during growth [16]. The CV of BW for DLB pigs in our research was 25.39%, however, only 5.32% and 24.04% for Landrace and Yorkshire pigs [17], which may be caused by different breeds as well as rearing levels. A cross progeny from boars (Duroc × Saba) and sows (Yorkshire × [Landrace × Saba]) showed an ADG of 448 g/d at 30–60 days of age [18]. However, the ADG was 604.31 g/d in Duroc pigs [19]. In our study, the average daily weight gain of DLB pigs from 26–60 days of age was 114.09 g/d, and the fastest growing stage was from 60–90 days of age with an average ADG of 189.65 g/d. It is evident that DLB pigs grow more slowly in the early stages. The heritability of ADG in Duroc pigs was 0.26 [20], while it ranges from 0.72–0.97 in our results which may be caused by differences in breed, genotype, and feeding factors. In our study, the fastest growth rate was observed in the ADG60–90 stages, and the CV of ADG also increased gradually over time, indicating inter-individual growth differences increased and pigs grew faster in later stages. We found the low phenotypic and genetic CV between BW1 and BW60. In addition, the genetic correlations among BW26, 60, and 90 were complete positive. These results signify higher genetic correlation among BW at the older stage and evident genetic correlation of BW at the later stage of growth. Phenotypic and genetic correlations of ADG among different days of age were positive with high CV values. It is worth mentioning that our results are similar to others’ research [18], suggesting some consistency in ADG between different stages. In our study, the BMI showed low phenotypic correlations among different days of age, while high correlations between specific indicators, such as BMI60-BH and BMI90-BH, were found. Meanwhile, BW and ADG were mainly genetically negatively correlated, while BW90 had a high correlation with ADG26–60 and ADG60–90, which suggested a specific relationship between BW and ADG during the later stages. Our results also showed the complete positive genetic correlation between BMI1-BL with BW1 or BW60 and the complete negative correlation with BW90. In addition, the genetic correlations among BMI26-BH and BMI in different days of age were high. These results suggested a complex genetic relationship between BMI and BW. The high phenotypic correlation between ADG and BMI60-BH or BMI90-BH also suggests a strong phenotypic relationship between ADG and BMI.
3.2. Significant Loci and Quantitative Train Loci for BW, ADG, and BMI
We performed single-trait GWAS for BW, ADG, and BMI of DLB at 1, 26, 60, and 90 days of age. Seventy-four significant SNPs were identified on SSC 14. Six SNPs on SSC 3, 10, 11, and 17 were significantly associated with BW. One QTL with 40 kb in length significantly associated with BW on SSC11:33.02–33.06 Mb was identified in large white and Landrace pigs [17], while a region of SSC11:0.1–1.11 Mb was identified in this study. In fact, the QTLs related to BW were identified on several chromosomes, including 4, 6, 7, and 15 in White Duroc × Erhualian [21]. These SNPs on SSC7 significantly associated with BW are located at 27.28–35.07 Mb. Similarly, we identified one QTL on SSC7 (1.10–11.82 Mb) for ADG26–60 as well. Our results for BW significantly differed from previous studies, possibly due to differences in pig breeds.
For the ADG trait, a total of 17 significant SNPs were identified on SSC 7, 10, 11, and 17 in this study. Results of an ADG study on the progeny of the large white and crossbred sows of Landrace × large white showed that SNPs significantly associated with ADG were primarily located on SSC 2, 4, and 8 [22]. Interestingly, one SNP of SSC7:5,113,060 [5] that was near our results (SSC7:5,822,223) was found to be associated with ADG in Italian large white pigs. One QTL of SSC7:22.66–35.07 Mb significantly associated with ADG between days of age was identified in White Duroc × Erhualian F3 pigs [21]. Two SNPs significantly associated with ADG were identified (SSC7:113,231,192 and SSC10:448,069,639) in Duroc pigs [23]. Notably, SSC10:65,273,844 was detected simultaneously in BW26, ADG1–26. In addition, the same SNP of SSC17:23,852,682 was detected in traits of BW60, ADG from 1 to 60 days of age (ADG1–60), and ADG26–60. The results reflect the coherence of pig growth and the continuous role of genetic factors. This indicates that these loci have an important influence on pig growth from the early growth stage to the later stage. However, our results differed from previous studies which means that the QTLs affecting ADG in DLB pigs may be different from other pig breeds.
The BMI is defined as the ratio of weight to height [24]. The definition of height is different between humans and pigs. According to previous studies, the body length [25] and body height [26] of pigs can be used as “height” to calculate BMI. BMI is usually one of the body’s indicators for the degree of obesity [27]. Some studies have shown that Yorkshire pigs’ BMI-related loci are associated with obesity diseases [28]. Fifty-one SNPs significantly associated with BMI were identified on SSC 4, 6, 8, 9, 11, 13, 14, 15, 17, 18, and X in pigs. SNPs significantly associated with BMI were identified on SSC14:234,578 in crossbred pigs of Duroc × Landrace × Yorkshire [14], while 15 QTLs were found to be significantly associated with BMI on SSC 1, 2, 4, 7, 8, 9, 10, 17, and 18 in Yorkshire Pigs [29]. The QTLs associated with BMI are heavily distributed in different regions of multiple chromosomes, which means BMI is subject to micro-efficient polygenic control. The SNPs associated with BMI identified in this study differ from other studies, partly due to pig breed.
3.3. Candidate Genes Identified According to the GWAS Results
We identified 30 candidate genes associated with BW, ADG, and BMI. For BW, MACROD2, ATP12A, FAM110C, and ASB13 were identified. The MACROD2 gene has been reported to be associated with obesity in Koreans [30]. Carriers of the minor allele of one mutation of MACROD2 reduced the risk of obesity and showed a trend toward a lower risk of BMI. Genes of ASB13, ATP12A, MACROD2, SLC35B3, PDYN, and SIRPB2 were identified from ADG. Knockdown of ASB13 promotes cell migration in breast cancer cells [31], and ASB13 is associated with the development of acute myocardial infarction [32]. ATP12A is associated with the absorption and transport of water and electrolytes in the mouse gastrointestinal tract [33]. Also in the body, it is involved in the transportation of ions and water in the colon [34]. A total of 17 annotated genes including PHLPP2, CYP2E1, and STT3B were found by GWAS analysis of BMI. It has been shown that PHLPP2 knockout mice exhibit enhanced systemic glucose tolerance and an increased rate of lipolysis [35]. The CYP2E1 gene plays an up-regulatory role in lipid metabolism in the golden Jinhua pigs [36]. The STT3B gene is involved in fatty acid metabolism in Jining gray goats [37]. In addition, the ATP12A gene was identified from results of BW60 and ADG1–60 as well. The MACROD2 gene was also identified from GWAS analysis for BW60, ADG1–60, and ADG26–60. Therefore, we consider ATP12A and MACROD2 genes as strong candidate genes for BW and ADG in DLB pigs. Two genes identified in this study, SLC9A8 and KRR1, are associated with BW traits in pigs. However, no other studies in the current study have reported that the SLC9A8 and KRR1 genes are associated with body weight traits in pigs. In summary, we identified several genes related to the growth traits of DLB pigs, some of which were found in other studies, and some were not reported. Our findings contribute new insights to the existing research on the genetic variation of porcine growth traits.
4. Materials and Methods
4.1. Animals and Phenotype
The experimental population consisted of 358 DLB pigs, including 294 females and 64 males. all raised under standardized conditions at the DLB pig farm (Shaoxing, Zhejiang, China). These pigs were derived from 118 distinct litters, ensuring genetic diversity and minimizing kinship bias. The farrowing dates were concentrated between March 2023 and July 2023. A total of four growth-related traits were obtained: body weights at 1-day-old (BW1), at the ages of 26-days-old (BW26), 60-days-old (BW60), and 90-days-old (BW90). The ADG was calculated between different days of age.
BMI = weight/body length2
Body mass index (BMI) is the ratio of body weight to height squared, and body length and body height of DLB were used to calculate BMI. Weight is in kilograms and body length and height are in meters.
4.2. Descriptive Statistical Analysis
The traits generally conformed to a normal distribution. Phenotypic correlations (rp) between traits were estimated using the corrplot package in the R v4.3.2 [38]. Genetic correlation (rg) and heritability were estimated for each trait using GCTA v1.94 software [39]. The models and equations were as follows:
Bivariate REML model formula:
Symbol definitions: , : Vectors of phenotypic observations for traits 1 and 2; , : fixed-effect design matrices; , : fixed-effects coefficient vectors; , : genetic random-effect design matrices; , : random genetic effect vectors ; , : residual error vectors .
Variance components:
Symbol definitions: , : additive genetic variance for traits 1 and 2; , : residual variance of traits 1 and 2; : genetic covariance between traits 1 and 2; : Kronecker product operator; : genomic relationship matrix (quantifies genetic similarity between individuals); : identity matrix.
Heritability estimation:
Symbol definitions: : heritability of trait 1 and 2.
Genetic correlation:
Symbol definitions: : genetic correlation between traits.
4.3. Genotyping and Quality Control
Total DNA was extracted from these 358 pigs and genotyped using the China Chip-1 porcine SNP50K Bead Chip (http://www.kangpusen.com/breeding/8.html, accessed on 6 March 2025), and 57,466 SNP markers across the genome were obtained. Quality control was performed using PLINK v1.90 [40]. The filtering criteria were (1) individual call rates > 0.9, (2) SNP call rates > 0.9, (3) minor allele frequencies > 0.01, (4) p > 10−6 for Hardy–Weinberg equilibrium test, (5) SNPs with no position information were removed. Finally, a total of 358 pigs with 50,739 SNPs were retained for subsequent analysis.
4.4. Genome-Wide Association Studies
The GWAS was performed using GEMMA V.0.98 through a linear mixed model (LMM) [41]. The model is specified as follows:
where y denotes a vector of phenotypic values; W refers to the incidence matrices of covariates (fixed effects), including sex; α is the vector of corresponding coefficients with the intercept; X represents the vector of SNP genotypes; β stands for the corresponding effect size of the SNP; u is the vector of random effects with u~MVNn (0, λ τ−1K); ε corresponds to the vector of random residuals with ε~MVNn (0, τ−1In); λ specifies the ratio between two variance components; τ−1 signifies the variance of the residual errors; K represents a genomic relatedness matrix between individuals was estimated via GEMMA; I refers to an n × n identity matrix, and n is the number of individuals; MVNn is the n-dimensional multivariate normal distribution. The genome-wide significant (0.05/N) and suggestive (1/N) thresholds by Bonferroni correction, in which N is the number of SNPs, were used in the analysis.
y = Wα + xβ + µ + ε
4.5. Linkage Disequilibrium Analysis
The linkage disequilibrium (LD) blocks were identified in the chromosomal regions containing the identified significantly associated SNPs using the software Haploview v4.2 [42]. The LD blocks were defined using Haploview based on default parameters according to the criteria.
4.6. Candidate Genes Identification
The positional information of the significant SNP was compared with Sus_scrofa.Sscrofa11.1.111.gtf. The gene with the closest distance to the SNP was used as a candidate gene. The position of the SNP with the candidate gene was confirmed by Ensembl database [43].
5. Conclusions
In conclusion, correlations between traits can serve as a guide for breeding efforts in DLB pigs. These correlations indicate which traits should be prioritized in the breeding process. In the case of DLB pigs, highly correlated traits can be strengthened concurrently in the breeding process to maximize the efficiency of genetic progress. By leveraging these correlations, the most advantageous and complementary cross combinations for DLB pigs can be identified. The GWAS results for the three traits BW, ADG, and BMI showed a range of genetic variants and candidate genes. For example, MACROD2, PHLPP2, CYP2E1, and STT3B are associated with obesity in the body, play a role in fat metabolism, and there is a close link between them and growth traits. The results of this study reveal the complexity of the genetic structure of growth traits in pigs.
Supplementary Materials
The following supporting information can be downloaded at: https://www.mdpi.com/article/10.3390/ijms26073453/s1.
Author Contributions
A.Z., M.H., T.H. and W.Z. conceived and designed the experiments; Z.H., J.D., X.T., H.L. and K.S. collected the samples and recorded the phenotypes; W.Z., M.H. and T.H. analyzed the data; W.Z. wrote the manuscript; W.Z. and M.H. revised the manuscript. All authors have read and agreed to the published version of the manuscript.
Funding
We would like to thank the Research and Development Fund of Zhejiang A&F University (2023LFR029), Zhejiang Provincial Natural Science Foundation of China (LQ24C170002), and Student Research Training Program of Zhejiang A&F University (2024kx0083).
Institutional Review Board Statement
Animal studies were reviewed and approved by the Animal Management and Use Committee of Zhejiang A&F University.
Informed Consent Statement
Not applicable.
Data Availability Statement
The data used in this study are available at a publicly available repository https://www.jianguoyun.com/p/DSwT31UQ_YGCDRjCpOgFIAA (accessed on 6 March 2025).
Acknowledgments
The authors thank all the editors and reviewers for their insightful comments and constructive suggestions, and express thanks to each of the authors for their hard work on the article.
Conflicts of Interest
The authors declare no conflicts of interest.
References
- Lebret, B.; Čandek-Potokar, M. Pork Quality Attributes from Farm to Fork. Part I. Carcass and Fresh Meat. Animal 2022, 16, 100402. [Google Scholar] [PubMed]
- Ramos, A.M.; Crooijmans, R.P.M.; Affara, N.A.; Amaral, A.J.; Archibald, A.L.; Beever, J.E.; Bendixen, C.; Churcher, C.; Clark, R.; Dehais, P. Design of a High Density Snp Genotyping Assay in the Pig Using Snps Identified and Characterized by Next Generation Sequencing Technology. PLoS ONE 2009, 8, e6524. [Google Scholar]
- Zhou, L.; Zhao, W.; Fu, Y.; Fang, X.; Ren, S.; Ren, J. Genome-Wide Detection of Genetic Loci and Candidate Genes for Teat Number and Body Conformation Traits at Birth in Chinese Sushan Pigs. Anim. Genet. 2019, 6, 753–756. [Google Scholar]
- Kapell, D.N.R.G.; Ashworth, C.J.; Knap, P.W.; Roehe, R. Genetic Parameters for Piglet Survival, Litter Size and Birth Weight or Its Variation within Litter in Sire and Dam Lines Using Bayesian Analysis. Livest. Sci. 2011, 135, 215–224. [Google Scholar]
- Fontanesi, L.; Schiavo, G.; Galimberti, G.; Calo, D.G.; Russo, V. A Genomewide Association Study for Average Daily Gain in Italian Large White Pigs. J. Anim. Sci. 2014, 4, 1385–1394. [Google Scholar]
- Johnson, Z.B.; Nugent, R.A., III. Heritability of Body Length and Measures of Body Density and Their Relationship to Backfat Thickness and Loin Muscle Area in Swine. J. Anim. Sci. 2003, 8, 1943–1949. [Google Scholar]
- Andersson, L.; Haley, C.S.; Ellegren, H.; Knott, S.A.; Johansson, M.; Andersson, K.; Andersson-Eklund, L.; Edfors-Lilja, I.; Fredholm, M.; Hansson, I. Genetic Mapping of Quantitative Trait Loci for Growth and Fatness in Pigs. Science 1994, 5154, 1771–1774. [Google Scholar]
- Yoo, C.K.; Park, H.B.; Lee, J.B.; Jung, E.J.; Kim, B.M.; Kim, H.I.; Ahn, S.J.; Ko, M.S.; Cho, I.C.; Lim, H.T. Qtl Analysis of Body Weight and Carcass Body Length Traits in an F2 Intercross between L Andrace and K Orean Native Pigs. Anim. Genet. 2014, 4, 589–592. [Google Scholar]
- Maurano, M.T.; Humbert, R.; Rynes, E.; Thurman, R.E.; Haugen, E.; Wang, H.; Reynolds, A.P.; Sandstrom, R.; Qu, H.; Brody, J. Systematic Localization of Common Disease-Associated Variation in Regulatory DNA. Science 2012, 6099, 1190–1195. [Google Scholar]
- Visscher, P.M.; Wray, N.R.; Zhang, Q.; Sklar, P.; McCarthy, M.I.; Brown, M.A.; Yang, J. 10 Years of Gwas Discovery: Biology, Function, and Translation. Am. J. Hum. Genet. 2017, 1, 5–22. [Google Scholar]
- Yang, M.; Lu, K.; Zhao, F.-J.; Xie, W.; Ramakrishna, P.; Wang, G.; Du, Q.; Liang, L.; Sun, C.; Zhao, H. Genome-Wide Association Studies Reveal the Genetic Basis of Ionomic Variation in Rice. Plant Cell 2018, 11, 2720–2740. [Google Scholar]
- Goddard, M.E.; Hayes, B.J. Mapping Genes for Complex Traits in Domestic Animals and Their Use in Breeding Programmes. Nat. Rev. Genet. 2009, 6, 381–391. [Google Scholar] [CrossRef] [PubMed]
- Sahana, G.; Guldbrandtsen, B.; Janss, L.; Lund, M.S. Comparison of Association Mapping Methods in a Complex Pedigreed Population. Genet. Epidemiol. 2010, 5, 455–462. [Google Scholar] [CrossRef] [PubMed]
- Zhang, H.; Zhuang, Z.; Yang, M.; Ding, R.; Quan, J.; Zhou, S.; Gu, T.; Xu, Z.; Zheng, E.; Cai, G. Genome-Wide Detection of Genetic Loci and Candidate Genes for Body Conformation Traits in Duroc× Landrace× Yorkshire Crossbred Pigs. Front. Genet. 2021, 12, 664343. [Google Scholar]
- Ji, J.; Ji, J.; Yan, G.; Yan, G.; Chen, D.; Chen, D.; Xiao, S.; Xiao, S.; Gao, J.; Gao, J.; et al. An Association Study Using Imputed Whole-Genome Sequence Data Identifies Novel Significant Loci for Growth-Related Traits in a Duroc× Erhualian F2 Population. J. Anim. Breed. Genet. 2019, 136, 217–228. [Google Scholar] [CrossRef] [PubMed]
- Schinckel, A.P.; Einstein, M.E.; Jungst, S.; Booher, C.; Newman, S. Evaluation of Different Mixed Model Nonlinear Functions to Describe the Body Weight Growth of Pigs of Different Sire and Dam Lines. Prof. Anim. Sci. 2009, 3, 307–324. [Google Scholar]
- Yang, Q.; Wu, P.; Wang, K.; Chen, D.; Zhou, J.; Ma, J.; Li, M.; Xiao, W.; Jiang, A.; Jiang, Y.; et al. Snps Associated with Body Weight and Backfat Thickness in Two Pig Breeds Identified by a Genome-Wide Association Study. Genomics 2019, 6, 1583–1589. [Google Scholar]
- Wang, H.; Wang, X.; Li, M.; Sun, H.; Chen, Q.; Yan, D.; Dong, X.; Pan, Y.; Lu, S. Genome-Wide Association Study of Growth Traits in a Four-Way Crossbred Pig Population. Genes 2022, 13, 1990. [Google Scholar] [CrossRef]
- Ruan, D.; Zhuang, Z.; Ding, R.; Qiu, Y.; Zhou, S.; Wu, J.; Xu, C.; Hong, L.; Huang, S.; Zheng, E. Weighted Single-Step Gwas Identified Candidate Genes Associated with Growth Traits in a Duroc Pig Population. Genes 2021, 12, 117. [Google Scholar] [CrossRef]
- Zhou, S.; Ding, R.; Meng, F.; Wang, X.; Zhuang, Z.; Quan, J.; Geng, Q.; Wu, J.; Zheng, E.; Wu, Z. A Meta-Analysis of Genome-Wide Association Studies for Average Daily Gain and Lean Meat Percentage in Two Duroc Pig Populations. BMC Genom. 2021, 22, 12. [Google Scholar] [CrossRef]
- Deng, Z.; Huang, T.; Yan, G.; Yang, B.; Zhang, Z.; Xiao, S.; Ai, H.; Huang, L. A Further Look at Quantitative Trait Loci for Growth and Fatness Traits in a White Duroc× Erhualian F3 Intercross Population. Anim. Biotechnol. 2022, 6, 1205–1216. [Google Scholar] [CrossRef] [PubMed]
- Blaj, I.; Tetens, J.; Preuß, S.; Bennewitz, J.; Thaller, G. Genome-Wide Association Studies and Meta-Analysis Uncovers New Candidate Genes for Growth and Carcass Traits in Pigs. PLoS ONE 2018, 10, e0205576. [Google Scholar]
- Park, J. Genome-Wide Association Study to Reveal New Candidate Genes Using Single-Step Approaches for Productive Traits of Yorkshire Pig in Korea. Anim. Biosci. 2024, 3, 451. [Google Scholar]
- Keys, A.; Fidanza, F.; Karvonen, M.J.; Kimura, N.; Taylor, H.L. Indices of Relative Weight and Obesity. Int. J. Epidemiol. 2014, 3, 655–665. [Google Scholar]
- Zhou, L.; Ji, J.; Peng, S.; Zhang, Z.; Fang, S.; Li, L.; Zhu, Y.; Huang, L.; Chen, C.; Ma, J. A Gwa Study Reveals Genetic Loci for Body Conformation Traits in Chinese Laiwu Pigs and Its Implications for Human Bmi. Mamm. Genome 2016, 27, 610–621. [Google Scholar]
- Gong, H.; Xiao, S.; Li, W.; Huang, T.; Huang, X.; Yan, G.; Huang, Y.; Qiu, H.; Jiang, K.; Wang, X. Unravelling the Genetic Loci for Growth and Carcass Traits in Chinese Bamaxiang Pigs Based on a 1.4 Million Snp Array. J. Anim. Breed. Genet. 2019, 1, 3–14. [Google Scholar]
- Locke, A.E.; Kahali, B.; Berndt, S.I.; Justice, A.E.; Pers, T.H.; Day, F.R.; Powell, C.; Vedantam, S.; Buchkovich, M.L.; Yang, J. Genetic Studies of Body Mass Index Yield New Insights for Obesity Biology. Nature 2015, 7538, 197–206. [Google Scholar]
- Kogelman, L.J.A.; Kadarmideen, H.N.; Mark, T.; Karlskov-Mortensen, P.; Bruun, C.S.; Cirera, S.; Jacobsen, M.J.; Jørgensen, C.B.; Fredholm, M. An F2 Pig Resource Population as a Model for Genetic Studies of Obesity and Obesity-Related Diseases in Humans: Design and Genetic Parameters. Front. Genet. 2013, 4, 29. [Google Scholar]
- Vahedi, S.M.; Ardestani, S.S.; Karimi, K.; Banabazi, M.H. Weighted Single-Step Gwas for Body Mass Index and Scans for Recent Signatures of Selection in Yorkshire Pigs. J. Hered. 2022, 3, 325–335. [Google Scholar]
- Kim, H.-R.; Jin, H.-S.; Eom, Y.-B. Association of Macrod2 Gene Variants with Obesity and Physical Activity in a Korean Population. Mol. Genet. Genom. Med. 2021, 4, e1635. [Google Scholar]
- Fan, H.; Wang, X.; Li, W.; Shen, M.; Wei, Y.; Zheng, H.; Kang, Y. Asb13 Inhibits Breast Cancer Metastasis through Promoting Snai2 Degradation and Relieving Its Transcriptional Repression of Yap. Genes Dev. 2020, 34, 1359–1372. [Google Scholar] [CrossRef] [PubMed]
- Yang, J.; Ouyang, X.; Yang, M.; Xie, G.; Cao, Q. Identification of Key Programmed Cell Death-Related Genes and Immune Infiltration in Extracorporeal Membrane Oxygenation Treatment for Acute Myocardial Infarction Based on Bioinformatics Analysis. Front. Cardiovasc. Med. 2022, 9, 1018662. [Google Scholar] [CrossRef]
- Huang, J.; Li, S.; Wang, Q.; Guan, X.; Qian, L.; Li, J.; Zheng, Y.; Lin, B. Pediococcus Pentosaceus B49 from Human Colostrum Ameliorates Constipation in Mice. Food Funct. 2020, 6, 5607–5620. [Google Scholar] [CrossRef]
- Rodrigues, D.; van Kampen, R.; van Bodegraven, A.A.; Kleinjans, J.C.S.; Jennen, D.G.J.; de Kok, T.M. Gene Expression Responses Reflecting 5-Fu-Induced Toxicity: Comparison between Patient Colon Tissue and 3d Human Colon Organoids. Toxicol. Lett. 2022, 371, 17–24. [Google Scholar] [CrossRef] [PubMed]
- Kim, K.; Kang, J.K.; Jung, Y.H.; Lee, S.B.; Rametta, R.; Dongiovanni, P.; Valenti, L.; Pajvani, U.B. Adipocyte Phlpp2 Inhibition Prevents Obesity-Induced Fatty Liver. Nat. Commun. 2021, 1, 1822. [Google Scholar] [CrossRef]
- Lyu, W.; Xiang, Y.; Wang, X.; Li, J.; Yang, C.; Yang, H.; Xiao, Y. Differentially Expressed Hepatic Genes Revealed by Transcriptomics in Pigs with Different Liver Lipid Contents. Oxidative Med. Cell. Longev. 2022, 2022, 2315575. [Google Scholar] [CrossRef] [PubMed]
- Liu, Z.; Tan, X.; Jin, Q.; Zhan, W.; Liu, G.; Cui, X.; Wang, J.; Meng, X.; Zhu, R.; Wang, K. Multiomics Analyses of Jining Grey Goat and Boer Goat Reveal Genomic Regions Associated with Fatty Acid and Amino Acid Metabolism and Muscle Development. Anim. Biosci. 2023, 37, 982. [Google Scholar]
- Wang, L.; Wang, D.; Yang, L.; Zeng, X.; Zhang, Q.; Liu, G.; Pan, Y. Cuproptosis Related Genes Associated with Jab1 Shapes Tumor Microenvironment and Pharmacological Profile in Nasopharyngeal Carcinoma. Front. Immunol. 2022, 13, 989286. [Google Scholar]
- Lee, S.H.; Yang, J.; Goddard, M.E.; Visscher, P.M.; Wray, N.R. Estimation of Pleiotropy between Complex Diseases Using Snp-Derived Genomic Relationships and Restricted Maximum Likelihood. Bioinformatics 2012, 19, 2540–2542. [Google Scholar] [CrossRef]
- Chang, C.C.; Chow, C.C.; Tellier, L.C.A.; Vattikuti, S.; Purcell, S.M.; Lee, J.J. Second-Generation Plink: Rising to the Challenge of Larger and Richer Datasets. Gigascience 2015, 1, s13742–s14015. [Google Scholar] [CrossRef]
- Zhou, X.; Stephens, M. Genome-Wide Efficient Mixed-Model Analysis for Association Studies. Nat. Genet. 2012, 7, 821–824. [Google Scholar]
- Barrett, J.C.; Fry, B.; Maller, J.D.J.; Daly, M.J. Haploview: Analysis and Visualization of Ld and Haplotype Maps. Bioinformatics 2005, 2, 263–265. [Google Scholar]
- Martin, F.J.; Amode, M.R.; Aneja, A.; Austine-Orimoloye, O.; Azov, A.G.; Barnes, I.; Becker, A.; Bennett, R.; Berry, A.; Bhai, J. Ensembl 2023. Nucleic Acids Res. 2023, 51, D933–D941. [Google Scholar] [PubMed]
Disclaimer/Publisher’s Note: The statements, opinions and data contained in all publications are solely those of the individual author(s) and contributor(s) and not of MDPI and/or the editor(s). MDPI and/or the editor(s) disclaim responsibility for any injury to people or property resulting from any ideas, methods, instructions or products referred to in the content. |
© 2025 by the authors. Licensee MDPI, Basel, Switzerland. This article is an open access article distributed under the terms and conditions of the Creative Commons Attribution (CC BY) license (https://creativecommons.org/licenses/by/4.0/).