

Network Pharmacology and Molecular Dynamics Identified Potential Androgen Receptor-Targeted Metabolites in Crocus alatavicus


Abstract
1. Introduction
2. Result
2.1. Active Substance Screening and Target Prediction
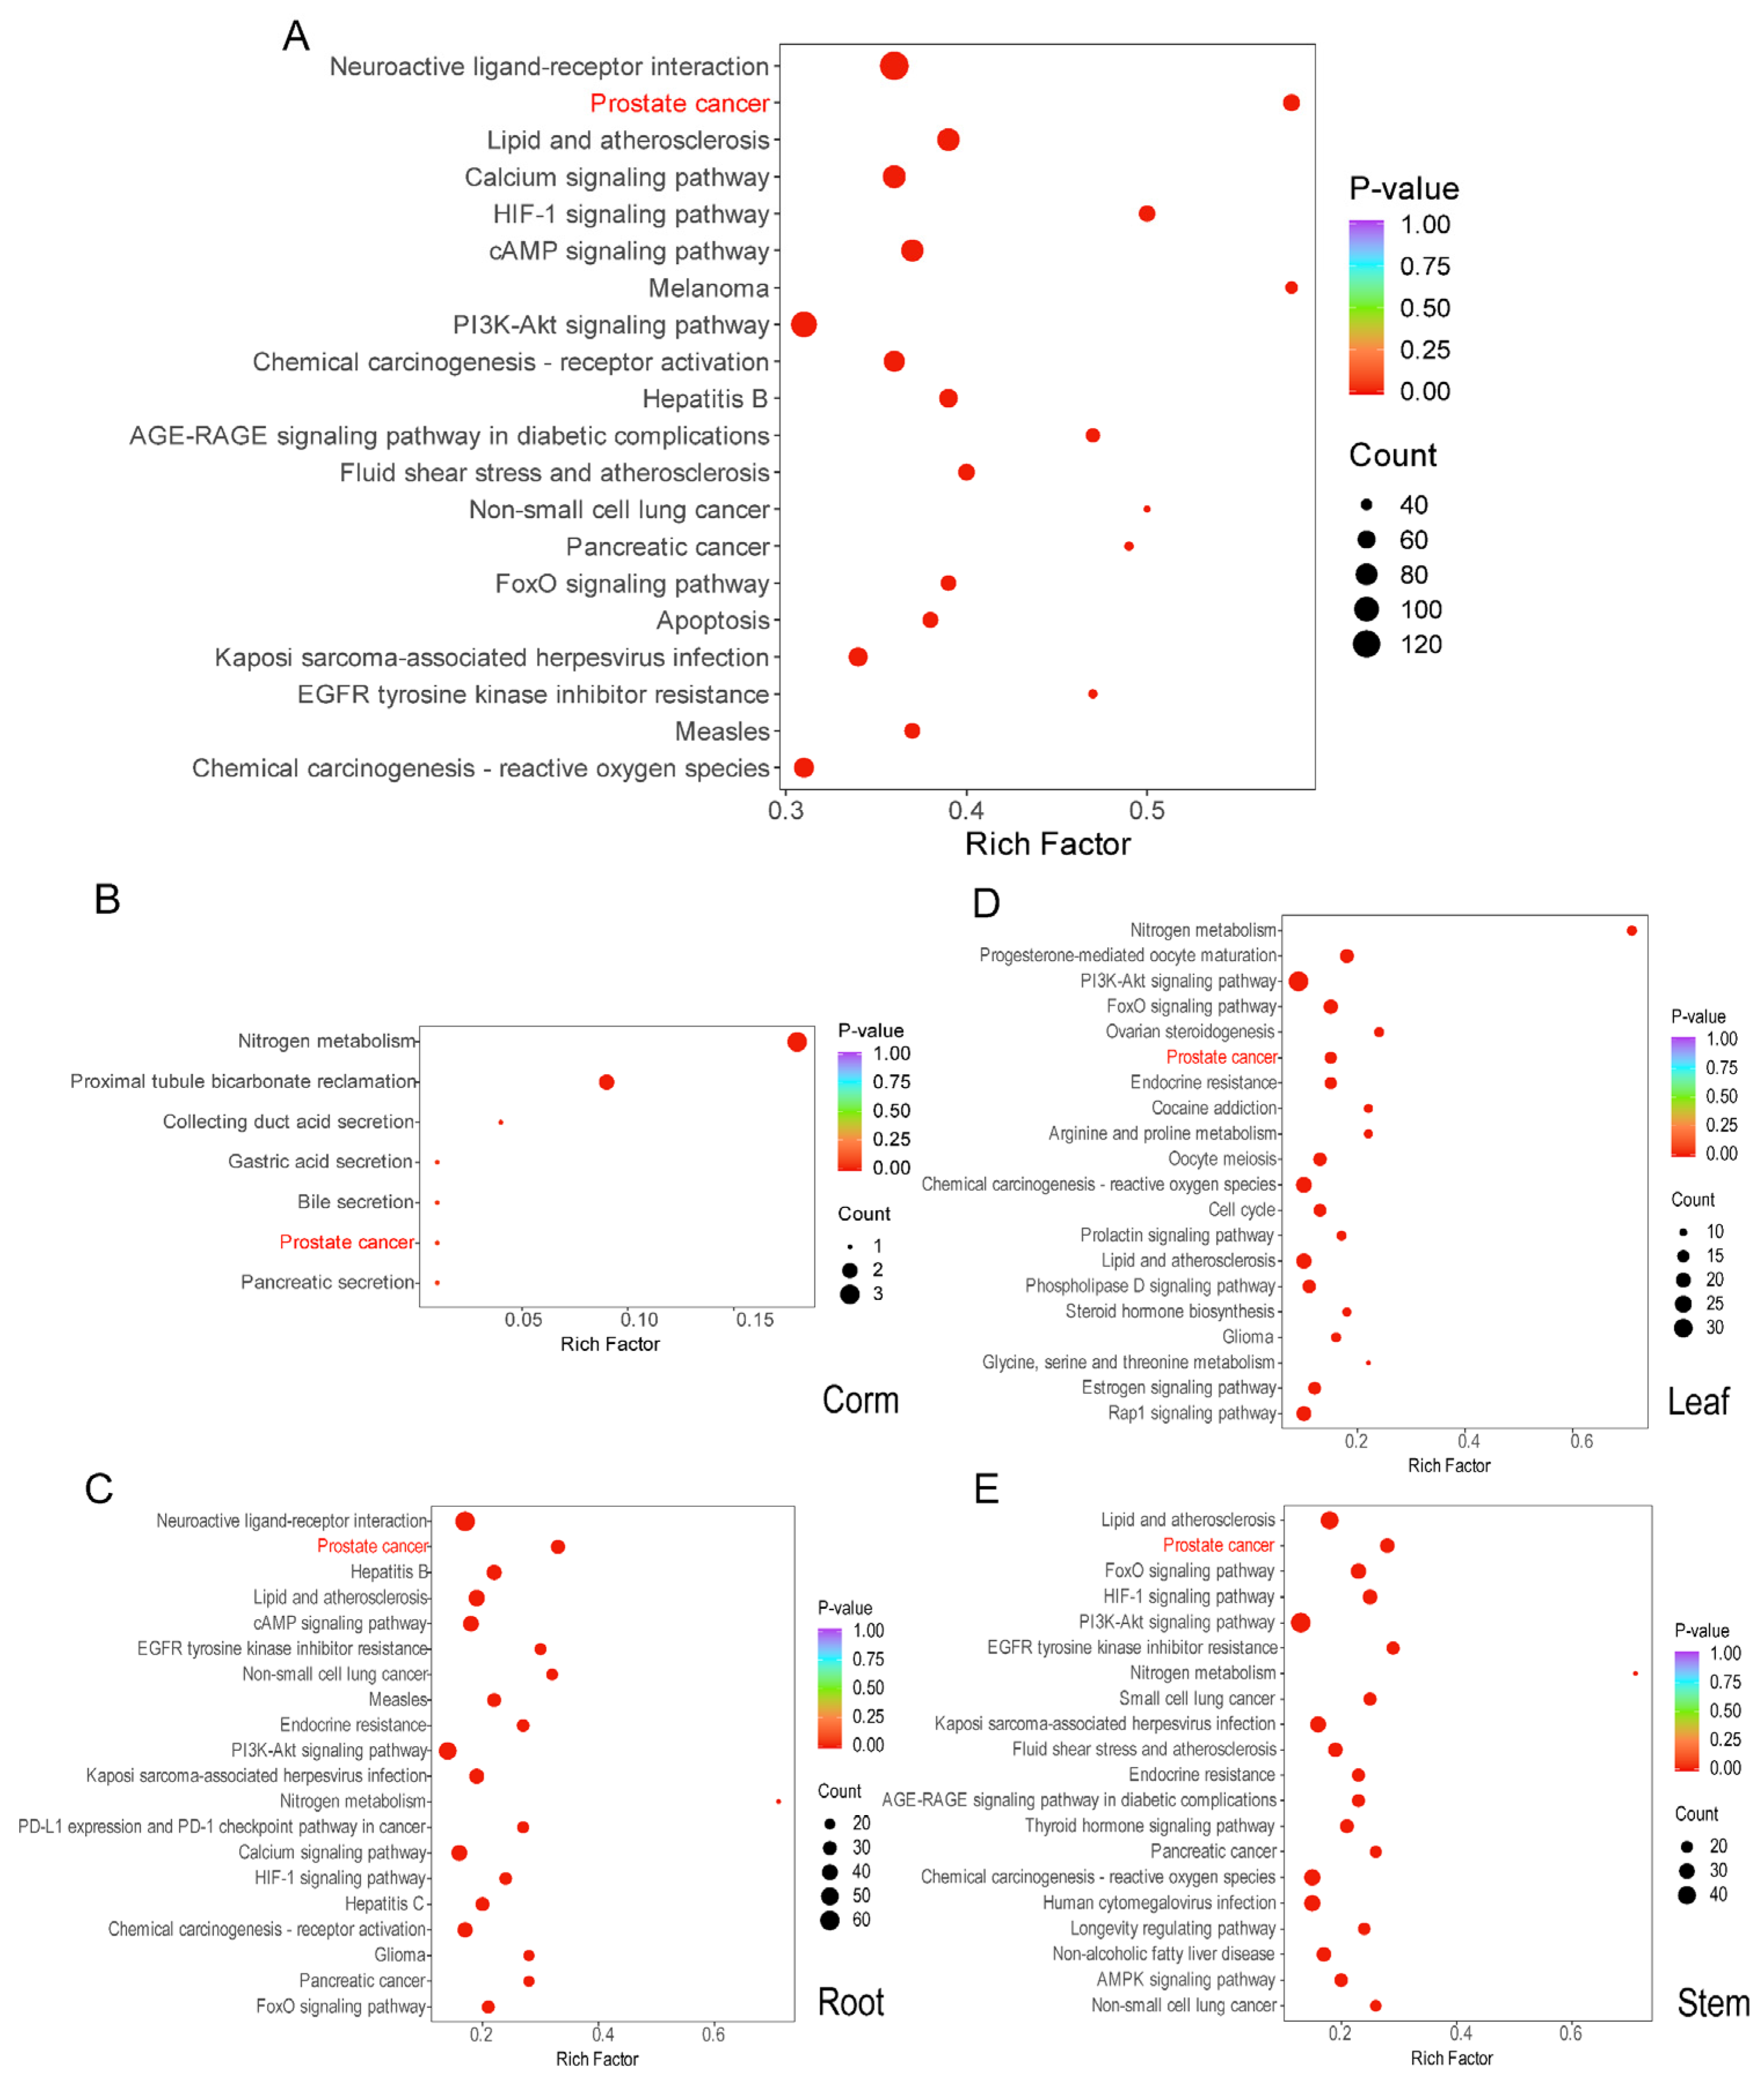
2.2. The KEGG Enrichment Pathway of the Active Components of Crocus alatavicus
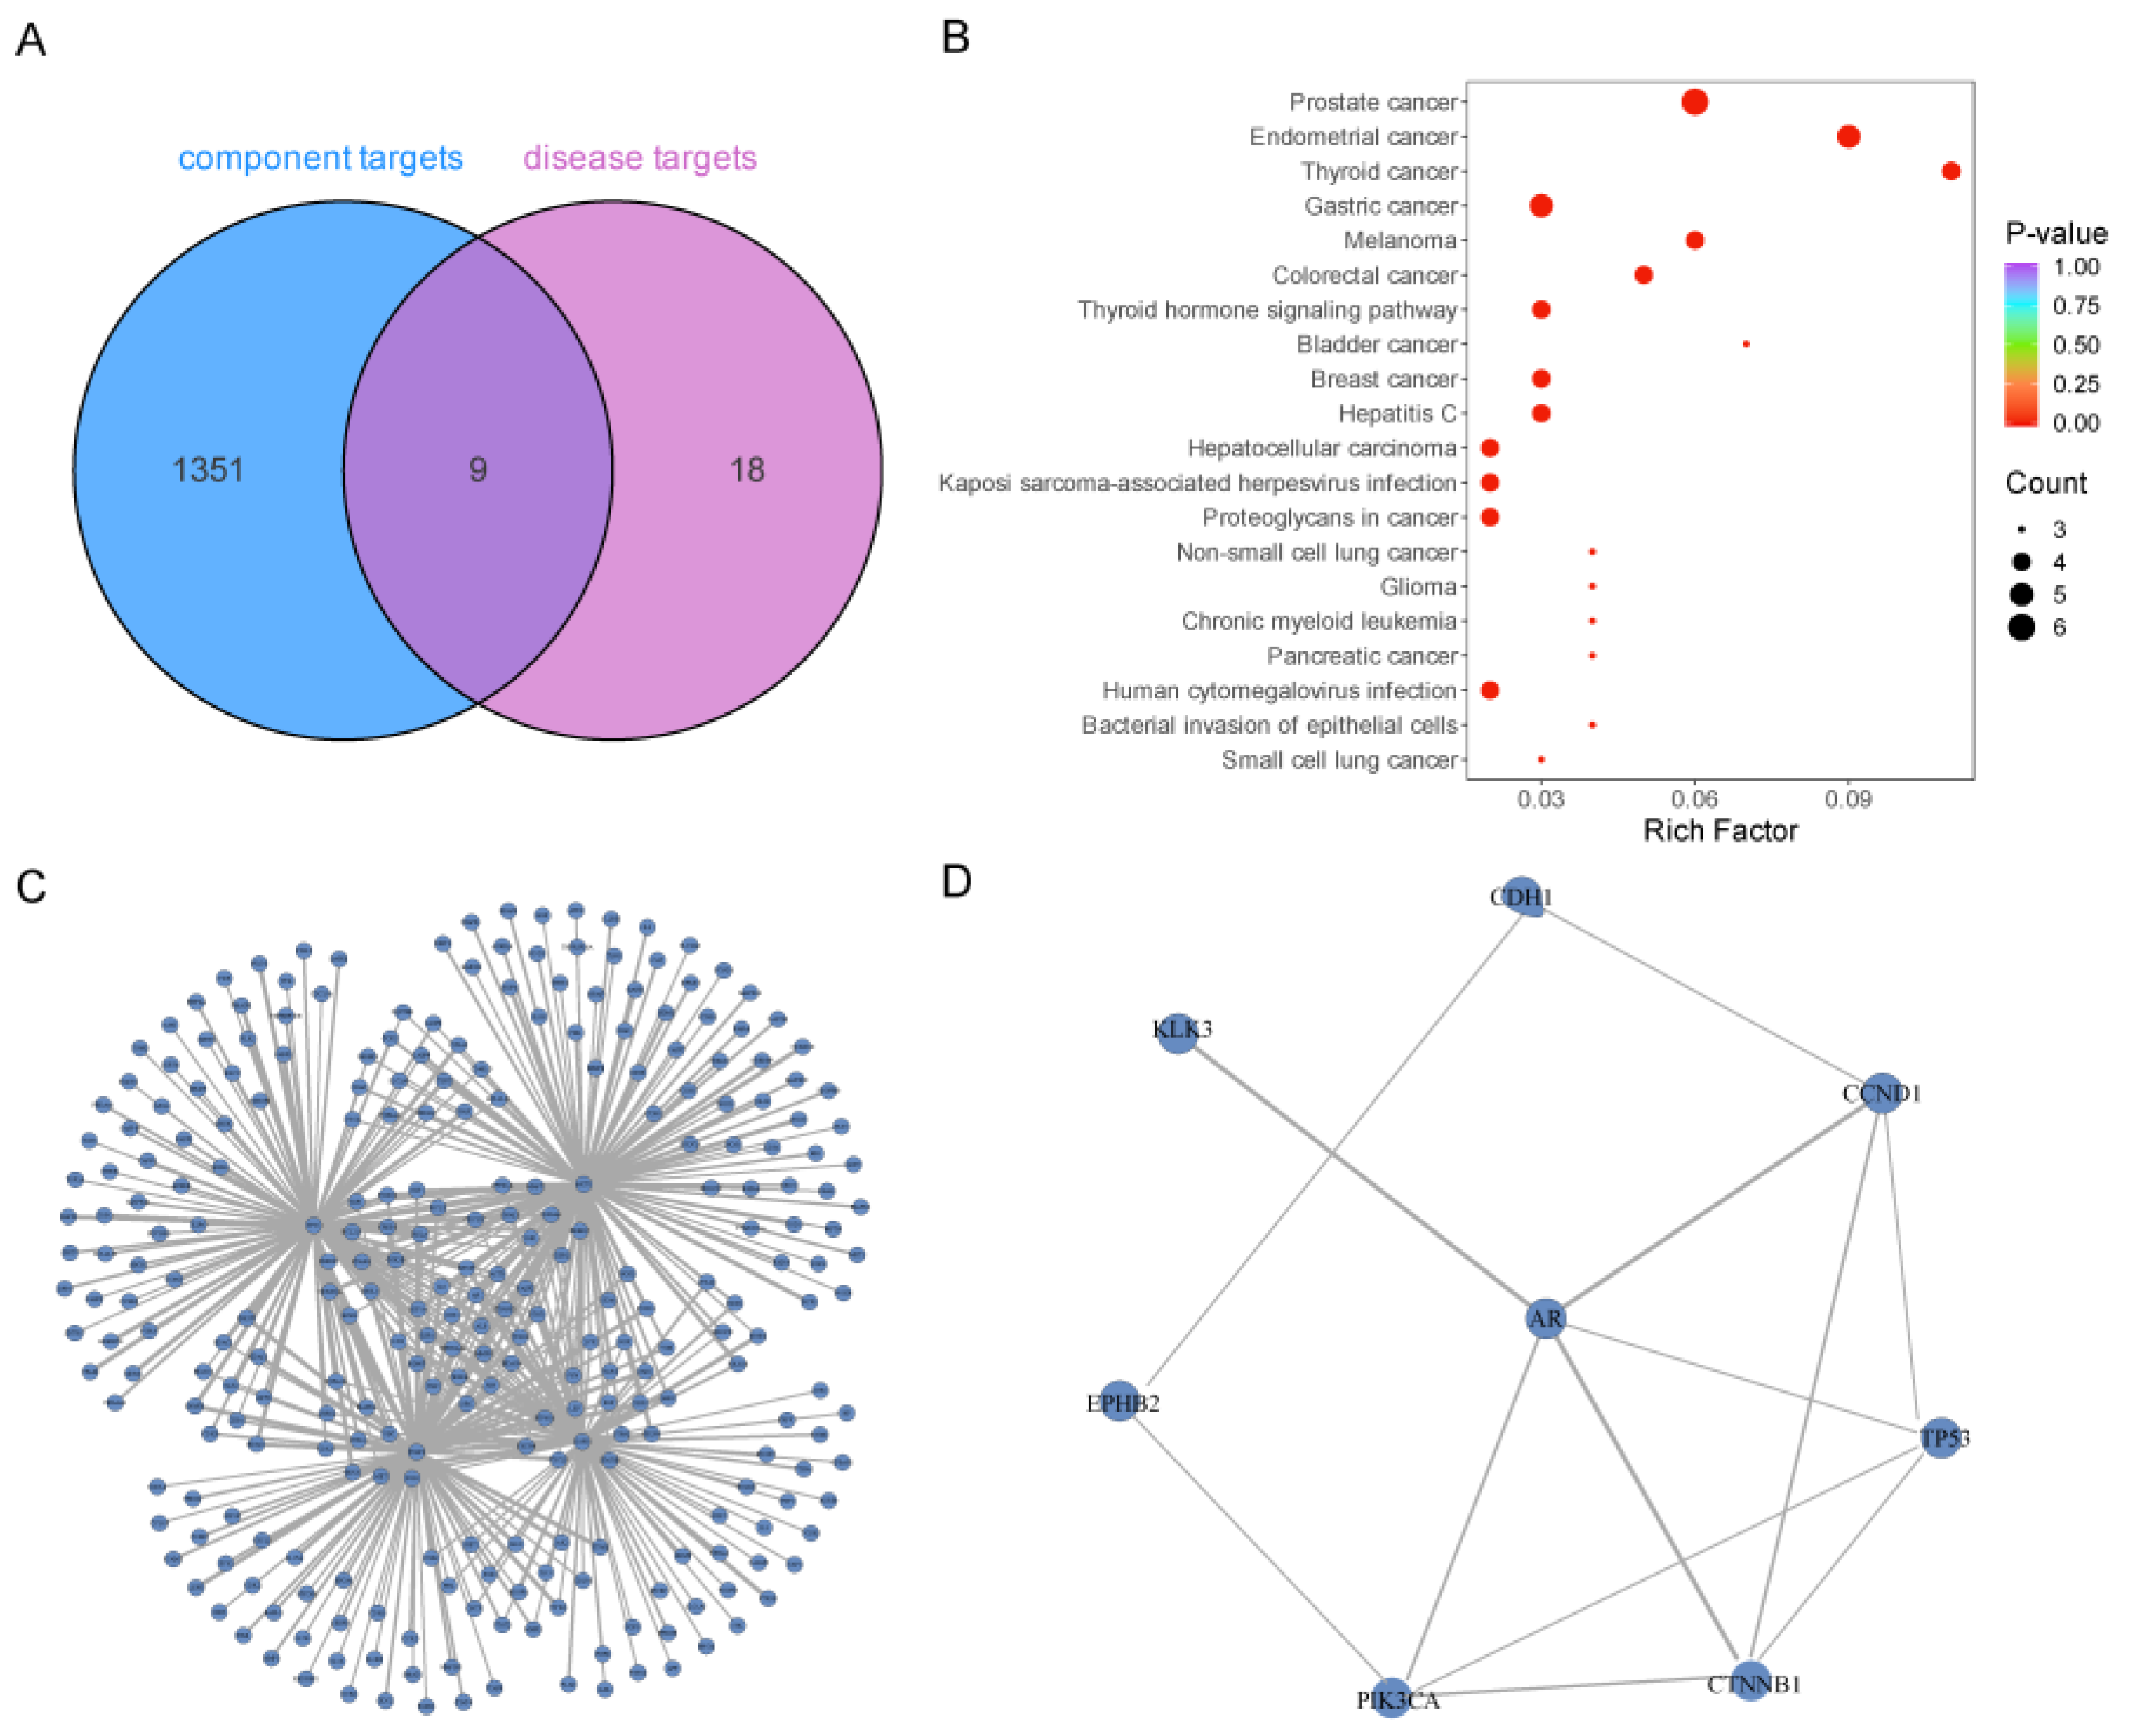
2.3. Disease Target Prediction and Intersection Analysis
2.4. Protein–Protein Interaction (PPI) Analysis
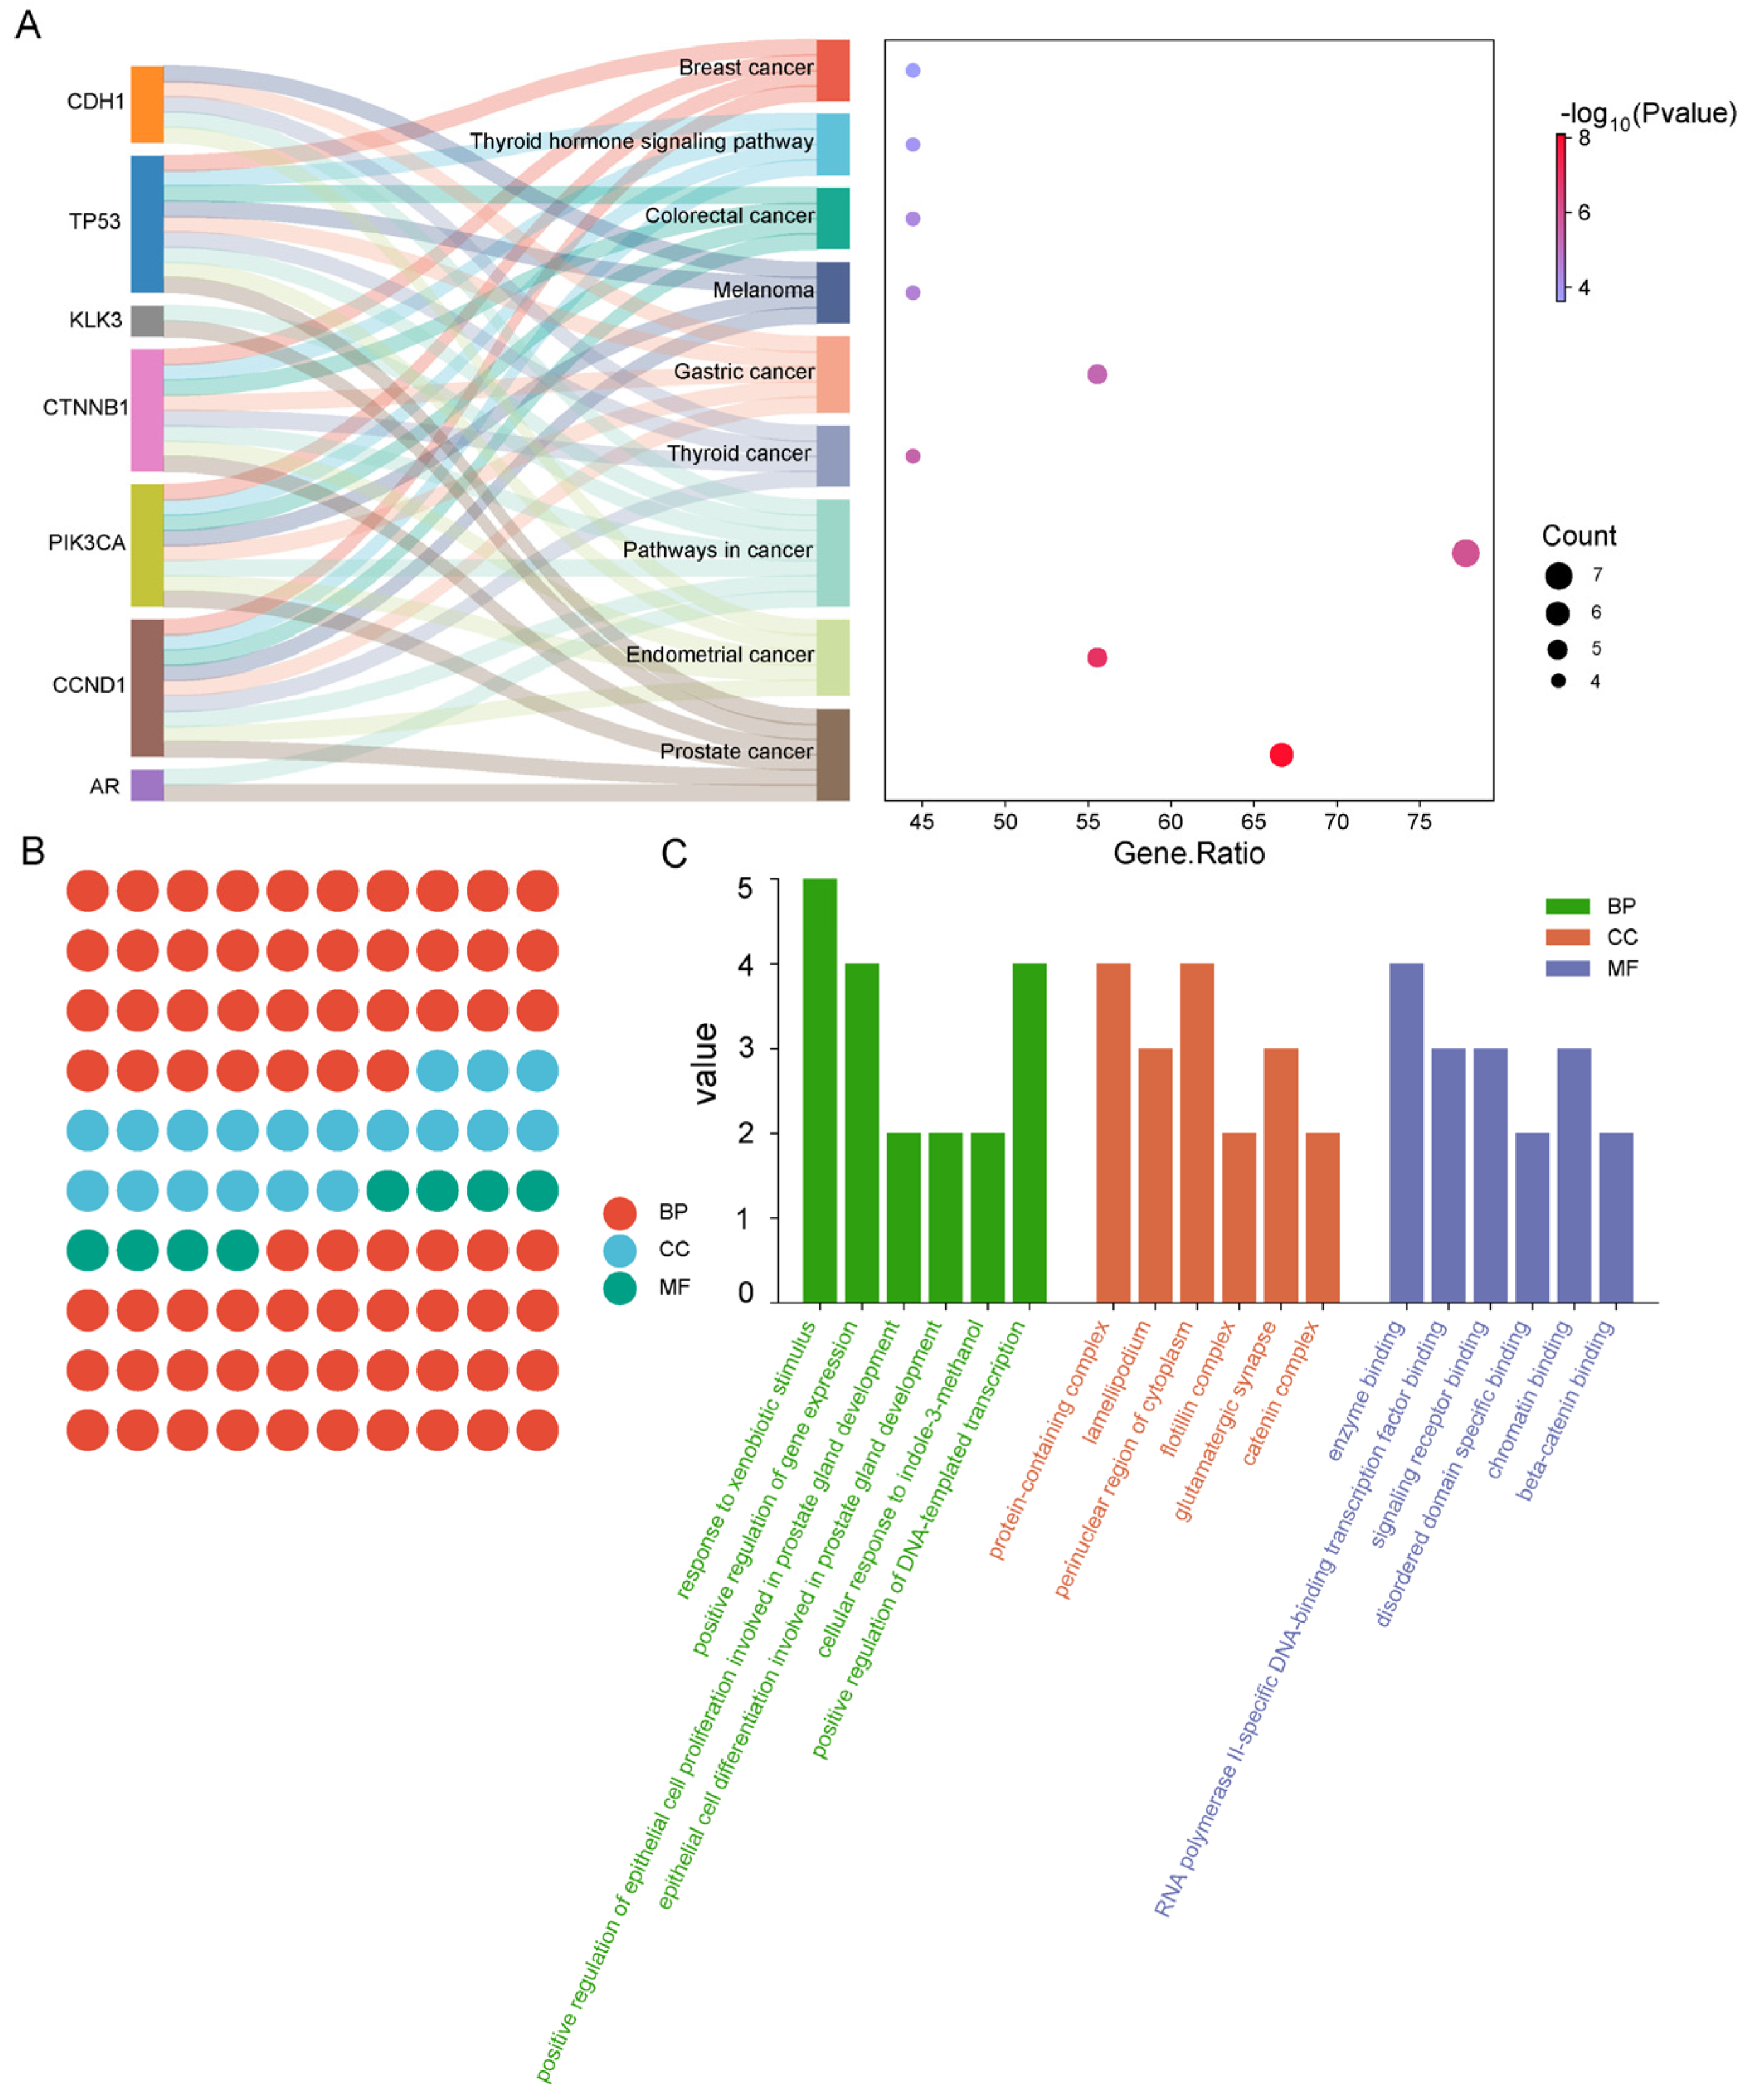
2.5. Construction of Network Diagram
2.6. GO Functional Classification Annotation Analysis
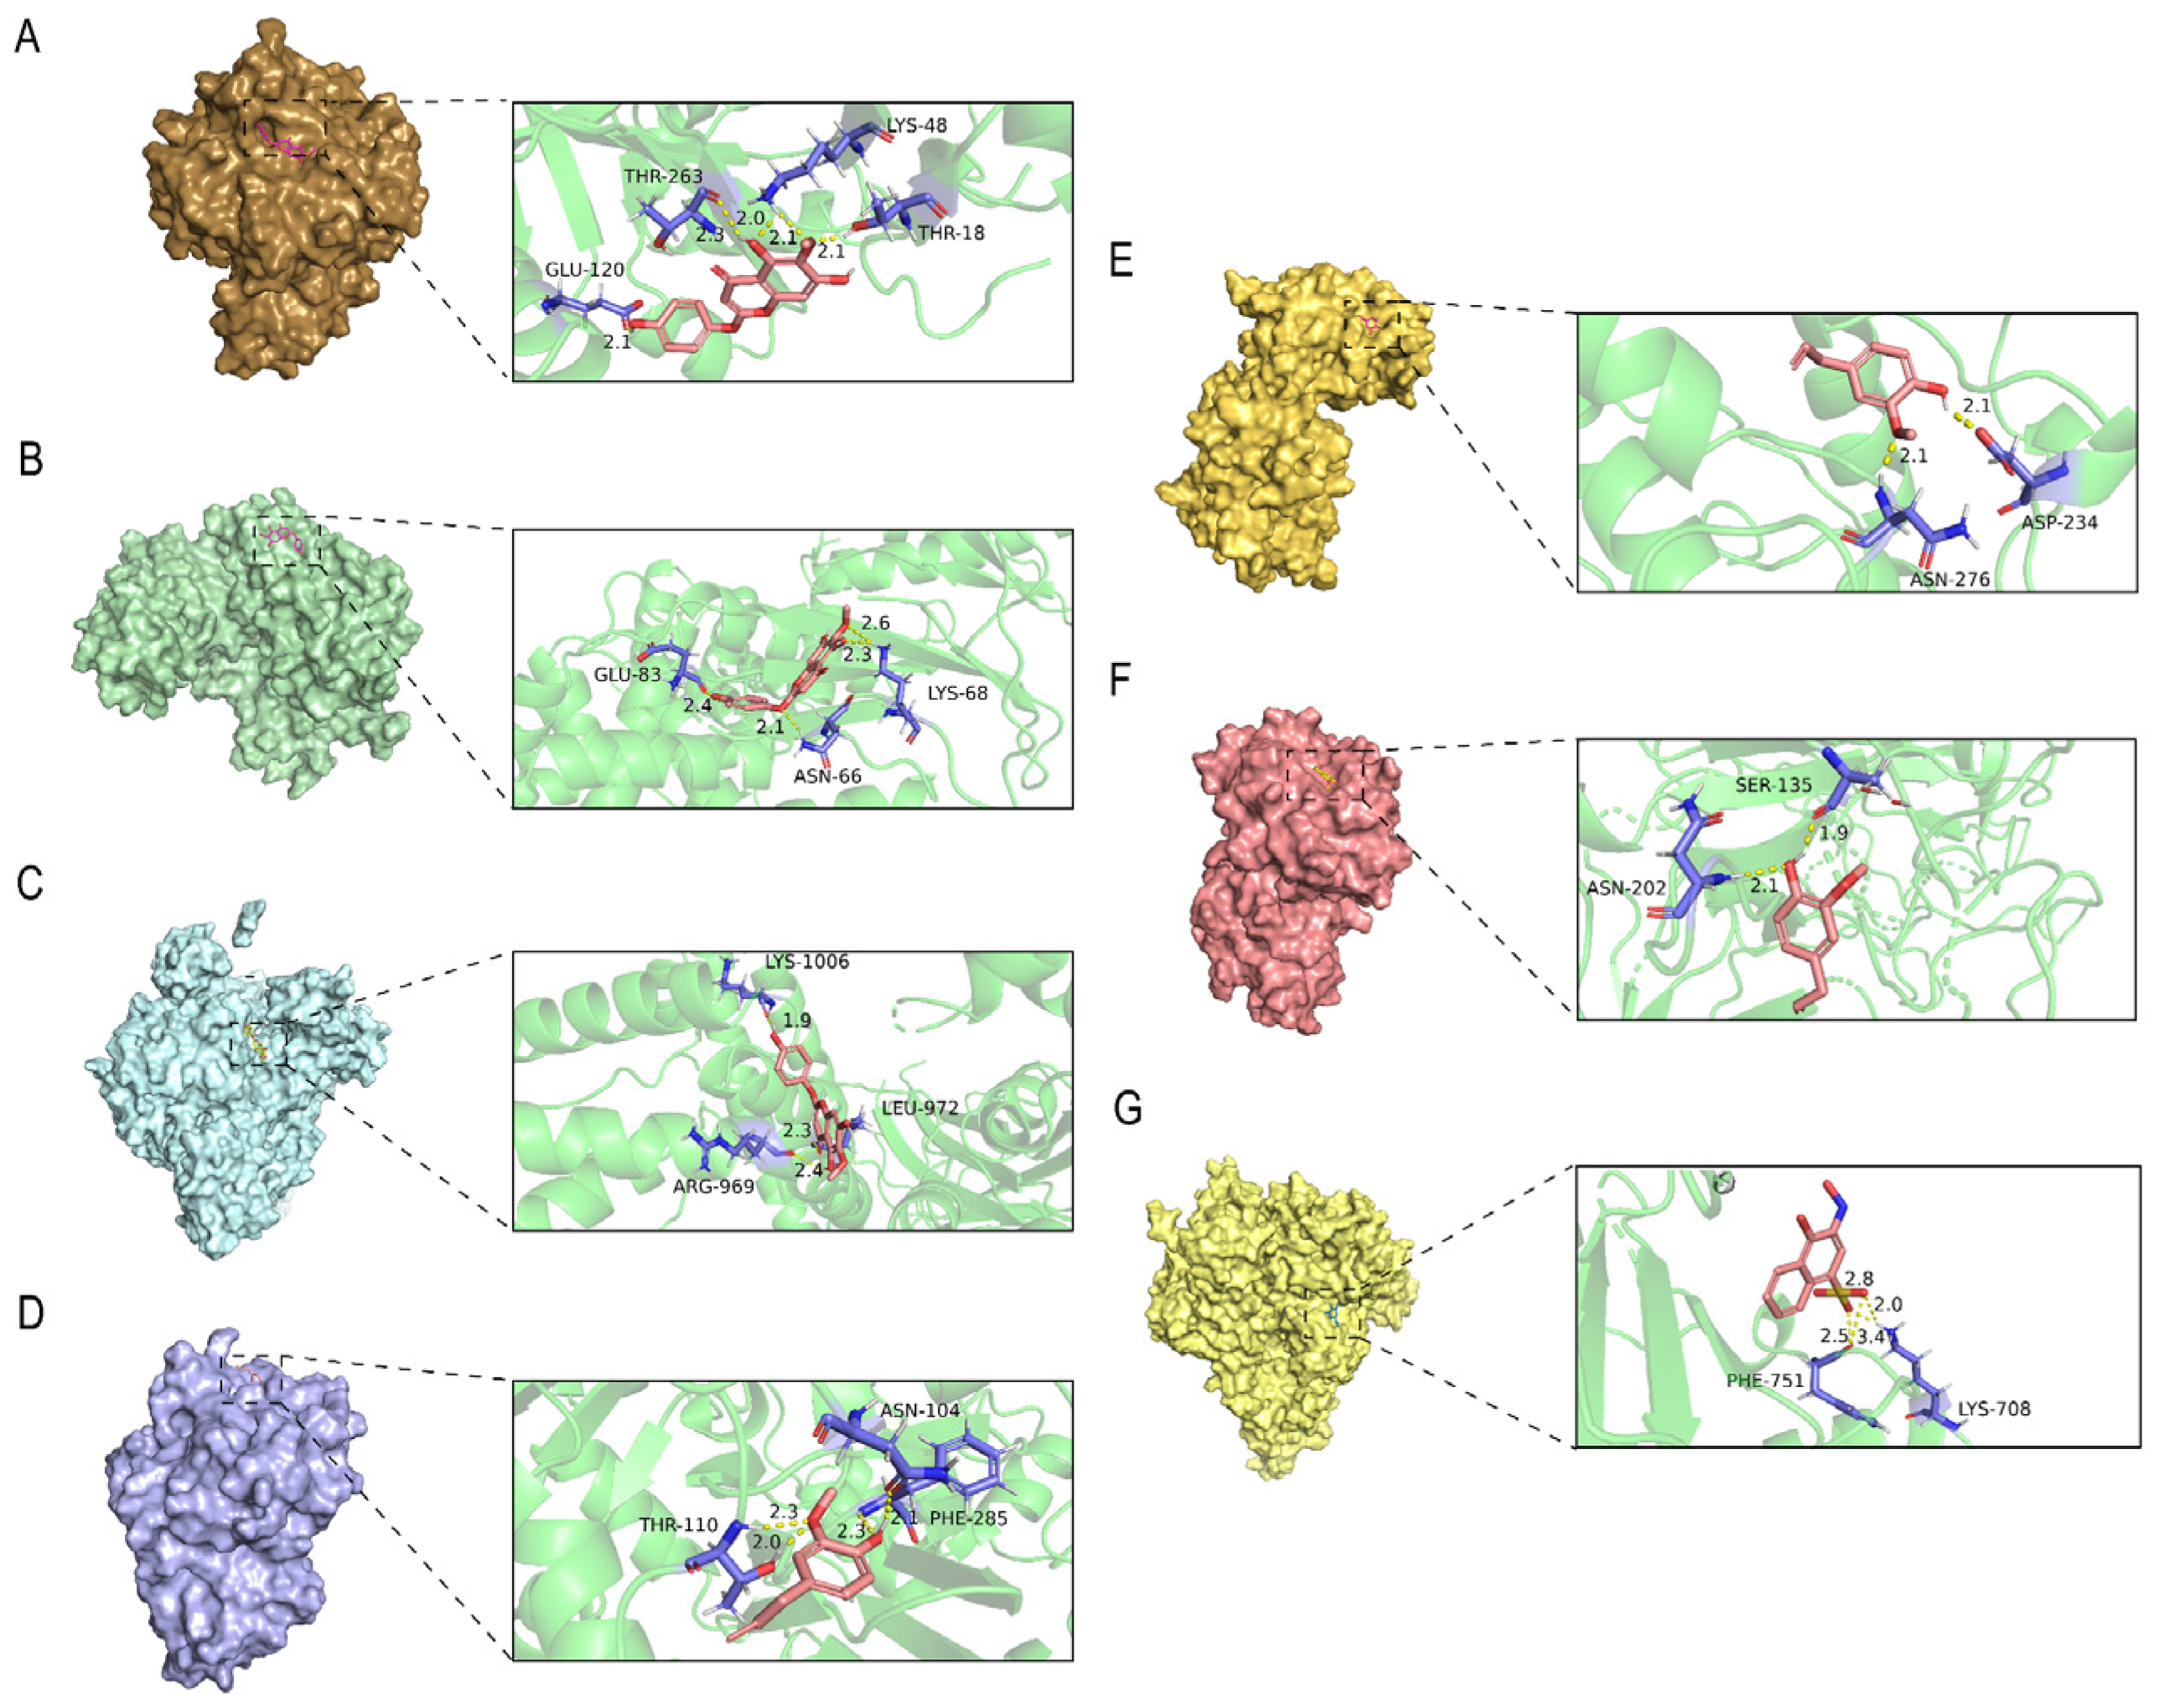
2.7. Molecular Docking
2.8. Molecular Dynamics Simulation
2.8.1. Stability Analysis
Root Mean Square Deviation (RMSD) Analysis
Radius of Gyration (Rg) Analysis
Analysis of the Evolution of the Center of Mass
Analysis of Buried Solvent Accessible Surface Area (Buried SASA)
Binding Conformation Superposition
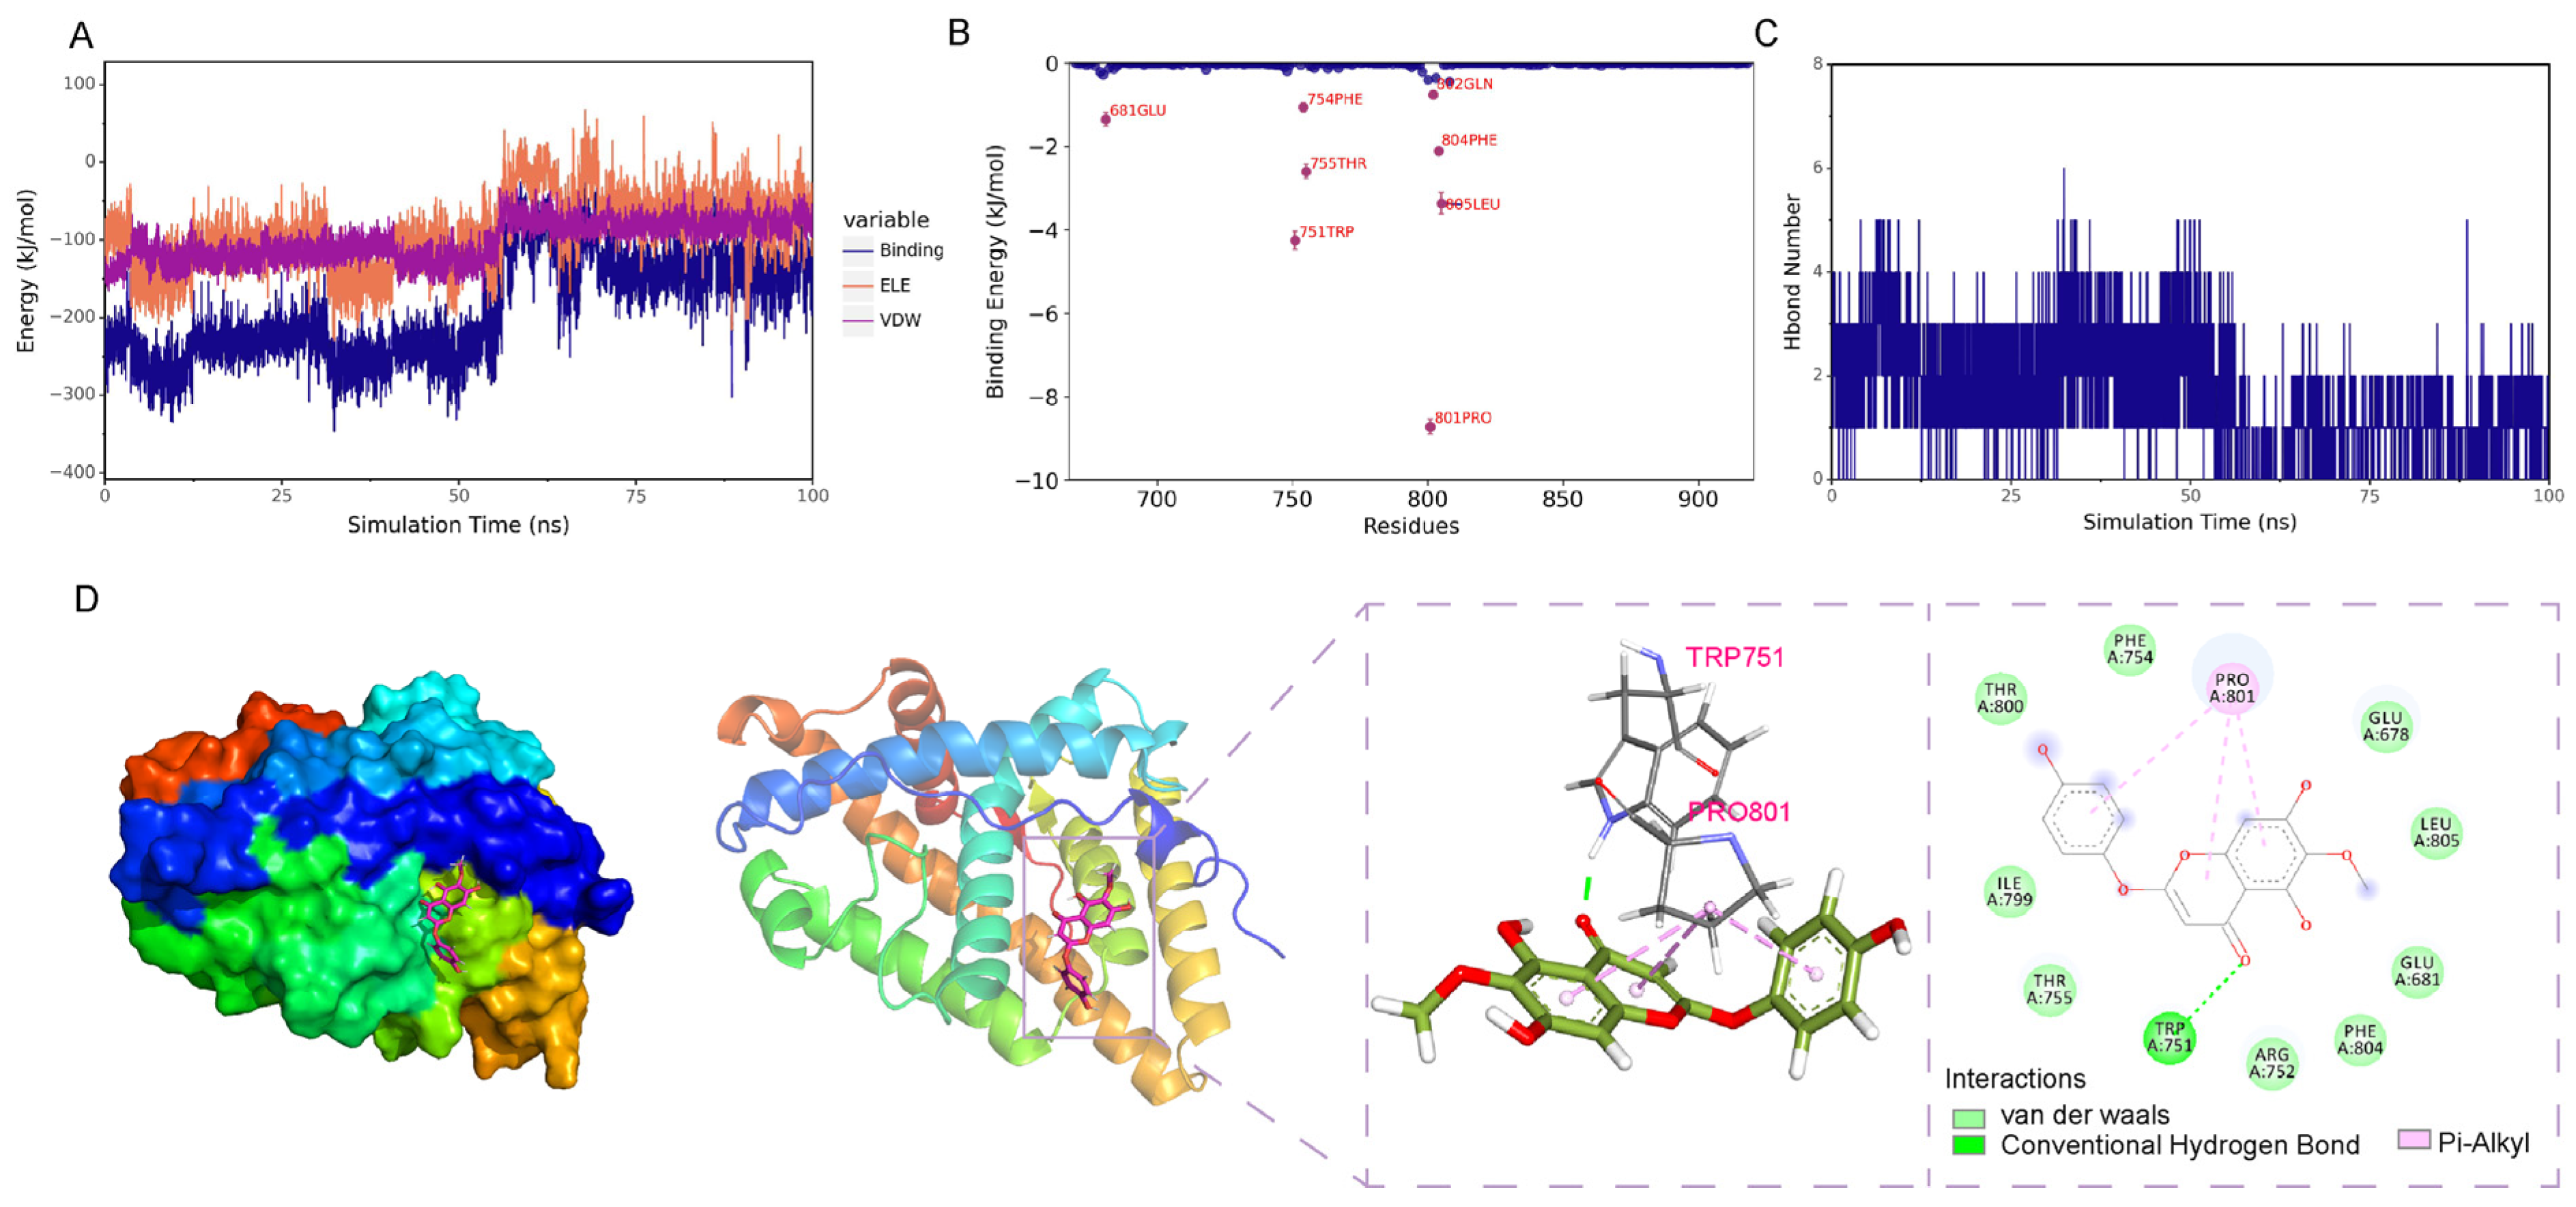
2.8.2. Analysis of the Hydrogen Bond Interaction Between the Small Molecule and the Protein
Evolution of the Number of Hydrogen Bonds
2.8.3. Analysis of the Interaction Between the Small Molecule and the Protein upon Binding
Analysis of Electrostatic and Van Der Waals Interactions
Binding Energy Analysis
Residue Contribution Analysis
Structural Analysis
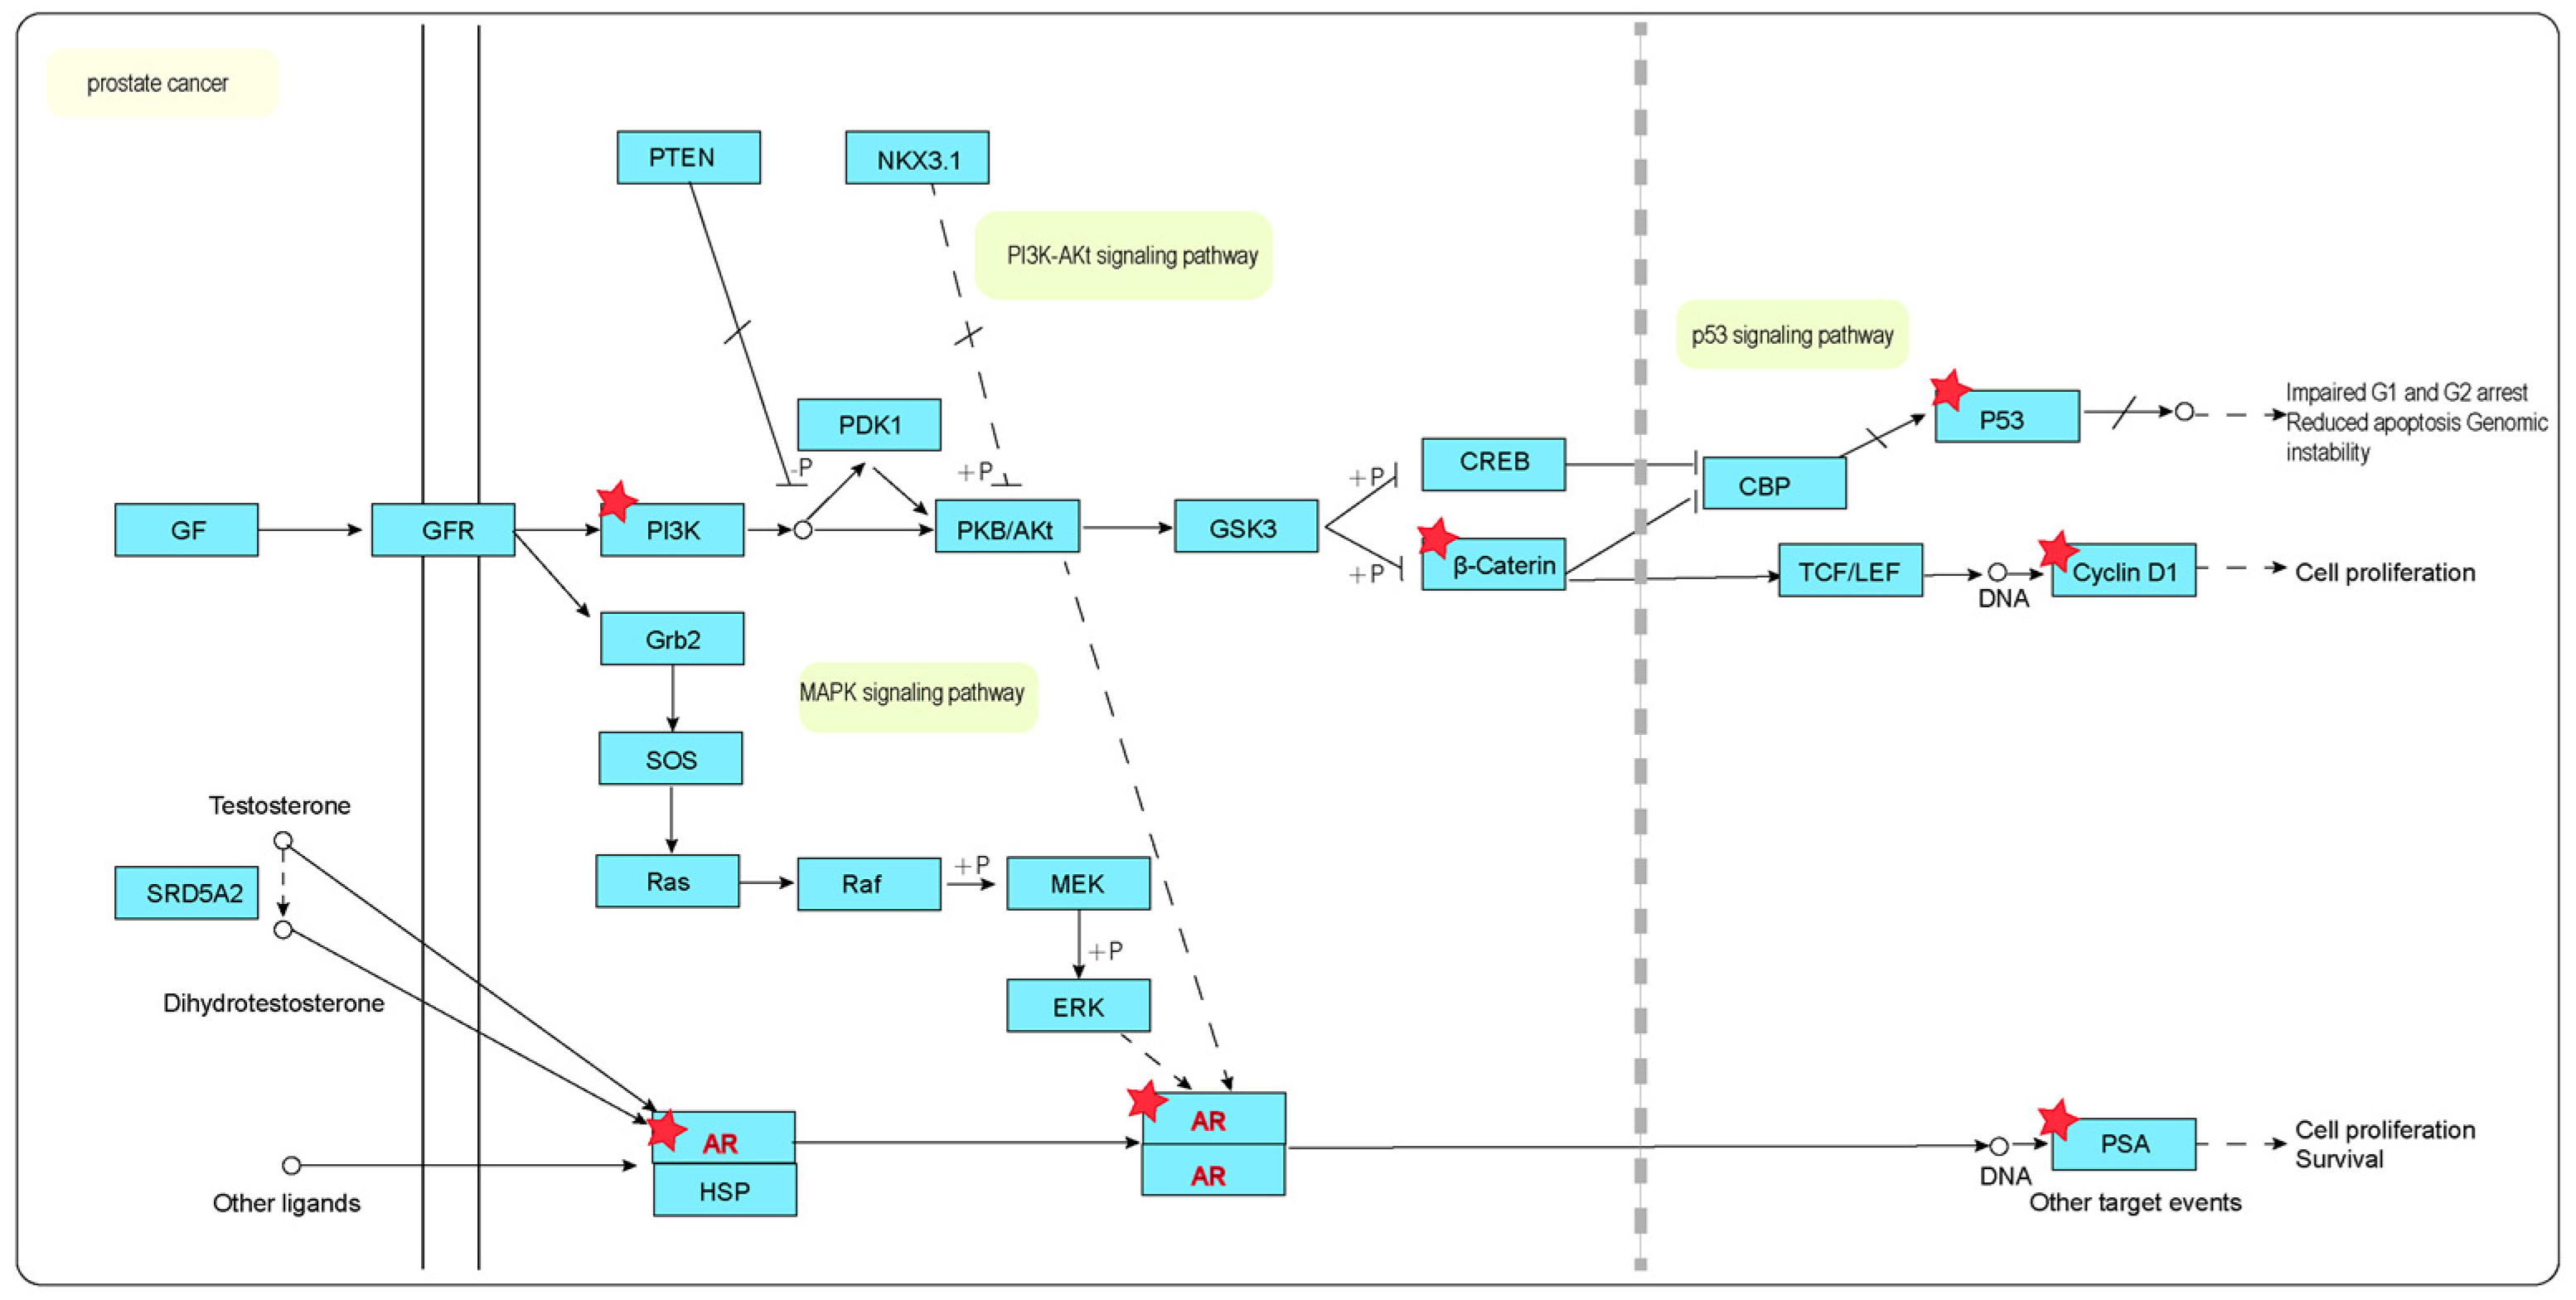
2.9. KEGG Annotation Pathway Analysis
3. Discussion
4. Materials and Methods
4.1. Screening for Active Ingredients and Targets Prediction
4.2. Identification of Disease Targets
4.3. Construction of Active Ingredient–Target–Pathway–Disease Network
4.4. Target Screening and Construction of a Protein–Protein Interaction Network
4.5. Functional Enrichment Analysis and Pathway Enrichment Analysis of Gene Ontology Based on Kyoto Encyclopedia of Genes and Genomes
4.6. Molecular Docking
4.7. Molecular Dynamics Simulation
5. Conclusions
Supplementary Materials
Author Contributions
Funding
Institutional Review Board Statement
Informed Consent Statement
Data Availability Statement
Conflicts of Interest
References
- Zhu, L.; Chen, L. Progress in research on paclitaxel and tumor immunotherapy. Cell Mol. Biol. Lett. 2019, 24, 40. [Google Scholar]
- Weaver, B.A. How Taxol/paclitaxel kills cancer cells. Mol. Biol. Cell 2014, 25, 2677–2681. [Google Scholar]
- Wang, Y.N.; Wang, Y.Y.; Wang, J.; Bai, W.J.; Miao, N.J.; Wang, J. Vinblastine resets tumor-associated macrophages toward M1 phenotype and promotes antitumor immune response. J. Immunother. Cancer 2023, 11, e007253. [Google Scholar]
- Capasso, A. Vinorelbine in cancer therapy. Curr. Drug Targets 2012, 13, 1065–1071. [Google Scholar] [PubMed]
- Gao, H.; Yang, Y.; Liu, J.; Cheng, Y.; Han, R.; Yang, X. Study on analgesic and anti-inflammatory effects of ethanol extract from corms of Crocus alatavicus. Chin. J. Ethnomedicine Ethnopharmacy 2016, 25, 8–9. [Google Scholar]
- Allambergenova, Z.; Kasela, M.; Adamczuk, G.; Humeniuk, E.; Iwan, M.; Świątek, Ł.; Boguszewska, A.; Rajtar, B.; Józefczyk, A.; Baj, T.; et al. Phytochemical Profile and Biological Activity of the Ethanolic Extract from the Aerial Part of Crocus alatavicus Regel & Semen Growing Wildly in Southern Kazakhstan. Molecules 2022, 27, 3468. [Google Scholar] [CrossRef]
- Hopkins, A.L. Network pharmacology: The next paradigm in drug discovery. Nat. Chem. Biol. 2008, 4, 682–690. [Google Scholar]
- Zhao, L.; Zhang, H.; Li, N.; Chen, J.; Xu, H.; Wang, Y.; Liang, Q. Network pharmacology, a promising approach to reveal the pharmacology mechanism of Chinese medicine formula. J. Ethnopharmacol. 2023, 309, 116306. [Google Scholar]
- Li, S.; Zhang, B.; Zhang, N. Network target for screening synergistic drug combinations with application to traditional Chinese medicine. BMC Syst. Biol. 2011, 5 (Suppl. 1), S10. [Google Scholar]
- Wu, X.; Jiang, R.; Zhang, M.Q.; Li, S. Network-based global inference of human disease genes. Mol. Syst. Biol. 2008, 4, 189. [Google Scholar]
- Yao, X.; Hao, H.; Li, Y.; Li, S. Modularity-based credible prediction of disease genes and detection of disease subtypes on the phenotype-gene heterogeneous network. BMC Syst. Biol. 2011, 5, 79. [Google Scholar]
- Zhao, S.; Li, S. Network-based relating pharmacological and genomic spaces for drug target identification. PLoS ONE 2010, 5, e11764. [Google Scholar]
- Sekhoacha, M.; Riet, K.; Motloung, P.; Gumenku, L.; Adegoke, A.; Mashele, S. Prostate Cancer Review: Genetics, Diagnosis, Treatment Options, and Alternative Approaches. Molecules 2022, 27, 5730. [Google Scholar] [CrossRef]
- Castro, E.; Romero-Laorden, N.; Del Pozo, A.; Lozano, R.; Medina, A.; Puente, J.; Piulats, J.M.; Lorente, D.; Saez, M.I.; Morales-Barrera, R.; et al. PROREPAIR-B: A Prospective Cohort Study of the Impact of Germline DNA Repair Mutations on the Outcomes of Patients With Metastatic Castration-Resistant Prostate Cancer. J. Clin. Oncol. 2019, 37, 490–503. [Google Scholar]
- Wen, S.; Chang, H.C.; Tian, J.; Shang, Z.; Niu, Y.; Chang, C. Stromal androgen receptor roles in the development of normal prostate, benign prostate hyperplasia, and prostate cancer. Am. J. Pathol. 2015, 185, 293–301. [Google Scholar]
- Wadosky, K.M.; Koochekpour, S. Androgen receptor splice variants and prostate cancer: From bench to bedside. Oncotarget 2017, 8, 18550–18576. [Google Scholar] [PubMed]
- Dai, C.; Dehm, S.M.; Sharifi, N. Targeting the Androgen Signaling Axis in Prostate Cancer. J. Clin. Oncol. 2023, 41, 4267–4278. [Google Scholar]
- Tian, Y.; Dong, D.; Wang, Z.; Wu, L.; Park, J.Y.; Wei, G.-H.; Wang, L. Combined CRISPRi and proteomics screening reveal a cohesin-CTCF-bound allele contributing to increased expression of RUVBL1 and prostate cancer progression. Am. J. Hum. Genet. 2023, 110, 1289–1303. [Google Scholar]
- Liu, X.; Chen, Q.; Yan, J.; Wang, Y.; Zhu, C.; Chen, C.; Zhao, X.; Xu, M.; Sun, Q.; Deng, R.; et al. MiRNA-296-3p-ICAM-1 axis promotes metastasis of prostate cancer by possible enhancing survival of natural killer cell-resistant circulating tumour cells. Cell Death Dis. 2013, 4, e928. [Google Scholar] [CrossRef]
- Liu, J.; Liu, J.; Tong, X.; Peng, W.; Wei, S.; Sun, T.; Wang, Y.; Zhang, B.; Li, W. Network Pharmacology Prediction and Molecular Docking-Based Strategy to Discover the Potential Pharmacological Mechanism of Huai Hua San Against Ulcerative Colitis. Drug Des. Devel Ther. 2021, 15, 3255–3276. [Google Scholar] [CrossRef]
- Li, C.; Pan, J.; Xu, C.; Jin, Z.; Chen, X. A Preliminary Inquiry Into the Potential Mechanism of Huang-Lian-Jie-Du Decoction in Treating Rheumatoid Arthritis via Network Pharmacology and Molecular Docking. Front. Cell Dev. Biol. 2021, 9, 740266. [Google Scholar]
- Li, X.; Tang, H.; Tang, Q.; Chen, W. Decoding the Mechanism of Huanglian Jiedu Decoction in Treating Pneumonia Based on Network Pharmacology and Molecular Docking. Front. Cell Dev. Biol. 2021, 9, 638366. [Google Scholar]
- Zeng, Z.; Hu, J.; Jiang, J.; Xiao, G.; Yang, R.; Li, S.; Li, Y.; Huang, H.; Zhong, H.; Bi, X. Network Pharmacology and Molecular Docking-Based Prediction of the Mechanism of Qianghuo Shengshi Decoction against Rheumatoid Arthritis. BioMed Res. Int. 2021, 2021, 6623912. [Google Scholar]
- Padhy, I.; Paul, P.; Sharma, T.; Banerjee, S.; Mondal, A. Molecular Mechanisms of Action of Eugenol in Cancer: Recent Trends and Advancement. Life 2022, 12, 1795. [Google Scholar] [CrossRef]
- Maekawa, S.; Takata, R.; Obara, W. Molecular Mechanisms of Prostate Cancer Development in the Precision Medicine Era: A Comprehensive Review. Cancers 2024, 16, 523. [Google Scholar] [CrossRef] [PubMed]
- Abeshouse, A.; Ahn, J.; Akbani, R.; Ally, A.; Amin, S.; Andry, C.D.; Annala, M.; Aprikian, A.; Armenia, J.; Arora, A.; et al. The Molecular Taxonomy of Primary Prostate Cancer. Cell 2015, 163, 1011–1025. [Google Scholar]
- Robinson, D.; Van Allen, E.M.; Wu, Y.M.; Schultz, N.; Lonigro, R.J.; Mosquera, J.M.; Montgomery, B.; Taplin, M.E.; Pritchard, C.C.; Attard, G.; et al. Integrative clinical genomics of advanced prostate cancer. Cell 2015, 161, 1215–1228. [Google Scholar]
- Pourmand, G.; Ziaee, A.A.; Abedi, A.R.; Mehrsai, A.; Alavi, H.A.; Ahmadi, A.; Saadati, H.R. Role of PTEN gene in progression of prostate cancer. Urol. J. 2007, 4, 95–100. [Google Scholar]
- Reid, A.H.; Attard, G.; Ambroisine, L.; Fisher, G.; Kovacs, G.; Brewer, D.; Clark, J.; Flohr, P.; Edwards, S.; Berney, D.M.; et al. Molecular characterisation of ERG, ETV1 and PTEN gene loci identifies patients at low and high risk of death from prostate cancer. Br. J. Cancer 2010, 102, 678–684. [Google Scholar]
- Baca, S.C.; Prandi, D.; Lawrence, M.S.; Mosquera, J.M.; Romanel, A.; Drier, Y.; Park, K.; Kitabayashi, N.; MacDonald, T.Y.; Ghandi, M.; et al. Punctuated evolution of prostate cancer genomes. Cell 2013, 153, 666–677. [Google Scholar]
- Barbieri, C.E.; Baca, S.C.; Lawrence, M.S.; Demichelis, F.; Blattner, M.; Theurillat, J.P.; White, T.A.; Stojanov, P.; Van Allen, E.; Stransky, N.; et al. Exome sequencing identifies recurrent SPOP, FOXA1 and MED12 mutations in prostate cancer. Nat. Genet. 2012, 44, 685–689. [Google Scholar] [PubMed]
- Berger, M.F.; Lawrence, M.S.; Demichelis, F.; Drier, Y.; Cibulskis, K.; Sivachenko, A.Y.; Sboner, A.; Esgueva, R.; Pflueger, D.; Sougnez, C.; et al. The genomic complexity of primary human prostate cancer. Nature 2011, 470, 214–220. [Google Scholar]
- Cooper, C.S.; Eeles, R.; Wedge, D.C.; Van Loo, P.; Gundem, G.; Alexandrov, L.B.; Kremeyer, B.; Butler, A.; Lynch, A.G.; Camacho, N.; et al. Analysis of the genetic phylogeny of multifocal prostate cancer identifies multiple independent clonal expansions in neoplastic and morphologically normal prostate tissue. Nat. Genet. 2015, 47, 367–372. [Google Scholar] [PubMed]
- Taylor, B.S.; Schultz, N.; Hieronymus, H.; Gopalan, A.; Xiao, Y.; Carver, B.S.; Arora, V.K.; Kaushik, P.; Cerami, E.; Reva, B.; et al. Integrative genomic profiling of human prostate cancer. Cancer Cell 2010, 18, 11–22. [Google Scholar]
- Wang, X.S.; Shankar, S.; Dhanasekaran, S.M.; Ateeq, B.; Sasaki, A.T.; Jing, X.; Robinson, D.; Cao, Q.; Prensner, J.R.; Yocum, A.K.; et al. Characterization of KRAS rearrangements in metastatic prostate cancer. Cancer Discov. 2011, 1, 35–43. [Google Scholar] [PubMed]
- Tomlins, S.A.; Laxman, B.; Dhanasekaran, S.M.; Helgeson, B.E.; Cao, X.; Morris, D.S.; Menon, A.; Jing, X.; Cao, Q.; Han, B.; et al. Distinct classes of chromosomal rearrangements create oncogenic ETS gene fusions in prostate cancer. Nature 2007, 448, 595–599. [Google Scholar]
- Annala, M.; Taavitsainen, S.; Khalaf, D.J.; Vandekerkhove, G.; Beja, K.; Sipola, J.; Warner, E.W.; Herberts, C.; Wong, A.; Fu, S.; et al. Evolution of Castration-Resistant Prostate Cancer in ctDNA during Sequential Androgen Receptor Pathway Inhibition. Clin. Cancer Res. 2021, 27, 4610–4623. [Google Scholar]
- Gundem, G.; Van Loo, P.; Kremeyer, B.; Alexandrov, L.B.; Tubio, J.M.C.; Papaemmanuil, E.; Brewer, D.S.; Kallio, H.M.L.; Högnäs, G.; Annala, M.; et al. The evolutionary history of lethal metastatic prostate cancer. Nature 2015, 520, 353–357. [Google Scholar]
- Huang, G.; Cao, H.; Liu, G.; Chen, J. Role of androgen receptor signaling pathway-related lncRNAs in the prognosis and immune infiltration of breast cancer. Sci. Rep. 2022, 12, 20631. [Google Scholar]
- Michels, G.; Hoppe, U.C. Rapid actions of androgens. Front. Neuroendocrinol. 2008, 29, 182–198. [Google Scholar]
- He, Z.; Tang, F.; Lu, Z.; Huang, Y.; Lei, H.; Li, Z.; Zeng, G. Analysis of differentially expressed genes, clinical value and biological pathways in prostate cancer. Am. J. Transl. Res. 2018, 10, 1444–1456. [Google Scholar] [PubMed]
- He, R.; Zhang, W.; Chen, S.; Liu, Y.; Yang, W.; Li, J. Transcriptional Profiling Reveals the Regulatory Role of DNER in Promoting Pancreatic Neuroendocrine Neoplasms. Front. Genet. 2020, 11, 587402. [Google Scholar]
- Wang, Y.; Zhang, P.; Li, H.; Chen, P.; Zhang, X.; Wang, B.; Zhang, M. Zhijing powder manages blood pressure by regulating PI3K/AKT signal pathway in hypertensive rats. Heliyon 2023, 9, e12777. [Google Scholar]
- Ru, J.; Li, P.; Wang, J.; Zhou, W.; Li, B.; Huang, C.; Li, P.; Guo, Z.; Tao, W.; Yang, Y.; et al. TCMSP: A database of systems pharmacology for drug discovery from herbal medicines. J. Cheminform. 2014, 6, 13. [Google Scholar]
- Daina, A.; Zoete, V. Application of the SwissDrugDesign Online Resources in Virtual Screening. Int. J. Mol. Sci. 2019, 20, 4612. [Google Scholar] [CrossRef] [PubMed]
- UniProt: The Universal Protein Knowledgebase in 2023. Nucleic Acids Res. 2023, 51, D523–D531.
- Piñero, J.; Saüch, J.; Sanz, F.; Furlong, L.I. The DisGeNET cytoscape app: Exploring and visualizing disease genomics data. Comput. Struct. Biotechnol. J. 2021, 19, 2960–2967. [Google Scholar]
- Wu, Y.; Zhang, F.; Yang, K.; Fang, S.; Bu, D.; Li, H.; Sun, L.; Hu, H.; Gao, K.; Wang, W.; et al. SymMap: An integrative database of traditional Chinese medicine enhanced by symptom mapping. Nucleic Acids Res. 2019, 47, D1110–D1117. [Google Scholar]
- Zhou, Y.; Zhang, Y.; Zhao, D.; Yu, X.; Shen, X.; Zhou, Y.; Wang, S.; Qiu, Y.; Chen, Y.; Zhu, F. TTD: Therapeutic Target Database describing target druggability information. Nucleic Acids Res. 2024, 52, D1465–D1477. [Google Scholar]
- Burley, S.K.; Bhikadiya, C.; Bi, C.; Bittrich, S.; Chen, L.; Crichlow, G.V.; Christie, C.H.; Dalenberg, K.; Di Costanzo, L.; Duarte, J.M.; et al. RCSB Protein Data Bank: Powerful new tools for exploring 3D structures of biological macromolecules for basic and applied research and education in fundamental biology, biomedicine, biotechnology, bioengineering and energy sciences. Nucleic Acids Res. 2021, 49, D437–D451. [Google Scholar]
- Seeliger, D.; de Groot, B.L. Ligand docking and binding site analysis with PyMOL and Autodock/Vina. J. Comput. Aided Mol. Des. 2010, 24, 417–422. [Google Scholar] [PubMed]
- Kim, S.; Chen, J.; Cheng, T.; Gindulyte, A.; He, J.; He, S.; Li, Q.; Shoemaker, B.A.; Thiessen, P.A.; Yu, B.; et al. PubChem 2019 update: Improved access to chemical data. Nucleic Acids Res. 2019, 47, D1102–D1109. [Google Scholar] [PubMed]
- Wang, Y.; Zhang, Y.; Wang, Y.; Shu, X.; Lu, C.; Shao, S.; Liu, X.; Yang, C.; Luo, J.; Du, Q. Using Network Pharmacology and Molecular Docking to Explore the Mechanism of Shan Ci Gu (Cremastra appendiculata) Against Non-Small Cell Lung Cancer. Front. Chem. 2021, 9, 682862. [Google Scholar]
- O’Boyle, N.M.; Banck, M.; James, C.A.; Morley, C.; Vandermeersch, T.; Hutchison, G.R. Open Babel: An open chemical toolbox. J. Cheminform. 2011, 3, 33. [Google Scholar]
- Schiffrin, B.; Radford, S.E.; Brockwell, D.J.; Calabrese, A.N. PyXlinkViewer: A flexible tool for visualization of protein chemical crosslinking data within the PyMOL molecular graphics system. Protein Sci. 2020, 29, 1851–1857. [Google Scholar]


| Target | PDB ID | Target Structure | Ligand | Affinity (kcal/mol) |
|---|---|---|---|---|
| AR | 1E3G |  | Capillarisin | −6.76 |
| Eugenol | −5.43 | |||
| CCND1 | 6P8E | 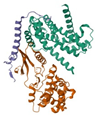 | Eugenol | −4.05 |
| Capillarisin | −4.52 | |||
| PIK3CA | 8BCY | 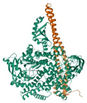 | 4-Hydroxymandelonitrile | −5.05 |
| Capillarisin | −3.96 | |||
| KLK3 | 7JOD |  | Eugenol | −5.37 |
| Complex | ΔEvdw | ΔEele | ΔEpol | ΔEnonpol | ΔEMMPBSA | −TΔS | ΔGbind * |
|---|---|---|---|---|---|---|---|
| AR–Capillarisin | −85.595 ± 1.633 | −25.637 ± 2.759 | 86.711 ± 4.505 | −12.932 ± 0.28 | −37.394 ± 2.244 | 22.579 ± 1.046 | −14.814 ± 3.282 |
Disclaimer/Publisher’s Note: The statements, opinions and data contained in all publications are solely those of the individual author(s) and contributor(s) and not of MDPI and/or the editor(s). MDPI and/or the editor(s) disclaim responsibility for any injury to people or property resulting from any ideas, methods, instructions or products referred to in the content. |
© 2025 by the authors. Licensee MDPI, Basel, Switzerland. This article is an open access article distributed under the terms and conditions of the Creative Commons Attribution (CC BY) license (https://creativecommons.org/licenses/by/4.0/).
Share and Cite
Ding, Z.; Lu, Y.; Zhao, J.; Zhang, D.; Gao, B. Network Pharmacology and Molecular Dynamics Identified Potential Androgen Receptor-Targeted Metabolites in Crocus alatavicus. Int. J. Mol. Sci. 2025, 26, 3533. https://doi.org/10.3390/ijms26083533
Ding Z, Lu Y, Zhao J, Zhang D, Gao B. Network Pharmacology and Molecular Dynamics Identified Potential Androgen Receptor-Targeted Metabolites in Crocus alatavicus. International Journal of Molecular Sciences. 2025; 26(8):3533. https://doi.org/10.3390/ijms26083533
Chicago/Turabian StyleDing, Zhen, Yuanfeng Lu, Jichen Zhao, Daoyuan Zhang, and Bei Gao. 2025. "Network Pharmacology and Molecular Dynamics Identified Potential Androgen Receptor-Targeted Metabolites in Crocus alatavicus" International Journal of Molecular Sciences 26, no. 8: 3533. https://doi.org/10.3390/ijms26083533
APA StyleDing, Z., Lu, Y., Zhao, J., Zhang, D., & Gao, B. (2025). Network Pharmacology and Molecular Dynamics Identified Potential Androgen Receptor-Targeted Metabolites in Crocus alatavicus. International Journal of Molecular Sciences, 26(8), 3533. https://doi.org/10.3390/ijms26083533