
Enzymes Drive Glutathione Shunt to Explain Oxidative State Using an In-Parallel Multi-Omic Method

 , , , and
Abstract
1. Introduction
2. Results and Discussion
2.1. Assessment of Biological Matrices for Targeted Protein Analysis
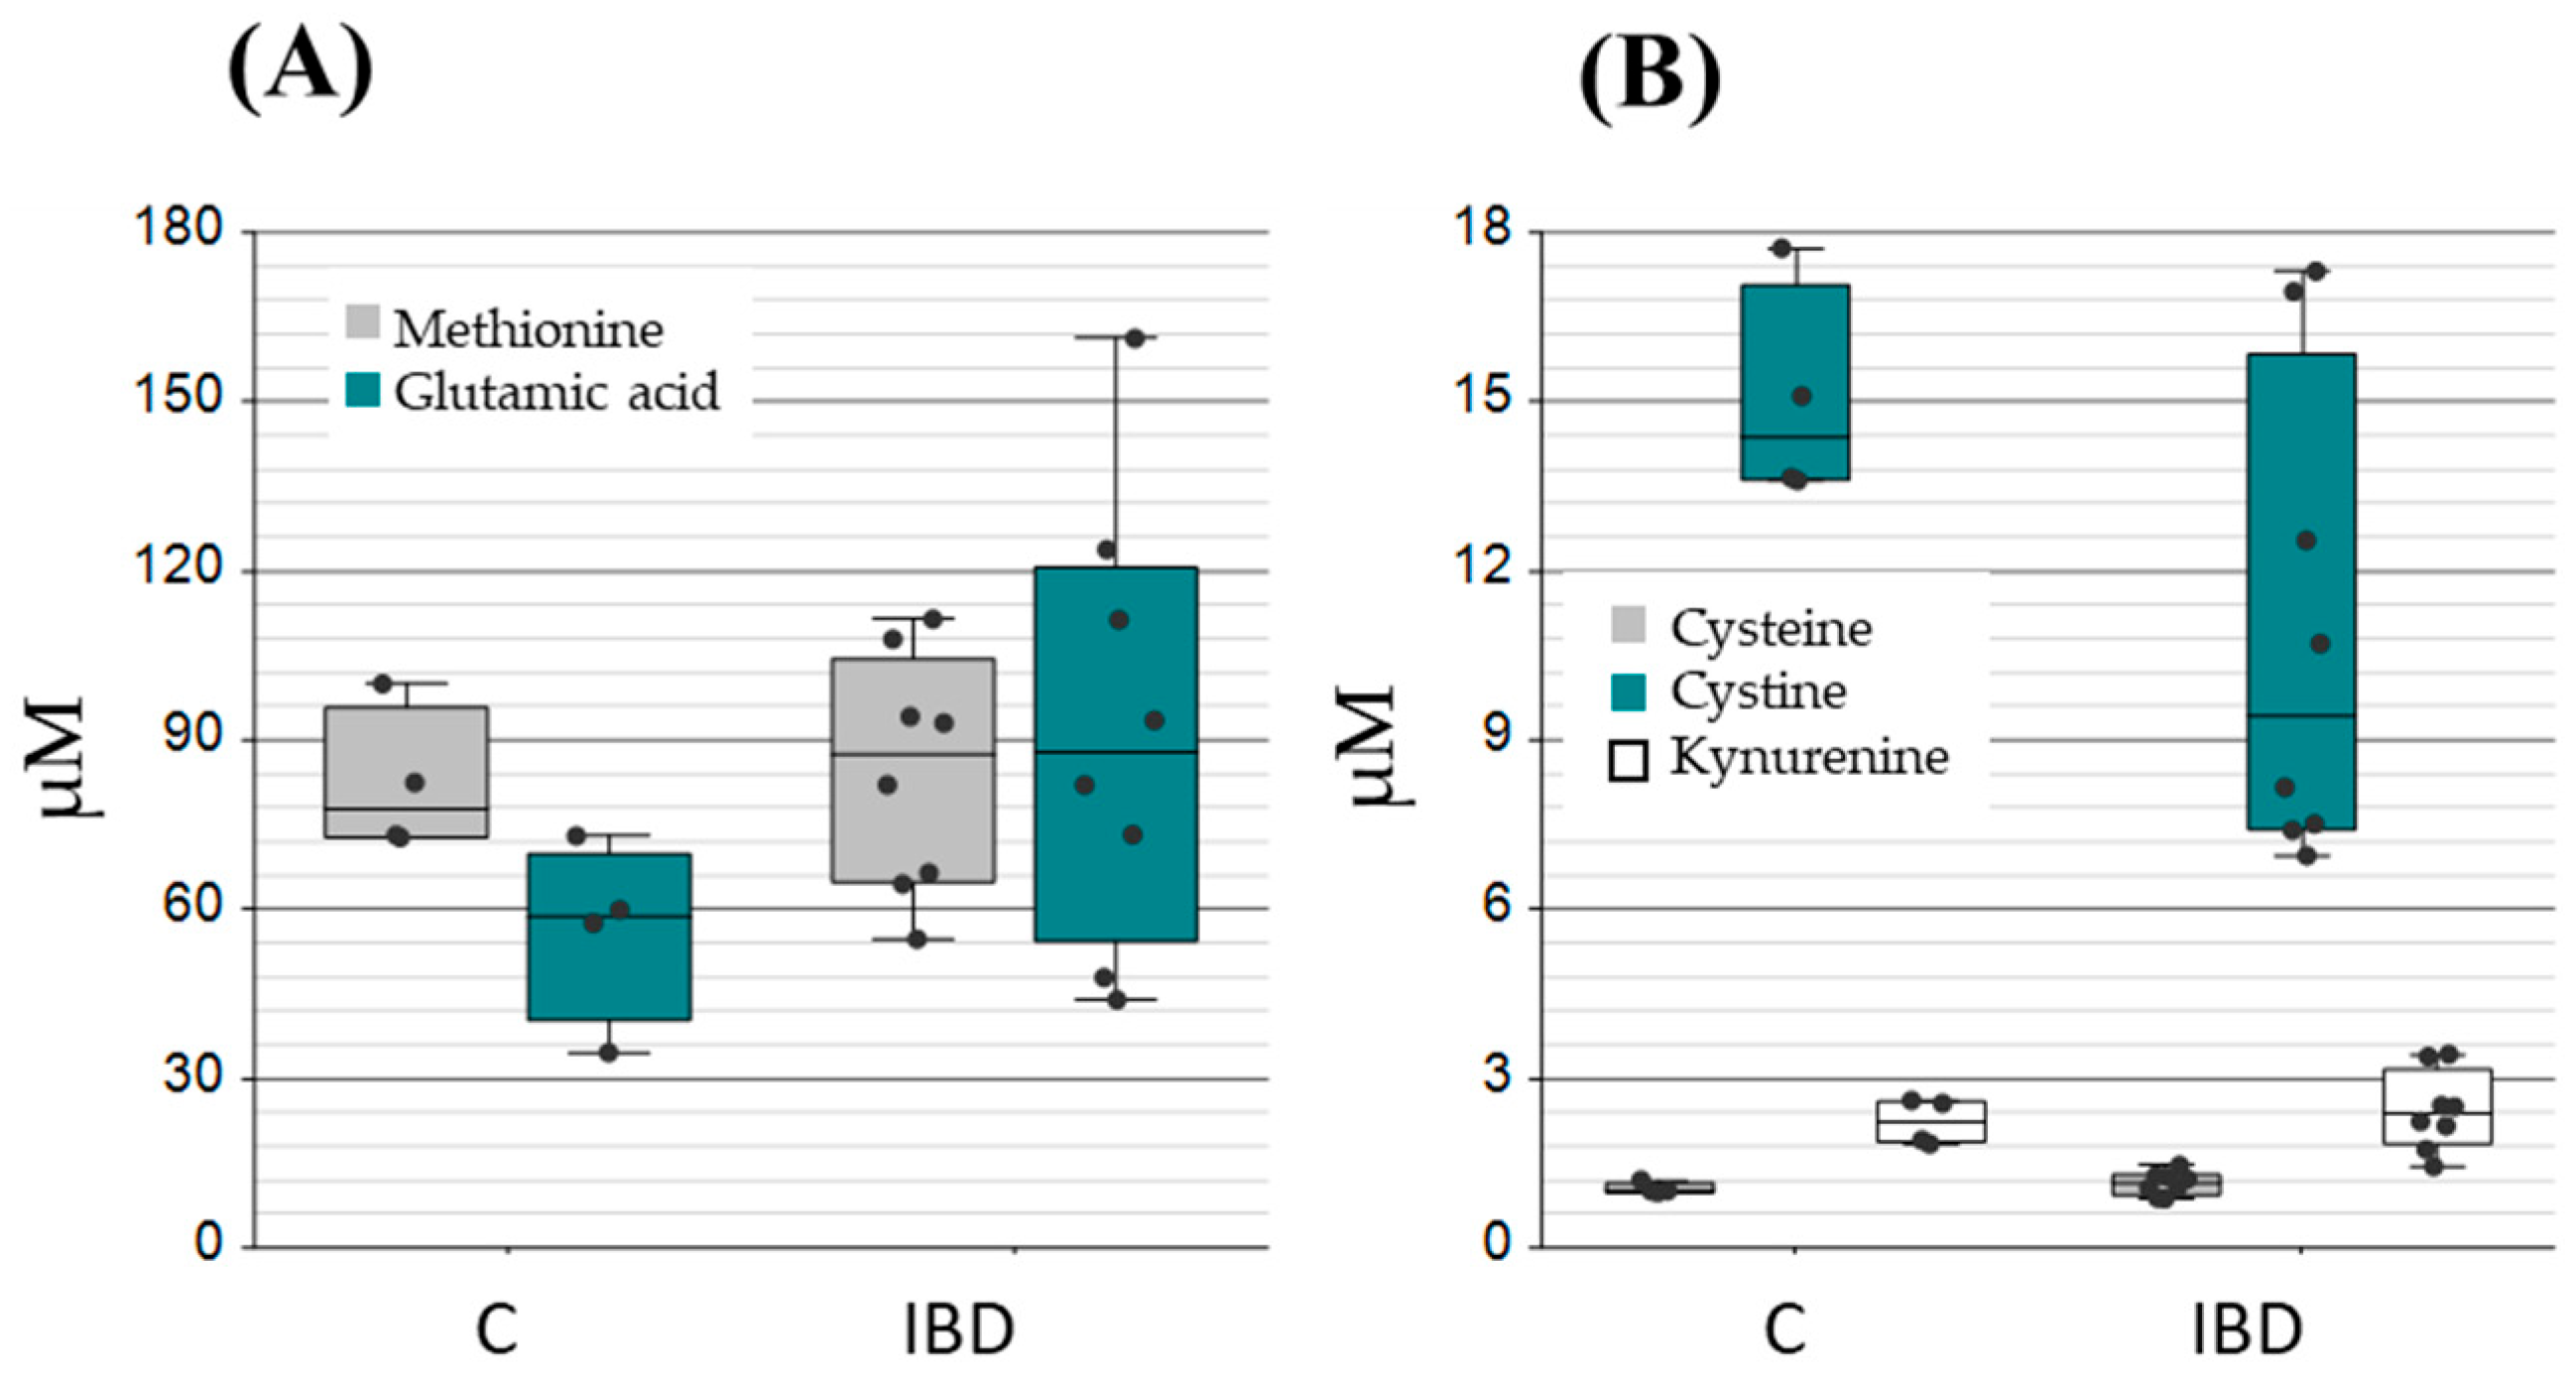
2.2. Application of the Method to Samples of Pathological Significance in IBD
3. Materials and Methods
3.1. Sample Information
3.2. Targeted Protein Analysis by Parallel Rection Monitoring (PRM)
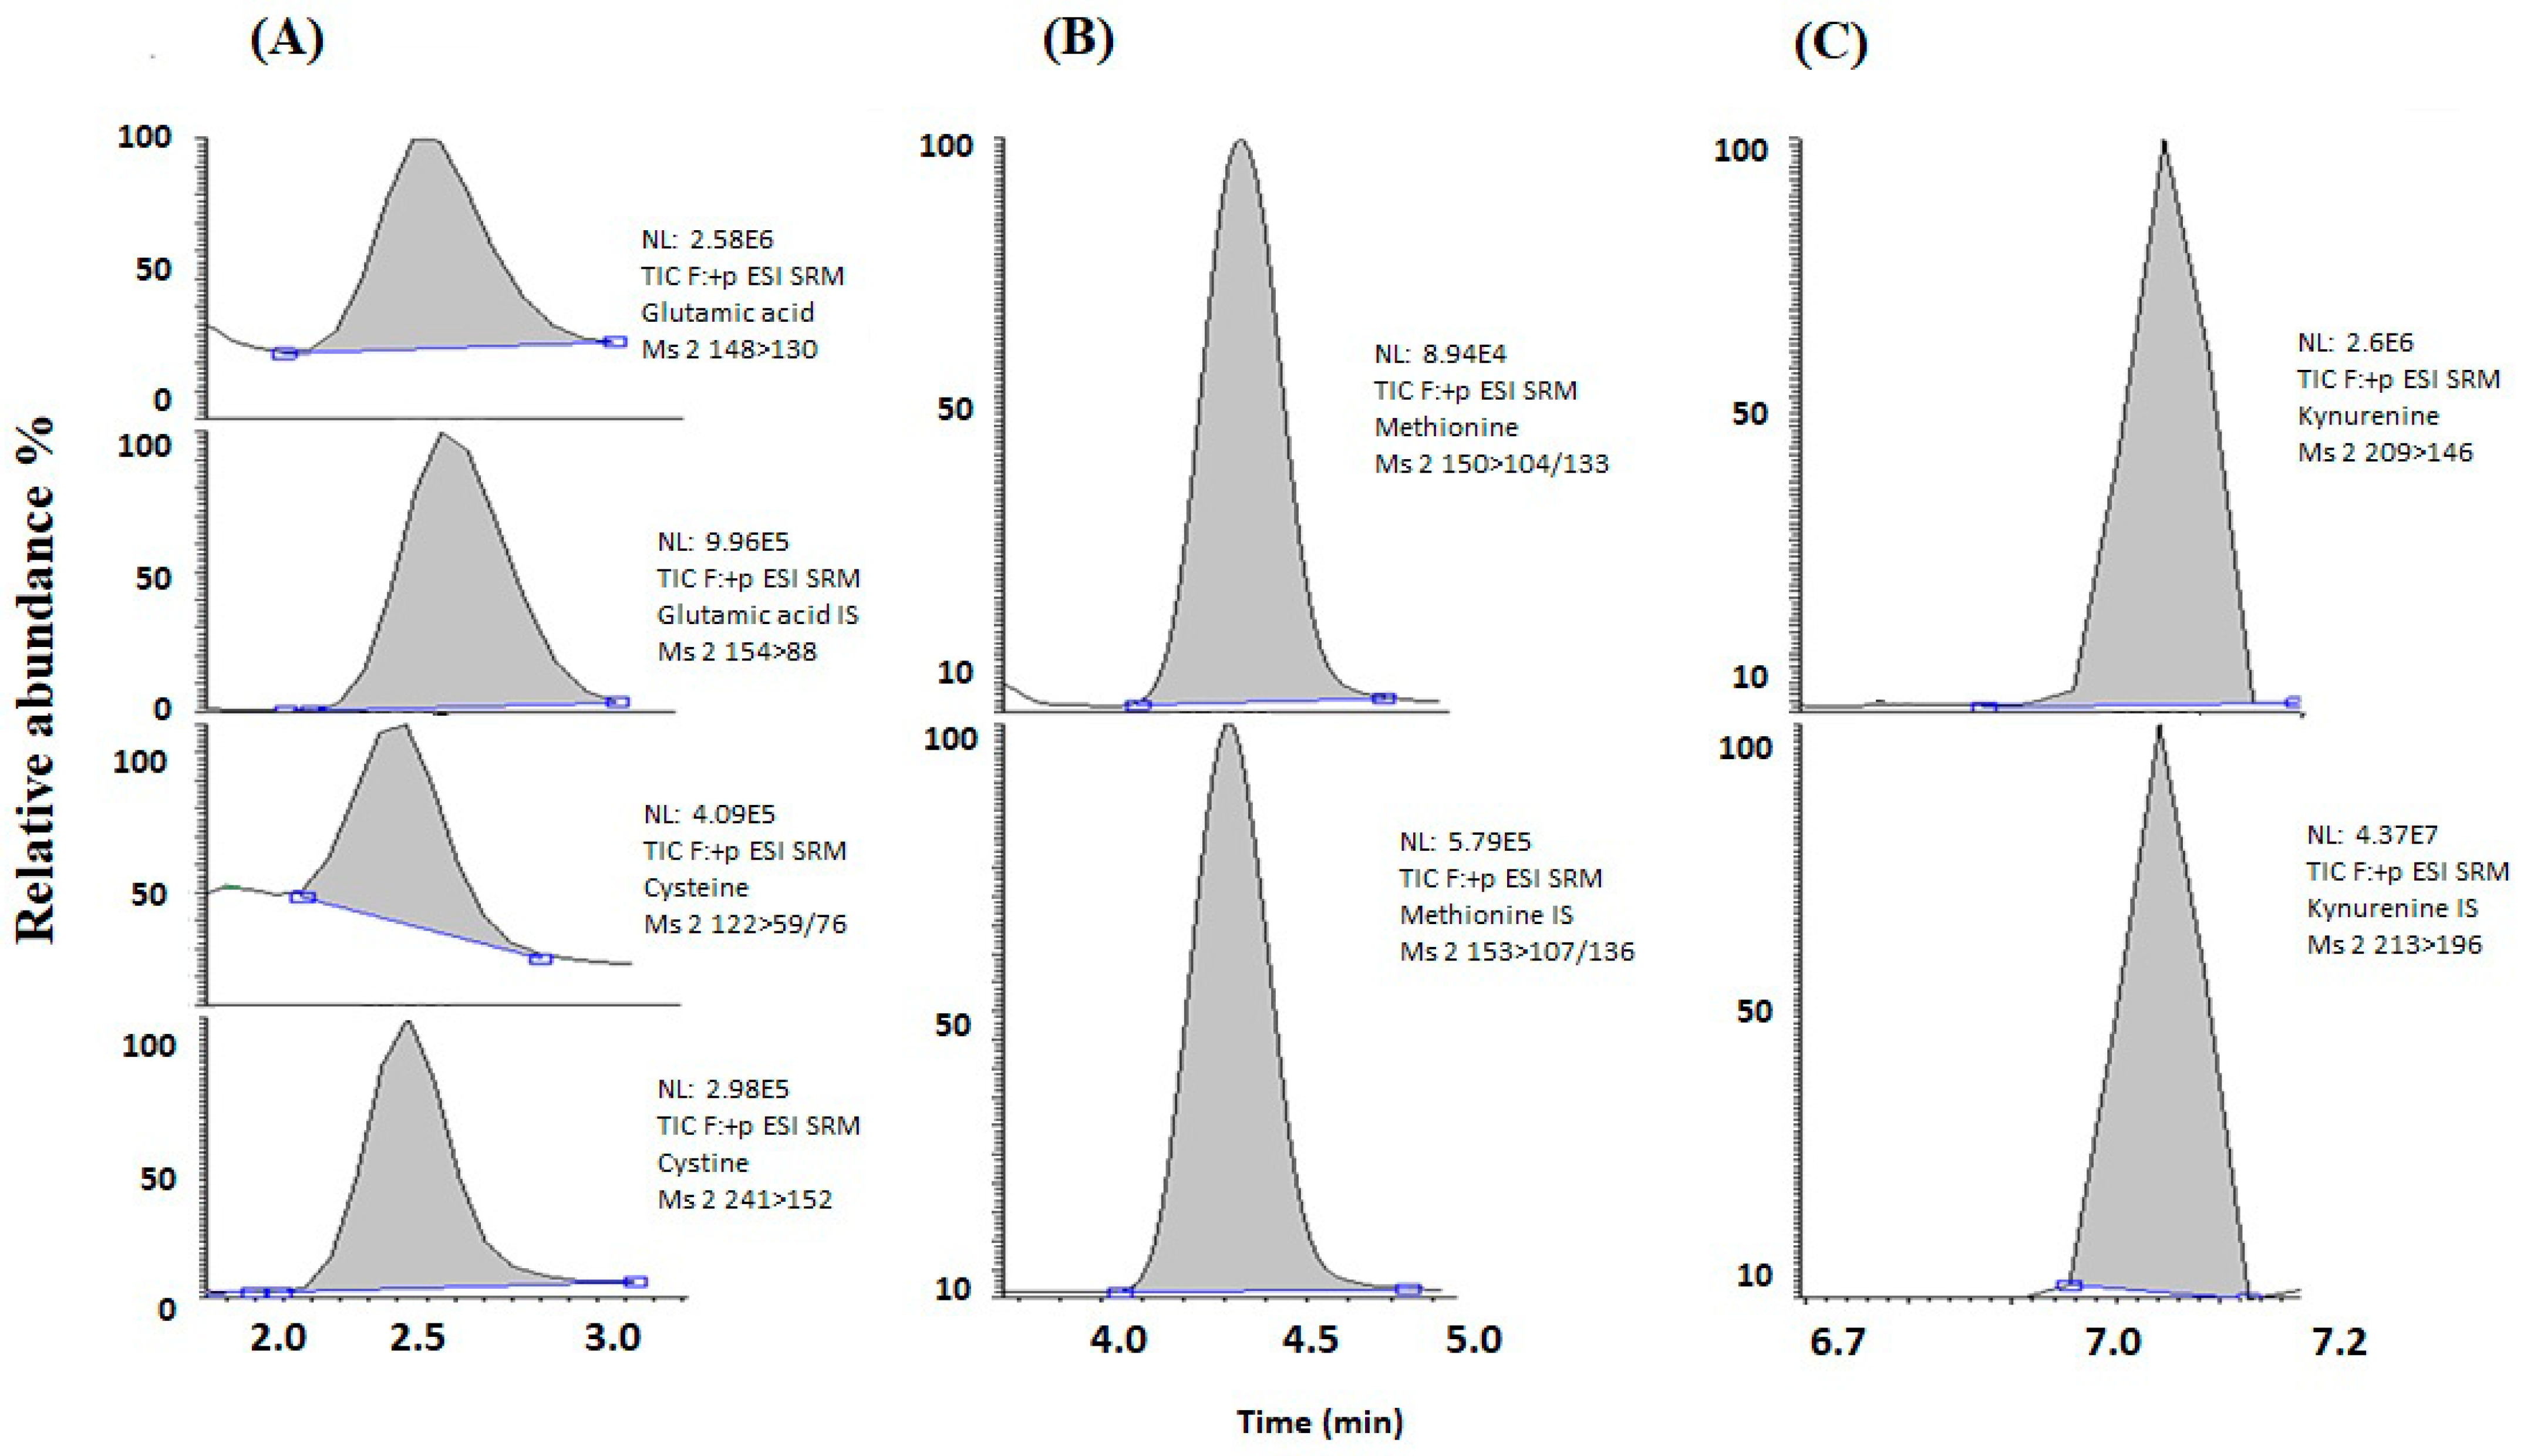
3.3. Targeted Metabolite Analysis
3.4. Statistical Analysis
4. Conclusions
Author Contributions
Funding
Institutional Review Board Statement
Informed Consent Statement
Data Availability Statement
Acknowledgments
Conflicts of Interest
Abbreviations
| rGSH | reduced glutathione |
| GSSG | oxidised glutathione |
| PRM | parallel reaction monitoring |
| SRM | single reaction monitoring |
Appendix A

| Protein | ID | Sequence | Parent m/z | z | Product m/z | Peak |
|---|---|---|---|---|---|---|
| GPx3 * | P22352 | K.QEPGENSEILPTLK | 777.9041 | 2 | 1200.6470 1014.5830 900.5401 458.2973 649.3535 | 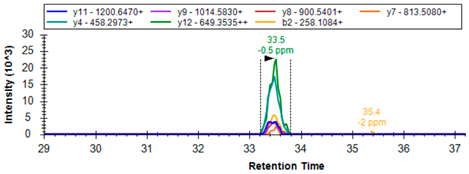 |
| K.FLVGPDGIPIMR | 657.8656 | 2 | 1054.5714 955.5030 898.4815 801.4287 686.4018 516.2963 | 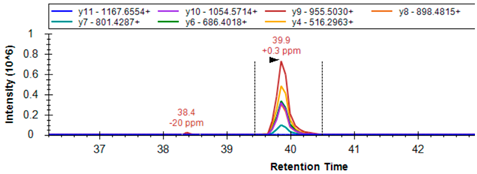 | ||
| GSHR | P00390 | R.LNAIYQNNLTK # | 646.3539 | 2 | 1178.6164 1064.5735 993.5364 717.3890 | 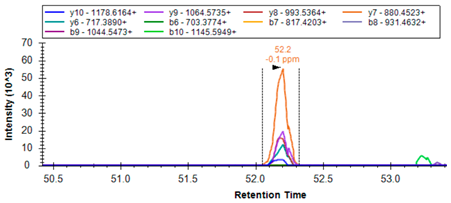 |
| K.ALLTPVAIAAGR | 576.8586 | 2 | 968.5887 855.5047 754.4570 657.4042 377.7321 399.2602 |  | ||
| SLCA7/xCT | Q9UPY5 | R.KPVVSTISK | 479.8008 | 2 | 830.4982 415.7527 129.1022 | 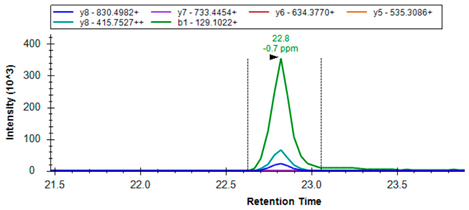 |
| GSH2 | P48637 | R.AIENELLAR | 514.7909 | 2 | 557.2566 670.3406 783.4247 | 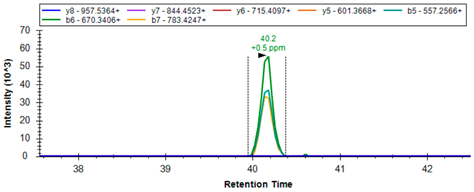 |
| R.ALAEGVLLR # | 471.2926 | 2 | 757.4567 686.4196 557.3770 500.3555 | 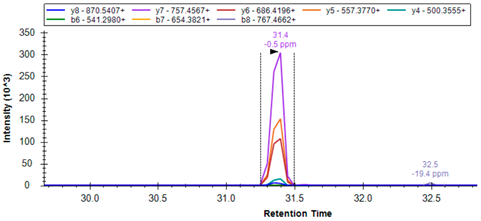 | ||
| GSH1 | P48506 | R.DPLTLFEEK | 546.2846 | 2 | 879.4822 766.3981 665.3505 | 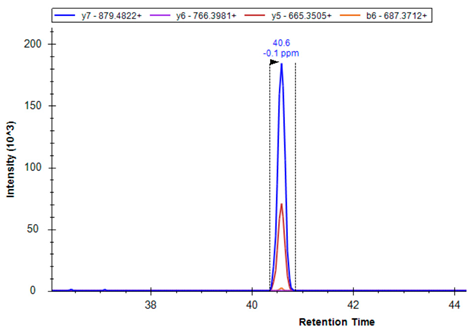 |

| Metabolites | Retention Time | Precursor Ion (m/z) | Product Ions (m/z) | Collision Energy (eV) |
|---|---|---|---|---|
| Glutamic acid | 2.45 | 148 | 130/84 | 20 |
| 13C 15N-Glutamic acid | 2.48 | 154 | 89 | 20 |
| Cysteine | 2.30 | 122 | 59/76 | 12 |
| Cystine | 2.34 | 241 | 152 | 20 |
| Methionine | 4.33 | 150 | 104/133 | 12 |
| 2H3-methionine | 4.32 | 153 | 107/136 | 12 |
| Kynurenine | 7.05 | 209 | 146 | 20 |
| 2H4-kynurenine | 7.04 | 213 | 196 | 12 |
References
- Bustamante, S.; Yau, Y.; Boys, V.; Chang, J.; Paramsothy, S.; Pudipeddi, A.; Leong, R.W.; Wasinger, V.C. Tryptophan Metabolism ‘Hub’ Gene Expression Associates with Increased Inflammation and Severe Disease Outcomes in COVID-19 Infection and Inflammatory Bowel Disease. Int. J. Mol. Sci. 2022, 23, 14776. [Google Scholar] [CrossRef]
- Ballatori, N.; Krance, S.M.; Notenboom, S.; Shi, S.; Tieu, K.; Hammond, C.L. Glutathione dysregulation and the etiology and progression of human diseases. Biol. Chem. 2009, 390, 191–214. [Google Scholar] [CrossRef]
- Ferguson, G.D.; Bridge, W.J. The glutathione system and the related thiol network in Caenorhabditis elegans. Redox Biol. 2019, 24, 101171. [Google Scholar] [CrossRef]
- Rahman, I.; Kode, A.; Biswas, S.K. Assay for quantitative determination of glutathione and glutathione disulfide levels using enzymatic recycling method. Nat. Protoc. 2006, 1, 3159–3165. [Google Scholar] [CrossRef]
- Aniya, Y.; Imaizumi, N. Mitochondrial glutathione transferases involving a new function for membrane permeability transition pore regulation. Drug Metab. Rev. 2011, 43, 292–299. [Google Scholar] [CrossRef]
- Koppula, P.; Zhuang, L.; Gan, B. Cystine transporter SLC7A11/xCT in cancer: Ferroptosis, nutrient dependency, and cancer therapy. Protein Cell 2021, 12, 599–620. [Google Scholar] [CrossRef]
- Sotgia, S.; Fois, A.G.; Paliogiannis, P.; Carru, C.; Mangoni, A.A.; Zinellu, A. Methodological Fallacies in the Determination of Serum/Plasma Glutathione Limit Its Translational Potential in Chronic Obstructive Pulmonary Disease. Molecules 2021, 26, 1572. [Google Scholar] [CrossRef]
- Qi, X.; Ng, K.T.; Lian, Q.; Li, C.X.; Geng, W.; Ling, C.C.; Yeung, W.H.; Ma, Y.Y.; Liu, X.B.; Liu, H.; et al. Glutathione Peroxidase 3 Delivered by hiPSC-MSCs Ameliorated Hepatic IR Injury via Inhibition of Hepatic Senescence. Theranostics 2018, 8, 212–222. [Google Scholar] [CrossRef]
- Tang, L.; Wang, W.; Zhou, W.; Cheng, K.; Yang, Y.; Liu, M.; Cheng, K.; Wang, W. Three-pathway combination for glutathione biosynthesis in Saccharomyces cerevisiae. Microb. Cell Factories 2015, 14, 139. [Google Scholar] [CrossRef]
- Liu, T.; Sun, L.; Zhang, Y.; Wang, Y.; Zheng, J. Imbalanced GSH/ROS and sequential cell death. J. Biochem. Mol. Toxicol. 2021, 36, e22942. [Google Scholar] [CrossRef]
- Ridnour, L.A.; Winters, R.A.; Ercal, N.; Spitz, D.R. Measurement of glutathione, glutathione disulfide, and other thiols in mammalian cell and tissue homogenates using high-performance liquid chromatography separation of N-(1-pyrenyl)maleimide derivatives. In Methods Enzymol; Academic Press: Cambridge, MA, USA, 1999; Volume 299, pp. 258–267. [Google Scholar]
- Winters, R.A.; Zukowski, J.; Ercal, N.; Matthews, R.H.; Spitz, D.R. Analysis of Glutathione, Glutathione Disulfide, Cysteine, Homocysteine, and Other Biological Thiols by High-Performance Liquid Chromatography Following Derivatization by N-(1-Pyrenyl)maleimide. Anal. Biochem. 1995, 227, 14–21. [Google Scholar] [CrossRef]
- Piggott, A.M.; Karuso, P. Fluorometric Assay for the Determination of Glutathione Reductase Activity. Anal. Chem. 2007, 79, 8769–8773. [Google Scholar] [CrossRef]
- Ansari, S.L.N.H.; Wang, C.; Wang, L.; Srivastava, S.K. A rapid HPLC method for the quantification of GSH and GSSG in ocular lens. Curr. Eye Res. 1996, 15, 726–732. [Google Scholar] [CrossRef]
- Afzal, M.; Afzal, A.; Jones, A.; Armstrong, D. A Rapid Method for the Quantification of GSH and GSSG in Biological Samples. In Oxidative Stress Biomarkers and Antioxidant Protocols; Armstrong, D., Ed.; Humana Press: Totowa, NJ, USA, 2002; pp. 117–122. [Google Scholar]
- Squellerio, I.; Caruso, D.; Porro, B.; Veglia, F.; Tremoli, E.; Cavalca, V. Direct glutathione quantification in human blood by LC–MS/MS: Comparison with HPLC with electrochemical detection. J. Pharm. Biomed. Anal. 2012, 71, 111–118. [Google Scholar] [CrossRef]
- Massarsky, A.; Kozal, J.S.; Di Giulio, R.T. Glutathione and zebrafish: Old assays to address a current issue. Chemosphere 2017, 168, 707–715. [Google Scholar] [CrossRef]
- Sotgia, S.; Paliogiannis, P.; Sotgiu, E.; Mellino, S.; Zinellu, E.; Fois, A.G.; Pirina, P.; Carru, C.; Mangoni, A.A.; Zinellu, A. Systematic Review and Meta-Analysis of the Blood Glutathione Redox State in Chronic Obstructive Pulmonary Disease. Antioxidants 2020, 9, 1146. [Google Scholar] [CrossRef]
- Hamad, A.; Elshahawy, M.; Negm, A.; Mansour, F.R. Analytical methods for determination of glutathione and glutathione disulfide in pharmaceuticals and biological fluids. Rev. Anal. Chem. 2019, 38, 20190019. [Google Scholar] [CrossRef]
- Nuhu, F.; Gordon, A.; Sturmey, R.; Seymour, A.M.; Bhandari, S. Measurement of Glutathione as a Tool for Oxidative Stress Studies by High Performance Liquid Chromatography. Molecules 2020, 25, 4196. [Google Scholar] [CrossRef]
- Giustarini, D.; Tsikas, D.; Colombo, G.; Milzani, A.; Dalle-Donne, I.; Fanti, P.; Rossi, R. Pitfalls in the analysis of the physiological antioxidant glutathione (GSH) and its disulfide (GSSG) in biological samples: An elephant in the room. J. Chromatogr. B Analyt. Technol. Biomed. Life Sci. 2016, 1019, 21–28. [Google Scholar] [CrossRef]
- Nady, B.; Martin, Z.; Jeffrey, W.; Wallace, B. Therapeutic Approaches to Modulating Glutathione Levels as a Pharmacological Strategy in Alzheimer’s Disease. Curr. Alzheimer Res. 2015, 12, 298–313. [Google Scholar] [CrossRef]
- Beutler, E.; Duron, O.; Kelly, B.M. Improved method for the determination of blood glutathione. J. Lab. Clin. Med. 1963, 61, 882–888. [Google Scholar]
- Mansoor, M.A.; Svardal, A.M.; Ueland, P.M. Determination of the in vivo redox status of cysteine, cysteinylglycine, homocysteine, and glutathione in human plasma. Anal. Biochem. 1992, 200, 218–229. [Google Scholar] [CrossRef]
- Svardal, A.M.; Mansoor, M.A.; Ueland, P.M. Determination of reduced, oxidized, and protein-bound glutathione in human plasma with precolumn derivatization with monobromobimane and liquid chromatography. Anal. Biochem. 1990, 184, 338–346. [Google Scholar] [CrossRef]
- Turell, L.; Radi, R.; Alvarez, B. The thiol pool in human plasma: The central contribution of albumin to redox processes. Free Radic. Biol. Med. 2013, 65, 244–253. [Google Scholar] [CrossRef]
- Grant, C.M.; MacIver, F.H.; Dawes, I.W. Glutathione synthetase is dispensable for growth under both normal and oxidative stress conditions in the yeast Saccharomyces cerevisiae due to an accumulation of the dipeptide gamma-glutamylcysteine. Mol. Biol. Cell 1997, 8, 1699–1707. [Google Scholar] [CrossRef]
- Poltorack, C.D.; Dixon, S.J. Understanding the role of cysteine in ferroptosis: Progress and paradoxes. FEBS J. 2022, 289, 374–385. [Google Scholar] [CrossRef]
- D’Angelo, J.A.; Mattox, M.L.; Fiebiger, E.; Dickinson, B.L. The Cystine/Glutamate Antiporter Regulates the Functional Expression of Indoleamine 2,3-Dioxygenase in Human Dendritic Cells. Scand. J. Immunol. 2012, 76, 448–449. [Google Scholar] [CrossRef]
- Fiore, A.; Zeitler, L.; Russier, M.; Groß, A.; Hiller, M.-K.; Parker, J.L.; Stier, L.; Köcher, T.; Newstead, S.; Murray, P.J. Kynurenine importation by SLC7A11 propagates anti-ferroptotic signaling. Mol. Cell 2022, 82, 920–932.e7. [Google Scholar] [CrossRef]
- Chen, J.; Thiyagarajah, J.; Song, M.; Chen, J.; Herrmann, C.; Gallagher, N.; Rapoport, D.; Mark, J.; Black, S.E.; Ramirez, J.; et al. Altered central and blood glutathione in Alzheimer’s disease and mild cognitive impairment: A meta-analysis. Alzheimers Res. Ther. 2022, 14, 23. [Google Scholar] [CrossRef]
- Adoul, Z.; Jafarinejed, S.; Baumgartner, A.; Isreb, M.; Liu, F.; Anderson, D.; Najafzadeh, M. Investigating the genotoxic effect of reduced glutathione, n-acetylcysteine, human umbilical cord-derived mesenchymal stem cell exosomes and let-7 miRNA mimics in human lymphocytes and EpiIntestinal cells. J. Crohn’s Colitis 2024, 18, i334. [Google Scholar] [CrossRef]
- Sido, B.; Hack, V.; Hochlehnert, A.; Lipps, H.; Herfarth, C.; Dröge, W. Impairment of intestinal glutathione synthesis in patients with inflammatory bowel disease. Gut 1998, 42, 485. [Google Scholar] [CrossRef]
- Vairetti, M.; Di Pasqua, L.G.; Cagna, M.; Richelmi, P.; Ferrigno, A.; Berardo, C. Changes in Glutathione Content in Liver Diseases: An Update. Antioxidants 2021, 10, 364. [Google Scholar] [CrossRef]
- Fujii, J.; Osaki, T.; Soma, Y.; Matsuda, Y. Critical Roles of the Cysteine–Glutathione Axis in the Production of γ-Glutamyl Peptides in the Nervous System. Int. J. Mol. Sci. 2023, 24, 8044. [Google Scholar] [CrossRef]
- Vašková, J.; Kočan, L.; Vaško, L.; Perjési, P. Glutathione-Related Enzymes and Proteins: A Review. Molecules 2023, 28, 1447. [Google Scholar] [CrossRef]
- Diaz-Del Cerro, E.; Martinez de Toda, I.; Félix, J.; Baca, A.; De la Fuente, M. Components of the Glutathione Cycle as Markers of Biological Age: An Approach to Clinical Application in Aging. Antioxidants 2023, 12, 1529. [Google Scholar] [CrossRef]
- Coman, C.; Solari, F.A.; Hentschel, A.; Sickmann, A.; Zahedi, R.P.; Ahrends, R. Simultaneous Metabolite, Protein, Lipid Extraction (SIMPLEX): A Combinatorial Multimolecular Omics Approach for Systems Biology. Mol. Cell. Proteom. 2016, 15, 1453–1466. [Google Scholar] [CrossRef]
- Liu, M.; Feng, L.; Zhang, X.; Hua, Y.; Wan, Y.; Fan, C.; Lv, X.; Wang, H. Superwettable Microwell Arrays Constructed by Photocatalysis of Silver-Doped-ZnO Nanorods for Ultrasensitive and High-Throughput Electroanalysis of Glutathione in Hela Cells. ACS Appl. Mater. Interfaces 2018, 10, 32038–32046. [Google Scholar] [CrossRef]
- Seymour, A.-M.L.; Eldar, H.; Radda, G.K. Hyperthyroidism results in increased glycolytic capacity in the rat heart. A 31P-NMR study. Biochim. Biophys. Acta 1990, 1055, 107–116. [Google Scholar] [CrossRef]
- Wu, Y.; Ran, L.; Yang, Y.; Gao, X.; Peng, M.; Liu, S.; Sun, L.; Wan, J.; Wang, Y.; Yang, K.; et al. Deferasirox alleviates DSS-induced ulcerative colitis in mice by inhibiting ferroptosis and improving intestinal microbiota. Life Sci. 2023, 314, 121312. [Google Scholar] [CrossRef] [PubMed]
- Ibrahim, D.; Khater, S.I.; Sherkawy, H.S.; Elgamal, A.; Hasan, A.A.; Muhammed, A.A.; Farag, M.F.M.; Eissa, S.A.; Ismail, T.A.; Eissa, H.M.; et al. Protective Role of Nano-encapsulated Bifidobacterium breve, Bacilllus coagulans, and Lactobacillus plantarum in Colitis Model: Insights Toward Propagation of Short-Chain Fatty Acids and Reduction of Exaggerated Inflammatory and Oxidative Response. Probiotics Antimicrob. Proteins 2025, in press. [Google Scholar] [CrossRef]
- Wasinger, V.C.; Lu, K.; Yau, Y.Y.; Nash, J.; Lee, J.; Chang, J.; Paramsothy, S.; Kaakoush, N.O.; Mitchell, H.M.; Leong, R.W.L. Spp24 is associated with endocytic signalling, lipid metabolism, and discrimination of tissue integrity for ‘leaky-gut’ in inflammatory bowel disease. Sci. Rep. 2020, 10, 12932. [Google Scholar] [CrossRef] [PubMed]
- Wasinger, V.C.; Curnoe, D.; Boel, C.; Machin, N.; Goh, H.M. The Molecular Floodgates of Stress-Induced Senescence Reveal Translation, Signalling and Protein Activity Central to the Post-Mortem Proteome. Int. J. Mol. Sci. 2020, 21, 6422. [Google Scholar] [CrossRef] [PubMed]
- Schilling, B.; Rardin, M.J.; MacLean, B.X.; Zawadzka, A.M.; Frewen, B.E.; Cusack, M.P.; Sorensen, D.J.; Bereman, M.S.; Jing, E.; Wu, C.C.; et al. Platform-independent and label-free quantitation of proteomic data using MS1 extracted ion chromatograms in skyline: Application to protein acetylation and phosphorylation. Mol. Cell. Proteom. 2012, 11, 202–214. [Google Scholar] [CrossRef] [PubMed]
- McWilliam, H.; Li, W.; Uludag, M.; Squizzato, S.; Park, Y.M.; Buso, N.; Cowley, A.P.; Lopez, R. Analysis Tool Web Services from the EMBL-EBI. Nucleic Acids Res. 2013, 41, W597–W600. [Google Scholar] [CrossRef] [PubMed]
- Muller, F.L.; Lustgarten, M.S.; Jang, Y.; Richardson, A.; Van Remmen, H. Trends in oxidative aging theories. Free. Radic. Biol. Med. 2007, 43, 477–503. [Google Scholar] [CrossRef]


| Matrix. | Count | Application: Metabolomic (M), Proteomic (P) |
|---|---|---|
| Saliva | 50 | P |
| Plasma | 25 | M, P |
| Serum | 25 (16 IBD) | M, P |
| Nasal swab | 12 | P |
Disclaimer/Publisher’s Note: The statements, opinions and data contained in all publications are solely those of the individual author(s) and contributor(s) and not of MDPI and/or the editor(s). MDPI and/or the editor(s) disclaim responsibility for any injury to people or property resulting from any ideas, methods, instructions or products referred to in the content. |
© 2025 by the authors. Licensee MDPI, Basel, Switzerland. This article is an open access article distributed under the terms and conditions of the Creative Commons Attribution (CC BY) license (https://creativecommons.org/licenses/by/4.0/).
Share and Cite
Wasinger, V.C.; Bustamante, S.; Najib, N.; Diwan, A.; Jayasena, T.; Chowdhury, N.S.; Beretov, J.; Schabrun, S. Enzymes Drive Glutathione Shunt to Explain Oxidative State Using an In-Parallel Multi-Omic Method. Int. J. Mol. Sci. 2025, 26, 3632. https://doi.org/10.3390/ijms26083632
Wasinger VC, Bustamante S, Najib N, Diwan A, Jayasena T, Chowdhury NS, Beretov J, Schabrun S. Enzymes Drive Glutathione Shunt to Explain Oxidative State Using an In-Parallel Multi-Omic Method. International Journal of Molecular Sciences. 2025; 26(8):3632. https://doi.org/10.3390/ijms26083632
Chicago/Turabian StyleWasinger, Valerie C., Sonia Bustamante, Nashwa Najib, Ashish Diwan, Tharusha Jayasena, Nahian S. Chowdhury, Julia Beretov, and Siobhan Schabrun. 2025. "Enzymes Drive Glutathione Shunt to Explain Oxidative State Using an In-Parallel Multi-Omic Method" International Journal of Molecular Sciences 26, no. 8: 3632. https://doi.org/10.3390/ijms26083632
APA StyleWasinger, V. C., Bustamante, S., Najib, N., Diwan, A., Jayasena, T., Chowdhury, N. S., Beretov, J., & Schabrun, S. (2025). Enzymes Drive Glutathione Shunt to Explain Oxidative State Using an In-Parallel Multi-Omic Method. International Journal of Molecular Sciences, 26(8), 3632. https://doi.org/10.3390/ijms26083632