Abstract
A novel primer (FaSt-R) targeting the Prunus-specific Falling Stone (FaSt) non-autonomous transposon was combined with start-codon-targeted (SCoT) primers to assess genetic diversity in 12 cultivars from six Prunus species and 28 cultivars of European plum. Compared to SCoT-only analyses, the SCoT–FaSt combination produced fewer total bands but a higher percentage of polymorphic bands, while maintaining comparable values for polymorphism information content, resolving power, gene diversity, and Shannon’s index. SCoT–FaSt markers generated bands across a broader size range, which made gel patterns less dense, enabling the more accurate detection of differentially amplified fragments. Neighbor-joining and principal component analyses confirmed that SCoT–FaSt markers provided sufficient phylogenetic resolution at both interspecific and intraspecific levels. The sequencing of 32 SCoT–FaSt amplicons revealed FaSt elements in 26 fragments, with SCoT primers preferentially annealing to GC-rich exonic and intergenic regions. Seventeen protein-coding and one RNA-coding gene were partially identified, with FaSt elements localized in UTRs and introns of genes with key physiological functions. Comparative analysis indicated a biased distribution of FaSt elements between the Cerasus and Prunus subgenera. In silico findings suggest that FaSt elements are more fragmented in cherry species, potentially contributing to subgeneric divergence. Overall, the SCoT–FaSt marker system is effective for evaluating Prunus genetic diversity, reconstructing phylogenetic relationships, and elucidating the genomic impact of an active Mutator-like transposon.
1. Introduction
The genus Prunus (Rosaceae, subfamily Amygdaloideae) comprises many economically significant temperate fruit trees, including peach [P. persica L. (Batsch)], almond (P. dulcis Mill.), apricot (P. armeniaca L.), sweet cherry (P. avium L.), sour cherry (P. cerasus L.), and European plum (P. domestica L.) [1]. These species provide valuable fresh and processed fruits rich in sugars, minerals, antioxidants, and other bioactive compounds [2]. Traditionally divided into five subgenera based on morphology [3], Prunus is now commonly grouped into three subgenera—Prunus, Cerasus, and Padus—according to molecular evidence [4]. Phylogenomic studies using RAD-seq and genome skimming have clarified the evolutionary relationships within the genus, particularly inflorescence diversification [5]. Inflorescence type correlates with subgenus: Prunus species have solitary flowers, Cerasus have corymbose, and Padus display racemose structures [6]. Most species in Prunus and Cerasus are diploid (e.g., almond, peach, apricot, sweet cherry), although polyploid species also exist, such as tetraploid sour cherry and hexaploid European plum.
The Prunus genus likely originated in eastern Asia around 61 million years ago (Mya) and diversified through climatic and geological shifts that shaped its current distribution [6]. The Cerasus and Prunus lineages diverged approximately 54 Mya. Sour cherry (P. cerasus) is an allotetraploid hybrid of P. fruticosa and P. avium [7,8], while apricot and plums, including European plum (P. domestica), diverged from a common ancestor about 35–40 Mya [6]. P. domestica likely arose from hybridization between P. cerasifera and P. spinosa, though its hexaploid genome complicates precise parentage resolution [9]. Peach and almond, which diverged 8–5.8 Mya, share a common ancestor and differentiated under contrasting water availability conditions in Central Asia [10,11,12].
Various molecular marker systems have been used to assess genetic diversity in fruit trees. PCR-based techniques, such as amplified fragment length polymorphism (AFLP), random amplified polymorphic DNA (RAPD), inter-simple sequence repeat (ISSR), and especially microsatellite (SSR) markers, have largely replaced hybridization-based methods. SSRs have been extensively applied in Prunus genetic studies [13,14,15,16,17,18] due to their codominant nature. However, as they are primarily located in non-coding genomic regions, their association with phenotypic traits is often limited [19].
Start-codon-targeted (SCoT) markers have recently emerged as a promising tool for analyzing genetic relationships, particularly due to their simplicity, high polymorphism, and ability to target coding regions using single primers [20]. Despite their advantages, SCoT markers remain underutilized in Prunus research. Limited studies have demonstrated their potential: SCoT analysis revealed high genetic diversity in P. sibirica populations in Inner Mongolia [21], while Thakur et al. [22] found SCoT markers to have the highest polymorphic information content compared to RAPD and ISSR in Japanese plum. Similarly, Atapour et al. [23] reported strong discriminatory power in P. avium genotypes using 12 SCoT markers.
Transposable elements (TEs) are broadly classified into Class I (retrotransposons) and Class II (DNA transposons) [24]. Class I elements propagate via an RNA intermediate using a “copy-and-paste” mechanism, often accumulating in high copy numbers within repetitive genomic regions. In contrast, the less abundant Class II elements move via a “cut-and-paste” process, relying on a transposase enzyme, terminal inverted repeats (TIRs), and target site duplications (TSDs) [25]. Miniature inverted-repeat transposable elements (MITEs) are non-autonomous Class II elements characterized by small size (≤600 bp), conserved TIRs, A/T-rich sequences, and specific TSDs [24]. Despite lacking coding potential, MITEs often reach copy numbers exceeding those of their autonomous counterparts [26].
Advances in high-throughput sequencing have enabled detailed analysis of repetitive elements in Prunus genomes. In P. persica, transposable elements (TEs) comprise 29.6% of the genome, including 18.6% long terminal repeat (LTR) retrotransposons and 9.1% DNA transposons [27]. Similarly, P. mume contains 27.8% LTRs and 8.5% DNA transposons [28], while P. avium has 6.4% LTRs and 2.6% DNA elements [29]. In P. dulcis cv. ‘Texas’ (v3.0), TEs account for 33.0% of the genome, with 24.3% retrotransposons and 8.7% DNA transposons [26].
Due to their abundance in plant genomes, retrotransposons have been the primary targets for TE-based molecular markers, including inter-retrotransposon amplified polymorphism (IRAP) and inter-primer binding site (iPBS) amplification [30,31]. These markers detect LTR insertion polymorphisms and are typically dominant. DNA transposons, by contrast, are less frequently targeted. Their detection has been enabled by transposon display (TD), a modified AFLP approach, with miniature inverted-repeat transposable elements (MITEs) commonly used in MITE-TD. However, TE-based marker applications in Prunus remain limited and have thus far focused exclusively on retrotransposon-derived systems [32,33,34].
A MITE named Falling Stones (FaSt) was identified in Prunus armeniaca [35]. With a length of 349 bp, 82 bp TIRs, and 9 bp TSDs, FaSt is likely a member of the Mutator transposon superfamily. It preferentially accumulates in AT-rich, gene-dense regions across all peach chromosomes. Functionally, FaSt insertions have been implicated in the breakdown of self-incompatibility in apricot. Specifically, a nested insertion into the S-haplotype-specific F-box gene led to the breakdown of self-incompatibility, while another insertion at the M-locus disulfide bond A-like gene in self-compatible cultivars ‘Canino’ and ‘Katy’ resulted in the disruption of the open reading frame and consequent self-compatibility [36].
While SCoT markers have gained popularity for detecting sequence variation in coding regions, their single-primer design poses certain limitations. Given that the FaSt transposon preferentially inserts within or near genes in the Prunus genome, we investigated whether combining SCoT and FaSt-specific primers could enhance marker efficiency. This study compared the polymorphism levels and amplicon sizes generated by SCoT or FaSt primers, and their combinations across multiple Prunus species and a diverse set of P. domestica cultivars. Our objectives were to assess the utility of SCoT–FaSt marker combinations for evaluating genetic diversity, resolving phylogenetic relationships, and to determine the genomic regions targeted by these markers through the cloning and sequencing of selected amplicons.
2. Results
2.1. Rationale and Basic Concept
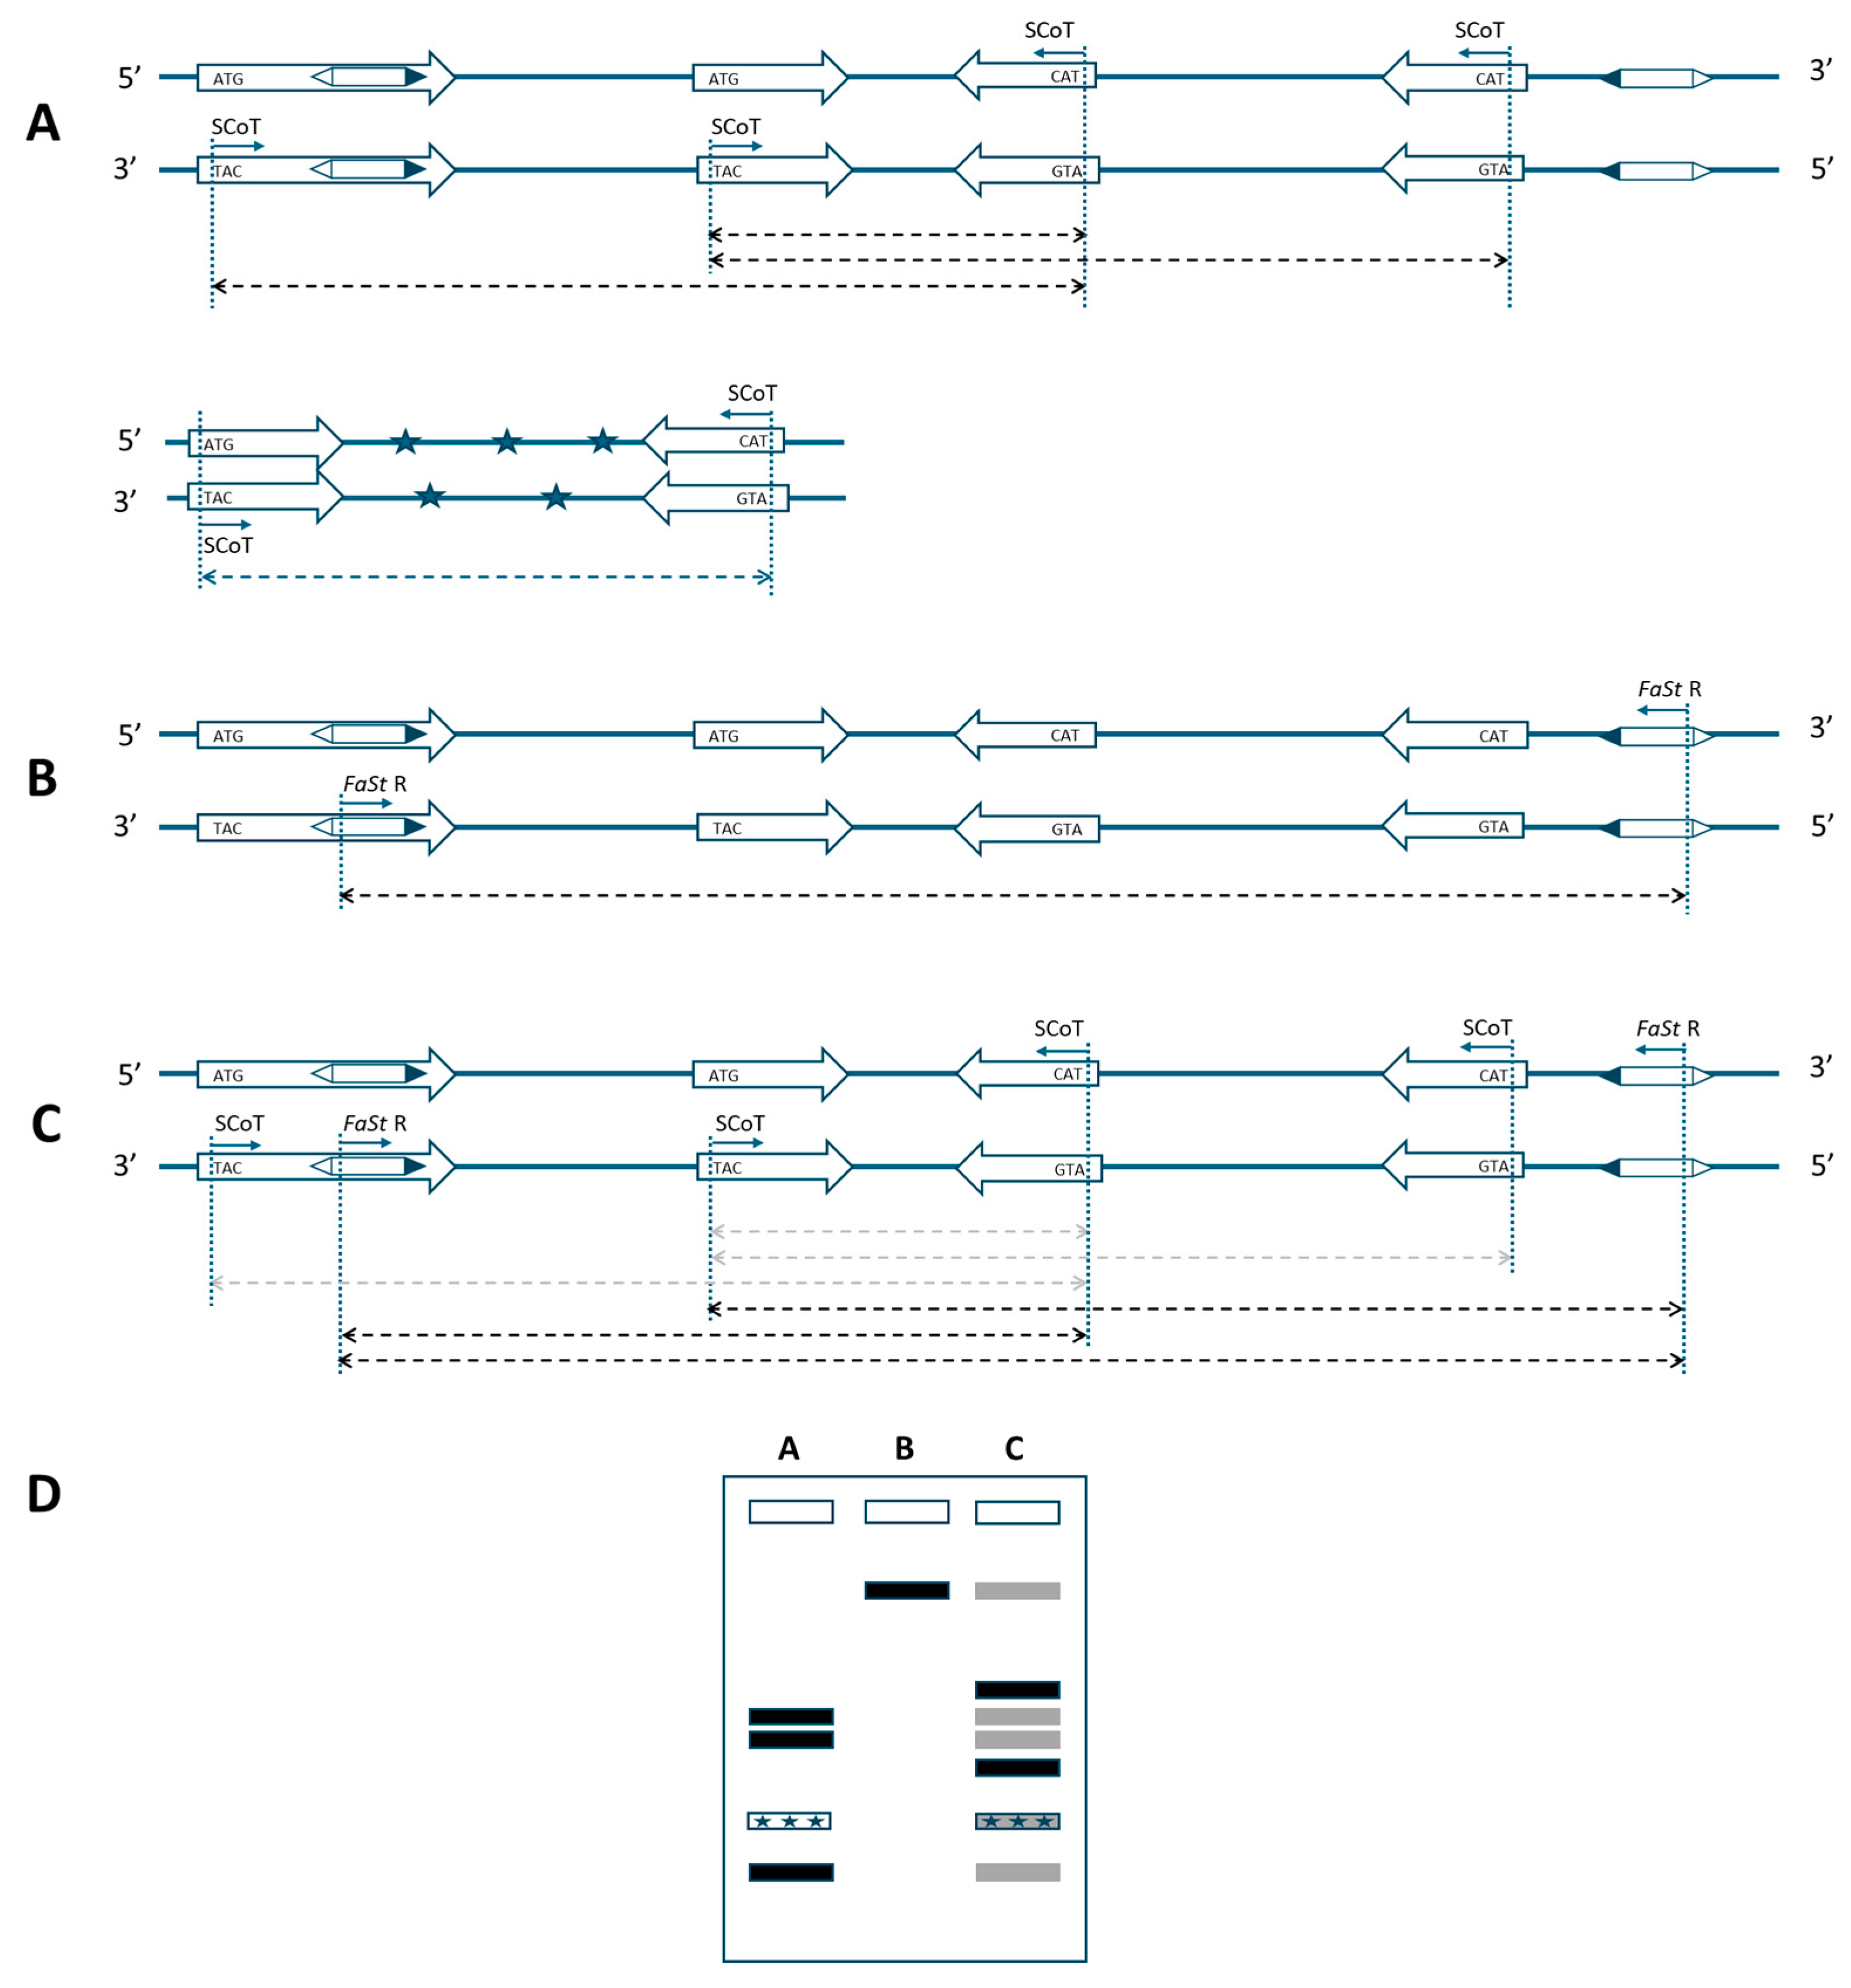
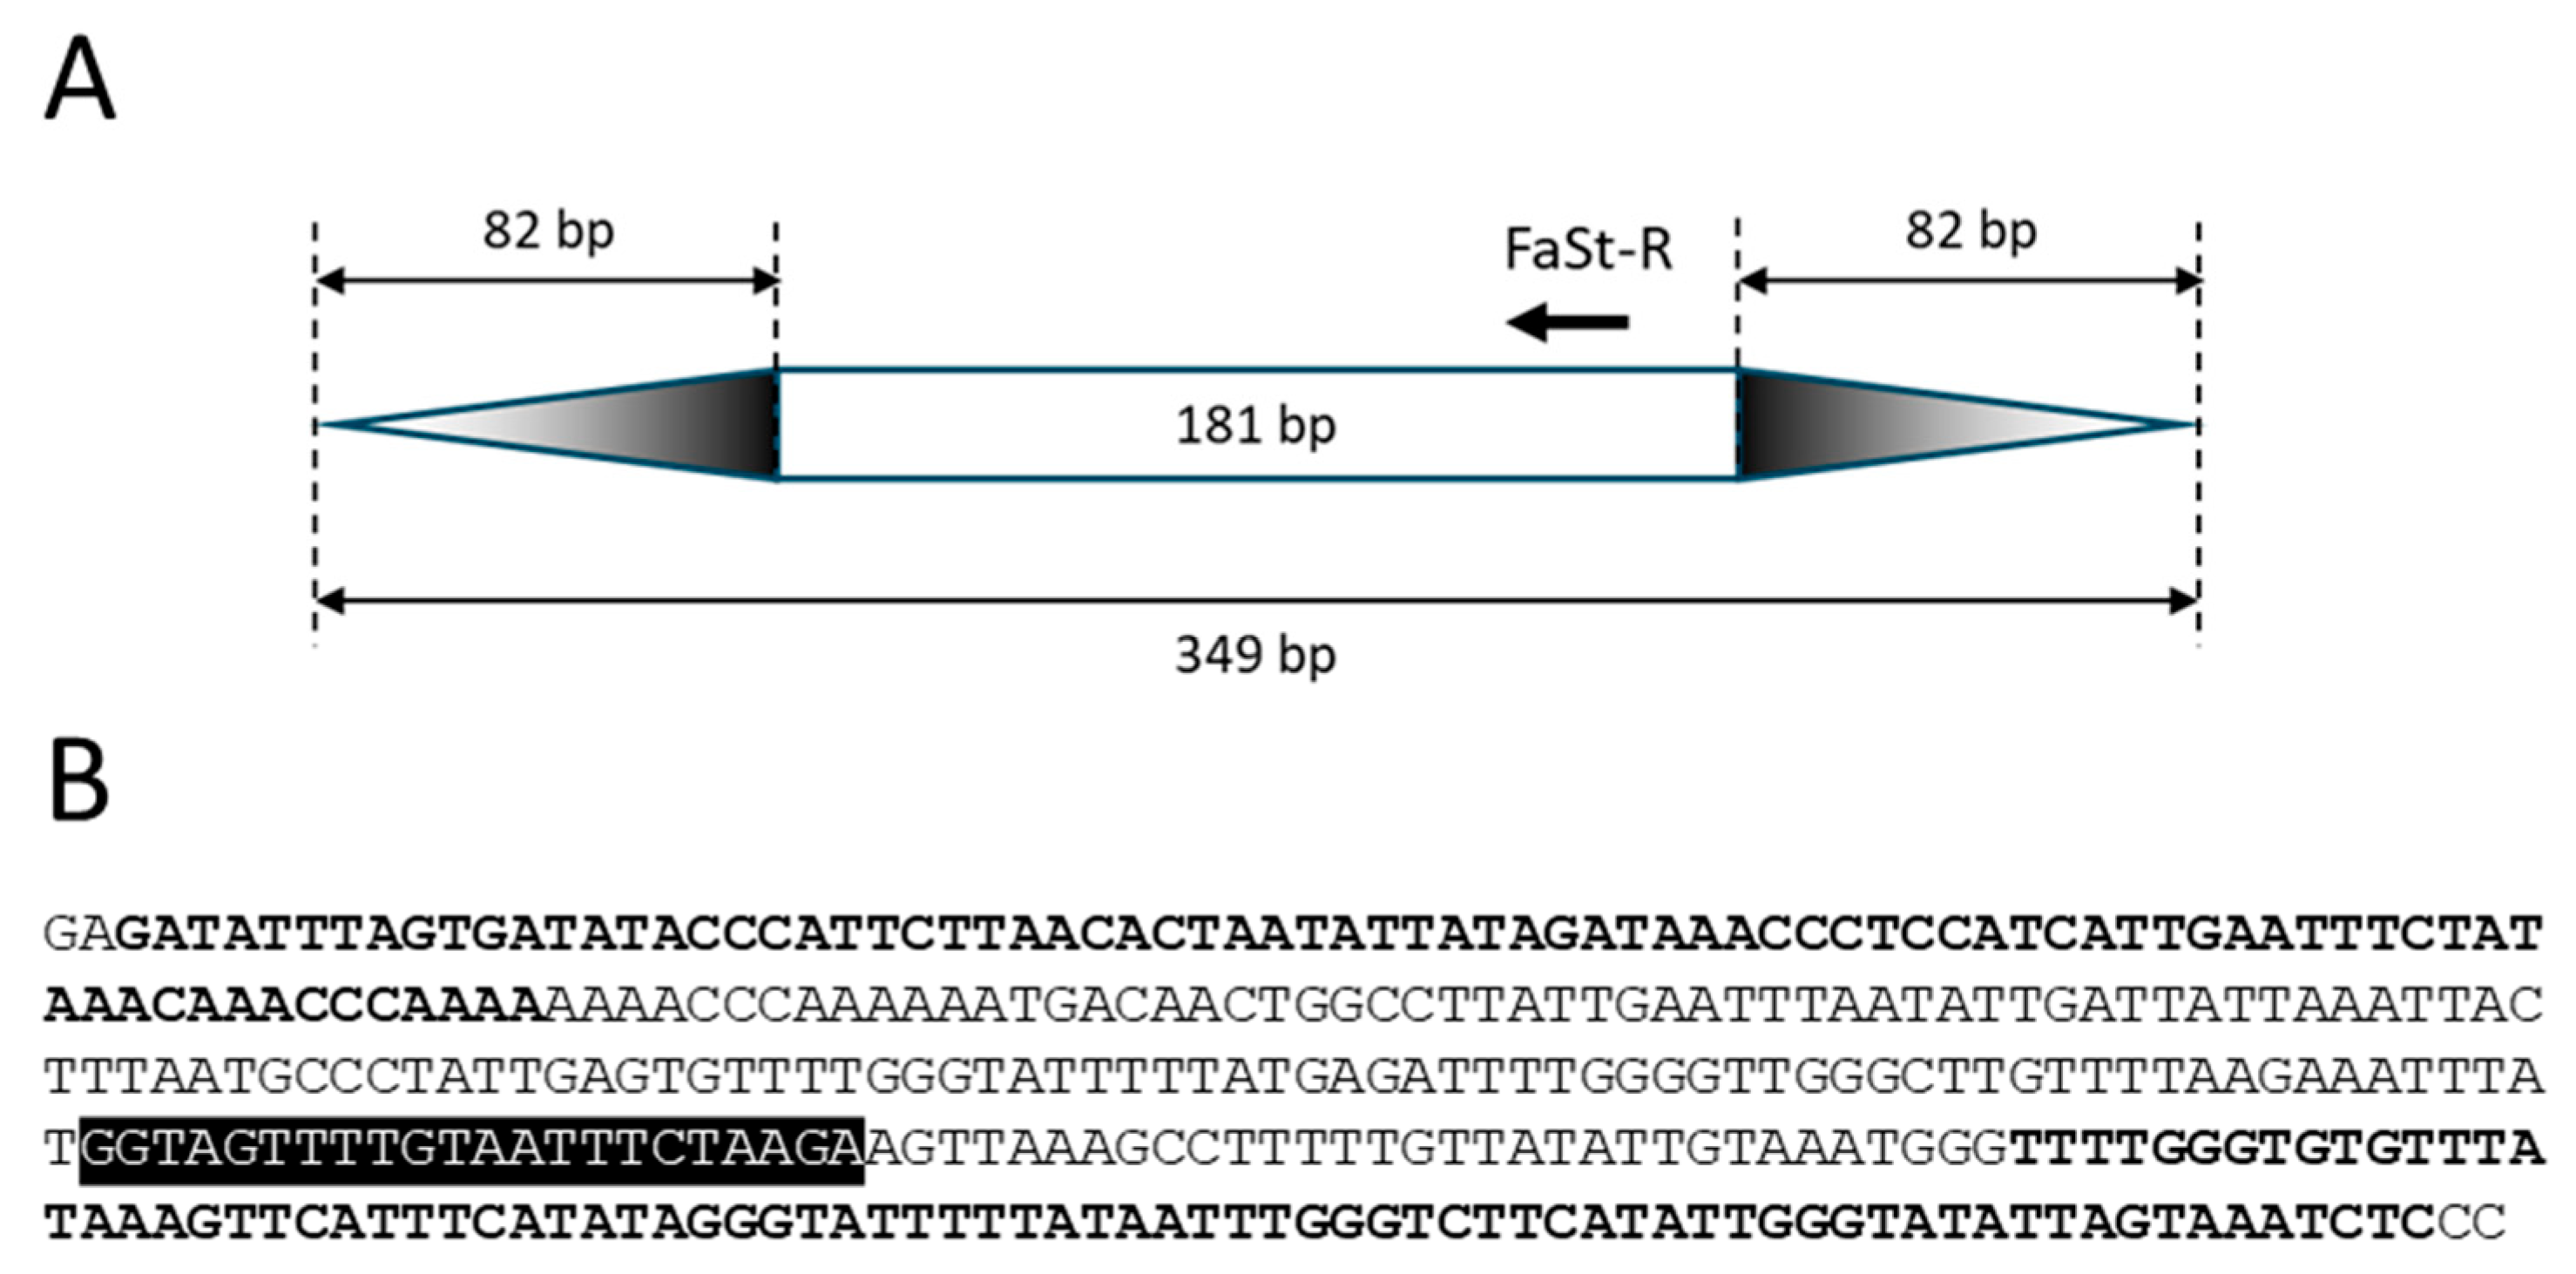
Single SCoT primers only enable amplification when two genes are positioned within a suitable distance and in opposite orientation (Figure 1A). This constraint also applies to the FaSt-R primer developed in this study. The 349 bp FaSt element comprises two terminal inverted repeats (TIRs) of 82 bp each, which were intentionally avoided during primer design to prevent the amplification of a single dominant band from the numerous FaSt copies in the Prunus genome. Instead, the FaSt-R primer was designed to target a 22-nucleotide region between positions 212 and 233 within the internal sequence of the FaSt element (Figure 2). Owing to the high copy number and variable orientation of FaSt insertions across the Prunus genome, the FaSt-R primer can also function effectively in a single-primer PCR assay (Figure 1B).
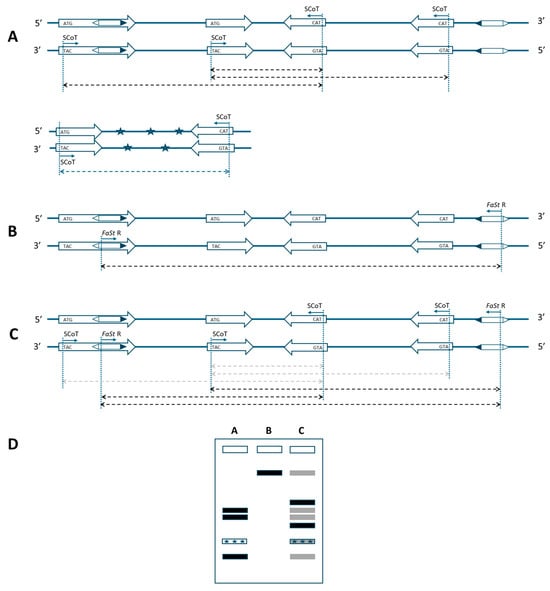
Figure 1.
Schematic representation of a marker system based on start-codon-targeted (SCoT) and Falling Stones (FaSt)-specific primers for Prunus species. (A) Amplification in the original SCoT assay requires two genes in opposite orientation within an amplifiable distance. (B) A single FaSt-R primer can also yield amplicons under similar conditions, due to the high copy number and varied orientation of FaSt elements. (C) The combination of SCoT and FaSt-R primers can amplify fragments if a FaSt element is located in the proper orientation near a gene. As FaSt-R is sequence-specific, SCoT–FaSt combinations are expected to outperform the consensus SCoT-only assays and also amplify more reliably than primers annealing to the distantly located FaSt elements (weak amplification indicated by gray arrows). Thick arrows: genes in 5′ to 3′ orientation; hexagons: FaSt elements with black triangles marking the 5′ end; thin arrows: primer annealing sites; dashed arrows: expected amplicons; asterisks: non-target DNA. (D) Representative banding patterns from the described PCR strategies. Gray bands indicate weak or undetectable amplification.

Figure 2.
Structure and sequence of the Prunus armeniaca Falling Stone (FaSt) transposon (KF956794). (A) Schematic representation of the non-autonomous FaSt element, with structural motifs shown to scale. Terminal inverted repeats (TIRs) are indicated by gradient-colored triangles, and the annealing site and 5′→3′ orientation of the FaSt-R primer are marked with an arrow. (B) Nucleotide sequence of the FaSt element. TIRs are highlighted in bold, and the FaSt-R primer binding site is shown against a black background.
When combined, SCoT and FaSt-R primers are expected to preferentially amplify genomic regions located between genes and nearby FaSt elements, as the FaSt-R primer specifically anneals to unique internal regions of FaSt copies (Figure 1C). Although amplification with individual SCoT or FaSt primers may remain possible, fragments amplified more efficiently by the combined approach may predominate, while weaker products become depleted. The sequence specificity of the FaSt-R primer also reduces the likelihood of amplifying contaminating DNA, as FaSt elements are exclusively found in Prunus (Figure 1A). Given the preferential localization of FaSt elements in introns and untranslated regions (UTRs), the combined strategy may also result in shorter amplicon sizes.
2.2. Amplification Efficiency of SCoT, FaSt-R, and Combined Primer Sets
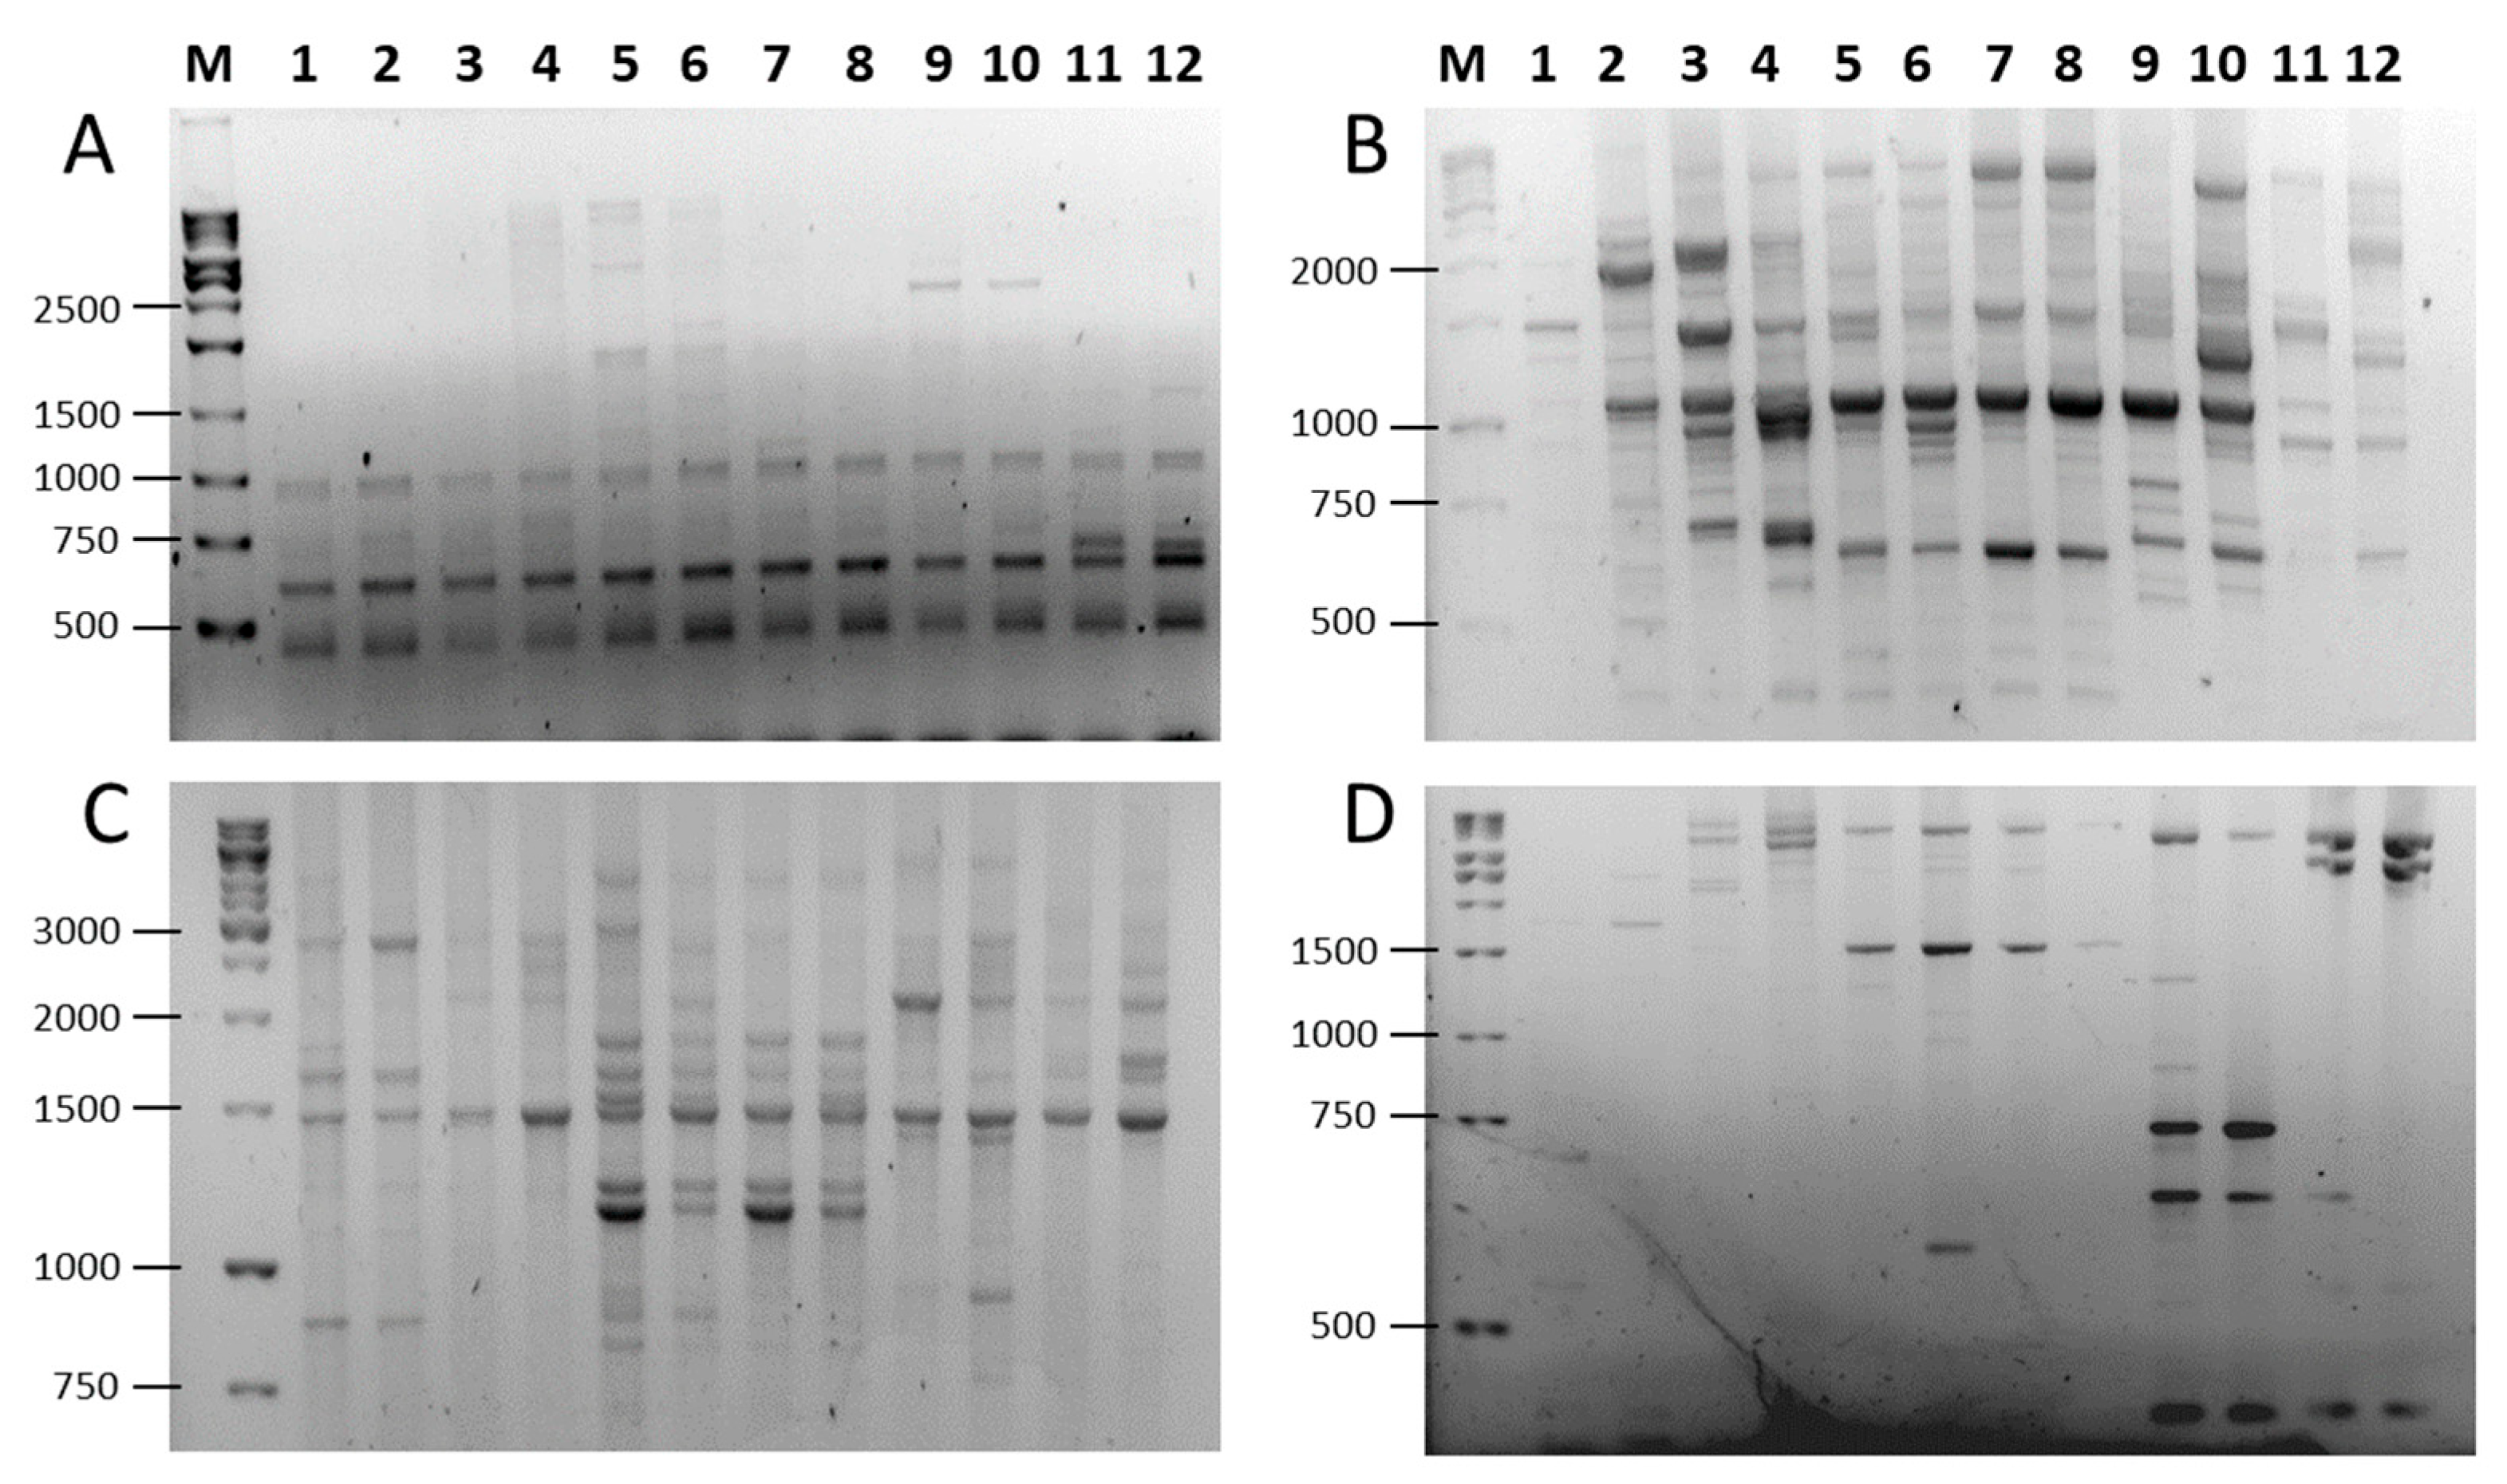
To assess the amplification efficiency of SCoT, FaSt-R, and their combinations, we analyzed two cultivars from each of six Prunus species (P. persica, P. dulcis, P. armeniaca, P. avium, P. cerasus, and P. domestica). We used 19 SCoT primers in single-primer assays. The FaSt-R primer was also tested independently and in combination with each SCoT primer. In many cases, the inclusion of FaSt-R improved the clarity and quality of banding patterns (Figure 3). For instance, while SCoT 23 alone produced largely monomorphic fragments (Figure 3A), the addition of FaSt-R increased the percentage of polymorphic bands (Figure 3C). Similarly, SCoT 27 generated numerous weak and diffuse bands (Figure 3B), but its combination with FaSt-R yielded fewer, yet more intense and clearly resolved bands, which were easier to interpret (Figure 3D).
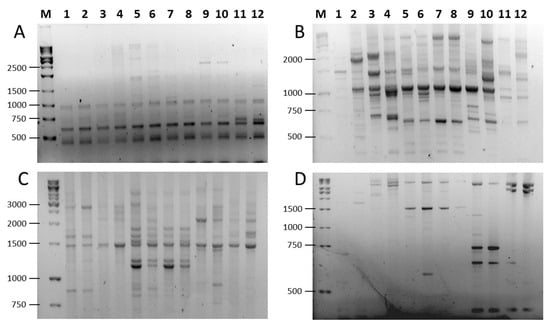
Figure 3.
PCR amplification patterns in six Prunus species using SCoT and combined SCoT (forward) and FaSt-R (reverse) primers. (A) SCoT23 alone; (B) SCoT23 and FaSt-R; (C) Scot27 alone; (D) SCoT27 and FaSt-R. Lanes are labeled as follows: (M) GeneRuler 1 kb DNA ladder, P. armeniaca (1) ‘Ceglédi óriás’ and (2) ‘Gönci magyar kajszi’; P. dulcis (3) ‘Tuono’ and (4) ‘Tétényi keményhéjú’; P. cerasus (5) ‘Kántorjánosi 3′ and (6) ‘Feketicsi meggy’; P. avium (7) ‘Canada giant’ and (8) ‘Katalin’; P. persica (9) ‘Collins’ and (10) ‘Condor’ P. domestica (11) ‘Toptaste’ and (12) ‘Haroma’.
The use of the FaSt-R primer alone yielded the lowest values across all evaluated parameters, including total number of scorable bands (TNB), number of distinct band sizes (NDB), percentage of polymorphic bands (PPB), resolving power (Rp), Nei’s gene diversity (h), and Shannon’s information index (I) (Table 1). Additionally, the smallest fragment amplified by FaSt-R alone was 700 bp, substantially larger than the minimum fragment sizes observed for SCoT alone (250 bp) and SCoT–FaSt combinations (150 bp). SCoT-only assays produced the highest average TNB, percentage of amplicons ≤1000 bp, and Rp values. In contrast, while the SCoT–FaSt combinations resulted in slightly lower TNB values, they exhibited considerably higher PPB. The values of NDB, polymorphism information content (PIC), h, and I were comparable between SCoT and SCoT–FaSt assays.

Table 1.
Summary of statistical parameters obtained from 19 SCoT primers, the FaSt-R primer, and their combinations across 12 cultivars representing six Prunus species.
TNB was higher for 14 of the 19 SCoT primers compared to the corresponding SCoT–FaSt combinations, improving gel evaluation. In cases with fewer bands, band intensity and sharpness were improved, as observed for SCoT 27-FaSt-R (Figure 3D). Although the average percentage of amplicons ≤1000 bp was higher for SCoT primers than for the SCoT–FaSt combinations, two primers (SCoT 7 and SCoT 11) produced small amplicons only when combined with FaSt-R. Additionally, six primers (SCoT 2, 13, 19, 21, 22, and 34) showed a significant increase in the number of small amplicons when paired with FaSt-R. The PPB remained at 100% for two SCoT primers and increased for all but two primers (SCoT 13 and 24) when combined with FaSt-R. The inclusion of FaSt-R decreased the PIC for 12 SCoT primers, with reductions ranging from 3% to 25%, while the remaining primers exhibited a slight increase in PIC. The Rp, h and I increased for 7 of the 19 SCoT primers when combined with FaSt-R. Notably, the addition of FaSt-R led to substantial improvements in some cases, such as a 339% increase in Rp for SCoT 11 and a 50% increase in h for SCoT 2.
2.3. Phylogenetic Analysis of Prunus Using SCoT–FaSt Markers
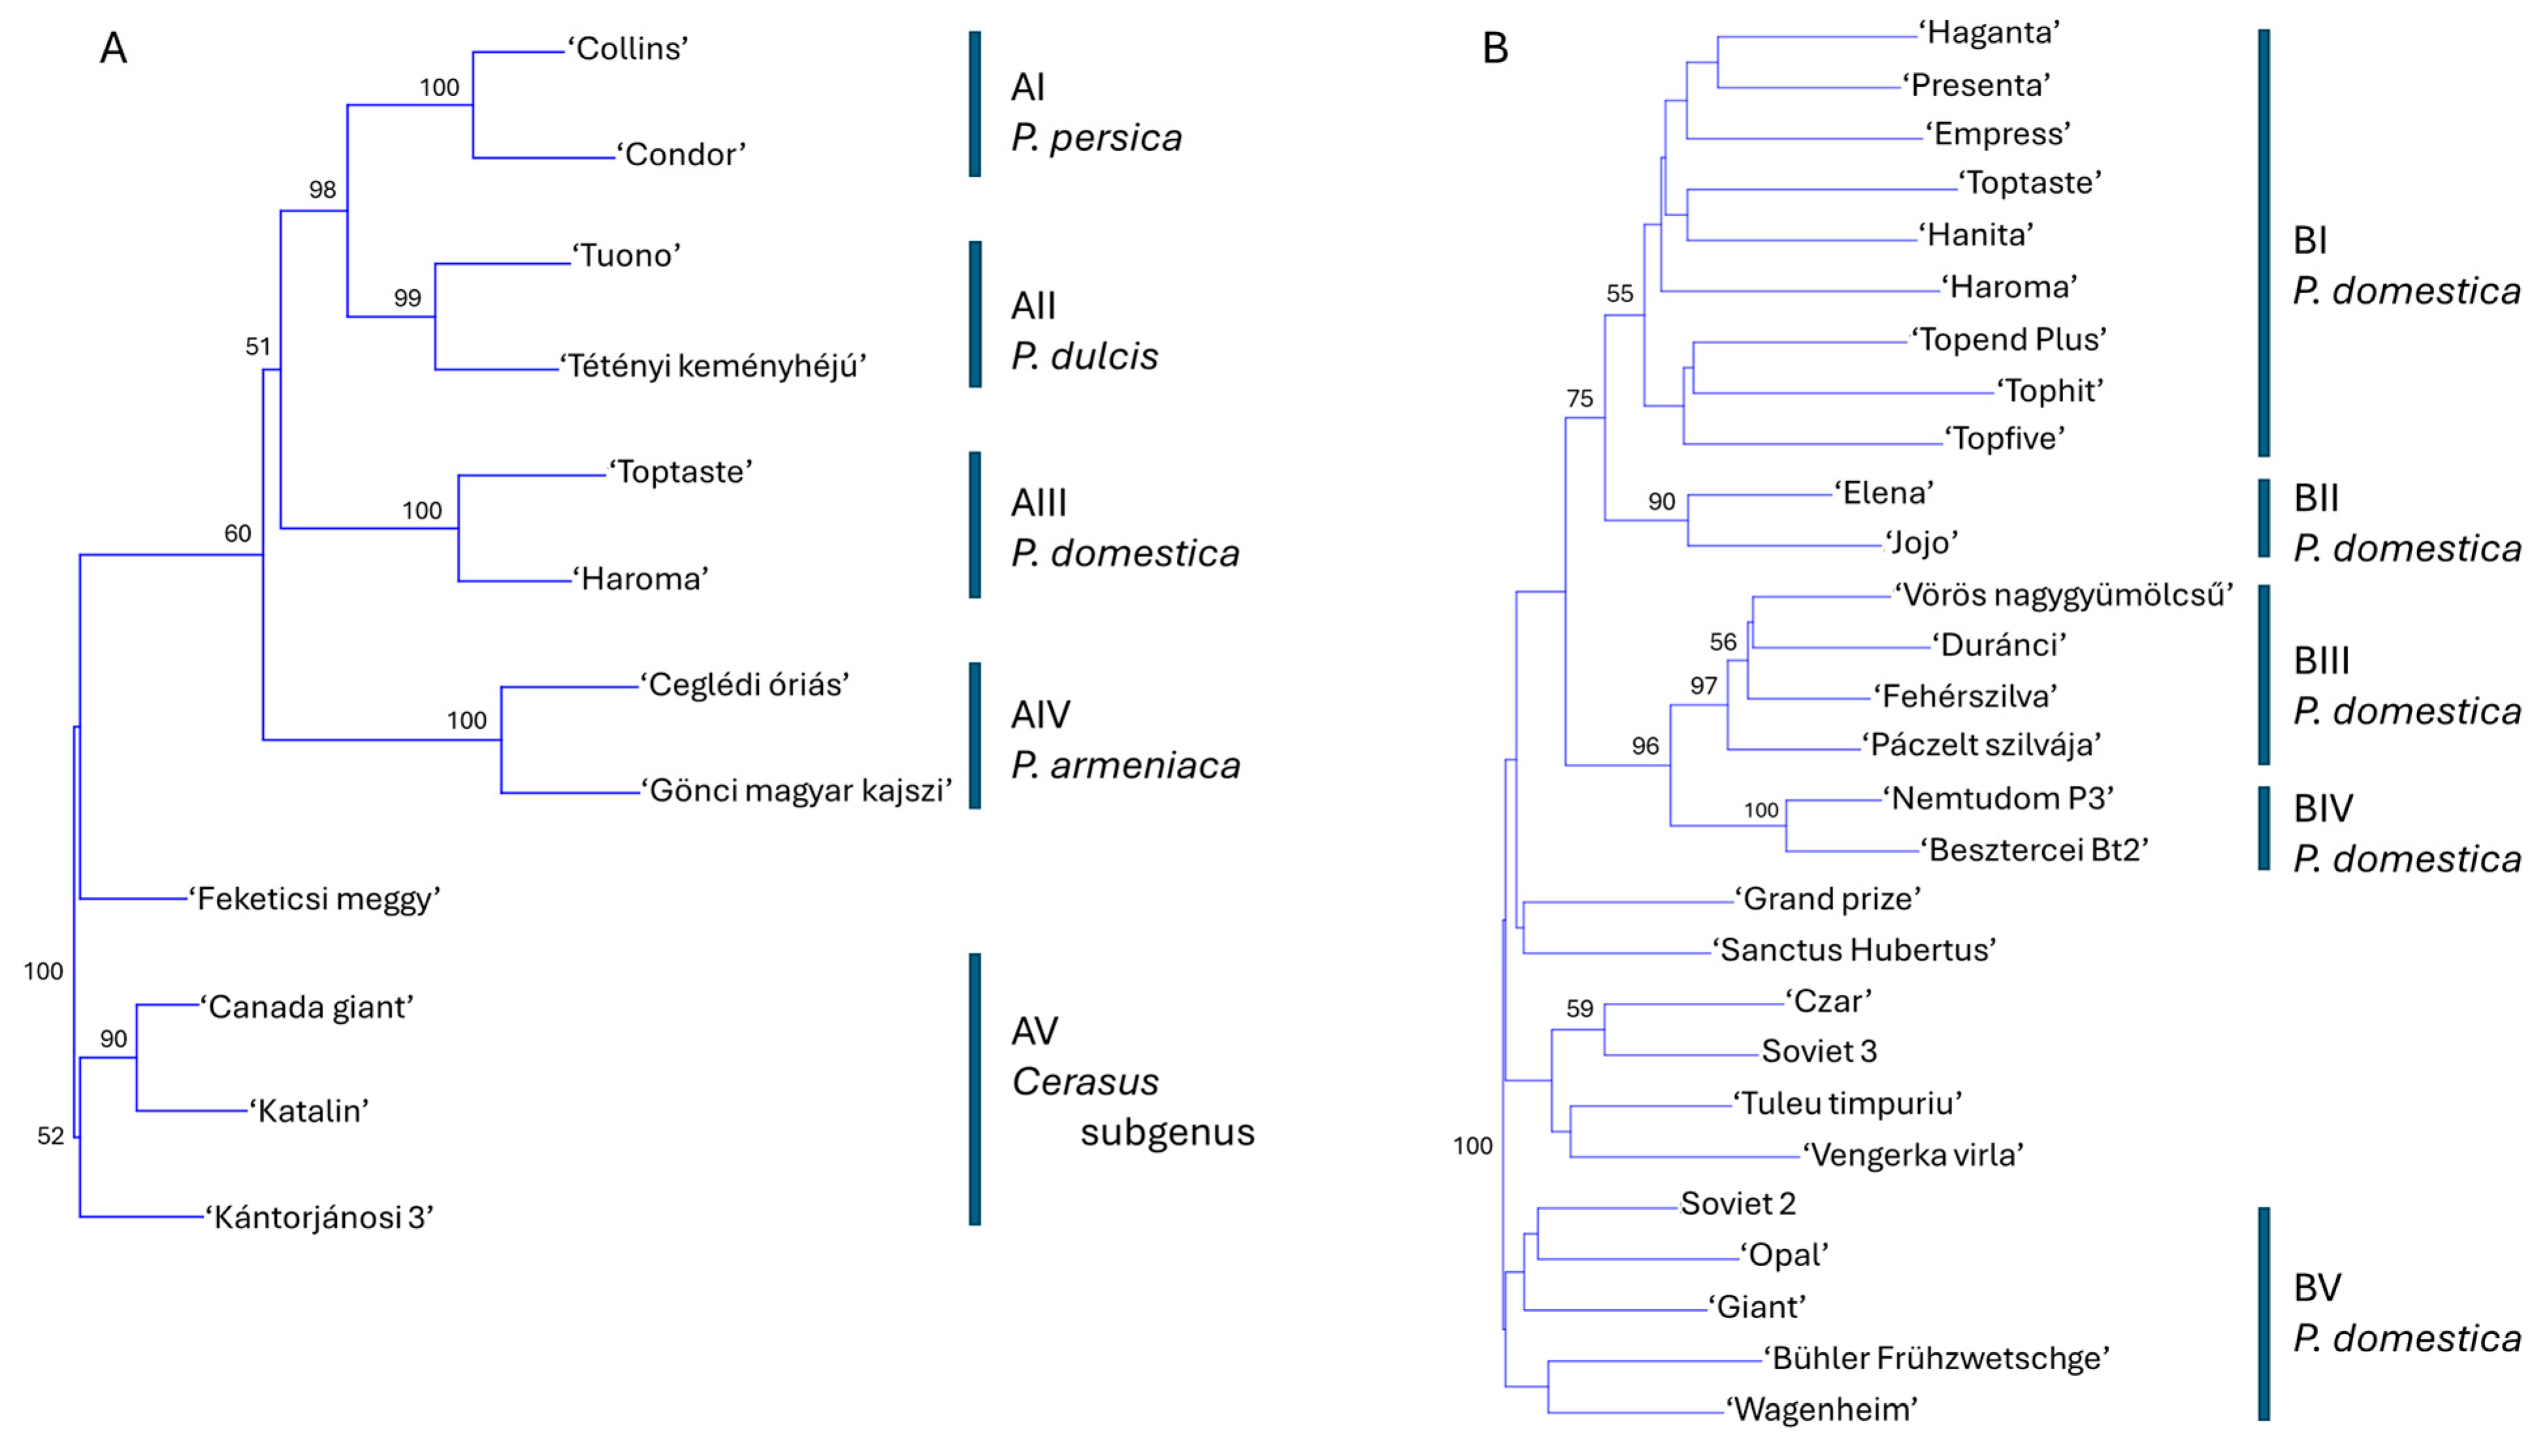
A phylogenetic tree was constructed using data from 19 SCoT–FaSt marker combinations to evaluate the genetic relationships among 12 cultivars representing six Prunus species. The analysis yielded five major clusters, each supported by 95–100% bootstrap values, corresponding to P. persica (AI), P. dulcis (AII), P. domestica (AIII), P. armeniaca (AIV), and species within the Cerasus subgenus (AV) (Figure 4A). Within the Cerasus cluster, P. avium cultivars formed a well-supported subgroup, while ‘Feketicsi meggy’ was positioned separately. Notably, the P. persica and P. dulcis clusters formed a joint group with high bootstrap support, indicating closer genetic relatedness to each other than to P. domestica, P. armeniaca, or the Cerasus species. Higher ploidy levels in P. cerasus and P. domestica did not correspond with an increased number of detected alleles compared to diploid species. A similar phylogenetic analysis was performed using data from the SCoT-only assay (Figure S1). While the overall tree structure was comparable, a key difference emerged: P. persica and P. dulcis did not cluster together. Instead, P. persica appeared more closely related to P. domestica in this analysis.

Figure 4.
Phylogenetic analysis of Prunus based on data from 19 SCoT–FaSt primer combinations using the neighbor-joining method and Jaccard’s similarity coefficients. (A) Twelve cultivars representing six Prunus species: P. dulcis, P. armeniaca, P. domestica, P. persica, and members of the Cerasus subgenus (P. avium and P. cerasus). (B) Twenty-eight P. domestica cultivars. Bootstrap values (≥50%) from 1000 replicates are shown at the corresponding nodes. Groups AI–AV and BI–BV denote statistically supported clusters of cultivars.
Given the robustness of the evolutionary inferences derived from the SCoT–FaSt amplification patterns, we extended the analysis to include SCoT–FaSt amplicon data from 28 P. domestica cultivars (Figure 4B; Figure S2). The resulting phylogenetic tree revealed five major clusters. Cluster BI comprised modern German cultivars along with several of their progenitors used in their breeding programs. Cluster BII contained two offspring of the cultivar ‘Stanley’. Clusters BIII and BIV shared a common origin and encompassed all Hungarian landraces. Cluster BV included older cultivars from Germany, Russia, Sweden, and the USA. An additional statistically unsupported cluster contained cultivars from the UK, Russia, and Romania.
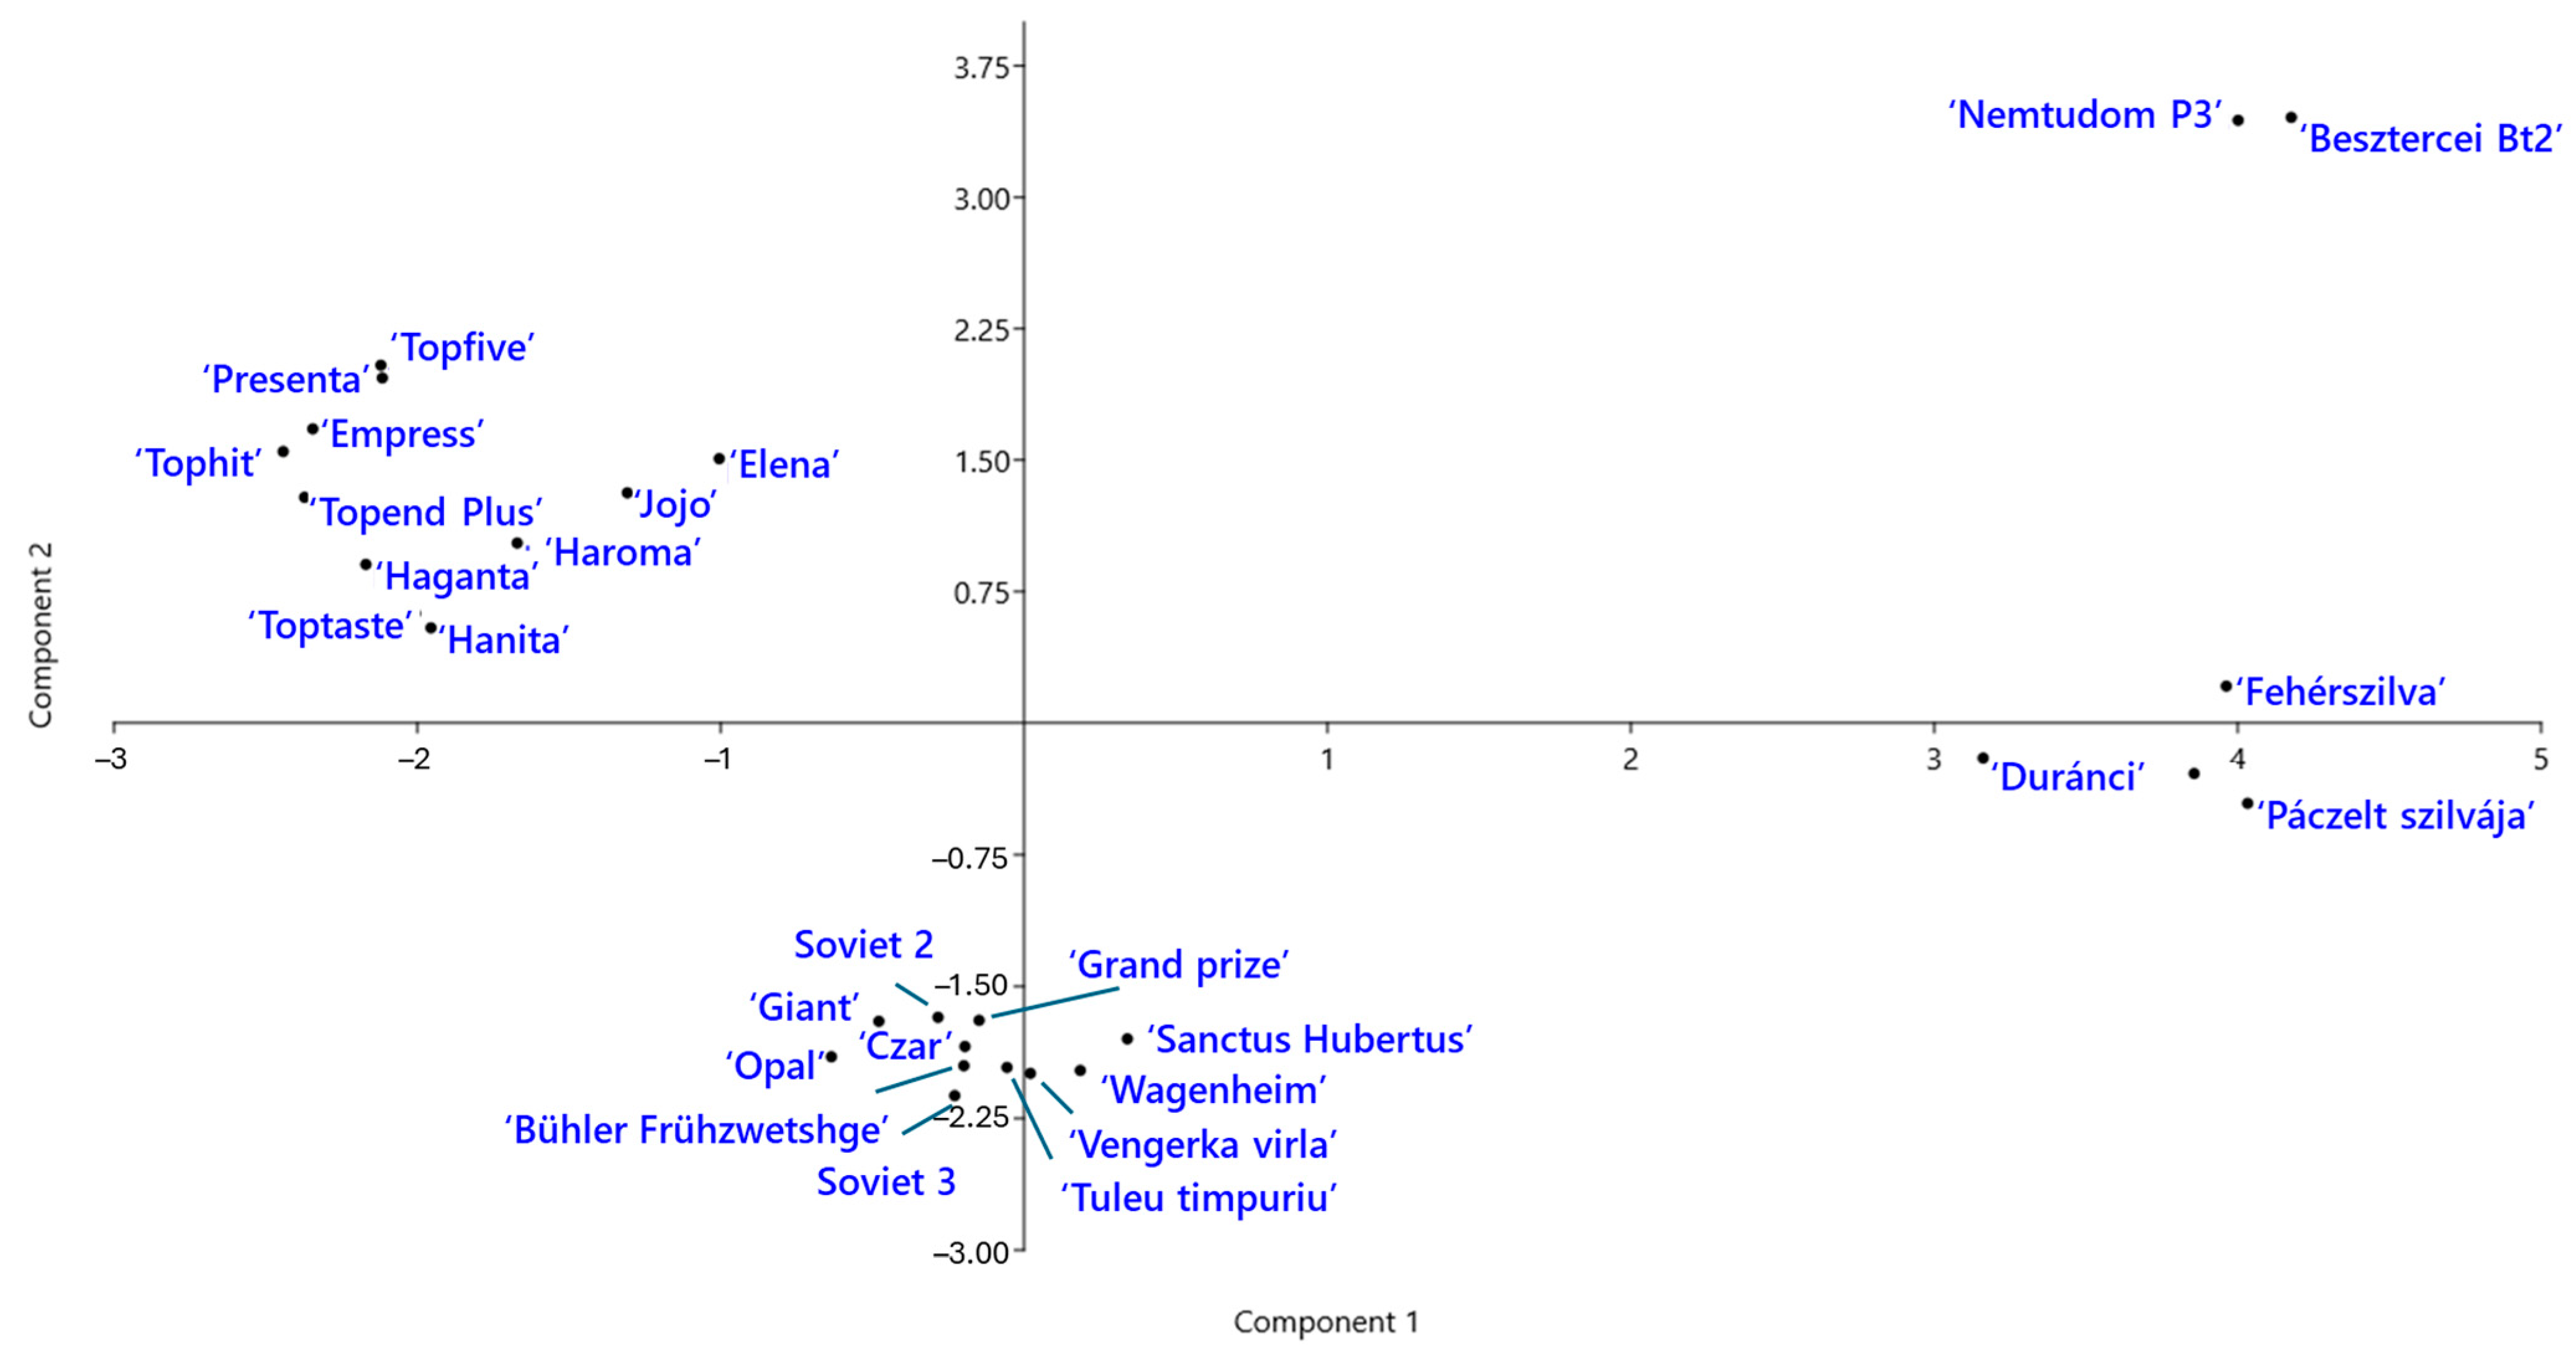
Genetic relationships among the P. domestica cultivars were further explored using principal component analysis (PCA) (Figure 5). The first two components explained 23.8% and 14.8% of total genetic variation, respectively. The PCA plot revealed four distinct groups of cultivars. ‘Jojo’ and ‘Elena’ clustered with the modern German cultivars, suggesting genetic similarity. Notably, the two Hungarian landraces, ‘Besztercei Bt2’ and ‘Nemtudom P3’, were located near each other but clearly separated from the remaining Hungarian landraces along the second principal component.
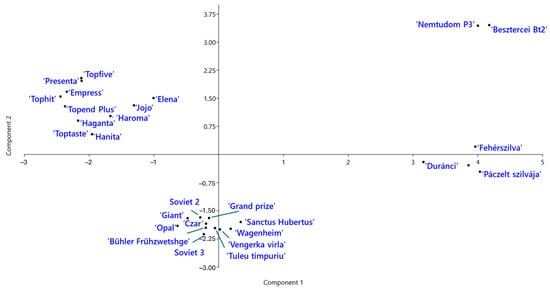
Figure 5.
Principal component analysis (PCA) of Prunus domestica cultivars based on SCoT–FaSt marker data. The plot shows the distribution of cultivars of different origins along the first two principal components.
2.4. Sequence Analysis of the Amplified Fragments
To determine whether the amplified fragments contained recognizable FaSt elements and genic regions, a subset of amplicons was cloned and sequenced. A total of 32 sequences were submitted to the National Center for Biotechnology Information (NCBI) GenBank under accession numbers PQ869779–PQ869809. These sequences were generated using the FaSt-R primer in combination with the following SCoT primers: SCoT1 (2 sequences), SCoT2 (4), SCoT3 (2), SCoT4 (8), SCoT16 (1), SCoT19 (1), SCoT21 (1), SCoT22 (7), SCoT32 (3), and SCoT33 (3). The cloned fragments originated from the following Prunus species: P. domestica (11 fragments), P. cerasus (9), P. dulcis (8), P. persica (2), P. avium (1), and P. armeniaca (1).
Among the 32 sequenced fragments, 26 contained a recognizable FaSt element (58 to 218 bp). In six sequences, the FaSt-R primer annealed to a degenerate complementary region not associated with a FaSt element. In these cases, the primer binding sites were located within the 3′ untranslated region (UTR) in four sequences (Pcer_KJ_2_1227, Pcer_FM_2_1227, Pcer_KJ_4_965, and Pdom_EL_4_766), and within introns in two sequences (Pcer_KJ_4_662 and Pdom_TT_21_269). These sequences were associated with genes encoding proteins such as β-D-glucosyl crocetin β-1,6-glucosyltransferase, peroxidase N1, methyltransferase PMT10, deoxyloganetin glucosyltransferase, and WUSCHEL-related homeobox 9.
Of the 26 identified FaSt elements, 11 were located within genic regions, specifically in the 5′ UTR (Pdom_1-TF-907, Pdom_BB_1_908, and Pdul_TU_3_544), 3′ UTR (Pdom_NT_22_873 and Pdom_HR_32_1224), or introns (Pdul_TK_4_761, Pdul_TK_22_901, Pcer_KJ_4_1000, Pcer_FM_4_496, Pdom_NT_22_334, and Pdom_HR_33_1460). They exhibited significant homology (E values ranging from 0.0 to 7 × 10⁻¹⁴) to genes encoding polygalacturonase, inositol 2-dehydrogenase/D-chiro-inositol 3-dehydrogenase, BTB/POZ domain-containing protein, pectinesterase, DEAD-box ATP-dependent RNA helicase 52C, ethylene-responsive transcription factor, glycosyltransferase, β-D-glucosyl crocetin β-1,6-glucosyltransferase, leaf rust 10 disease resistance locus receptor-like protein kinase, and one uncharacterized protein (Table S1). One FaSt element (Pcer_FM_4_1056) was located near a U1 spliceosomal RNA coding gene and the remaining 15 FaSt elements were in intergenic regions (Table S1).
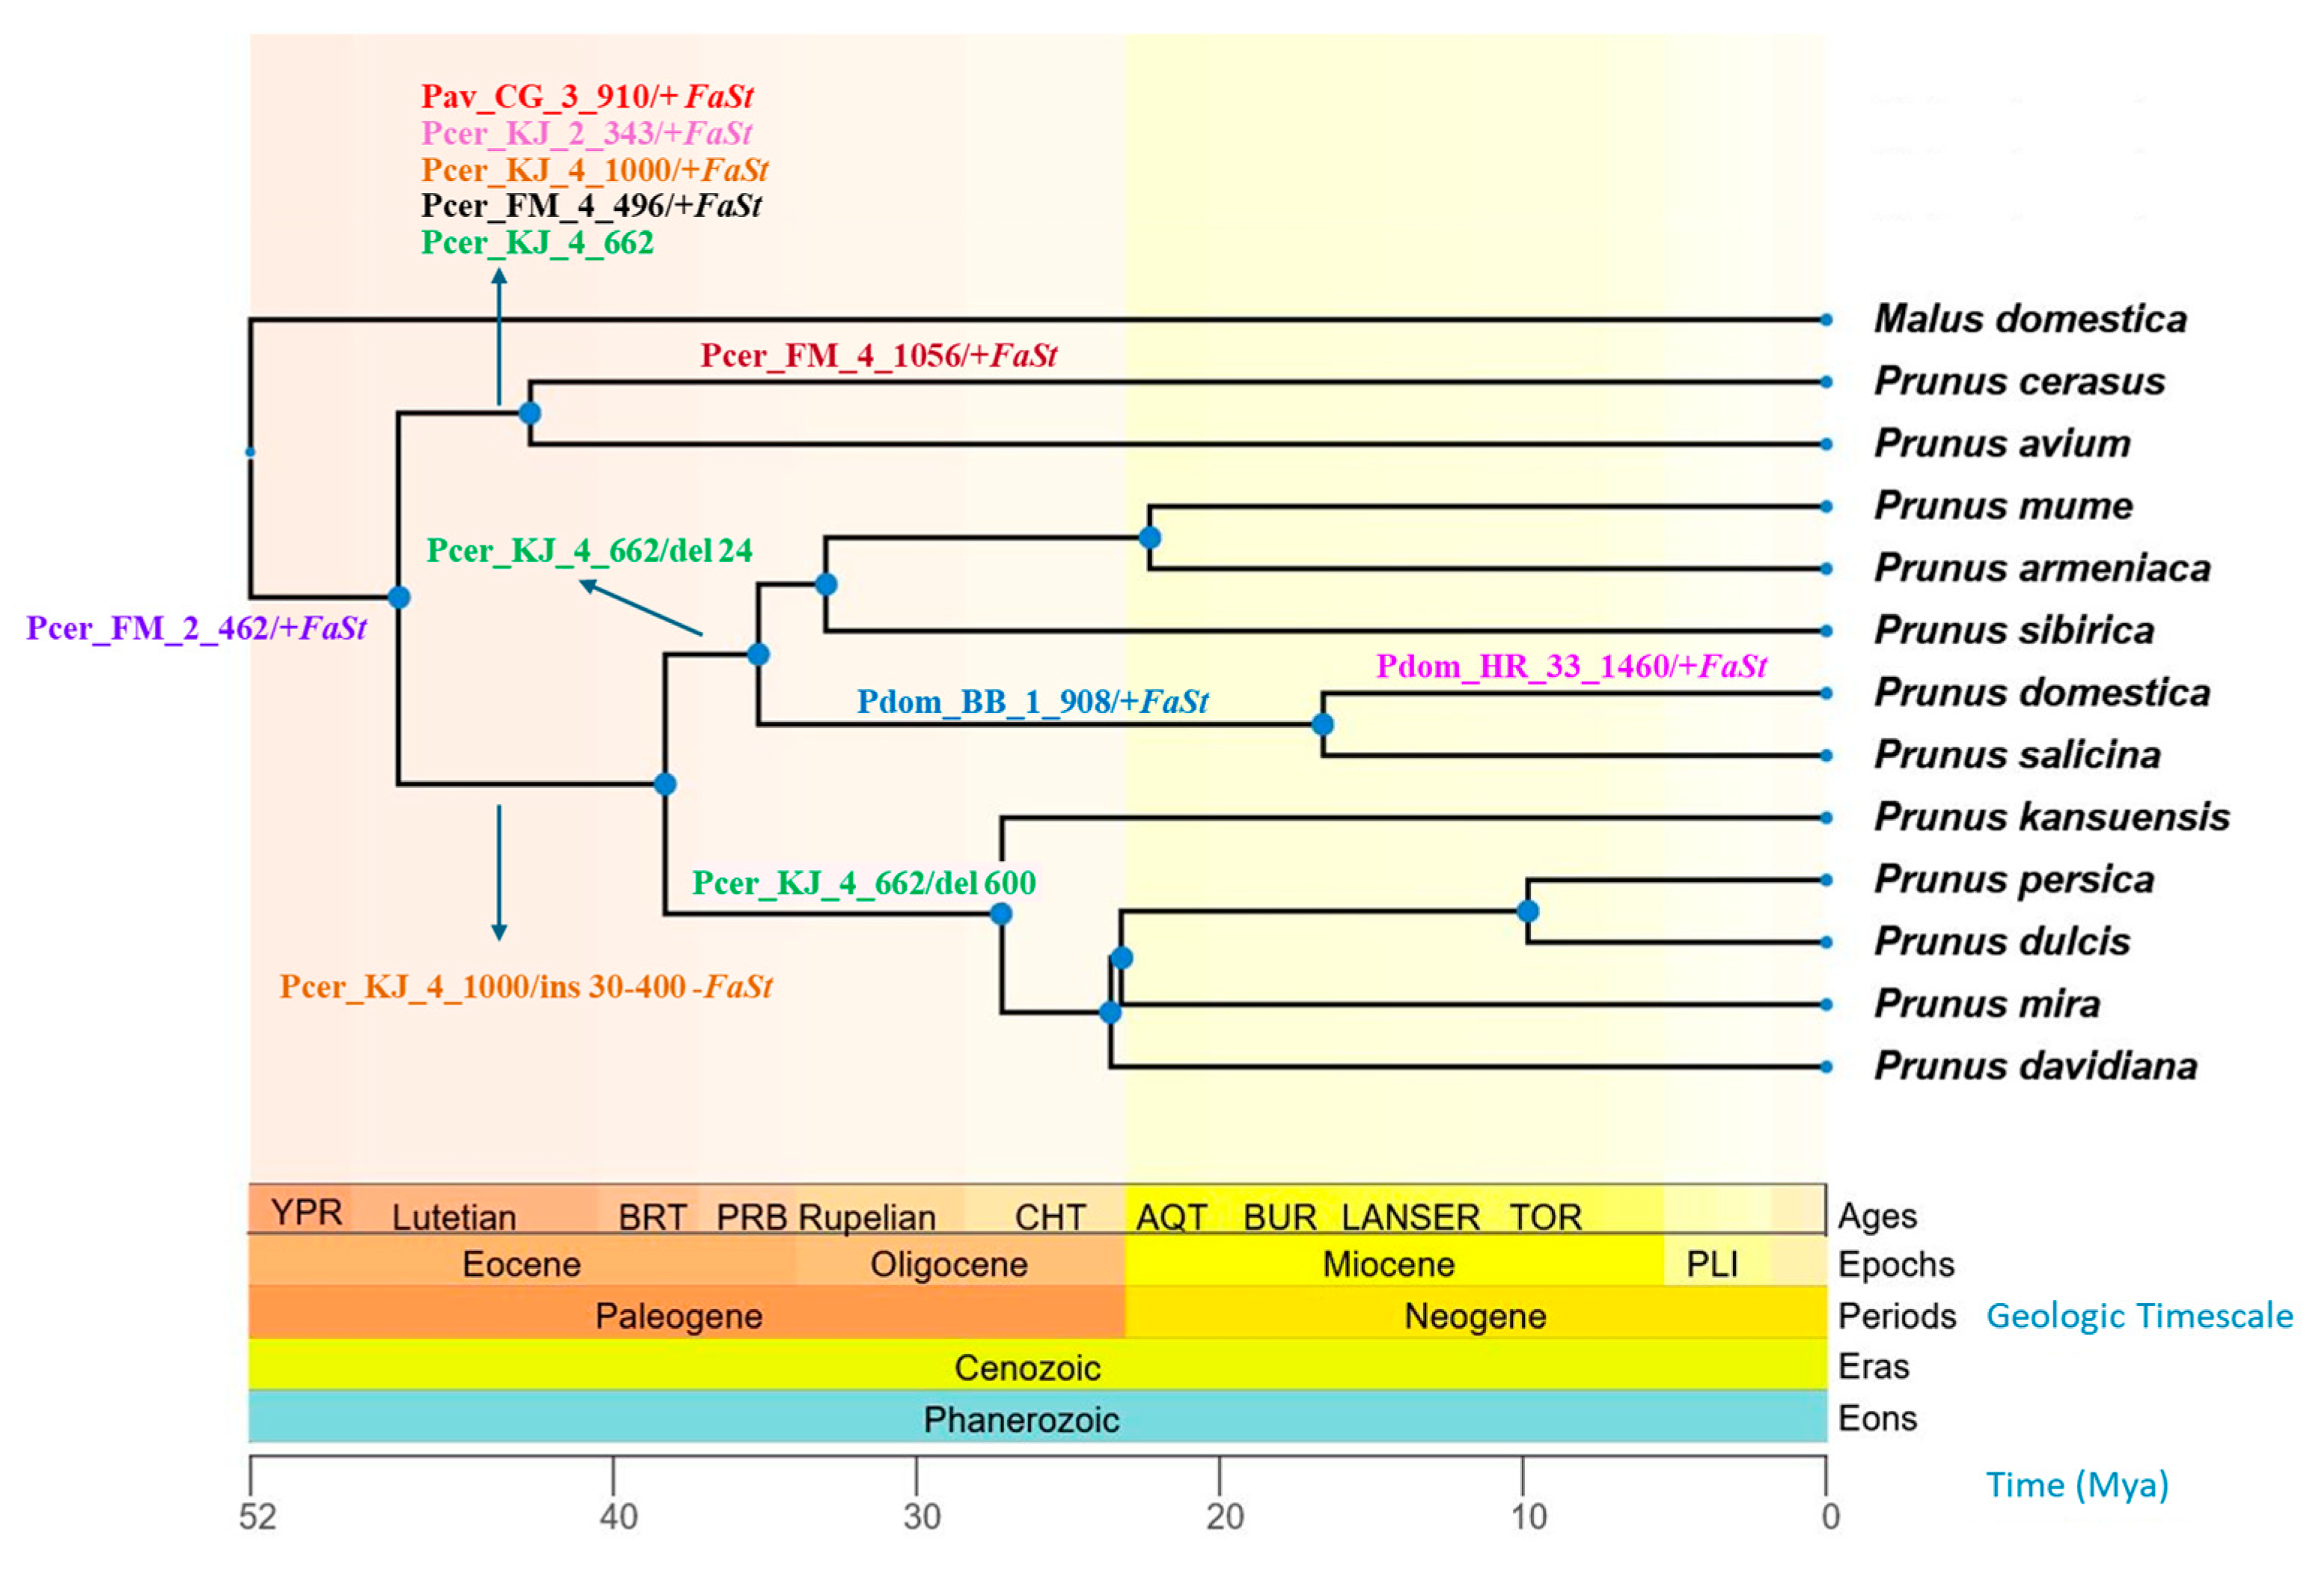
Selected examples showed interesting patterns of conservation or divergence across Prunus species. For instance, two sequences, Pdom_1-TF-907 and Pdom_BB_1_908, showed homology to the Prunus persica polygalacturonase ADPG2 gene, while the embedded FaSt element aligned independently with several P. persica FaSt sequences. BLASTn analysis against the P. domestica genome revealed 98% identity with two gaps across a 936 bp alignment. The FaSt element was located within the 5′ UTR, upstream of the start codon of the open reading frame. This sequence, including the FaSt insertion, was conserved in both ‘Topfive’ and ‘Besztercei Bt.2’ cultivars, and was also present in the P. salicina genome. However, the FaSt element was absent from all other Prunus species examined (Figure 6).
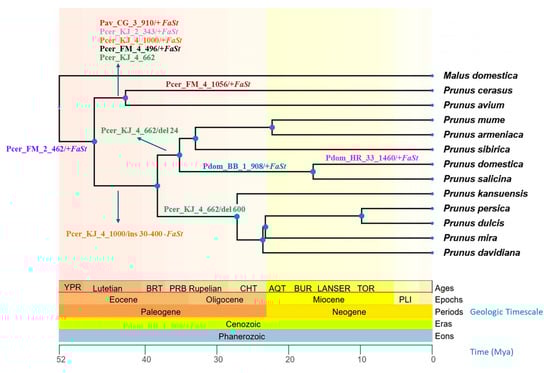
Figure 6.
Chronogram of 12 Prunus species and one Malus species based on divergence time estimation from the TimeTree 5 database [37]. The geological timescale is indicated by background colors and shown in millions of years ago (Mya) below the cladogram. Arrows indicate Falling Stones (FaSt) transposon-induced sequence alterations (+ presence and − absence of FaSt; “ins” and “del” refer to other sequence insertions and deletions, respectively). Sequence identifiers are provided in Table S1.
The complete sequence of Pav_CG_3_910 was found in both the sweet and sour cherry genomes, but its FaSt element was absent in P. fruticosa, P. armeniaca, P. persica, and all other Prunus species (Figure 6). Similarly, the Pcer_KJ_2_343 sequence exhibited 48% coverage with its closest homolog in BLASTn searches. However, when blasted against the sour and sweet cherry genomes on the Genome Database of Rosaceae (GDR) platform, the full sequence was detected (E value 0.0, 100% identity). This sequence was absent from P. fruticosa and all other Prunus species analyzed.
The Pcer_KJ_4_1000 sequence spans the intron of a gene encoding a BTB/POZ domain-containing protein and contains a FaSt element within this intronic region. This sequence was present in the P. cerasus and P. avium genomes, but in P. fruticosa and P. yedonensis, a small insertion (~60 bp) was observed within the intron, outside the FaSt element. In P. campanula, the insertion was somewhat larger (~200 bp). The genomes of P. salicina, P. mongolica, P. zhengheensis, P. dulcis, P. persica, P. armeniaca, and P. × kanzakura lacked the FaSt element but contained insertions ranging from 30 to 400 bp.
The Pcer_FM_4_496 sequence, located within the intron of a pectinesterase gene, contained a FaSt element that was found only in P. speciosa, P. avium, and P. cerasus, while other more distantly related species (e.g., P. dulcis and P. salicina) did not possess this FaSt copy. The FaSt element in Pcer_FM_4_1056 was absent from homologous sequences in P. avium, P. persica, and P. armeniaca. Notably, the ‘Montmorency’ snRNA gene sequence exhibited a 45 bp deletion. Finally, the Pcer_FM_2_462 intergenic sequence contained a FaSt element, which was present across all assayed Prunus species.
The Pdul_TK_22_1866 sequence contains a FaSt element in the intergenic region, which is also present in the ‘Nonpareil’ genome (98.89% identity), but absent from the homologs of ‘Lauranne’ and ‘Texas’. All other Prunus species also lack this FaSt copy in their homologous regions. The FaSt element in Pdul_TK_4_761 was present in the homologous gene of ‘Texas’ but absent from ‘Lauranne’ and all other Prunus species. Additionally, Pdul_TK_22_901 contains a FaSt element in the intron 5 of a DEAD-box ATP-dependent RNA helicase 52C-like gene, which is missing in the genome sequences of the ‘Nonpareil’, ‘Lauranne’, and ‘Texas’ cultivars. The FaSt element in the 5′ UTR of the inositol 2-dehydrogenase/D-chiro-inositol 3-dehydrogenase gene of ‘Tuono’ (Pdul_TU_3_544) was present in the ‘Lauranne’ gene but absent in the genome sequences of ‘Nonpareil’ and ‘Texas’. The Pdul_TU_33_342 sequence, a unique intergenic region containing a FaSt copy, could not be detected in any other almond cultivars or Prunus species.
The Pdom_HR_33_1460 sequence with its FaSt copy is present in the P. domestica draft genome, but the FaSt element is absent in P. salicina and other Prunus species. Finally, the FaSt elements in the Pdom_NT_22_334 intron and the Pdom_EL_4_433 intergenic sequence were not detected in P. domestica or any other Prunus genomes.
Variations were also observed in sequences lacking FaSt elements. Compared to the ‘Montmorency’ genome sequence, Pcer_KJ_4_965 exhibited a ~30 bp deletion in the 3′ UTR, while the UTRs of P. armeniaca and P. persica were more divergent. The Pcer_KJ_4_662 sequence, which contains an intron of a peroxidase N1-like gene, showed annealing of the FaSt-R primer to a degenerate region not part of a FaSt element. The complete sequence was found in the sour and sweet cherry, P. fruticosa, P. yedonensis, P. campanulata, and P. speciosa genomes. In contrast, the homologous sequences in plums, P. mume, P. armeniaca, P. humilis, P. sibirica, and P. zhengheensis exhibited a short (24 bp) deletion, while P. persica, P. dulcis, P. kansuensis, P. davidiana, P. mandshurica, P. mongolica, and P. mira contained a larger deletion of approximately 600 bp.
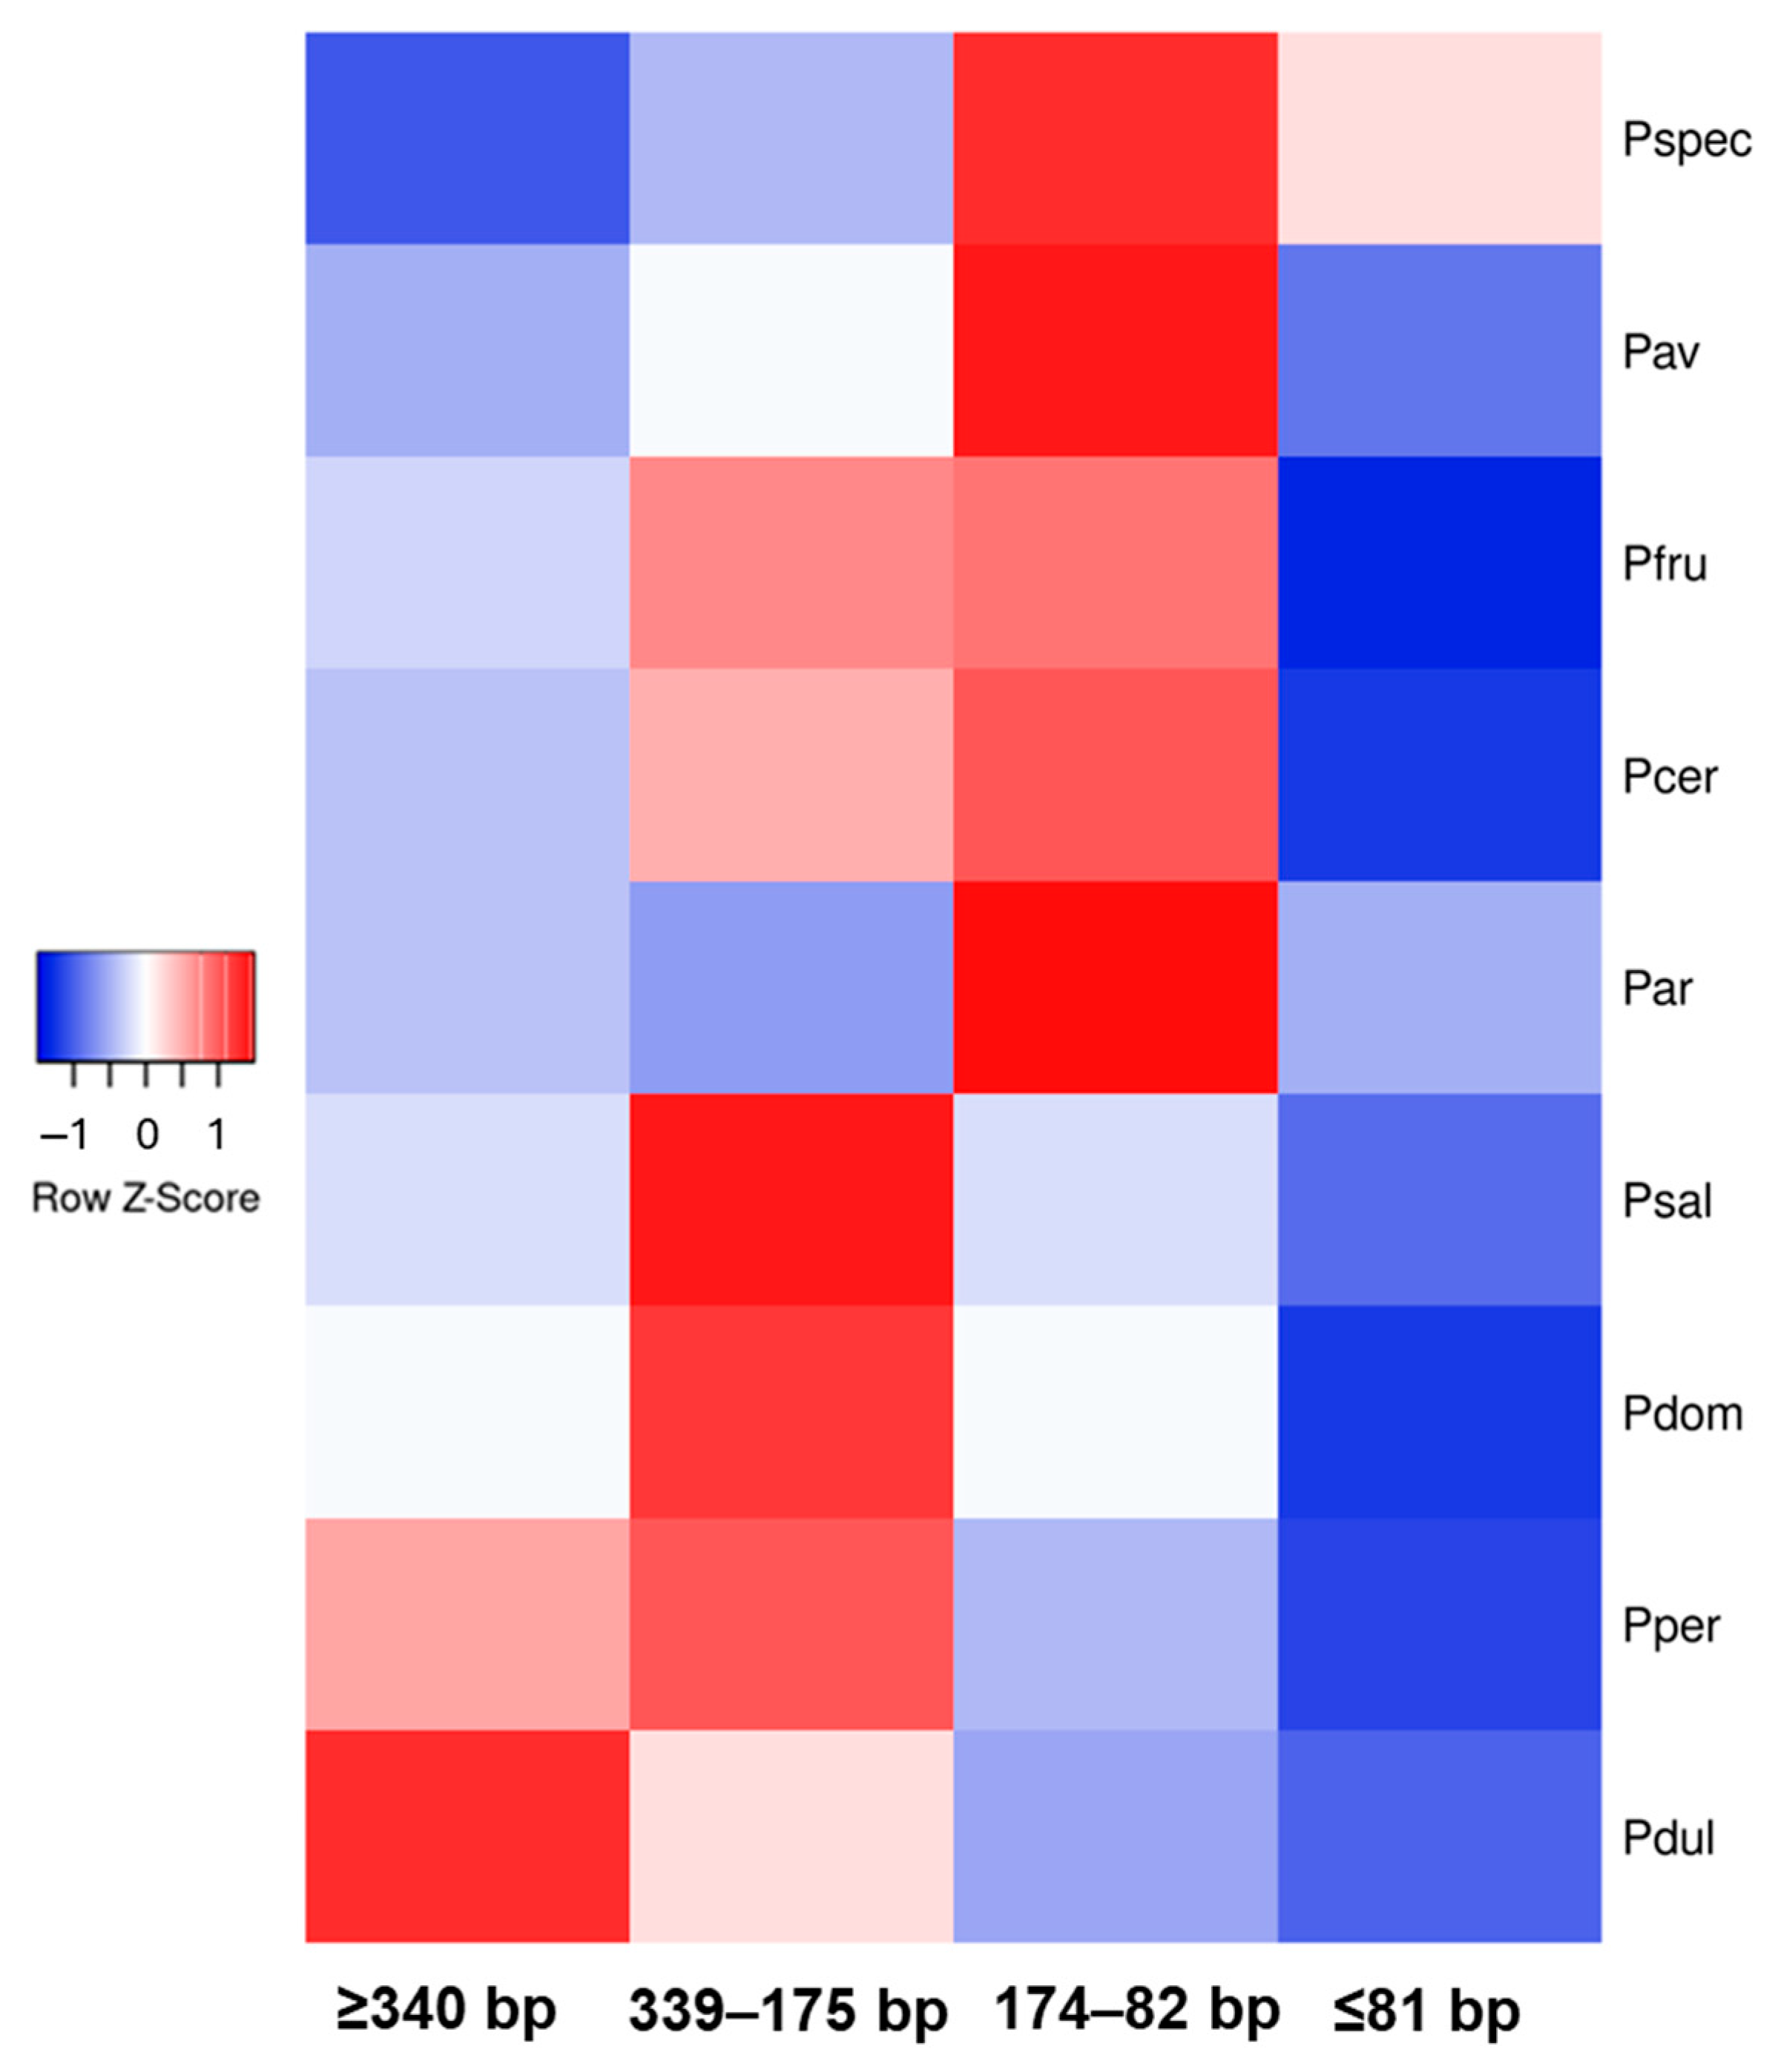
To compare the dynamics of FaSt accumulation in specific genomic regions with the broader genomic landscape of FaSt elements, the total number of FaSt copies was determined. We categorized the FaSt elements into four groups based on size: complete FaSt elements (≥340 bp), fragments exceeding 50% of the original length (339–175 bp), those between 174 and 82 bp, and those under 82 bp. Figure 7 illustrates the uneven distribution of FaSt elements of different sizes across the nine assayed genomes. P. persica and P. dulcis contained the largest number of full-length FaSt copies, while the 339–175 bp category was predominant in plum species. Species within the Cerasus subgenus exhibited the highest levels of truncated FaSt copies, ranging between 174 and 82 bp. P. fruticosa (1154) and P. cerasus (1594) had more full-length copies than P. avium (503) and P. speciosa (514). Similarly, P. domestica (1400) contained significantly more full-length FaSt copies than P. salicina (427). Interestingly, P. armeniaca displayed a FaSt profile more similar to that of the Cerasus species, with a higher proportion of fragmented FaSt copies compared to those in the Prunus subgenus.

Figure 7.
Heat map of in silico-identified Falling Stones (FaSt) transposon abundancy in nine Prunus genomes. The four size categories are as follows: almost complete (≥340 bp), 339–175 bp, 174–82 bp, and <82 bp. The colors represent genomic abundance, with red indicating high abundance and blue indicating low abundance. The columns correspond to the four size categories, and the rows represent the assayed genomes: P. speciosa (Pspec), P. avium (Pav), P. fruticosa (Pfru), P. cerasus (Pcer), P. armeniaca (Par), P. salicina (Psal), P. domestica (Pdom), P. persica (Pper), and P. dulcis (Pdul).
3. Discussion
3.1. The SCoT Marker Efficiency in Prunus Is Increased by a FaSt Specific Assay
SCoT markers are designed to anneal to conserved regions flanking the start codon in plant genes [20] and have been successfully used in various plant species, including Prunus fruit trees [21,23,28,38,39]. The NDB and the average NDB per marker were consistent for both SCoT-only and SCoT–FaSt combinations, aligning with values reported in previous studies on P. armeniaca [39] and P. sibirica [21]. The marker efficiency parameters, including the average PIC and the collective Rp and genetic diversity measures (h and I), were not diminished by the addition of FaSt-R primers. On the contrary, the inclusion of FaSt-R primers in the SCoT–FaSt combinations resulted in enhanced levels of polymorphism. While the SCoT markers in this study produced a slightly lower percentage of polymorphic bands compared to other Prunus assays [21,39], the incorporation of FaSt-R significantly increased the observed polymorphism. The PIC values for dominant markers range from 0 to 0.5, and all assayed markers and their combinations exhibited higher PIC values than those reported for SCoT analysis in Chinese apricots [39].
TNB was lower, while NDB was slightly higher for the SCoT–FaSt combinations compared to the SCoT-only analyses. The fewer bands detected across a broader range of size categories spanned amplicon sizes from 150 to 8000 bp. This extended range included both smaller and larger fragments than those amplified by SCoT primers alone in several other plants, such as Citrus, Punica, and Simmondsia species [40,41,42]. The inclusion of FaSt-R primers reduced the gel pattern density, facilitating the more reliable identification of differentially expressed fragments. FaSt-R was specifically designed to anneal within the unique loop sequence of the non-autonomous transposon [35], enabling the detection of complete or partial FaSt copies within the Prunus genome. This specificity significantly reduces the number of amplicons, especially considering that the peach genome contains approximately 28,000 protein-coding genes [27] and around 1000 FaSt copies. The observed decrease in TNB and the changes in band sizes suggest that FaSt-R primers enhance the specificity of the PCR reaction. As expected, amplification using only SCoT primers will be less intense when FaSt-R is also available (Figure 1D). Additionally, SCoT primers can sometimes amplify gene fragments from pathogenic organisms infecting the host plant [43,44]. However, by incorporating FaSt-R, which selectively anneals to a Prunus-specific transposon, non-target amplicons that could interfere with the genetic analysis of crop plants are effectively excluded.
The SCoT–FaSt amplified fragments were used to conduct phylogenetic analyses, resulting in the construction of five subclusters in the neighbor-joining (NJ) tree, all with 99–100% bootstrap support. These subclusters included P. persica, P. dulcis, P. domestica, P. armeniaca, and cherry species, with P. persica and P. dulcis, as well as P. avium and P. cerasus, being relatively closer to each other. Notably, ‘Feketicsi meggy’ was not grouped with ‘Kántorjánosi 3’, providing further evidence of its putative interspecific origin [45]. These phylogenetic relationships align closely with the divergence times of the respective species [6,11], further confirming that the SCoT–FaSt marker combinations generate robust phylogenetic signals that reliably reconstruct evolutionary relationships among species. It is even more accurate compared to the SCoT-only analysis, where the close evolutionary relationship between P. persica and P. dulcis [10,11,12] was not resolved.
A more detailed analysis of 28 P. domestica cultivars revealed five statistically supported clusters. The grouping of these cultivars reflected their origin and pedigree. Cluster BI, which received full support, included German cultivars from two distinct breeding programs—Hohenheim and Geisenheim. These cultivars shared a similar set of parental genotypes, including ‘Cacanska najbolja’, ‘Auerbach’, and ‘President’ [46]. Cluster BII, supported by a 90% bootstrap value, grouped the half-siblings of ‘Stanley’ [46]. Cluster BIII consisted of landraces of Hungarian origin, sister to a separate, statistically supported cluster for ‘Nemtudom’ and ‘Besztercei’ plums. Although the origin of these Hungarian plums remains unclear, they have evolved in specific geographic regions. Their distinct separation from other landraces was also observed in SSR analyses and chloroplast DNA sequence variation studies [16,17].
Cluster BV includes old cultivars from various countries, none of which have reported parentage. Another statistically unsupported cluster comprised Russian and Romanian cultivars, along with ‘Czar’. It is known that Romanian plum breeding programs in the 1960s and 1970s frequently used ‘Czar’ as a donor to introduce early ripening phenotype [47]. ‘Czar’ is the first European plum cultivar created in England in 1843, named after the Russian emperor who visited England [48]. It is therefore likely that accessions of this cultivar made their way into Russian breeding programs. The PCA plot provided a clearer representation of the four major groups. One group contained the two Hungarian landraces, which were distinctly separated from the other Hungarian plums, while cultivars from clusters BI and BII were much closer to each other. Our results indicate that SCoT–FaSt marker analysis provides sufficient phylogenetic signals to reliably reconstruct genetic relationships both among and within species.
Approximately one-third of the amplified fragments were smaller than 1 kb in size. Small fragment sizes have also been observed in SCoT analyses of species such as Citrus [40], Simmondsia [41], Punica [42], and many others. According to the original concept of the SCoT marker strategy, this would only be possible if two protein-coding genes are located in opposite directions but very close to each other. To verify whether many genes in the Prunus genome are indeed this closely located, and to ensure that the resulting fragments are the product of joint amplification by the SCoT and FaSt-R primer pairs, we cloned several fragments and determined their DNA sequences.
3.2. Functional and Evolutionary Aspects of the Genomic Landscape of FaSt
Each cloned amplicon was flanked by 18 and 22 bp sequences corresponding to the SCoT and FaSt-R primers at their respective ends, confirming that all randomly selected fragments were indeed amplified by a combination of these oligonucleotides. This supports our hypothesis that fragments amplified by the sequence-specific FaSt-R primer predominate among the amplicons. However, six of the sequences contained only the FaSt-R primer sequence and lacked the expected ~230 bp segment of the FaSt element. This suggests that while the FaSt-R primer anneals specifically, its target site is more frequent in the genome than the complete FaSt elements, which leads to the amplification of more fragments across all combinations. These annealing sites may have arisen through the accumulation of base substitutions outside the FaSt element or internal deletions within the FaSt, as mutations in a MITE are unlikely to significantly affect fitness [49,50].
The vast majority (26) of the sequences contained an identifiable FaSt element, with 11 of them inserted in non-coding regions of protein-coding genes, including UTRs and introns. This aligns with the genome-wide distribution of MITEs in many species, which shows a bias toward UTRs and introns, with many more copies present in these regions than in exons [35,51,52]. The remaining 15 FaSt elements were detected in intergenic regions, consistent with the known insertion preference of FaSt in AT-rich sequences [35]. SCoT markers were designed to anneal to the conserved region around the ATG start codon of plant genes [20]. The size of the sequences ranged from 251 to 1866 bp, which is consistent with amplicon size ranges reported in other studies using SCoT analysis [40,41,42]. This makes it unlikely that SCoT primers amplified regions between protein-coding genes in opposite orientations. Very few studies have reported sequence data from SCoT-amplified fragments to verify the annealing of SCoT primers to the start codon. A brief survey of sequences used to design SCAR markers (as listed by Rai [38]) confirmed that most did not include the sequences surrounding the start codon. Our partial sequences of 17 protein-coding genes verified that SCoT primers annealed to exonic regions outside the start codon. Plant introns are AU-rich, in contrast to GC-rich exons [53,54], and the higher GC content of exons is crucial for the increased stability of RNA structures, including mRNA and rRNA [55,56]. This explains why many SCoT–FaSt primer combinations amplified parts of protein and RNA-coding genes. Non-genic segments of the genome exhibit variable levels of GC content [56], which could explain why some SCoT primers annealed to these regions. These results suggest that under the PCR conditions recommended for SCoT analysis [20], the primers do not selectively bind to the start codon regions but rather show a tendency to anneal within the GC-rich segments of the genome, which nonetheless creates a good chance of finding genes.
FaSt copies were identified in the intron and 5′ and 3′ UTRs of several genes, some of which are involved in key physiological processes. A FaSt was found in the intron of five genes, including the sour cherry BTB/POZ domain-containing protein At4g08455-like and pectinesterase genes. BTB/POZ proteins are associated with growth and development through mechanisms such as ethylene biosynthesis, disease resistance, and hormone perception, which occur via selective ubiquitination and kinase activation [57]. Pectinesterases are involved in pectin degradation, thereby accelerating the rate of fruit softening [58]. Additionally, two P. domestica genes were found to contain FaSt insertions in their introns. The glycosyltransferase BC10-like proteins are involved in metabolic processes and play a role in fruit ripening and responses to abiotic stresses [59], while the leaf rust 10 disease-resistance locus receptor-like protein kinase-like proteins, members of LRR-NBS resistance proteins, contribute to enhanced resistance to Xanthomonas [60]. In P. dulcis, the DEAD-box ATP-dependent RNA helicase-encoded proteins suppress potyvirus accumulation through an interaction with the viral protein VPg, which is essential for viral infection [61].
A FaSt copy was identified in the 5′ UTR of the plum polygalacturonase ADPG1 gene, whose protein product is involved in pectin degradation and fruit softening [62]. The 3′ UTRs of the P. domestica ethylene-responsive transcription factor ERF053-like and beta-D-glucosyl crocetin beta-1,6-glucosyltransferase genes also contained FaSt copies. Ethylene response factor (ERF) transcription factors regulate fruit ripening as well as resistance to biotic and abiotic stresses [63], while the beta-D-glucosyl crocetin beta-1,6-glucosyltransferase enzyme participates in the flavonoid and anthocyanin biosynthetic pathways [64]. Since sequence alterations, including MITE insertions in UTRs and introns, have frequently been associated with regulatory roles [65,66,67], further studies are needed to determine whether the presence of FaSt elements affects the expression of these genes.
The identification of genomic regions homologous to our SCoT–FaSt sequences in other Prunus genomes has provided further evolutionary insights. We found a FaSt element present in one P. avium and three P. cerasus sequences, which was absent from the homologous genomic regions in all other species within the Prunus subgenus. Two of those (Pav_CG_3_910 and Pcer_KJ_2_343) also lacked the FaSt element in P. fruticosa, and the FaSt in Pcer_KJ_4_1000 was missing from P. × kanzakura. The phylogenetic distribution of such FaSt copies helped determine their relative insertion times. The FaSt in Pcer_FM_2_462 was present in all species, indicating that it was inserted between 47 and 52 Mya according to TimeTree 5 estimations based on data from Chin et al. [6], Guo et al. [68], and Pouget et al. [69]. The FaSt in Pcer_FM_4_496 was found in all species of the Cerasus subgenus but absent in all other Prunus species, suggesting that it emerged around 47 Mya. Three FaSt elements were inserted approx. 47–43 Mya on the phylogenetic lineage of P. avium and P. cerasus. Additionally, the presence and size of other indels in Pcer_KJ_4_1000 and Pcer_KJ_4_662 also followed the known speciation events in the Prunus genus [6]. The uneven distribution of certain FaSt elements between the Cerasus and Prunus subgenera prompted us to consider whether a burst of FaSt insertions around 47–43 Mya was a significant evolutionary event. To investigate this, we analyzed the proportion of complete and partial FaSt elements in the genomes of several species within both subgenera. Our analysis revealed an unequal distribution of FaSt elements of varying sizes, with species in the Cerasus subgenus predominantly harboring fragmented FaSt copies (smaller than the half of the 349 bp FaSt), while most species in the Prunus subgenus contained a significantly higher number of complete FaSt elements. The only exception was P. armeniaca, which contained many partial FaSt elements, though complete and presumably active FaSt copies were also identified in this species [35,36]. Polyploid species exhibited two to three times more FaSt copies. Overall, our findings suggest that many of the FaSt elements of P. avium and P. cerasus are older than those of P. persica, P. dulcis, and P. domestica. A sudden burst of FaSt insertions in one of the phylogenetic lineages may have resulted in an accelerated differentiation. MITE insertions have been associated with increased capacity for unequal crossing over [70], alternative splicing [71], and modifications to gene regulation [72]. Similar evolutionary events have been observed in primates following a sudden increase in Alu repeats around 40 Mya [73].
The differential presence of FaSt copies in almond sequences was fully consistent with reported connections between germplasm and the pedigree of tested cultivars. Pdul_TK_22_1866 and Pdul_TK_4_761 contained FaSt elements also found in ‘Nonpareil’ and ‘Texas’, respectively. It is well documented that Hungarian almond breeding programs have utilized accessions from the USA, which is reflected in the self-incompatibility genotypes of the cultivars [74]. The FaSt element in the ‘Tuono’ Pdul_TU_3_544 sequence was also present in ‘Lauranne’, which aligns with ‘Lauranne’ being an offspring of the cross ‘Ferragnés’ × ‘Tuono’ [75]. Two unique FaSt copies in the ‘Tuono’ (Pdul_TU_33_342) and ‘Tétényi keményhéjú’ (Pdul_TK_22_901) sequences suggest recent FaSt insertions, as confirmed by the high proportion of complete FaSt elements in the P. dulcis genome (Figure 7) and consistent with the activity of transposable elements in almond [12]. Recent FaSt insertions were also seen in the sequences of hexaploid P. domestica.
The combination of SCoT primers and a newly designed sequence-specific primer targeting the Prunus non-autonomous transposon, FaSt, provided a molecular marker with enhanced polymorphism detection, free from non-target amplification, and capable of delivering reliable phylogenetic information at both inter- and intraspecific taxonomic levels. The identification of variations in the genome-wide distribution of FaSt insertions enabled the detection of several genes and genomic regions exhibiting insertional polymorphisms. A more detailed analysis of these variations could provide valuable insights into the genetic diversity of breeding germplasm, the reconstruction of evolutionary relationships, and the genome-shaping impact of an active Mutator-type MITE in the Prunus genome.
4. Materials and Methods
4.1. Plant Material and DNA Isolation
Two sets of experiments were carried out, with the first on two cultivars of six Prunus species, P. armeniaca L. (apricot), P. dulcis (Mill.) D.A. Webb (almond), P. avium L. (sweet cherry), P. persica (L.) Batsch (peach), P. cerasus L. (sour cherry), and P. domestica L. (European plum). In the second experiment, 28 cultivars of European plum were analyzed; all cultivars are listed in Table 2. The trees were sampled in the Prunus germplasm collection of the Department of Plant Biotechnology, Hungarian University of Agriculture and Life Sciences (MATE, Budapest, Hungary). Total genomic DNA was isolated from buds using a DNeasy Plant Mini Kit (Qiagen, Hilden, Germany) according to the manufacturer’s instructions. The quantity and quality of DNA were analyzed by NanoDropTM ND-1000 spectrophotometer (Bio-Science, Budapest, Hungary).
Table 2.
Origin of Prunus cultivars used in the study [17,76].
4.2. Genomic PCR with SCoT and FaSt-Specific Primers
For genomic PCR, 19 (1, 2, 4–7, 11–13, 16, 18, 19, 21–24, 27, 32 and 34) and 17 (1–5, 7–11, 15, 16, 19, 21–23, and 34) SCoT primers were used for two cultivars each of six Prunus species and 28 P. domestica cultivars, respectively. A new primer, FaSt-R (5′-TCTTAGAAATTACAAAACTACC-3′) was designed to anneal to a unique sequence of the Falling Stone MITE. The FaSt-R and all SCoT primers [20] were used separately and combined with each other. Approximately 40–70 ng of genomic DNA was used for PCR amplification in a 12 µL reaction volume, containing 10 × DreamTaqTM Green buffer (Thermo Fisher Scientific, Waltham, MA, USA) with final concentrations of 1.5 mM MgCl2, 0.2 mM of dNTPs, 0.4 µM of the adequate primers, and 0.625 U of DreamTaqTM DNA polymerase (Thermo Fisher Scientific, Waltham, MA, USA). The PCR amplification was carried out in a 27Swift MaxPro thermocycler (ESCO Healthcare, Singapore, Republic of Singapore). Amplification was run at 94 °C for 5 min, followed by 40 cycles of denaturation at 94 °C for 1 min, primer annealing at 50 °C for 1 min, and elongation at 72 °C for 2 min; the final extension was 10 min at 72 °C. Amplicons were detected by 1.2% TBE agarose gels stained with ethidium bromide (EtBr) at 80 V for 3 h. Fragment sizes were estimated by comparison with the GeneRuler™ 1-kb DNA Ladder (Thermo Fisher Scientific, Waltham, MA, USA).
4.3. Cloning and DNA Sequencing
Direct cloning of PCR products was carried out using the InsTAclone PCR Cloning Kit (Thermo Fisher Scientific, Waltham, MA, USA) and JM109 competent cells, isolated with a GeneJETTM Plasmid Miniprep Kit (Thermo Fisher Scientific, Waltham, MA, USA). Nucleotide sequences of 3 samples were determined for each fragment in both directions using M13 sequencing primers in an ABI 3500 XL Genetic Analyzer (Applied Biosystems, Foster City, CA, USA).
4.4. Data Evaluation and Bioinformatics Analyses
The banding patterns of the SCoT, FaSt and SCoT–FaSt marker analyses were scored as binary data with strong and clearly separated bands as present (1) and absent bands as (0); weak or ambiguous bands were excluded. The TNB, NDB, SRA, PA ≤ 1 kb, and PPB were calculated in MS Excel, while PIC, h, I, and Rp were determined using the iMEC, https://irscope.shinyapps.io/iMEC/ (accessed on 11–16 January 2025) [77] and Popgene 1.32 [78] programs. A genetic similarity matrix was calculated using Jaccard’s index, which is appropriate for binary presence/absence data. Based on this matrix, a principal component analysis (PCA) was performed, and a phylogenetic tree was constructed using the neighbor-joining (NJ) method in PAST v4.03 [79]. Bootstrap analysis with 1000 replicates was carried out to assess the robustness of the tree, and the resulting support values are indicated on the branches. The BLASTn analysis at the NCBI and the available genome sequences of the Prunus species at the GDR, https://www.rosaceae.org/blast (accessed on 20–30 January 2025) databases were used for homology searches [80]. The BLASTn 2.12.0+ analysis at GDR [81] was carried out using P. cerasus ‘Montmorency’ v1.0.a2, P. avium ‘Tieton’ genome v2.0, P. fruticosa 27e12(2) v1.0, P. dulcis ‘Lauranne’ v1.0.a1, ‘Nonpareil’ v1.0, ‘Texas’ v3.0, P. armeniaca ‘Stella’ v1.0, P. persica Genome V2.0.a1, P. yedoensis Genome v1.0, P. domestica Draft Genome v1.0 genomes, P. campanulata v1.0, P. kansuensis genome v2.0, P. mume Nanko v1.0 genome, P. salicina Sanyueli genome v2.0, Prunus speciosa IZO01 v1.0, P. davidiana Genome v2.0, P. mandshurica genome v1.0, P. mongolica v1.0, P. mira Genome v2.0, P. sibirica CH320_5 genome v1.0, and P. zhengheensis v1.0. Sequences were aligned and presented with MEGA 7 [82] and BioEdit v. 7.2.0. [83], respectively. The phylogenetic tree of 12 Prunus and a Malus species was built based on the divergence times determined by Chin et al. [6] and by using the TimeTree 5 [83] database (https://timetree.org, accessed on 14 February 2025). The FaSt sequence [35] was used for BLASTn analysis on the P. speciosa, P. avium, P. fruticosa, P. cerasus, P. armeniaca, P. salicina, P. domestica, P. persica, and P. dulcis genomes. The hits were arranged in four size categories (≥340 bp, 339–175 bp, 174–82 bp, and ≤82 bp) and their genomic copy numbers were determined in MS Excel. A heatmap was generated for the frequency of complete and partial FaSt elements in the analyzed Prunus genomes using the expression function within Heatmapper [84].
Supplementary Materials
The following supporting information can be downloaded at https://www.mdpi.com/article/10.3390/ijms26093972/s1.
Author Contributions
Conceptualization, A.H.; methodology, A.H. and J.H.; validation, B.I., T.O., J.H. and A.H.; formal analysis, A.H.; investigation, B.I., T.O., J.H. and A.H.; writing—original draft preparation, B.I. and A.H.; writing—review and editing, B.I., J.H. and A.H.; visualization, A.H.; supervision, A.H.; project administration, A.H.; funding acquisition, A.H. and J.H. All authors have read and agreed to the published version of the manuscript.
Funding
This research was funded by the Flagship Research Groups Program of the Hungarian University of Agriculture and Life Sciences and by the National Research, Development and Innovation Office NKFI K_128874 project.
Institutional Review Board Statement
Not applicable.
Informed Consent Statement
Not applicable.
Data Availability Statement
A total of 32 sequences were submitted to the NCBI GenBank database under the accession numbers PQ869779–PQ869809.
Acknowledgments
We thank Zsolt Szani (National Food Chain Safety Office, Hungary) for the provision of the peach leaf samples.
Conflicts of Interest
The authors declare no conflicts of interest.
Abbreviations
The following abbreviations are used in this manuscript:
| AFLP | amplified fragment length polymorphism |
| BLASTn | Basic Local Alignment Search Tool |
| FaSt | Falling Stones |
| GDR | Genome Database of Rosaceae |
| h | Nei’s gene diversity |
| I | Shannon’s information index |
| iPBS | inter-primer binding site |
| ISSR | inter-simple sequence repeat |
| LTR | long terminal repeat retrotransposons |
| MITE | miniature inverted-repeat transposable elements |
| NCBI | National Center for Biotechnology Information |
| NDB | number of differently sized bands |
| PA ≤ 1 kb | percentage of amplicons with size ≤ 1000 bp |
| PIC | polymorphism information content |
| PPB | percentage of the polymorphic bands |
| RAPD | random amplified polymorphic DNA |
| Rp | resolving power |
| SCoT | start-codon-targeted |
| SRA | size range of amplicons |
| SSR | microsatellite |
| TE | transposable elements |
| TIR | terminal inverted repeats |
| TNB | total number of bands |
| TSD | target site duplications |
References
- Potter, D. Basic Information on the Stone Fruit Crops. In Genetics, Genomics and Breeding of Stone Fruits; Kole, C., Abbott, A.G., Eds.; CRC Press: Boca Raton, FL, USA, 2012; pp. 1–21. [Google Scholar] [CrossRef]
- Meena, N.K.; Choudhary, K.; Negi, N.; Meena, V.S.; Gupta, V. Nutritional Composition of Stone Fruits. In Production Technology of Stone Fruits; Mir, M.M., Iqbal, U., Mir, S.A., Eds.; Springer: Singapore, 2021; pp. 227–251. [Google Scholar] [CrossRef]
- Rehder, A. Manual of Cultivated Trees and Shrubs Hardy in North America Exclusive of the Subtropical and Warmer Temperate Regions, 2nd ed.; MacMillan: New York, NY, USA, 1940; pp. 1–996. [Google Scholar]
- Shi, S.; Li, J.; Sun, J.; Yu, J.; Zhou, S. Phylogeny and Classification of Prunus sensu lato (Rosaceae). J. Integr. Plant Biol. 2013, 55, 1069–1079. [Google Scholar] [CrossRef] [PubMed]
- Su, N.; Hodel, R.; Wang, X.; Wang, J.-R.; Xie, S.-Y.; Gui, C.-X.; Zhang, L.; Yang, C.; Zhao, L.; Potter, D.; et al. Molecular Phylogeny and Inflorescence Evolution of Prunus (Rosaceae) Based on RAD-seq and Genome Skimming Analyses. Plant Divers. 2023, 45, 397–408. [Google Scholar] [CrossRef] [PubMed]
- Chin, S.-W.; Shaw, J.; Haberle, R.; Wen, J.; Potter, D. Diversification of Almonds, Peaches, Plums and Cherries—Molecular Systematics and Biogeographic History of Prunus (Rosaceae). Mol. Phylogenet. Evol. 2014, 76, 34–48. [Google Scholar] [CrossRef] [PubMed]
- Olden, E.J.; Nybom, N. On the Origin of Prunus cerasus L. Hereditas 1968, 59, 327–345. [Google Scholar] [CrossRef]
- Wöhner, T.W.; Emeriewen, O.F.; Wittenberg, A.H.; Schneiders, H.; Vrijenhoek, I.; Halász, J.; Hrotkó, K.; Hoff, K.J.; Gabriel, L.; Lempe, J.; et al. The Draft Chromosome-Level Genome Assembly of Tetraploid Ground Cherry (Prunus fruticosa Pall.) from Long Reads. Genomics 2021, 113, 4173–4183. [Google Scholar] [CrossRef]
- Zhebentyayeva, T.; Shankar, V.; Scorza, R.; Callahan, A.; Ravelonandro, M.; Castro, S.; DeJong, T.; Saski, C.A.; Dardick, C. Genetic Characterization of Worldwide Prunus domestica (plum) Germplasm Using Sequence-Based Genotyping. Hortic. Res. 2019, 6, 12. [Google Scholar] [CrossRef]
- Tao, R.; Watari, A.; Hanada, T.; Habu, T.; Yaegaki, H.; Yamaguchi, M.; Yamane, H. Self-compatible Peach (Prunus persica) Has Mutant Versions of the S Haplotypes Found in Self-incompatible Prunus Species. Plant Mol. Biol. 2007, 63, 109–123. [Google Scholar] [CrossRef]
- Velasco, D.; Hough, J.; Aradhya, M.; Ross-Ibarra, J. Evolutionary Genomics of Peach and Almond Domestication. G3 (Bethesda) 2016, 6, 3985–3993. [Google Scholar] [CrossRef]
- Alioto, T.; Alexiou, K.G.; Bardil, A.; Barteri, F.; Castanera, R.; Cruz, F.; Dhingra, A.; Duval, H.; Fernández i Martí, A.; Galán, B.; et al. Transposons Played a Major Role in the Diversification Between the Closely Related Almond and Peach Genomes: Results from the Almond Genome Sequence. Plant J. 2020, 101, 455–472. [Google Scholar] [CrossRef]
- Decroocq, V.; Hagen, L.; Favé, M.G.; Eyquard, J.-P.; Pierronnet, A. Microsatellite Markers in the Hexaploid Prunus domestica Species and Parentage Lineage of Three European Plum Cultivars Using Nuclear and Chloroplast Simple-Sequence Repeats. Mol. Breeding 2004, 13, 135–142. [Google Scholar] [CrossRef]
- Dirlewanger, E.; Cosson, P.; Tavaud, M.; Aranzana, M.; Poizat, C.; Zanetto, A.; Arús, P.; Laigret, F. Development of Microsatellite Markers in Peach [Prunus persica (L.) Batsch] and Their Use in Genetic Diversity Analysis in Peach and Sweet Cherry (Prunus avium L.). Theor. Appl. Genet. 2002, 105, 127–138. [Google Scholar] [CrossRef] [PubMed]
- Halász, J.; Kodad, O.; Galiba, G.M.; Skola, I.; Ercisli, S.; Ledbetter, C.A.; Hegedűs, A. Genetic Variability is Preserved among Strongly Differentiated and Geographically Diverse Almond Germplasm: An Assessment by Simple Sequence Repeat Markers. Tree Genet. Genomes 2019, 15, 12. [Google Scholar] [CrossRef]
- Halász, J.; Szendy, G.; Ivanovska, B.; Tóth, E.G.; Hegedűs, A. The Self-incompatibility Locus and Chloroplast DNA Regions of Prunus domestica Reflect the Origin and Genetic Diversity of Traditional Cultivars. J. Amer. Soc. Hort. Sci. 2023, 148, 230–239. [Google Scholar] [CrossRef]
- Makovics-Zsohár, N.; Tóth, M.; Surányi, D.; Kovács, S.; Hegedűs, A.; Halász, J. Simple Sequence Repeat Markers Reveal Hungarian Plum (Prunus domestica L.) Germplasm as a Valuable Gene Resource. HortScience 2017, 52, 1655–1660. [Google Scholar] [CrossRef]
- Martínez-Gómez, P.; Arulsekar, S.; Potter, D.; Gradziel, T.M. An Extended Interspecific Gene Pool Available to Peach and Almond Breeding as Characterized Using Simple Sequence Repeat (SSR) Markers. Euphytica 2003, 131, 313–322. [Google Scholar] [CrossRef]
- García-Gómez, B.; Razi, M.; Salazar, J.A.; Prudencio, A.S.; Ruiz, D.; Dondini, L.; Martínez-Gómez, P. Comparative Analysis of SSR Markers Developed in Exon, Intron, and Intergenic Regions and Distributed in Regions Controlling Fruit Quality Traits in Prunus Species: Genetic Diversity and Association Studies. Plant Mol. Biol. Rep. 2018, 36, 23–35. [Google Scholar] [CrossRef]
- Collard, B.C.Y.; Mackill, D.J. Start Codon Targeted (SCoT) Polymorphism: A Simple, Novel DNA Marker Technique for Generating Gene-Targeted Markers in Plants. Plant Mol. Biol. Rep. 2009, 27, 86–93. [Google Scholar] [CrossRef]
- Buer, H.; Rula, S.; Wang, Z.Y.; Fang, S.; Bai, Y.E. Analysis of Genetic Diversity in Prunus sibirica L. in Inner Mongolia Using SCoT Molecular Markers. Genet. Resour. Crop Evol. 2022, 69, 1057–1068. [Google Scholar] [CrossRef]
- Thakur, M.; Luharch, R.; Sharma, V.; Sharma, D.P. Molecular Markers Based Genetic Relatedness Studies in Tissue Culture Propagated Japanese Plum Cultivars Santa Rosa and Frontier. Genet. Resour. Crop Evol. 2022, 69, 567–575. [Google Scholar] [CrossRef]
- Atapour, Y.; Ghanbari, A.; Estaji, A.; Haghjooyan, R. Evaluation of Genetic Diversity of Twenty-eight Sweet Cherry Genotypes by Morphological Traits and SCoT Markers in the Northwest of Iran. J. Genet. Resour. 2022, 8, 138–146. [Google Scholar]
- Wicker, T.; Sabot, F.; Hua-Van, A.; Bennetzen, J.L.; Capy, P.; Chalhoub, B.; Flavell, A.; Leroy, P.; Morgante, M.; Panaud, O.; et al. A Unified Classification System for Eukaryotic Transposbale Elments. Nat. Rev. Genet. 2007, 8, 973–982. [Google Scholar] [CrossRef]
- Kejnovsky, E.; Hawkins, J.S.; Feschotte, C. Plant Transposable Elements: Biology and Evolution. In Plant Genome Diversity; Wendel, J., Greilhuber, J., Dolezel, J., Leitch, I., Eds.; Springer: Vienna, Austria, 2012; Volume 1, pp. 17–34. [Google Scholar] [CrossRef]
- Castanera, R.; Tomás, C.; Ruggieri, V.; Vicient, C.; Eduardo, I.; Aranzana, M.; Arús, P.; Casacuberta, J. A Phased Genome of the Highly Heterozygous ‘Texas’ Almond Uncovers Patterns of Allele- specific Expression Linked to Heterozygous Structural Variants. Hortic. Res. 2024, 11, uhae106. [Google Scholar] [CrossRef] [PubMed]
- Verde, I.; Abbott, A.G.; Scalabrin, S.; Jung, S.; Shu, S.; Marroni, F.; Zhebentyayeva, T.; Dettori, M.T.; Grimwood, J.; Cattonaro, F.; et al. The High-quality Draft Genome of Peach (Prunus persica) Identifies Unique Patterns of Genetic Diversity, Domestication and Genome Evolution. Nat. Genet. 2013, 45, 487–494. [Google Scholar] [CrossRef] [PubMed]
- Zhang, Q.; Chen, W.; Sun, L.; Zhao, F.; Huang, B.; Yang, W.; Tao, Y.; Wang, J.; Yuan, Z.; Fan, G.; et al. The Genome of Prunus mume. Nat. Commun. 2012, 3, 1318. [Google Scholar] [CrossRef] [PubMed]
- Wang, J.; Liu, W.; Zhu, D.; Zhou, X.; Hong, P.; Zhao, H.; Tan, Y.; Chen, X.; Zhong, X.; Xu, L.; et al. A de novo Assembly of the Sweet Cherry (Prunus avium cv. Tieton) Genome Using Linked-read Sequencing Technology. PeerJ 2020, 8, e9114. [Google Scholar] [CrossRef]
- Roy, N.S.; Choi, J.Y.; Lee, S.I.; Kim, N.S. Marker Utility of Transposable Elements for Plant Genetics, Breeding, and Ecology: A Review. Genes Genom. 2015, 37, 141–151. [Google Scholar] [CrossRef]
- Kalendar, R.; Antonius, K.; Smýkal, P.; Schulman, A.H. iPBS: A Universal Method for DNA Fingerprinting and Retrotransposon Isolation. Theor. Appl. Genet. 2010, 121, 1419–1430. [Google Scholar] [CrossRef]
- Baránek, M.; Meszáros, M.; Sochorová, J.; Čechová, J.; Raddová, J. Utility of Retrotransposon-derived Marker Systems for Differentiation of Presumed Clones of the Apricot Cultivar Velkopavlovická. Sci. Hortic. 2012, 143, 1–6. [Google Scholar] [CrossRef]
- Shen, Y.; Ding, X.; Fei, W.; Cai, B.; Gao, Z.; Zhang, Z. Analysis of Genetic Diversity in Japanese Apricot (Prunus mume Sieb. et Zucc.) Based on REMAP and IRAP Molecular Markers. Sci. Hortic. 2011, 132, 50–58. [Google Scholar]
- Wang, G.; Li, R.; Wu, M.; Ren, F.; Wang, L.; Qiao, G. Assessment of Genetic Diversity of Prunus salicina ‘Shazikongxinli’ by Morphological Traits and Molecular Markers. Genet. Resour. Crop Evol. 2023, 70, 2727–2739. [Google Scholar] [CrossRef]
- Halász, J.; Kodad, O.; Hegedűs, A. Identification of a Recently Active Prunus-specific Non-autonomous Mutator Element with Considerable Genome Shaping Force. Plant J. 2014, 79, 220–231. [Google Scholar] [CrossRef] [PubMed]
- Muñoz-Sanz, J.V.; Zuriaga, E.; Badenes, M.L.; Romero, C. A Disulfide Bond A-like Oxidoreductase is a Strong Candidate Gene for Self-incompatibility in Apricot (Prunus armeniaca) Pollen. J. Exp. Bot. 2017, 68, 5069–5078. [Google Scholar] [CrossRef] [PubMed]
- Kumar, S.; Suleski, M.; Craig, J.M.; Kasprowicz, A.E.; Sanderford, M.; Li, M.; Stecher, G.; Hedges, S.B. TimeTree 5: An Expanded Resource for Species Divergence Times. Mol. Biol. Evol. 2022, 39, msac174. [Google Scholar] [CrossRef]
- Rai, M.K. Start Codon Targeted (SCoT) Polymorphism Marker in Plant Genome Analysis: Current Status and Prospects. Planta 2023, 257, 34. [Google Scholar] [CrossRef]
- Guo, L.; Li, H.; Luoa, Z.R. New Insights into the Genetic Diversity and Species Identification of the Native Apricots in Southern Xinjiang of China. Genet. Mol. Res. 2018, 17, 16039874. [Google Scholar] [CrossRef]
- Mahjbi, A.; Baraket, G.; Oueslati, A.; Salhi-Hannachi, A. Start Codon Targeted (SCoT) Markers Provide New Insights into the Genetic Diversity Analysis and Characterization of Tunisian Citrus Species. Biochem. Syst. Ecol. 2015, 61, 390–398. [Google Scholar] [CrossRef]
- Heikrujam, M.; Kumar, J.; Agrawal, V. Genetic Diversity Analysis among Male and Female Jojoba Genotypes Employing Gene Targeted Molecular Markers, Start Codon Targeted (SCoT) Polymorphism and CAAT Box-derived Polymorphism (CBDP) Markers. Meta Gene 2015, 5, 90–97. [Google Scholar] [CrossRef]
- Karapetsi, L.; Pantelidis, G.; Pratsinakis, E.D.; Drogoudi, P.; Madesis, P. Fruit Quality Traits and Genotypic Characterization in a Pomegranate ex situ (Punica granatum L.) Collection in Greece. Agriculture 2021, 11, 482. [Google Scholar] [CrossRef]
- Giri, M.S.; Jingade, P.; Huded, A.K.C.; Daivasikamani, S.; Mishra, M.K. Genetic Characterization of Paramyrothecium roridum Strains Isolated from Different Host Plants in Coffee Agroecosystem Using SRAP, SCoT Markers and ITS Sequencing. Indian Phytopathol. 2024, 77, 657–668. [Google Scholar] [CrossRef]
- Palacıoğlu, G.; Alkan, M.; Derviş, S.; Bayraktar, H.; Özer, G. Molecular Phylogeny of Plant Pathogenic Fungi Based on Start Codon Targeted (SCoT) Polymorphism. Mol. Biol. Rep. 2023, 50, 8271–8279. [Google Scholar] [CrossRef]
- Surányi, D. Nemzeti Szívügyünk III. A Pándy Meggy. Tájökológiai Lapok 2016, 14, 135–154. [Google Scholar] [CrossRef]
- Hartmann, W.; Neumüller, M. Breeding for Resistance: Breeding for Plum Pox Virus Resistant Plums (Prunus domestica L.) in Germany. EPPO Bull. 2006, 36, 332–336. [Google Scholar] [CrossRef]
- Butac, M.; Zagrai, I. and Botu, M. Breeding of New Plum Cultivars in Romania. Acta Hortic. 2010, 874, 51–58. [Google Scholar] [CrossRef]
- Faust, M.; Surányi, D. Origin and Dissemination of Plums in. Hortic. Rev. 2010, 23, 179–231. [Google Scholar]
- Lisch, D.; Girard, L.; Donlin, M.; Freeling, M. Functional Analysis of Deletion Derivatives of the Maize Transposon MuDR Delineates Roles for the MURA and MURB Proteins. Genetics 1999, 151, 331–341. [Google Scholar] [CrossRef]
- Bromham, L.; Hua, X.; Lanfear, R.; Cowman, P.F. Exploring the Relationships between Mutation Rates, Life History, Genome Size, Environment, and Species Richness in Flowering Plants. Am. Nat. 2015, 185, 507–524. [Google Scholar] [CrossRef]
- Oki, N.; Yano, K.; Okumoto, Y.; Tsukiyama, T.; Teraishi, M.; Tanisaka, T. A Genome-wide View of Miniature Inverted-repeat Transposable Elements (MITEs) in Rice, Oryza sativa ssp. japonica. Genes Genet. Sys. 2008, 83, 321–329. [Google Scholar] [CrossRef]
- Zhou, M.; Tao, G.; Pi, P.; Zhu, Y.; Bai, Y.; Meng, X. Genome-wide Characterization and Evolution Analysis of Miniature Inverted-repeat Transposable Elements (MITEs) in Moso Bamboo (Phyllostachys heterocycla). Planta 2016, 244, 775–787. [Google Scholar] [CrossRef]
- Goodall, G.J.; Filipowicz, W. Different Effects of Intron Nucleotide Composition and Secondary Structure on pre-mRNA Splicing in Monocot and Dicot Plants. EMBO J. 1991, 10, 2635–2644. [Google Scholar] [CrossRef]
- Xie, X.; Wu, N. Introns in Higher Plant Genes. Chin. Sci. Bull. 2002, 47, 1409–1415. [Google Scholar] [CrossRef]
- Biro, J.C. Correlation between Nucleotide Composition and Folding Energy of Coding Sequences with Special Attention to Wobble Bases. Theor. Biol. Med. Model. 2008, 5, 14. [Google Scholar] [CrossRef] [PubMed]
- Šmarda, P.; Bureš, P. The Variation of Base Composition in Plant Genomes. In Plant Genome Diversity; Wendel, J., Greilhuber, J., Dolezel, J., Leitch, I., Eds.; Springer: Vienna, Austria, 2012; Volume 1, pp. 209–235. [Google Scholar]
- Gingerich, D.J.; Gagne, J.M.; Salter, D.W.; Hellmann, H.; Estelle, M.; Ma, L.; Vierstra, R.D. Cullins 3a and 3b Assemble with Members of the Broad Complex/tramtrack/bric-a-brac (BTB) Protein Family to Form Essential Ubiquitin-protein Ligases (E3s) in Arabidopsis. J. Biol. Chem. 2005, 280, 18810–18821. [Google Scholar] [CrossRef] [PubMed]
- Ma, Y.; Zhang, X.; Zhang, W.; Li, L.; Cheng, S.; Guo, M.; Chen, G. Transcriptome Analysis Reveals the Mechanism of Delayed Softening of ‘France’ Prune (Prunus domestica L.) during Storage at Near-freezing Temperature. LWT 2023, 189, 115446. [Google Scholar] [CrossRef]
- Wu, B.; Gao, L.; Gao, J.; Xu, Y.; Liu, H.; Cao, X.; Zhang, B.; Chen, K. Genome-wide Identification, Expression Patterns, and Functional Analysis of UDP Glycosyltransferase Family in Peach (Prunus persica L. Batsch). Front. Plant Sci. 2017, 8, 389. [Google Scholar] [CrossRef]
- Foix, L.; Nadal, A.; Zagorščak, M.; Ramšak, Ž.; Esteve-Codina, A.; Gruden, K.; Pla, M. Prunus persica Plant Endogenous Peptides PpPep1 and PpPep2 Cause PTI-like Transcriptome Reprogramming in Peach and Enhance Resistance to Xanthomonas arboricola pv. pruni. BMC Genom. 2021, 22, 360. [Google Scholar] [CrossRef]
- Huang, T.S.; Wei, T.; Laliberté, J.F.; Wang, A. A Host RNA Helicase-like Protein, AtRH8, Interacts with the Potyviral Genome-linked Protein, VPg, Associates with the Virus Accumulation Complex, and is Essential for Infection. Plant Physiol. 2010, 152, 255–266. [Google Scholar] [CrossRef]
- Mahmood, U.; Fan, Y.; Wei, S.; Niu, Y.; Li, Y.; Huang, H.; Chen, Y.; Tang, Z.; Liu, L.; Qu, C.; et al. Comprehensive Analysis of Polygalacturonase Genes Offers New Insights into their Origin and Functional Evolution in Land Plants. Genomics 2021, 113, 1096–1108. [Google Scholar] [CrossRef]
- Li, S.; Wu, P.; Yu, X.; Cao, J.; Chen, X.; Gao, L.; Chen, K.; Grierson, D. Contrasting Roles of Ethylene Response Factors in Pathogen Response and Ripening in Fleshy Fruit. Cells 2022, 11, 2484. [Google Scholar] [CrossRef]
- Wang, G.; Weng, W.; Jia, Z.; Zhang, J.; Wang, T.; Xuan, J. Identification of Candidate Genes Associated with Pulp Color by Transcriptomic Analysis of ‘Huaxiu’ Plum (Prunus salicina Lindl.) during Fruit-ripening. Curr. Issues Mol. Biol. 2022, 44, 6368–6384. [Google Scholar] [CrossRef]
- Dietrich, C.R.; Cui, F.; Packila, M.L.; Li, J.; Ashlock, D.A.; Nikolau, B.J.; Schnable, P.S. Maize Mu Transposons are Targeted to the 5′ Untranslated Region of the gl8 Gene and Sequences Flanking Mu Target-site Duplications Exhibit Nonrandom Nucleotide Composition Throughout the Genome. Genetics 2002, 160, 697–716. [Google Scholar] [CrossRef]
- Hardy, E.C.; Balcerowicz, M. Untranslated yet Indispensable—UTRs Act as Key Regulators in the Environmental Control of Gene Expression. J. Exp. Bot. 2024, 75, 4314–4331. [Google Scholar] [CrossRef] [PubMed]
- Hu, J.; Liu, C.; Du, Z.; Guo, F.; Song, D.; Wang, N.; Wei, Z.; Jiang, J.; Cao, Z.; Shi, C.; et al. Transposable Elements Cause the Loss of Self-incompatibility in Citrus. Plant Biotechnol. J. 2024, 22, 1113–1131. [Google Scholar] [CrossRef]
- Guo, X.; Fang, D.; Sahu, S.K.; Yang, S.; Guang, X.; Folk, R.; Smith, S.A.; Chanderbali, A.S.; Chen, S.; Liu, M.; et al. Chloranthus Genome Provides Insights into the Early Diversification of Angiosperms. Nat. Commun. 2021, 12, 6930. [Google Scholar] [CrossRef] [PubMed]
- Pouget, M.; Youssef, S.; Dumas, P.J.; Baumberger, T.; San Roman, A.; Torre, F.; Affre, L.; Médail, F.; Baumel, A. Spatial Mismatches between Plant Biodiversity Facets and Evolutionary Legacy in the Vicinity of a Major Mediterranean City. Ecol. Indic. 2016, 60, 736–745. [Google Scholar] [CrossRef]
- Wang, D.; Yu, C.; Zuo, T.; Zhang, J.; Weber, D.F.; Peterson, T. Alternative Transposition Generates New Chimeric Genes and Segmental Duplications at the Maize p1 Locus. Genetics 2015, 201, 925–935. [Google Scholar] [CrossRef]
- Xin, Y.; Ma, B.; Xiang, Z.; He, N. Amplification of Miniature Inverted-repeat Transposable Elements and the Associated Impact on gene Regulation and Alternative Splicing in Mulberry (Morus notabilis). Mobile DNA 2019, 10, 27. [Google Scholar] [CrossRef]
- Yu, Z.; Li, J.; Wang, H.; Ping, B.; Li, X.; Liu, Z.; Guo, B.; Yu, Q.; Zou, Y.; Sun, Y.; et al. Transposable Elements in Rosaceae: Insights into Genome Evolution, Expression Dynamics, and Syntenic Gene Regulation. Hortic. Res. 2024, 11, uhae118. [Google Scholar] [CrossRef]
- Batzer, M.A.; Deininger, P.L. Alu Repeats and Human Genomic Diversity. Nat. Rev. Genet. 2002, 3, 370–379. [Google Scholar] [CrossRef]
- Halász, J.; Fodor, A.; Pedryc, A.; Hegedűs, A. S-genotyping of Eastern European Almond Cultivars: Identification and Characterization of New (S36–S39) Self-incompatibility Ribonuclease Alleles. Plant Breed. 2010, 129, 227–232. [Google Scholar] [CrossRef]
- López, M.; Vargas, F.J.; Batlle, I. Self-(in) compatibility Almond Genotypes: A Review. Euphytica 2006, 150, 1–16. [Google Scholar] [CrossRef]
- Surányi, D. Plum Cultivars. In Hungarian Fruit Cultivars; Soltész, M., Ed.; Mezőgazda Kiadó: Budapest, Hungary, 2013; pp. 377–393. [Google Scholar]
- Amiryousefi, A.; Hyvönen, J.; Poczai, P. iMEC: Online Marker Efficiency Calculator. Appl. Plant Sci. 2018, 6, e01159. [Google Scholar] [CrossRef] [PubMed]
- Yeh, F.C.; Boyle, T.J.B. Population Genetic Analysis of Co-dominant and Dominant Markers and Quantitative Traits. Belg. J. Bot. 1997, 129, 157–163. [Google Scholar]
- Hammer, O. PAST: Paleontological Statistics Software Package for Education and Data Analysis. Palaeontol. Electron. 2001, 4, 9. [Google Scholar]
- Altschul, S.F.; Gish, W.; Miller, W.; Myers, E.W.; Lipman, D.J. Basic Local Alignment Search Tool. J. Mol. Biol. 1990, 215, 403–410. [Google Scholar] [CrossRef]
- Zhang, Z.; Schwartz, S.; Wagner, L.; Miller, W. A Greedy Algorithm for Aligning DNA Sequences. J. Comput. Biol. 2000, 7, 203–214. [Google Scholar] [CrossRef]
- Kumar, S.; Stecher, G.; Tamura, K. MEGA7: Molecular Evolutionary Genetics Analysis Version 7.0 for Bigger Datasets. Mol. Biol. Evol. 2016, 33, 1870–1874. [Google Scholar] [CrossRef]
- Hall, T.A. BioEdit: A User-friendly Biological Sequence Alignment Editor and Analysis Program for Windows 95/98/NT. Nucleic Acids Symp. Ser. 1999, 41, 95–98. [Google Scholar]
- Babicki, S.; Arndt, D.; Marcu, A.; Liang, Y.; Grant, J.R.; Maciejewski, A.; Wishart, D.S. Heatmapper: Web-enabled Heat Mapping for All. Nucleic Acids Res. 2016, 44, W147–W153. [Google Scholar] [CrossRef]
Disclaimer/Publisher’s Note: The statements, opinions and data contained in all publications are solely those of the individual author(s) and contributor(s) and not of MDPI and/or the editor(s). MDPI and/or the editor(s) disclaim responsibility for any injury to people or property resulting from any ideas, methods, instructions or products referred to in the content. |
© 2025 by the authors. Licensee MDPI, Basel, Switzerland. This article is an open access article distributed under the terms and conditions of the Creative Commons Attribution (CC BY) license (https://creativecommons.org/licenses/by/4.0/).