Article

Overexpression of the Glycyrrhiza uralensis Phenylalanine Ammonia-Lyase Gene GuPAL1 Promotes Flavonoid Accumulation in Arabidopsis thaliana

1
Key Laboratory of Xinjiang Phytomedicine Resource and Utilization of Ministry of Education, Key Laboratory of Oasis Town and Mountain-Basin System Ecology of Bingtuan, College of Life Sciences, Shihezi University, Shihezi 832000, China
2
Department of Civil, Environmental, and Construction Engineering, College of Engineering and Computer Science, University of Central Florida, Orlando, FL 32816, USA
3
National Key Laboratory of Cotton Bio-Breeding and Integrated Utilization, School of Life Science, Henan University, Kaifeng 475000, China
*
Authors to whom correspondence should be addressed.
These authors contributed equally to this work.
Int. J. Mol. Sci. 2025, 26(9), 4073; https://doi.org/10.3390/ijms26094073
Submission received: 20 March 2025 / Revised: 21 April 2025 / Accepted: 23 April 2025 / Published: 25 April 2025

Abstract

:
Phenylalanine ammonia-lyase (PAL) serves as a pivotal regulatory enzyme at the initial branching point of the phenylpropanoid pathway, exerting a profound influence on downstream reactions essential for flavonoid biosynthesis. Glycyrrhiza species are important medicinal plants and provide plenty of roots as raw materials for further utilization, with the components of glycyrrhizic acid and flavonoids as two major active ingredients. However, functional studies of the PAL genes in the medicinal Glycyrrhiza species remain limited. In this study, we identified seven PAL family genes from each of the three medicinal Glycyrrhiza species, Glycyrrhiza uralensis Fisch., G. inflata Bat., and G. glabra L., and comprehensively analyzed their phylogenetic relationships, gene structures, motif distributions, and promoter cis-elements. Gene expression profiling revealed that PAL1 is highly expressed in roots and significantly induced by drought and salt stresses. We further selected G. uralensis GuPAL1 for functional investigation in Arabidopsis. GuPAL1-overexpression lines (GuPAL1-OE) demonstrated significant enhancements in plant growth, flavonoid accumulation, and hormone levels in Arabidopsis thaliana. Conversely, the Atpal1 mutant plants displayed marked reductions in these traits, while the transgenic lines of GuPAL1-OE in the Atpal1 mutant (Atpal1/GuPAL1) recovered to the normal phenotypes similar to wild type (WT). Transcriptomic analysis of the GuPAL1-OE plants compared to WT demonstrated that several key genes in the phenylpropanoid and flavonoid metabolic pathways (4CL, CCoAOMT, CAD, POD, F3H, FLS) were significantly enriched, suggesting that GuPAL1 may promote plant growth and flavonoid biosynthesis by regulating diverse cellular functions, metabolic pathways, and associated gene expressions. These findings highlight the functional importance of GuPAL1 in flavonoid biosynthesis, and provide valuable insights into the molecular mechanisms underlying the medicinal properties of Glycyrrhiza species.

1. Introduction

Licorice is a widely used plant that plays an important role in various fields, including medicine, food, cosmetics, animal husbandry, and ecology. In the medicinal field, the Chinese Pharmacopoeia has officially recorded the dried roots and rhizomes of the leguminous plants G. uralensis, G. inflata, and G. glabra as medicinal licorice since the 2005 edition [1]. In the food industry, licorice extract is widely used as a natural sweetener in products such as chewing gum, candy, and alcoholic beverages, aligning with the development trend of health foods [2]. In the cosmetics industry, licorice root extract offers a safe and effective option for treating skin issues such as melasma and hyperpigmentation [3]. In animal husbandry, licorice, as a feed additive, can improve poultry growth performance, feed efficiency, antioxidant levels, and immunity, and has positive effects on the immune system, liver, and lung diseases [4]. In the ecological field, licorice can be used to ameliorate salinized soils, as its rhizobium can fix nitrogen and enhance soil fertility. Co-inoculation of licorice with rhizobia and Pseudomonas significantly increases plant biomass, nodulation, and nitrogen content [5]. Additionally, licorice is abundant in a variety of bioactive compounds, particularly flavonoids, which exhibit significant pharmacological properties, including antioxidant, anti-inflammatory, antimicrobial, and anticancer effects. These bioactive flavonoids have not only underscored the medicinal value of licorice but also propelled the development of novel licorice-derived products [6]. With the escalating market demand for licorice, wild resources have experienced a dramatic decline, rendering artificial cultivation a critical strategy to address the resource shortage. The cultivation of licorice, especially the three Glycyrrhiza species of G. uralensis, G. inflata, and G. glabra, particularly for its flavonoid-rich extracts, is essential to meet both industrial and therapeutic needs.
The Chinese Pharmacopoeia and other regulations specify the content range of glycyrrhizin and liquiritin in licorice [1], but the medicinal component content in artificially cultivated licorice is relatively low, especially liquiritin, which often fails to meet the standards. Liquiritin is a kind of flavonoid, and G. uralensis primarily grows in desert or saline-alkaline soils [7]. Environmental stress, such as salt and drought, can promote the accumulation of flavonoids in G. uralensis, enhancing both their content and quality [8]. However, the molecular mechanisms underlying this phenomenon remain unclear. This study aims to elucidate the molecular mechanisms underlying flavonoid accumulation under salt and drought stress in G. uralensis. The findings will provide both theoretical foundations for stress response understanding and practical insights for cultivation enhancement.
Flavonoids are an important class of polyphenolic compounds in plant secondary metabolites. Their synthesis is influenced by various factors, including light [9,10,11,12], temperature [13,14,15,16,17], herbivorous insects [18], pathogens [19,20], plant pollination [21], C/N ratio [22,23], and plant hormones [24,25,26,27,28,29,30,31,32,33,34,35,36,37,38,39,40,41,42]. The biosynthesis of flavonoids begins with the shikimate pathway, where carbohydrates are converted into the aromatic amino acid phenylalanine. This then enters the flavonoid biosynthesis pathway through the phenylpropanoid pathway, which is a branch of phenylpropanoid metabolism [43]. The phenylalanine pathway is crucial in plant metabolism as it facilitates the transition from primary to secondary metabolism. PAL is the key rate-limiting enzyme in this pathway, catalyzing the conversion of phenylalanine to cinnamic acid [44,45]. PAL is positioned at the upstream node of the metabolic network, directly determining substrate availability and influencing all downstream reactions of flavonoid biosynthesis. Its activity and expression not only regulate the types and yields of flavonoids but also impact the plant’s physiological and biochemical characteristics and environmental adaptability [46,47].
In the 1960s, Koukol et al. successfully isolated the first PAL gene from plants [48]. Since then, PAL genes have been successfully isolated from a variety of plants, including Solanum tuberosum, soybean, Brassica juncea, ginkgo, and Brassica napus L. [49,50,51,52]. The PAL gene family is extensive, with significant variation in the number of members between different species, though changes at the coding sequence level are relatively small [53,54]. Currently, there are few reports on the PAL gene family and its functions in medicinal Glycyrrhiza species. In this study, we identified seven PAL genes from three Glycyrrhiza species, characterizing their phylogeny, structure, and regulatory elements. GuPAL1 showed significant upregulation under salt/drought stress. In Arabidopsis, GuPAL1 overexpression enhanced stress tolerance compared to the WT and Atpal1 mutant. Transcriptomics revealed GuPAL1’s role in activating flavonoid biosynthesis through metabolic and transcriptional reprogramming, demonstrating its central regulatory function.

2. Results

2.1. Identification of the PAL Gene Family in Three Medicinal Glycyrrhiza Species

We performed a BLAST (Version 2.14.0) search using the A. thaliana PAL gene sequences against the genomes of three medicinal Glycyrrhiza species to identify the PAL genes present in each species. The identified PAL genes were then submitted to the Pfam, CDD, and SMART databases for validation of the presence of the PAL domain. Through this process, we identified seven members of the PAL gene family in each Glycyrrhiza species. Based on the chromosomal positions of each PAL gene and the phylogenetic relationships among the PAL genes from the three Glycyrrhiza species, we assigned names to the genes and compiled a correspondence between gene ID numbers and gene names, as shown in Table S1. The coding sequences of the PAL genes analyzed exhibited considerable variation in length, ranging from 374 amino acids (AA) (GgPAL6) to 737 AA (GgPAL1, GiPAL1, GuPAL1), with an average of approximately 690 AA per protein. The molecular weights (MW) of the PAL proteins varied between 40,463.41 Da (GgPAL6) and 78,776.78 Da (GgPAL4). Theoretical isoelectric point (pI) values were predominantly acidic (pI < 7), except for GgPAL6 (pI 8.51) and GuPAL4 (pI 8.55), which exhibited basic pI values. Furthermore, all PAL proteins displayed negative Grand Average of Hydropathicity (GRAVY) values (−0.181 to −0.006), confirming their hydrophilic nature (Table S1).

2.2. Chromosomal Distribution Patterns of PAL Gene Family in Three Medicinal Glycyrrhiza Species

Through the analysis of the distribution of PAL genes on the chromosomes of G. glabra, G. inflata, and G. uralensis, it was observed that the distribution of PAL genes on the chromosomes is highly consistent across the three Glycyrrhiza species (Figure 1). Among them, the PAL3PAL5 genes are clustered on chromosome 2. These closely positioned genes are likely functionally related, potentially co-participating in shared biological processes through similar transcriptional regulation mechanisms or interactions. In contrast, other PAL genes exhibit a dispersed distribution across the genome. This dispersed arrangement enhances gene expression flexibility and functional diversity, enabling organisms to adapt more effectively to environmental changes. Such a distribution pattern is the result of long-term evolutionary selection, facilitating the coordination of diverse biological functions and meeting the demands of survival and reproduction.

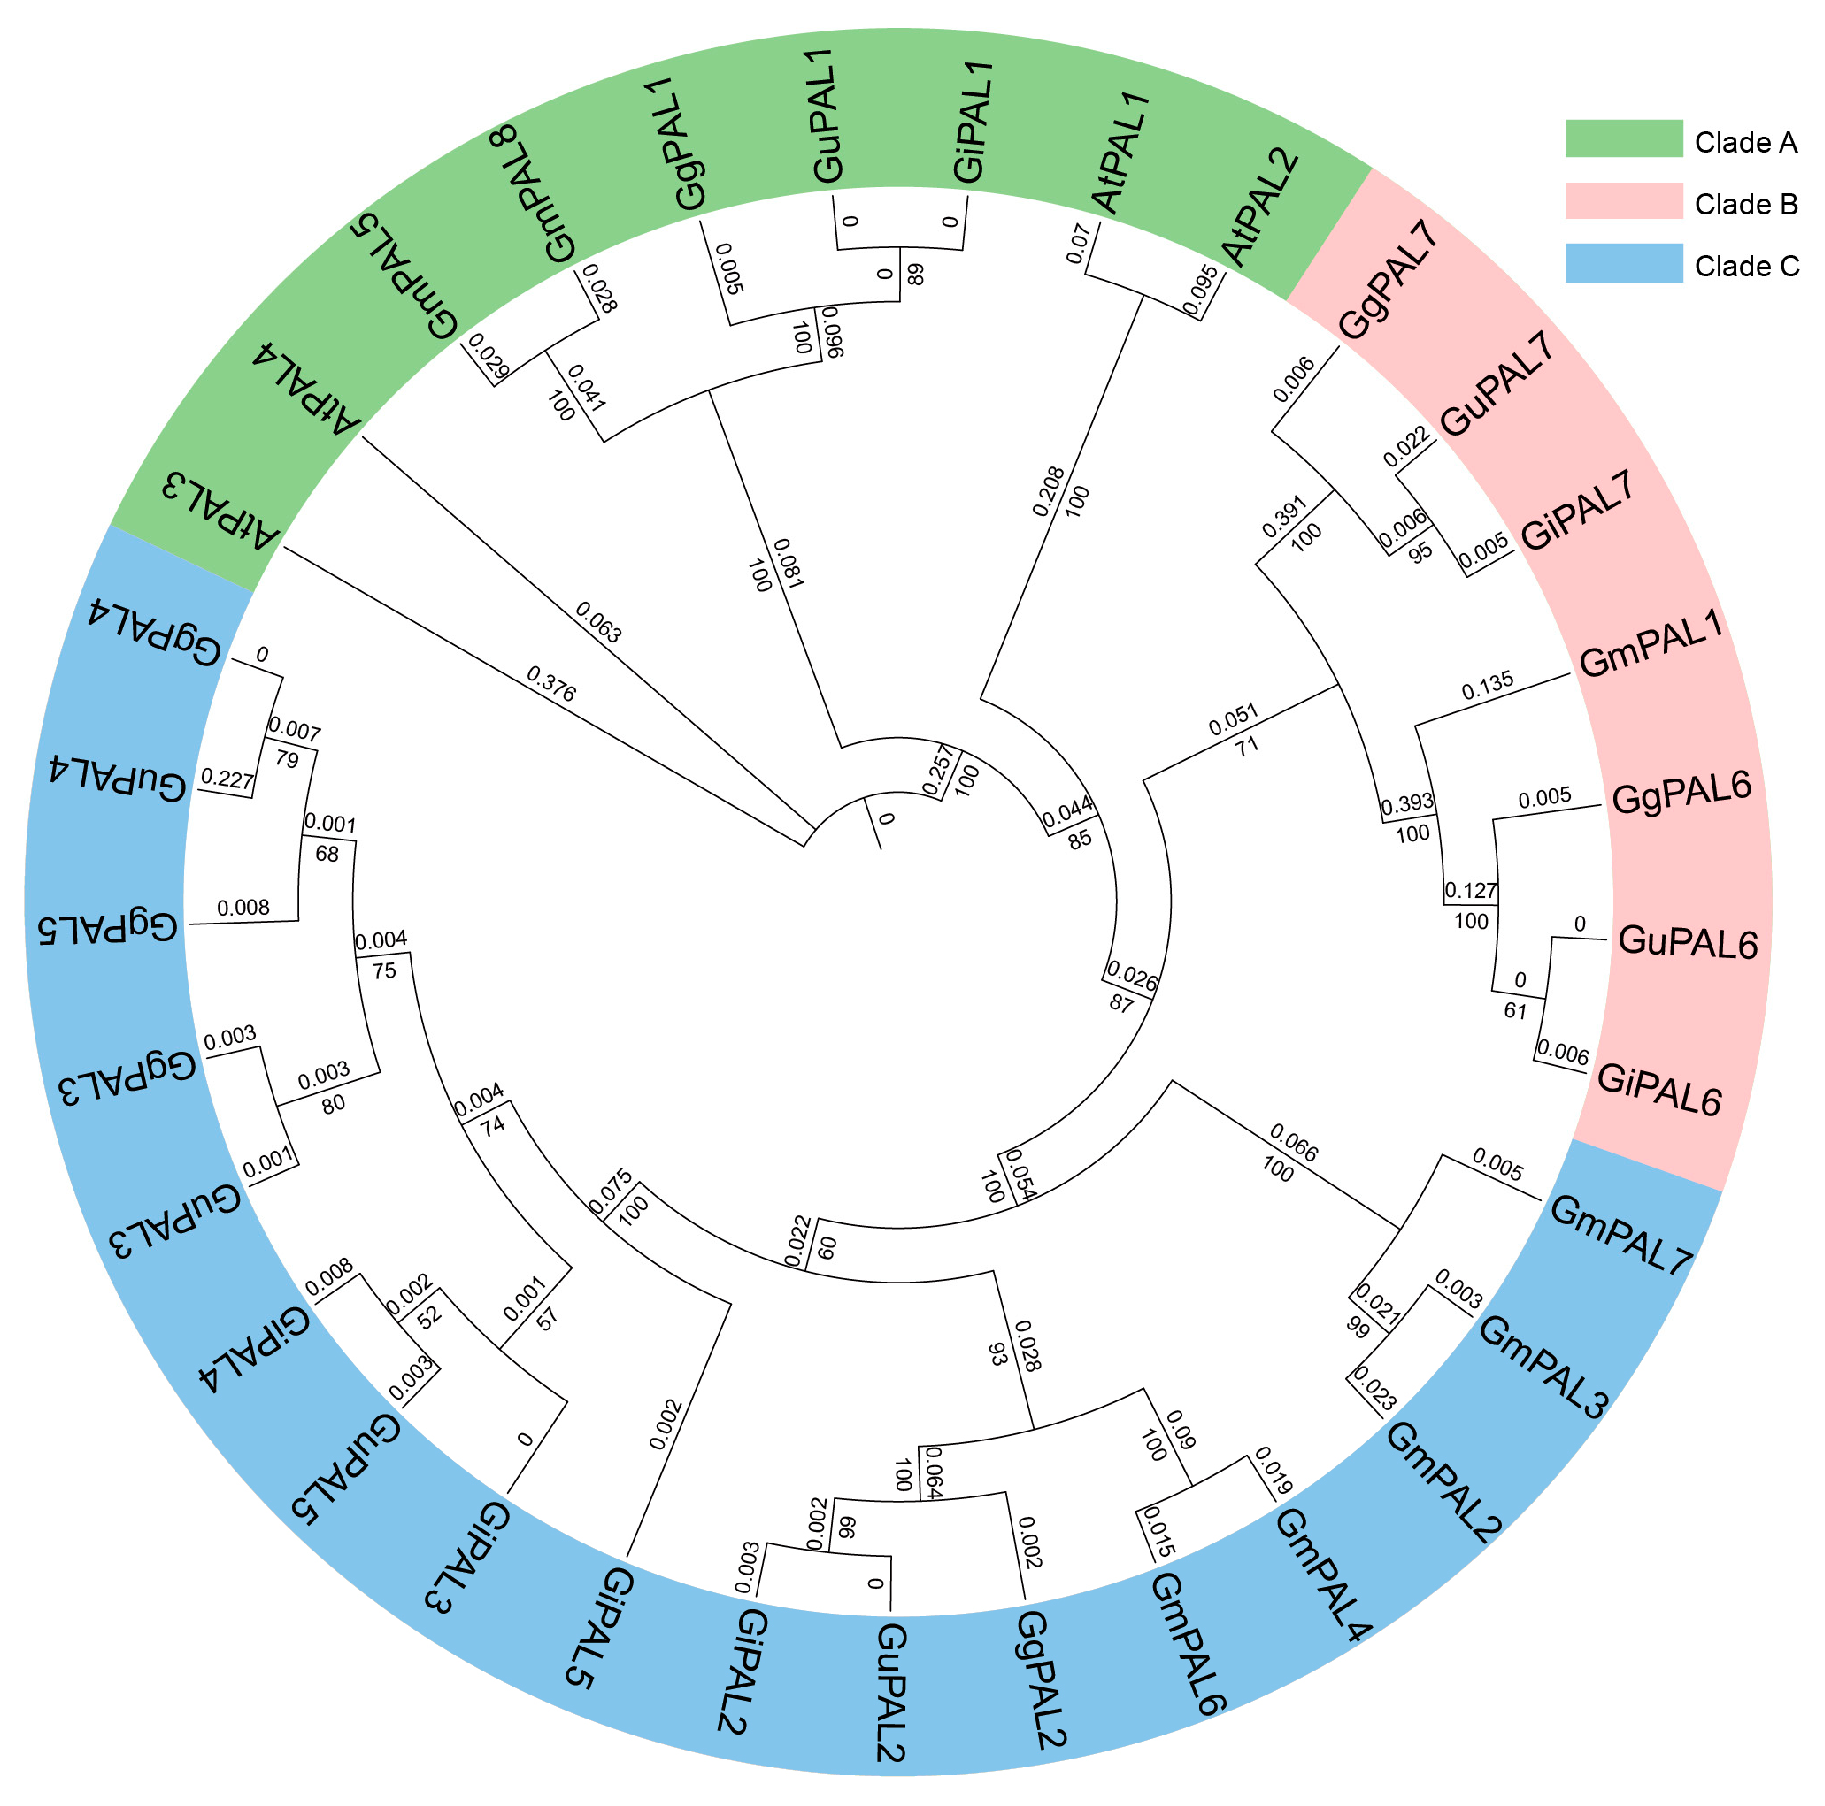
2.3. Phylogenetic Analysis of the PAL Gene Family in Three Medicinal Glycyrrhiza Species, Soybean, and A. thaliana

To enhance the classification and evolutionary relationships of PALs, a phylogenetic tree was constructed using the PAL protein sequences from G. uralensis, G. inflata, G. glabra, Soybean, and A. thaliana. The 33 proteins were clustered into three branches, Clade A, Clade B, and Clade C, in the phylogenetic tree (Figure 2). The Clade A branch includes PAL gene members from A. thaliana (AtPAL1AtPAL4), soybean (GmPAL5, GmPAL8), and the three Glycyrrhiza species (GuPAL1, GiPAL1, GgPAL1). The Clade B branch also gathers PAL genes from multiple species, including soybean’s GmPAL1, and genes from Glycyrrhiza (GuPAL6, GuPAL7, GiPAL6, GiPAL7, GgPAL6, GgPAL7). The Clade C branch contains soybean’s GmPAL2, GmPAL3, GmPAL4, GmPAL6, and GmPAL7 genes, as well as genes from Glycyrrhiza (GuPAL2GuPAL5, GiPAL2GiPAL5, GgPAL2GgPAL5). The clustering patterns of PAL gene members across species reflect both the conservation and specificity of their family evolution. This provides clues for exploring the evolution of gene functions and offers molecular evidence for understanding the evolution of plant secondary metabolism.

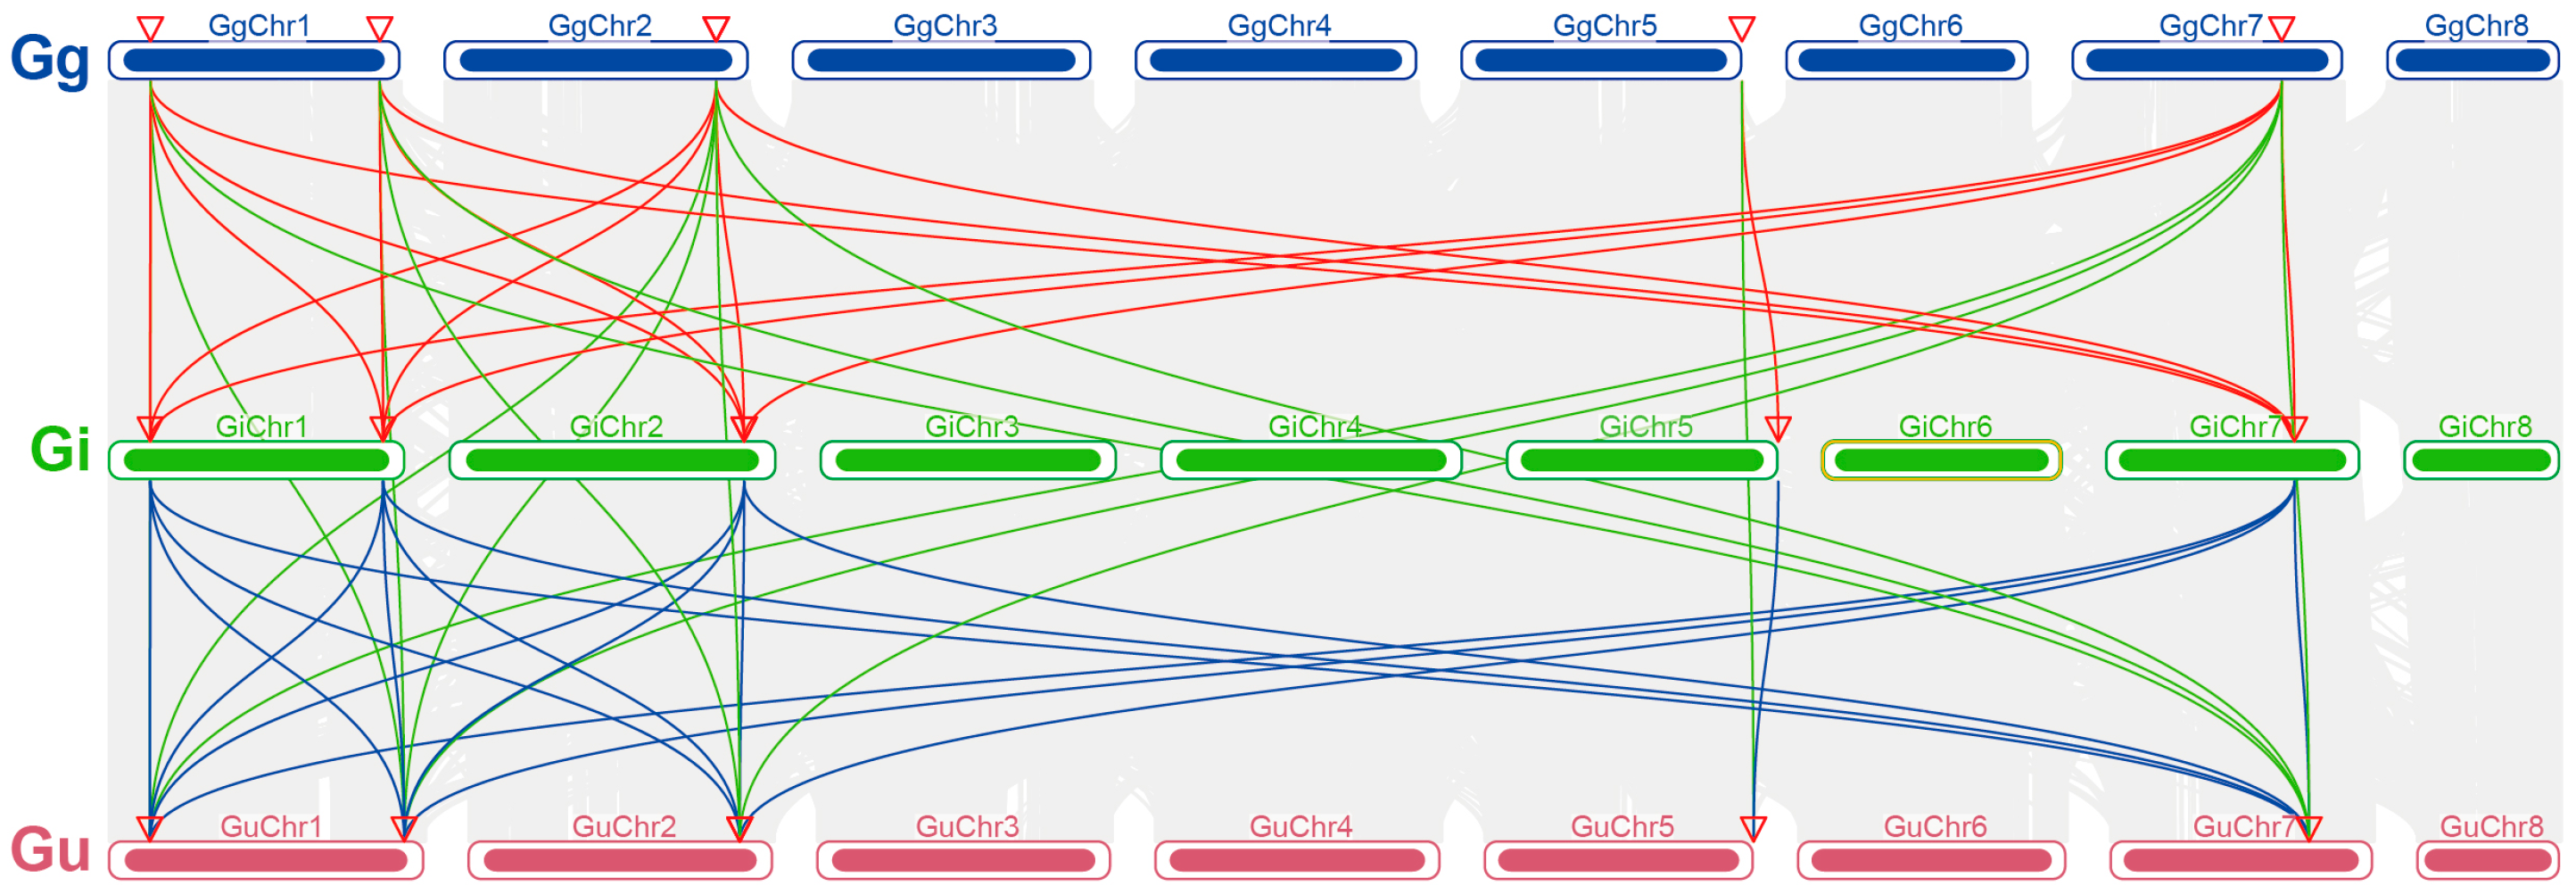
2.4. Analysis of Collinearity Relationships Among PAL Gene Families on Chromosomes in Three Medicinal Glycyrrhiza Species

To explore the potential evolutionary mechanisms of the PAL gene family in the three medicinal Glycyrrhiza species, an analysis of collinearity relationships was conducted on the genomes of G. uralensis, G. inflata, and G. glabra (Figure 3). From the figure, it is apparent that there are extensive collinear relationships among the chromosomes of the three Glycyrrhiza species, suggesting that their genomic structures have been largely preserved during evolution. The discovery of these collinear relationships provides important evidence for in-depth studies on the evolutionary relationships of Glycyrrhiza species.

2.5. Analysis of Promoter Cis-Acting Elements, Conserved Motifs, and Gene Structures of PAL Gene Family

We conducted an in-depth analysis of the structural and functional diversity of the PAL gene family from multiple perspectives, including element distribution, evolutionary relationships, motif distribution, and CDS structure (Figure 4). The distribution of cis-elements varies among different genes, with only closely related genes exhibiting similar distribution patterns. This may be associated with the unique expression patterns of genes in different tissues, developmental stages, or environmental conditions (Figure 4A). The heatmap of cis-element counts reveals that the most abundant elements are predominantly concentrated on PAL1, including G-box, GT1-box, and ABRE, all of which are stress-related, suggesting that PAL1 is likely induced by stress. This is followed by PAL2 (Figure 4B). The results of domain and gene structure analyses indicate that most genes share conserved domains, and closely related genes exhibit similar gene structures. Notably, PAL1 and PAL2 contain more exons than other genes, reflecting their potential functional complexity and evolutionary adaptability. This structural diversity may contribute to their specialized roles in stress responses and metabolic regulation. These findings suggest that PAL1 likely plays a critical role in the stress response of Glycyrrhiza plants.

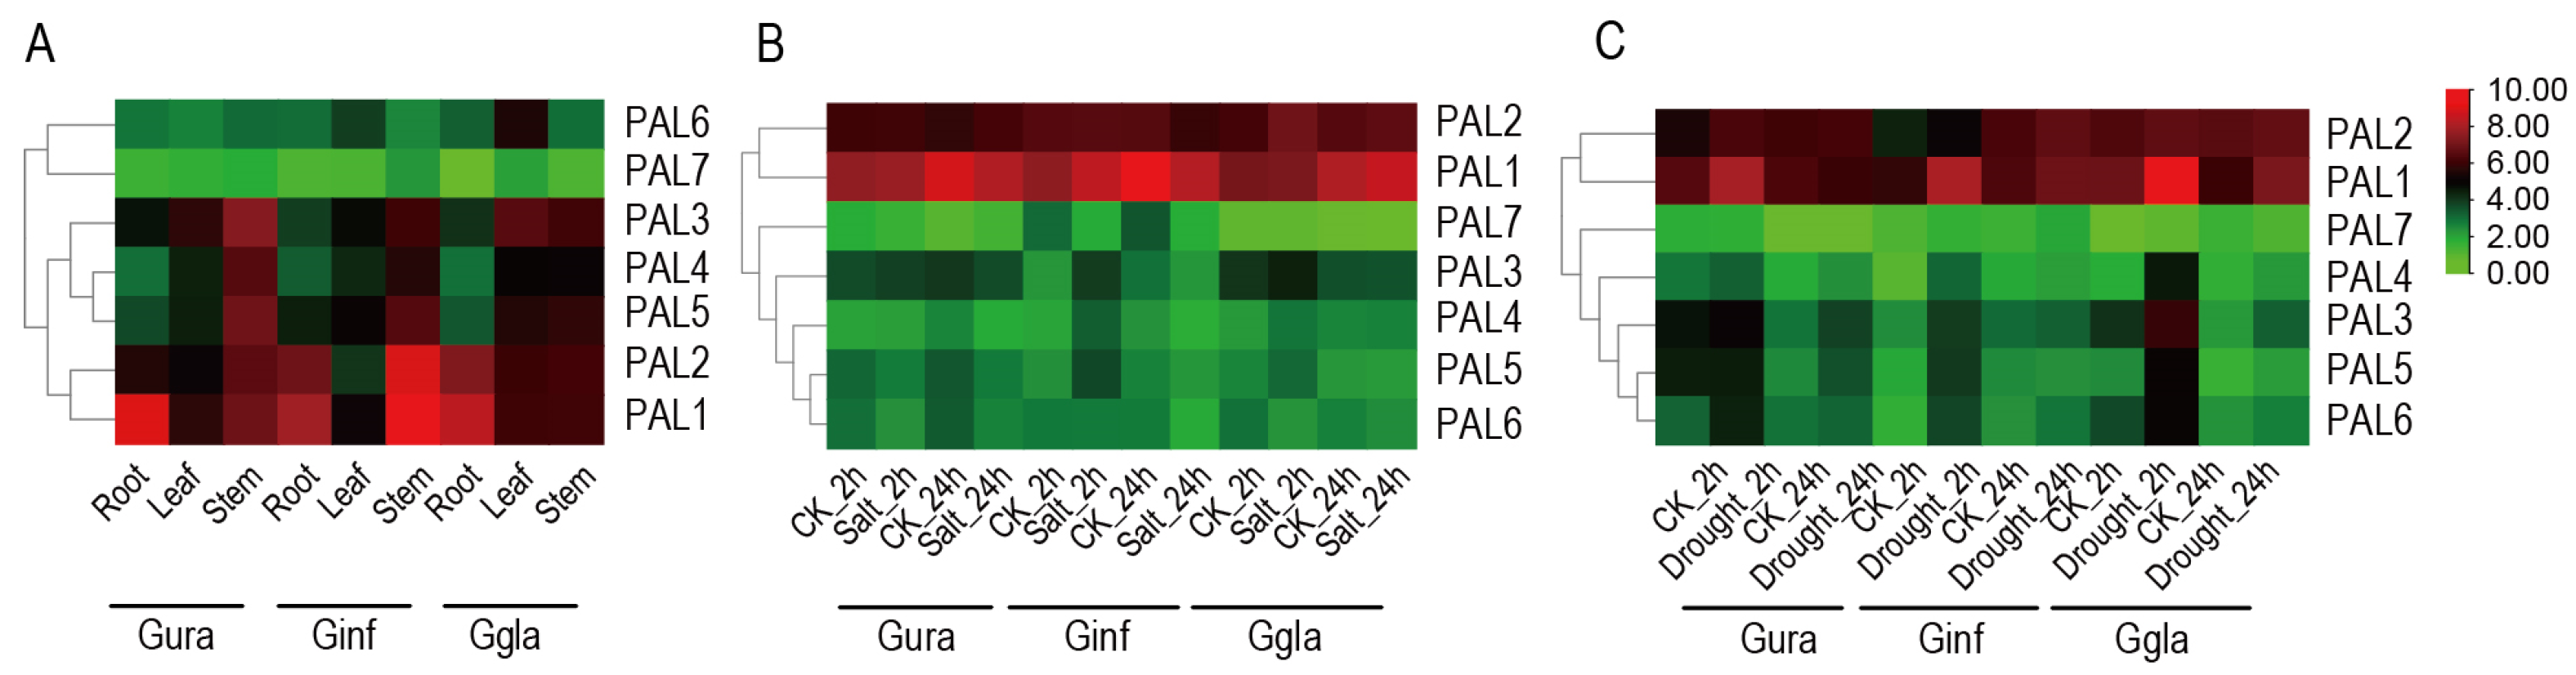
2.6. Analysis of Tissue-Specific and Stress-Induced Expression of PAL Gene Family in Three Medicinal Glycyrrhiza Species

By revealing the expression patterns of PAL genes in different tissues and under stress conditions in the three medicinal Glycyrrhiza species, we have provided important insights into their roles in plant growth, development, and stress response (Figure 5). The tissue expression heatmap reveals that PAL1 and PAL2 are ubiquitously expressed across all tissues, with PAL1 exhibiting particularly high expression levels in the roots and stems of G. uralensis (Gura) as well as in the roots of G. inflata (Ginf) and G. glabra (Ggla) (Figure 5A). This suggests that PAL1 is closely associated with root metabolite content. Under salt and drought stress treatments, PAL1 and PAL2 showed the highest expression levels, with PAL1 being significantly induced, consistent with the earlier analysis of promoter cis-elements (Figure 4 and Figure 5B). These findings indicate that PAL1, particularly GuPAL1, is a key stress-responsive gene and strongly linked to root metabolite accumulation, making it a promising candidate for further investigation.

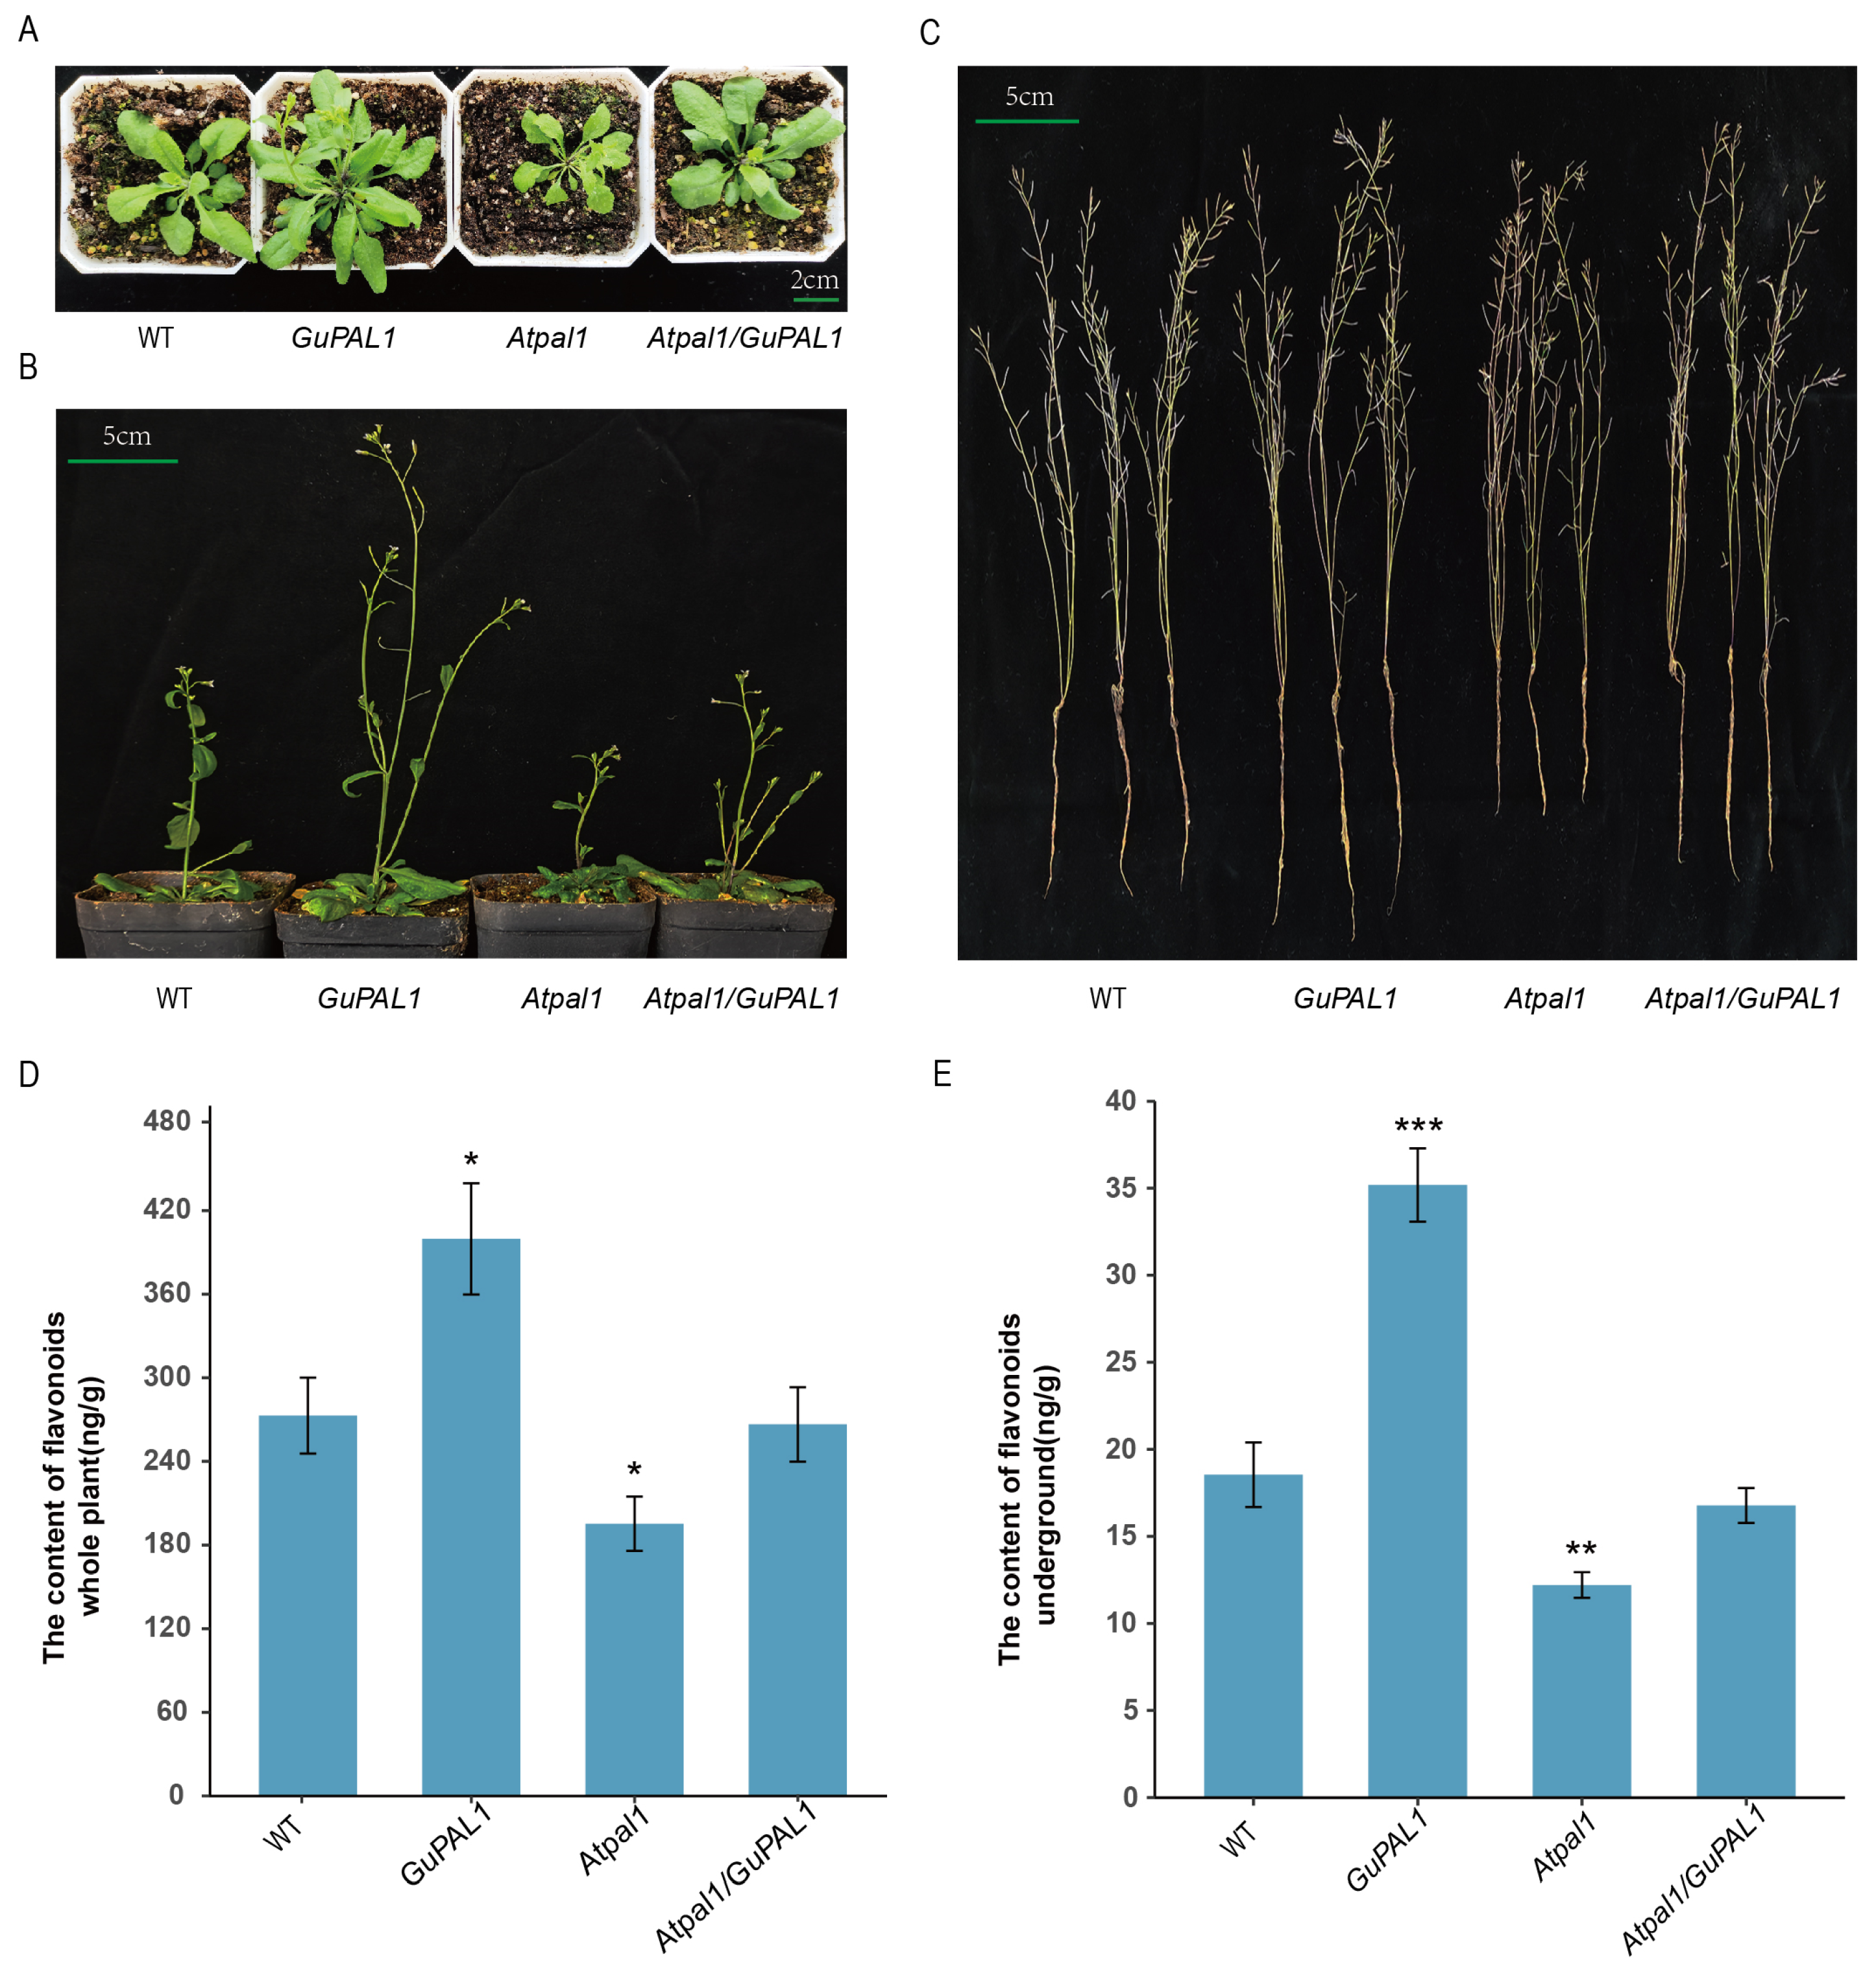
2.7. Phenotypic Analysis of Wild-Type, GuPAL1-OE, Atpal1 Mutant, and Atpal1/GuPAL1 A. thaliana Plants

By transforming WT and Atapl1 mutant (SALK_000357) A. thaliana plants with 35S::GuPAL1 and obtaining T3 generation plants, the study analyzed the role of GuPAL1 in promoting A. thaliana growth and flavonoid biosynthesis. The WT, GuPAL1-OE, Atpal1 mutant, and Atpal1/GuPAL1 A. thaliana seedlings were transplanted into nutrient soil and their phenotypes were continuously observed and recorded. As shown in Figure 6A, compared to the WT 15 days after transplantation, the GuPAL1-OE lines exhibited more vigorous growth, with a significant increase in rosette leaf number and a noticeable enlargement of leaves. However, the Atpal1 mutant lines showed a decrease in rosette leaf number and smaller leaf size. The Atpal1/GuPAL1 A. thaliana plants displayed a growth phenotype similar to the WT. Further comparisons of plant growth at 25 and 45 days were conducted. At 25 days, the GuPAL1-OE showed significantly greater plant height than both the WT and Atpal1 mutant, while the Atpal1/GuPAL1 functional complement plants exhibited heights similar to the WT (Figure 6B). By 45 days, the GuPAL1-OE plants maintained a clear growth advantage, with significantly longer overall plant length compared to the WT and Atpal1 mutant, whereas the Atpal1 mutant functional complement plants displayed lengths similar to the WT (Figure 6C). These results suggest that overexpression of GuPAL1 significantly promotes A. thaliana growth, while the growth of the Atpal1 mutant is inhibited, further confirming the key role of GuPAL1 in plant growth and development.
To further analyze the impact of GuPAL1 on plant metabolism, the flavonoid content in the underground parts and whole plants of WT, GuPAL1-OE, Atpal1 mutant, and Atpal1/GuPAL1 A. thaliana was measured. Compared to the WT, the GuPAL1-OE A. thaliana had a significantly higher flavonoid content, while the Atpal1 mutant exhibited a decrease in flavonoid content. The flavonoid content in the Atpal1/GuPAL1 plants showed no significant difference from the WT, indicating that GuPAL1 may be involved in the flavonoid biosynthesis pathway (Figure 6D,E).

2.8. Phenotypic Analysis of WT, GuPAL1-OE, Atpal1 Mutant, and Atpal1/GuPAL1 A. thaliana Plants

To elucidate the potential functions of GuPAL1 in cellular physiological states, metabolic pathways, and gene expression regulation, Gene Ontology (GO) and Kyoto Encyclopedia of Genes and Genomes (KEGG) analyses were performed on up-regulated genes identified in the transcriptome of GuPAL1-OE A. thaliana. GO analysis demonstrated that the genes were significantly enriched in categories such as cellular processes, response to stimuli, biological regulation, developmental processes, and metabolic activities, suggesting that GuPAL1 may affect A. thaliana growth, development, and stress responses by regulating various cellular functions and biological processes (Figure 7A). As shown in Figure 7B, the KEGG analysis revealed that pathways with a large number of genes included metabolism, genetic information processing, and signal transduction. Further analysis indicated significant enrichment in pathways such as plant hormone signal transduction, flavonoid biosynthesis, phenylpropanoid biosynthesis, and starch and sucrose metabolism (Figure 7C). GuPAL1 may regulate hormone synthesis, thereby affecting plant hormone signal transduction pathways. These findings suggest that GuPAL1 may influence A. thaliana metabolism, particularly flavonoid biosynthesis-related pathways, through the regulation of plant hormone signaling and metabolic processes.
In summary, the up-regulated genes in GuPAL1-OE A. thaliana are significantly enriched in multiple GO and KEGG categories, and may promote the synthesis and accumulation of flavonoids by regulating cellular physiological states, metabolic pathways, and gene expression. These findings provide important clues for elucidating the regulatory mechanisms of GuPAL1 in flavonoid biosynthesis.

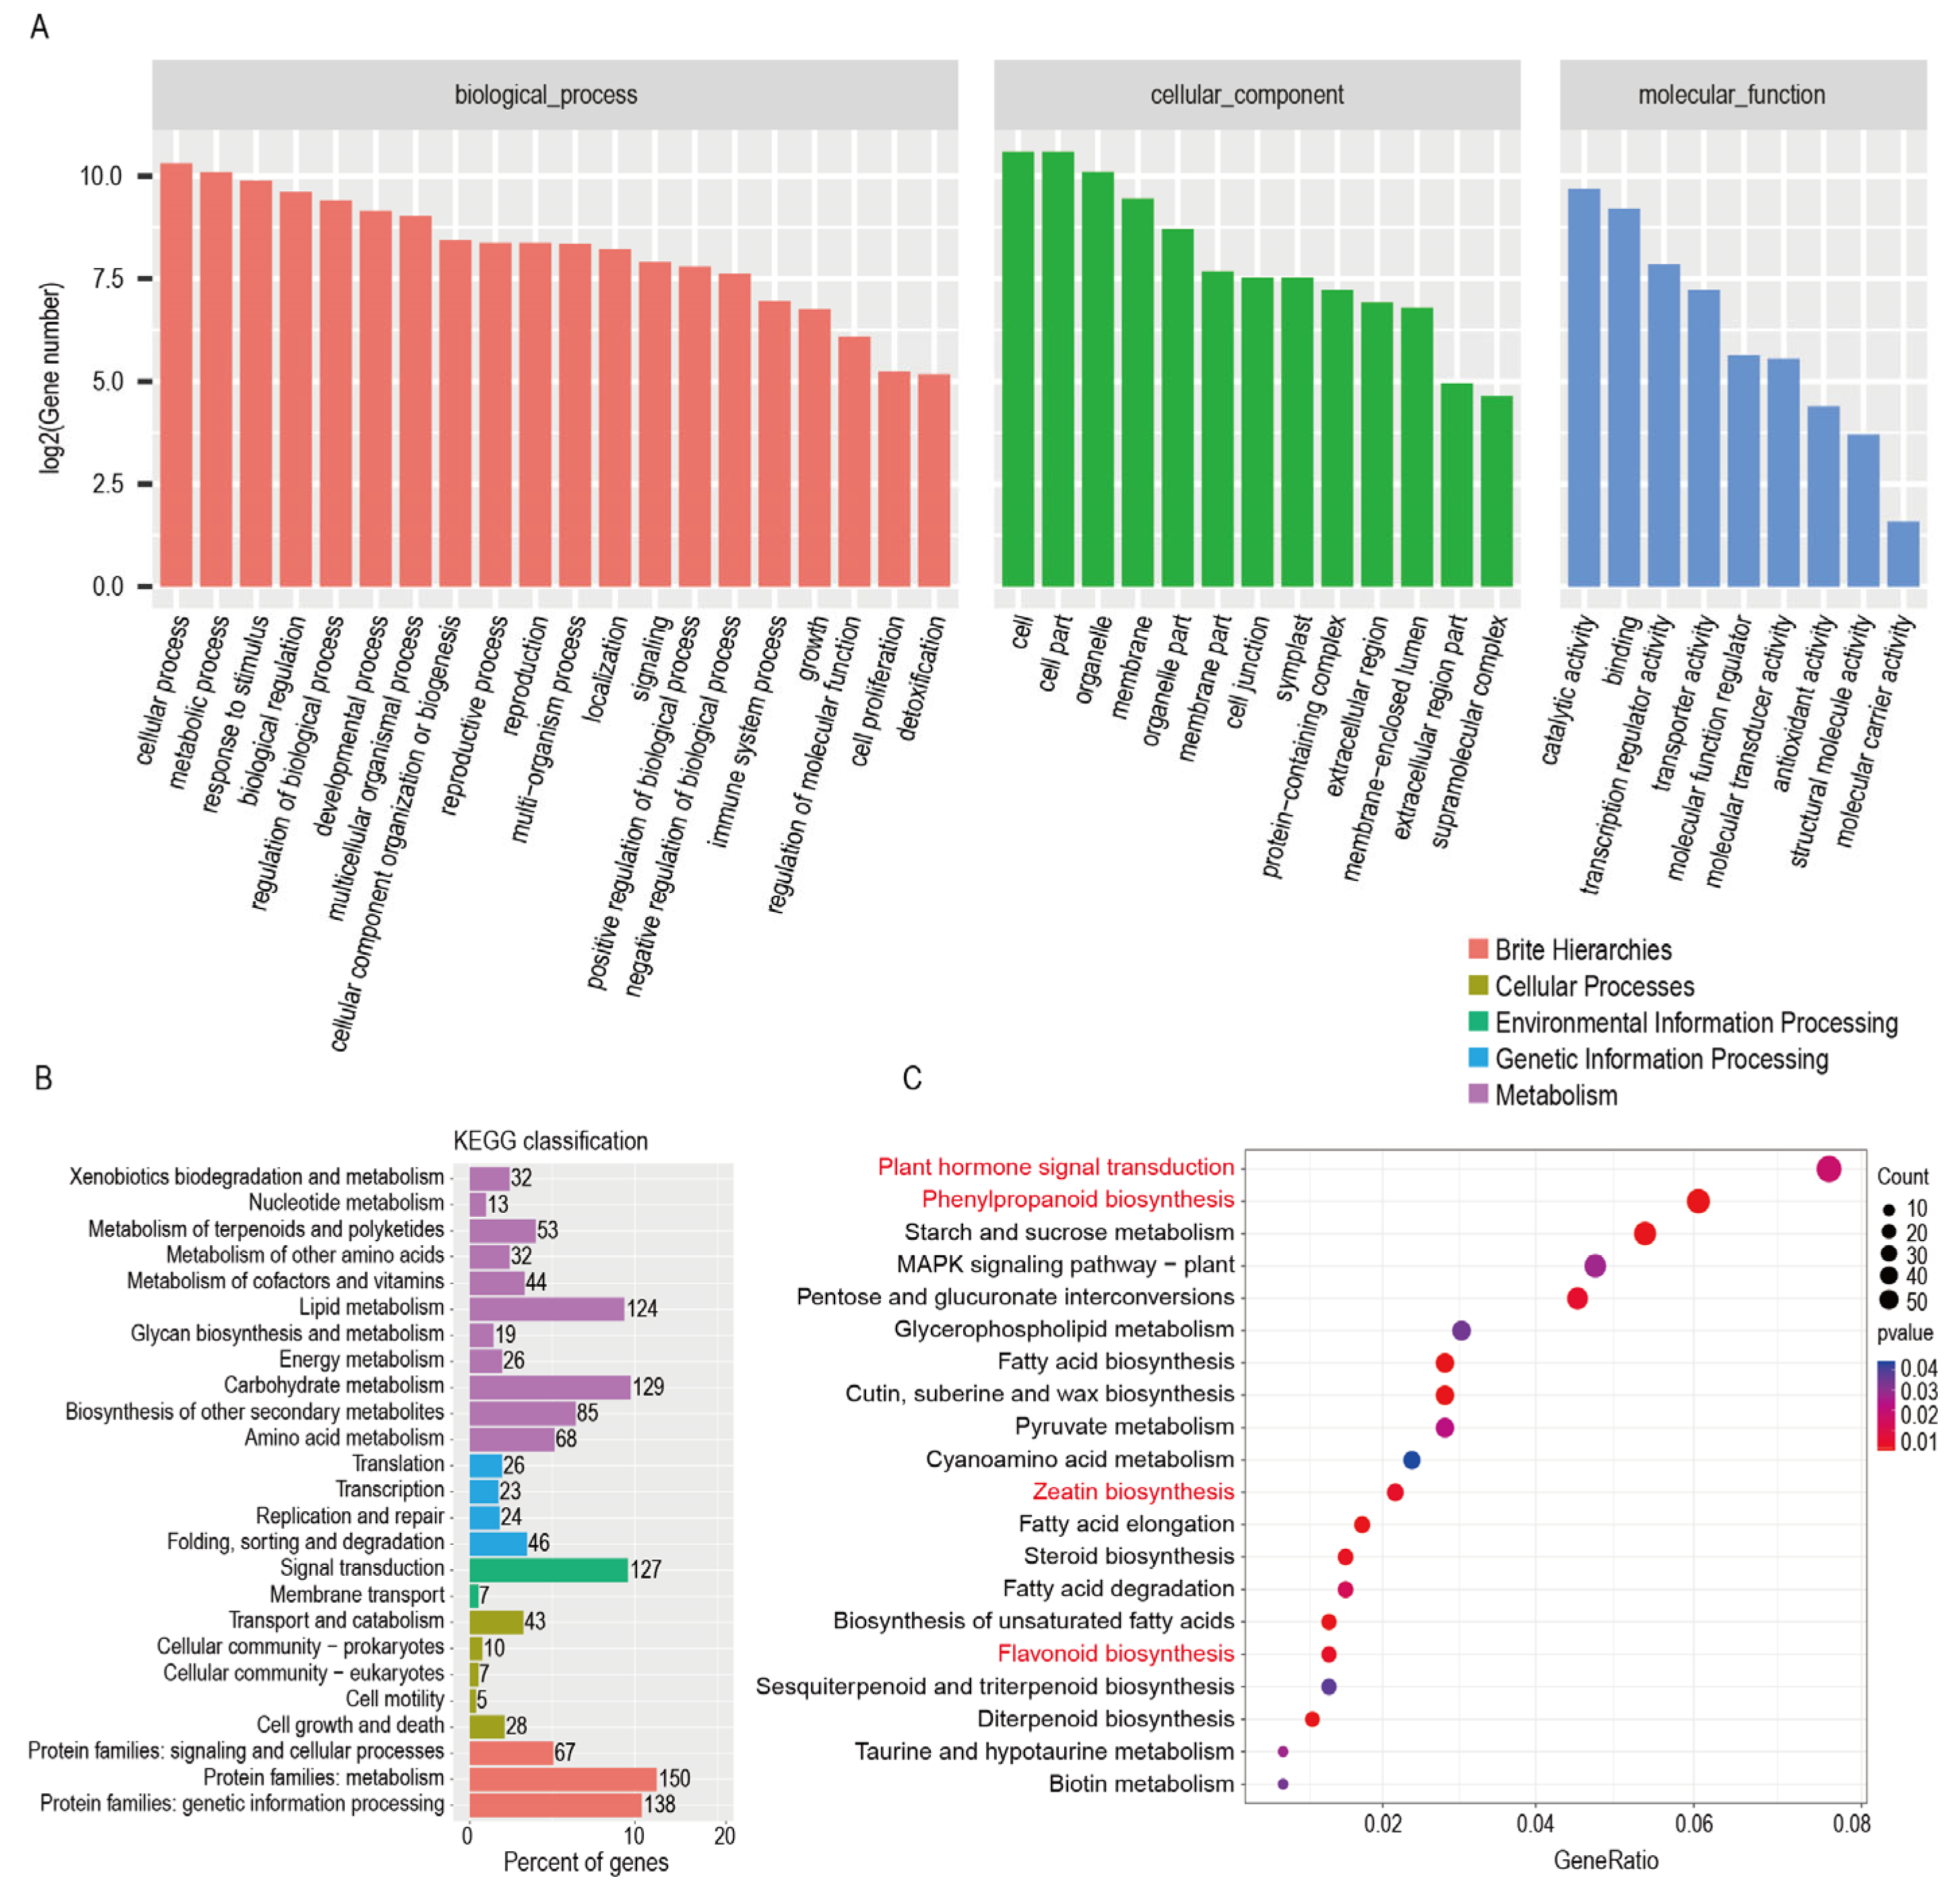
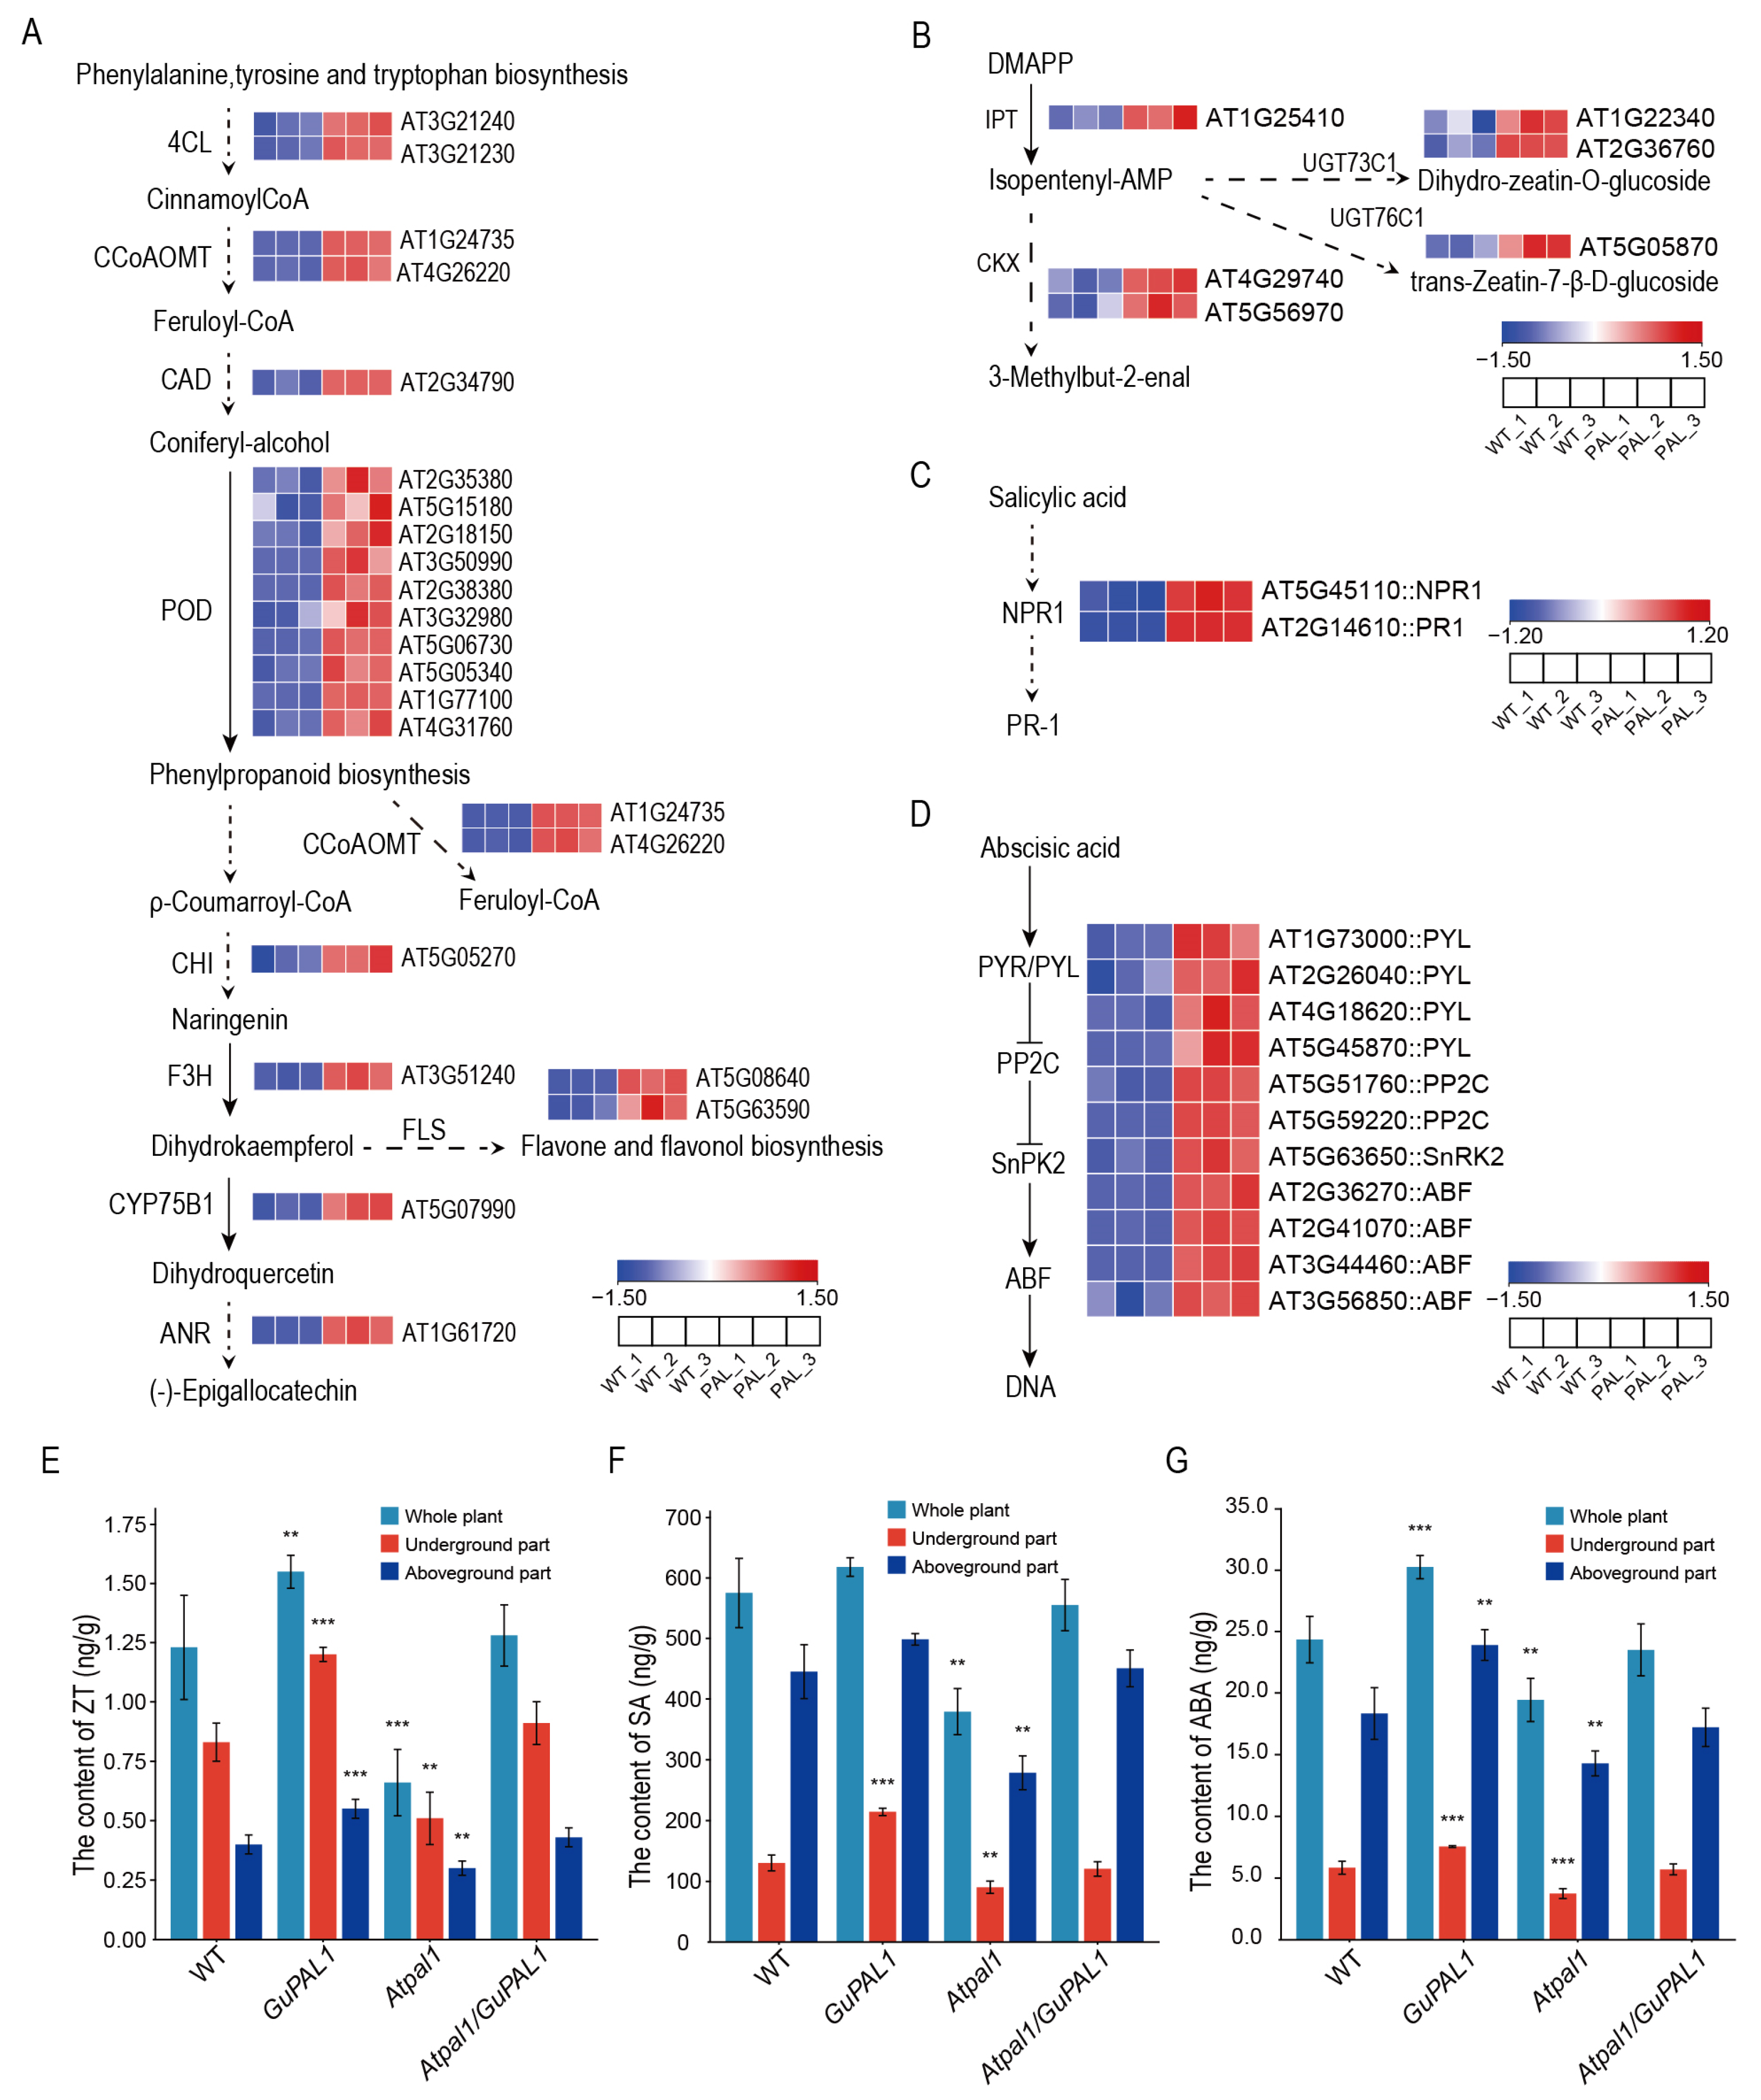
2.9. Expression Pattern of Up-Regulated Genes in the Transcriptome of GuPAL1-OE A. thaliana

By screening the up-regulated genes in the transcriptome of GuPAL1-OE A. thaliana, it was found that the expression of several key genes in the phenylpropanoid and flavonoid metabolic pathways was significantly up-regulated (Figure 8A). In the phenylpropanoid metabolic pathway, the up-regulated genes included those encoding 4-coumarateCoA ligase (4CL), cinnamate4-hydroxylase (CAD), caffeoylCoA Omethyltransferase (CCoAOMT), and peroxidase (POD). In the flavonoid metabolic pathway, the up-regulated genes included those encoding chalcone isomerase (CHI), flavanone 3-hydroxylase (F3H), flavonol synthase (FLS), cytochrome P450 monooxygenase 75B1 (CYP75B1), and anthocyanidin reductase (ANR). This coordinated upregulation suggests a metabolic flux redirection toward flavonoid production, with CHI and F3H enhancing the core flavonoid biosynthesis, FLS and CYP75B1 promoting flavonol diversification, and ANR facilitating the conversion to proanthocyanidins, collectively contributing to the observed increase in total flavonoid content in GuPAL1-OE plants. Additionally, in the hormone signal transduction pathways, genes up-regulated in the cytokinin signaling pathway included isopentenyltransferase (IPT), UDPglycosyltransferases (UGT73C1, UGT76C1), and cytokinin oxidase (CKX) (Figure 8B). Up-regulated genes in the salicylic acid (SA) pathway included pathogenesis-related gene non-expressor 1 (NPR1) and pathogenesis-related protein 1 (PR-1) (Figure 8C). In the abscisic acid (ABA) pathway, the up-regulated genes included ABA receptors (PYR/PYL), protein phosphatase 2C (PP2C), sucrose non-fermenting protein kinase 2 (SnPK2), and ABA-responsive element binding factors (ABF) (Figure 8D).
To verify the impact of GuPAL1 on these metabolic pathways, the levels of zeatin (ZT), SA, and ABA were measured in WT, GuPAL1-OE, Atpal1 mutant, and Atpal1/GuPAL1 A. thaliana plants. The results showed that the GuPAL1-OE plants had significantly elevated levels of ZT, SA, and ABA in both the whole plant, underground parts, and aerial parts, while the Atpal1 mutant exhibited significantly lower levels of these hormones, and the hormone levels in the complement plants were similar to the WT (Figure 8E–G). These findings suggest that GuPAL1 not only enhances flavonoid accumulation by promoting the phenylpropanoid and flavonoid metabolic pathways but also significantly increases the synthesis of plant hormones such as ZT, SA, and ABA. These findings position GuPAL1 as a prime molecular target for genetically improving Glycyrrhiza varieties, enabling simultaneous enhancement of medicinal flavonoid production and stress adaptability in cultivation practices.

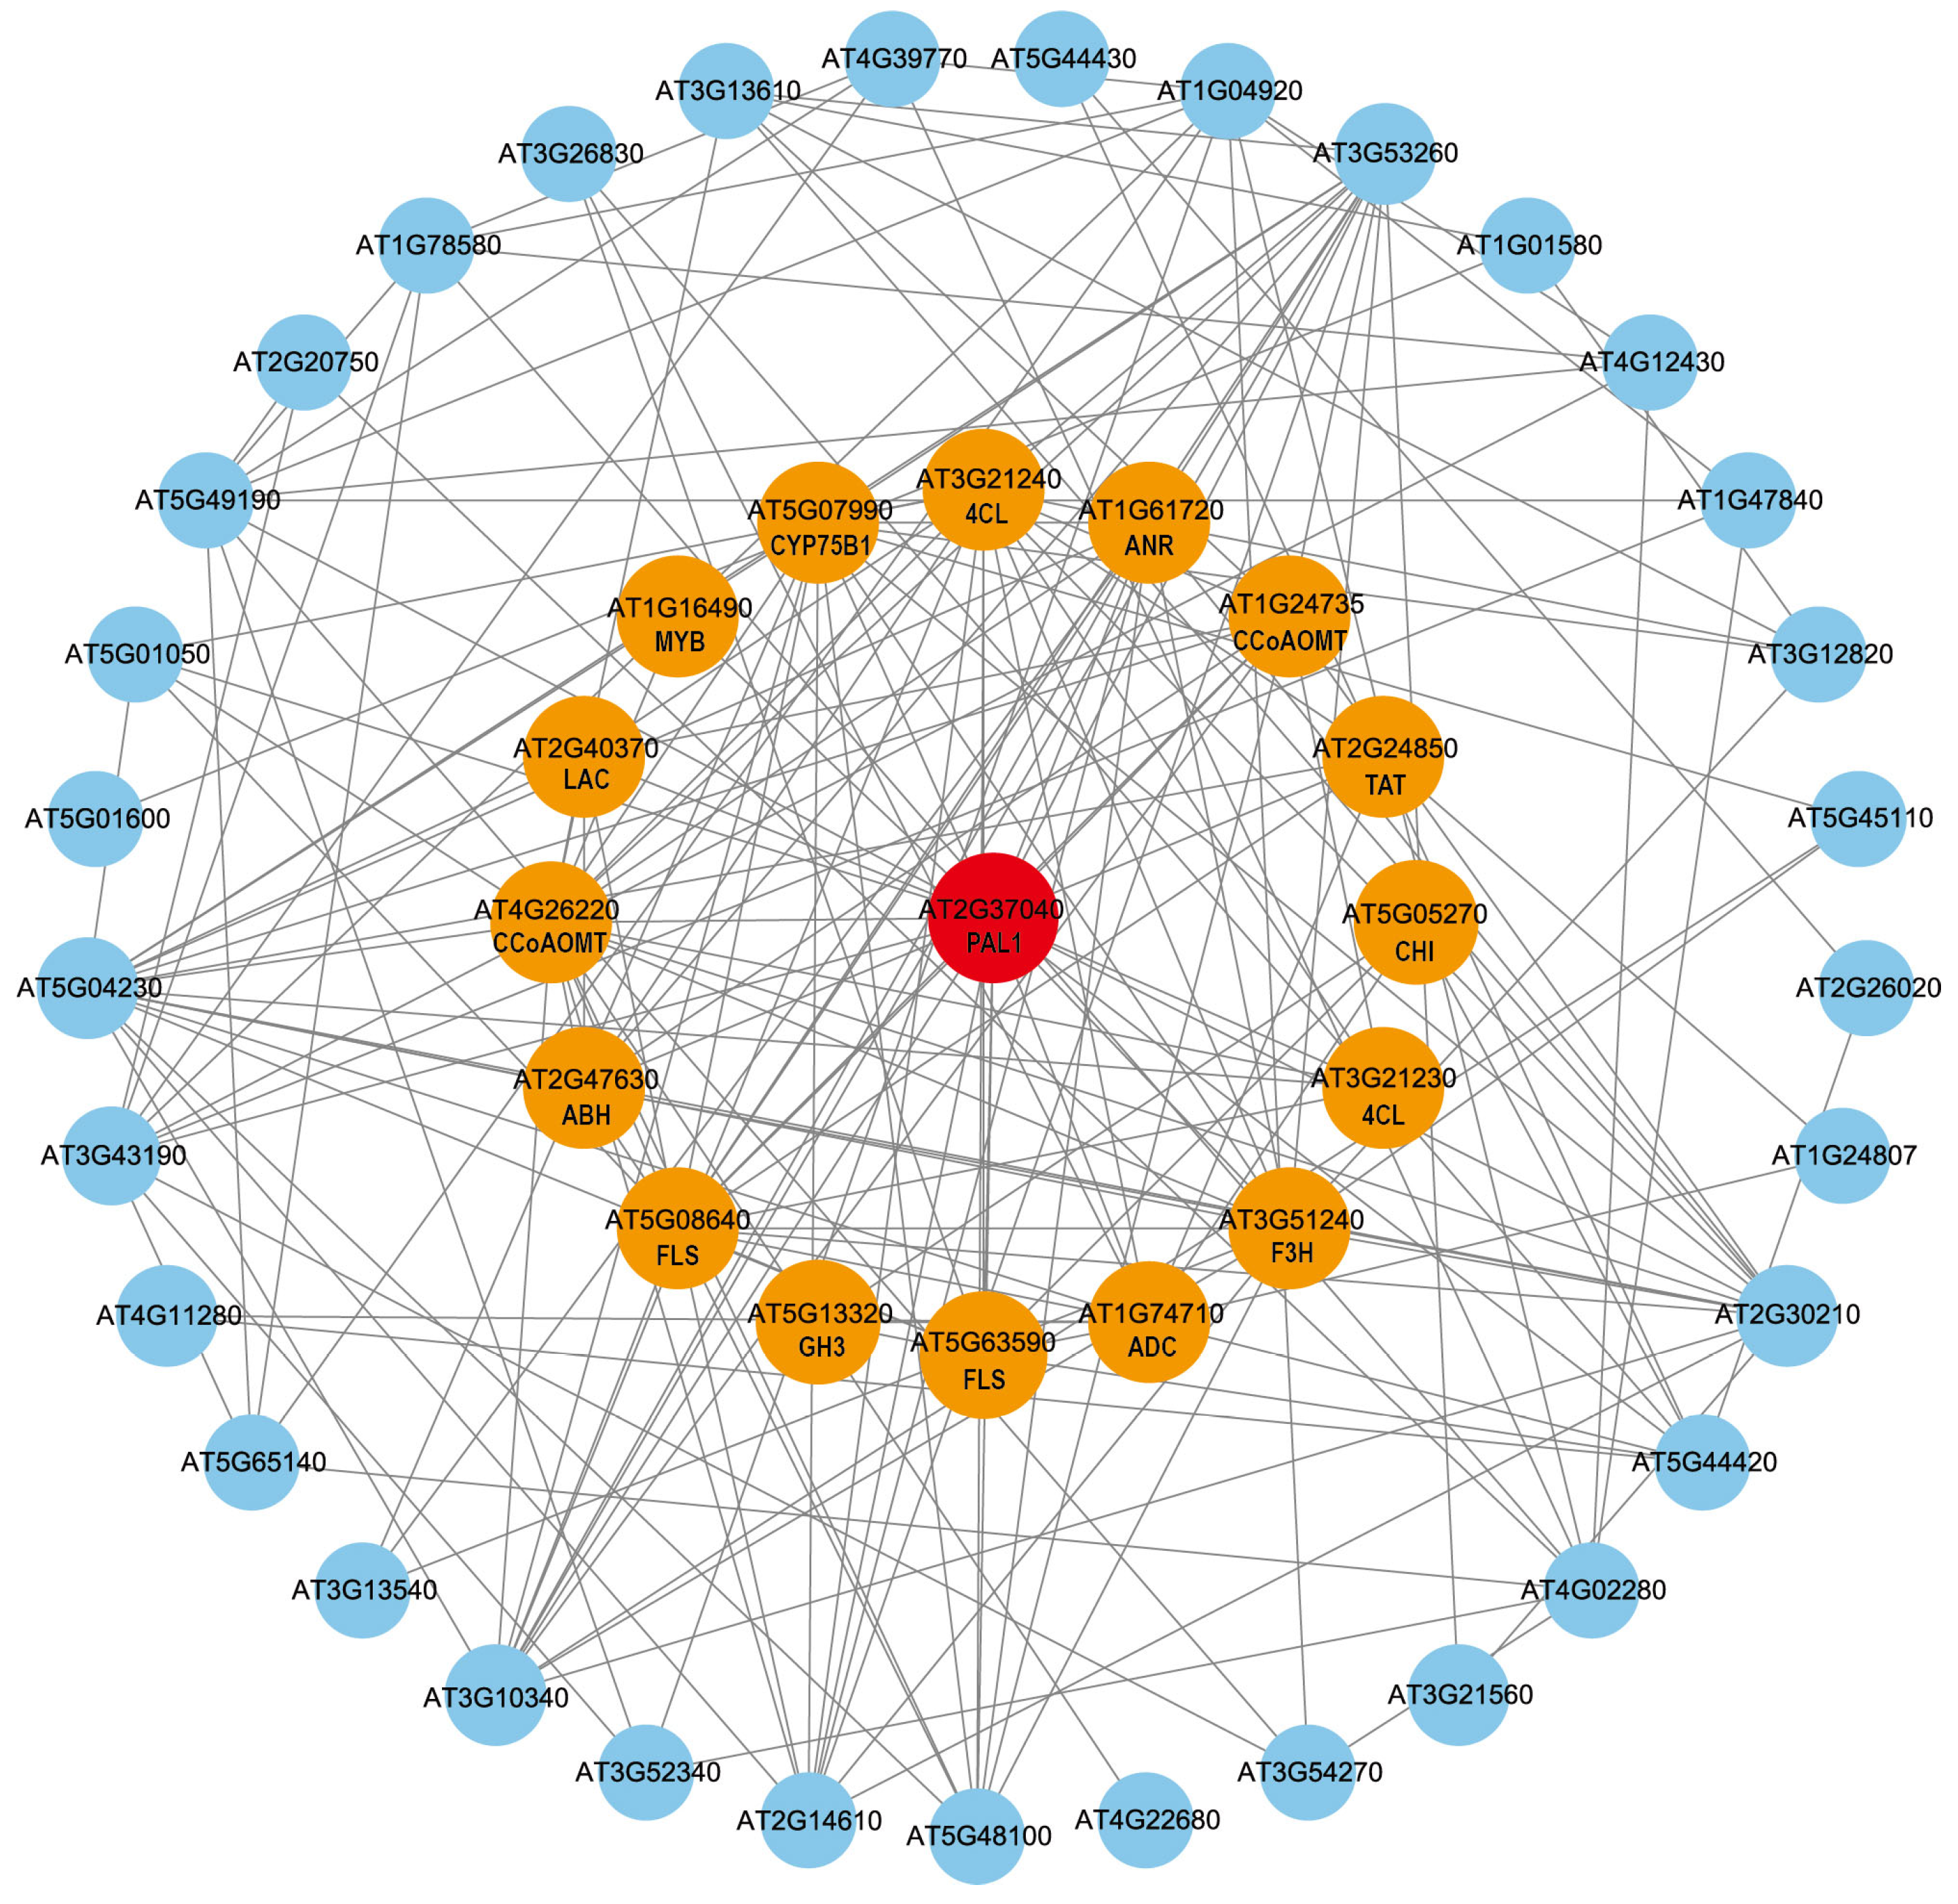
2.10. Protein–Protein Interaction (PPI) Prediction Analysis of GuPAL1

Based on the analysis results of the GuPAL1-OE transcriptome data, protein–protein interaction (PPI) prediction analysis was conducted using the GuPAL1 gene (AT2G37040) and genes from the four aforementioned pathways. The analysis revealed that GuPAL1 interacts with 10 flavonoid pathway genes including AT1G24735 (CCoAOMT), AT1G61720 (ANR), AT3G21230 (4CL), AT3G21240 (4CL), AT3G51240 (F3H), AT4G26220 (CCoAOMT), AT5G05270 (CHI), AT5G07990 (CYP75B1), AT5G08640 (FLS), AT5G63590 (FLS), and 2 genes from the SA synthesis pathway of AT5G45110 (NPR1) and AT2G14610 (PR1), which are co-expressed. Additionally, 38 other genes were also found to co-express with GuPAL1 (Figure 9). These interacting genes provide crucial targets for subsequent metabolomic analyses, enabling in-depth elucidation of flavonoid biosynthetic mechanisms through approaches like CRISPR-based validation of key regulatory nodes and construction of regulatory networks.

3. Discussion

In recent years, increasing evidence has shown that PAL genes play a crucial role in plant growth, development, and resistance [55]. Although the functions of the PAL gene family have been extensively studied in various plant species through high-throughput sequencing [56,57], research on Glycyrrhiza is still limited. Therefore, this study systematically explored the functions of the PAL gene family in three medicinal Glycyrrhiza species (G. uralensis, G. inflata, and G. glabra), with a focus on revealing the molecular mechanisms of GuPAL1 in flavonoid biosynthesis and plant growth.
PAL genes have been reported in several species, including Glycine max, A. thaliana, Solanum tuberosum, and Medicago sativa [58,59], with varying numbers of family members in different species. Seven PAL genes identified in the three Glycyrrhiza species, along with their chromosomal collinearity relationships, reveal the evolutionary conservation of the Glycyrrhiza PAL gene family. Phylogenetic analysis categorized the PAL genes into three clades (A, B, and C). GuPAL1 clustered with A. thaliana AtPAL1AtPAL4 and soybean GmPALs [60,61,62] in Clade A, indicating its conserved function in phenylpropanoid metabolism.
Previous studies have found that disruption of the PAL1 and PAL2 genes in A. thaliana makes mutant plants particularly sensitive to environmental growth conditions, affecting their fertility [54]. The disruption of the other two PAL genes altered the expression of genes involved in phenylpropanoid biosynthesis, as well as carbohydrate and amino acid metabolism [61]. There was an overaccumulation of Phenylalanine, while the three major flavonol glycosides and lignin monomers were significantly reduced [52,61]. Promoter element analysis revealed a significant enrichment of stress-related binding sites on the PAL1 gene. Tissue-specific expression analysis demonstrated that PAL1 and PAL2 are highly expressed across all tissues of the three medicinal Glycyrrhiza species, with the highest expression levels observed in the root and stem tissues. Under salt and drought stress conditions, the expression of PAL1 and PAL2 was significantly up-regulated, with PAL1 exhibiting the most pronounced increase. These findings suggest that PAL1 and PAL2 may play a crucial role in the plant’s response to environmental stress, particularly PAL1, whose expression pattern is closely associated with flavonoid biosynthesis. These results provide important insights for further investigation into the role of PAL1 in flavonoid synthesis.
Through overexpression of GuPAL1 in A. thaliana lines, this study confirmed the important role of GuPAL1 in promoting plant growth and flavonoid synthesis. Compared to the WT, the A. thaliana plants overexpressing GuPAL1 exhibited an increased number of rosette leaves and larger leaf size 15 days after transplantation. By day 25 and day 45, the plant height of these overexpressing lines was significantly greater than that of the WT and the Atpal1 mutant. Moreover, flavonoid content analysis revealed that the flavonoid levels in the underground parts and the whole plants of GuPAL1-OE A. thaliana were significantly higher than those of the WT, while the Atpal1 mutant showed a reduced flavonoid content. The flavonoid content in the GuPAL1-transformed mutant did not significantly differ from that of the WT. These results suggest that GuPAL1 plays a crucial role in flavonoid synthesis.
Previous studies have shown that 4CL contributes to channeling the flux of various phenylpropanoid biosynthetic pathways [63]. Rui Wu et al. discovered in their study of Prunus mume that FLS is highly expressed, and a higher number of flavonoid compounds, including flavones, were detected. Enzymes associated with the flavonoid pathway, such as F3H, FLS, and ANS, all belong to the 2-oxoglutarate-dependent dioxygenase (2-ODD) subfamily [64,65]. F3H is a key enzyme that directs carbon flux toward the biosynthesis of 3-hydroxy flavonoid compounds, responsible for the biosynthesis of flavonols and anthocyanins [66]. Transcriptomic analysis revealed significant enrichment in pathways related to plant hormone signal transduction, flavonoid biosynthesis, and phenylpropanoid biosynthesis. Furthermore, expression pattern analysis demonstrated that key enzyme genes involved in phenylpropanoid and flavonoid metabolic pathways, as well as hormone signaling pathways, were significantly up-regulated. Protein–protein interaction predictions indicated co-expression between GuPAL1 and flavonoid biosynthetic enzymes (4CL, FLS, F3H, etc.) and SA pathway proteins (NPR1, PR-1), suggesting that GuPAL1 may enhance pathway efficiency by stabilizing metabolic complexes or facilitating substrate channel coordination, which is consistent with previous studies [67].

4. Materials and Methods

4.1. Plant Materials

Using the PAL family protein sequences from A. thaliana and G. max as references, the PAL family members in the genomes of G. uralensis, G. inflata, and G. glabra were identified through local BLASTP searches. The protein kinase domain (PLN02457) was validated using the InterProScan server (http://www.ebi.ac.uk/interpro/, accessed on 10 June 2024) and manually reviewed. The physical locations of the PAL family members on the chromosomes were mapped using TBtools software (Version 2.056) [68]. We compared protein sequences using MEGA 11 software (Version 11.0.13) and constructed a Neighbor-Joining (NJ) tree with 1000 bootstrap replicates [69], and the phylogenetic tree was visualized using the online tool Evolview (https://evolgenius.info/, accessed on 10 June 2024) [70]. Conserved domains were analyzed using BioEdit (Version 7.0.9) and MEME (https://meme-suite.org/meme/, accessed on 10 June 2024) [71] online software. These sequences were submitted to MCScanX (Multiple Collinearity Scan) and Dual Synteny Plotter tools to analyze the syntenic relationships between the three Glycyrrhiza species [72]. Based on Glycyrrhiza genomic data and annotation files, TBtools software (Version 2.056) was used to obtain the 2000 bp DNA sequences upstream of the PAL family genes. The PlantCARE website (https://bioinformatics.psb.ugent.be/webtools/plantcare/html/, accessed on 10 June 2024) was used to predict cis-regulatory elements in the PAL gene promoter regions, and TBtools (Version 2.056) was used for visualization. Using the PAL family protein sequences from the three Glycyrrhiza species, A. thaliana, and Glycine max, the MEME (https://meme-suite.org/meme/, accessed on 10 June 2024) was employed to analyze conserved protein motifs, with each motif having a p-value lower than 1 × 10⁻⁵. The XML files generated by the MEME program, the phylogenetic tree’s NWK files, and the GFF files for gene structure were obtained. Then, using TBtools (Version 2.056), the gene structure, phylogenetic tree, and conserved motifs were predicted and visualized.

4.2. Tissue-Specific Expression Materials and Stress Treatment in Three Medicinal Glycyrrhiza Species

Due to the low germination rate of wild Glycyrrhiza seeds, this study employed a 35 min treatment with 98% sulfuric acid to break seed dormancy, followed by sterilization with 0.1% mercuric chloride [73]. The sterilized seeds were then placed in a controlled artificial climate chamber under the following conditions: 16 h of light per day, humidity between 50 and 55%, and day/night temperatures of 28 °C and 25 °C, respectively, using vermiculite as the substrate and irrigating with sodium-free 1 × Hoagland nutrient solution. After 45 days of cultivation, root, stem, and leaf tissues were collected for tissue-specific expression analysis. For salt stress treatment, 42-day-old seedlings were first hydroponically cultured in sodium-free 1 × Hoagland nutrient solution for 3 days, then treated with a nutrient solution containing 200 mM NaCl. Three biological replicates were set, with root materials harvested at 2 h and 24 h after treatment and stored at −80 °C for later analysis. The method for drought stress treatment was similar to that for salt stress. After the same pretreatment, seedlings were treated with a nutrient solution containing 10% PEG6000. Again, three biological replicates were set, with root materials harvested at 2 h and 24 h after treatment and stored at −80 °C for further analysis.

4.3. Expression Pattern of PAL Family Members in Three Medicinal Glycyrrhiza Species

qRT-PCR primers were designed using Primer 5.0 (Table S1), and total RNA was extracted from three biological replicates using the RNAprep pure plant kit. After determining RNA concentration with a spectrophotometer and verifying integrity via agarose gel electrophoresis, 1 μg of RNA was reverse-transcribed into cDNA with three technical replicates. Glycyrrhiza actin gene GuActin was used as an internal reference (Table S1). qRT-PCR was performed using the TianGen reagent on the Roche480 system with 40 cycles of amplification. Data were processed using the 2−ΔΔCt method, and heatmaps were generated using R (Version 4.3.2) software.

4.4. Construction of Plant Expression Vectors and Transformation of A. thaliana

Using reverse-transcribed cDNA from G. uralensis as a template, the target fragment was amplified by PCR using the following primers: upstream primer 5′ATGATGGAGTTTTCCAATG3′ and downstream primer 5′CTAGCATATGGGAGAG3′. The PCR product was analyzed by 1% agarose gel electrophoresis, yielding a specific band of 2181 bp (Figure S1). Subsequent sequencing and alignment confirmed that this band corresponds to the GuPAL1 gene fragment. The GuPAL1 gene was then cloned into the pMD19-T vector. Both the recombinant plasmid pMD19-T-PAL1 and the expression vector pCAMBIA2300 were digested with the restriction enzymes BamHI and XbaI, and the target fragment was recovered and ligated. After plasmid extraction, the recombinant plasmids were verified by BamHI and XbaI digestion and sequencing analysis, resulting in the recombinant plasmid 35S::GuPAL1. WT A. thaliana seeds were sterilized and vernalized, then cultured and transplanted into soil. During the flowering stage, Agrobacterium containing the recombinant plasmid was suspended and infiltrated into the flower buds. After dark incubation for 24 h, the plants were returned to normal growth conditions, and the infiltration was repeated three times at 5–7-day intervals to collect T0 seeds. The T0 seeds were sown on MS medium containing kanamycin, and genomic DNA was extracted from 3-week-old seedlings for PCR identification. Positive plants were selected for T1 seed collection. The DNA-positive T1 seeds were sown on kanamycin-containing medium, and 3-week-old seedlings were used for RNA extraction. After reverse transcription, qRT-PCR was performed using GuActin as an internal reference (Table S2), and high-expressing lines were selected for T2 seed collection (Figure S2).

4.5. Quantification of Flavonoids and Hormones in GuPAL1-OE A. thaliana Using LC–MS/MS

T2 seeds from three independent transgenic lines were sown on MS medium (triplicate plates per line), and after transplanting to nutrient soil for 45 days, whole plants and roots of T3 Arabidopsis were collected from each biological replicate. The tissues were ground into powder, and methanol was added for extraction. The samples underwent ultrasonic treatment, centrifugation, and the supernatant was evaporated under nitrogen. After reconstitution and further centrifugation, the final samples were prepared for analysis. A series of calibration standard solutions was prepared (including IAA, ZT, BR, SA, ABA, MeJA, GA3, and Rutin), and samples were injected with different concentrations of standards. Standard curves were created based on peak areas and concentrations, with good linearity in specific concentration ranges (Table S3). The analysis was performed using electrospray ionization (ESI) as the ion source, with multiple reaction monitoring (MRM) mode. The desolvation temperature, ion source temperature, gas flow rate, and capillary voltage were optimized, and the appropriate parent and daughter ions for quantitative analysis were identified (Table S4). Chromatographic separation was conducted using a Waters ACQUITY UPLC BEH C18 column under the specified flow rate, injection volume, and column temperature, with a gradient elution program (Table S5).

4.6. Transcriptome Analysis

The raw sequencing data from three biological replicates were subjected to quality control and filtering using FastQC (Version 0.12.0) and Trimmomatic (Version 0.39) to remove low-quality data. The cleaned data were mapped to the A. thaliana reference genome, and the files were converted into the appropriate format. Transcript data and expression matrices (count values) were obtained. Gene expression levels were calculated using the StringTie (Version 1.3.3b) software and quantified as Fragments Per Kilobase of transcript per Million mapped reads (FPKM). Differentially expressed genes (DEGs) were identified using the R (Version 4.3.2) package DESeq2. The p-values obtained were adjusted using the Benjamini–Hochberg method. Genes that met the criteria of |Log2(Fold change)| ≥ 1 and FDR < 0.05 were considered as DEGs. TBtools (Version 2.056) was used to extract the protein sequences of the DEGs, which were annotated in the eggNOG Mapper database (http://eggnog-mapper.embl.de/, accessed on 10 June 2024). GO (Gene Ontology) (http://geneontology.org/, accessed on 10 June 2024) and KEGG (http://www.genome.jp/kegg/pathway.html, accessed on 10 June 2024) enrichment analyses were conducted to identify functional annotations related to metabolic pathways. Visualizations were generated using TBtools (Version 2.056).

5. Conclusions

In this study, through an in-depth analysis of the genomes of three medicinal Glycyrrhiza species, we successfully identified the PAL gene family and systematically investigated its fundamental characteristics. Further research revealed that GuPAL1 plays a crucial role in stress response, plant growth, and flavonoid biosynthesis. Our findings provide a foundation for elucidating the molecular mechanisms of flavonoid metabolism in Glycyrrhiza and offer theoretical support for improving Glycyrrhiza quality and stress tolerance through genetic engineering.

Supplementary Materials

The following supporting information can be downloaded at: https://www.mdpi.com/article/10.3390/ijms26094073/s1.

Author Contributions

Conceptualization, S.S. and H.L.; methodology, C.J., M.L., S.X. (Shouhao Xu), S.X. (Shuangquan Xie), and Z.L.; software, C.J., M.L. and X.H.; validation, Q.X. (Quanliang Xie), S.S. and H.L.; formal analysis, C.J. and M.L.; investigation, X.C. and R.S.; resources, Q.X. (Quanliang Xie) and H.L.; data curation, X.C., H.S. and H.H.; writing—original draft preparation, X.C.; writing—review and editing, H.L.; visualization, X.C., Q.X. (Qing Xu), C.J. and X.H.; supervision, H.S., F.W., S.S. and H.L.; project administration, S.S. and G.X. All authors have read and agreed to the published version of the manuscript.

Funding

The research was supported by Science and Technology Project of Bingtuan (Grant number 2023AB052, 2023CB008-17, 2024DA021), Natural Science Foundation of China (Grant number 32260083), Tianchi Talent Project of Xinjiang (Grant number CZ001604), Science and Technology Project of Shihezi University (Grant number ZZZC201929B, KX6077), and Ministry of Education Key Laboratory of Xinjiang Phytomedicine Resource Utilization Project (Grant number XPRU202002).

Data Availability Statement

All data are presented in the article and the Supplementary Materials.

Conflicts of Interest

The authors declare no conflicts of interest.

References

  1. The Pharmacopoeia Commission of the People’s Republic of China. Pharmacopoeia of the People’s Republic of China; Chemical Industry Press: Beijing, China, 2005; Volume 1, pp. 59–60.
  2. Kwon, Y.J.; Son, D.H.; Chung, T.H.; Lee, Y.J. A Review of the Pharmacological Efficacy and Safety of Licorice Root from Corroborative Clinical Trial Findings. J. Med. Food 2020, 23, 12–20. [Google Scholar] [CrossRef] [PubMed]
  3. Searle, T.; Al–Niaimi, F.; Ali, F.R. The top 10 cosmeceuticals for facial hyperpigmentation. Dermatol. Ther. 2020, 33, e14095. [Google Scholar] [CrossRef] [PubMed]
  4. Alagawany, M.; Elnesr, S.S.; Farag, M.R.; Abd El–Hack, M.E.; Khafaga, A.F.; Taha, A.E.; Tiwari, R.; Yatoo, M.I.; Bhatt, P.; Marappan, G.; et al. Use of Licorice(G. glabra) Herb as a Feed Additive in Poultry: Current Knowledge and Prospects. Animals 2019, 9, 536. [Google Scholar] [CrossRef] [PubMed]
  5. Egamberdieva, D.; Wirth, S.; Li, L.; Abd–Allah, E.F.; Lindström, K. Microbial cooperation in the rhizosphere improves liquorice growth under salt stress. Bioengineered 2017, 8, 433–438. [Google Scholar] [CrossRef]
  6. Ji, X.; Liu, N.; Huang, S.; Zhang, C. A Comprehensive Review of Licorice: The Preparation; Chemical Composition; Bioactivities and Its Applications. Am. J. Chin. Med. 2024, 52, 667–716. [Google Scholar] [CrossRef]
  7. Zhong, C.; Chen, C.; Gao, X.; Tan, C.; Bai, H.; Ning, K. Multi–omics profiling reveals comprehensive microbe–plant–metabolite regulation patterns for medicinal plant G. uralensis Fisch. Plant Biotechnol. J. 2022, 20, 1874–1887. [Google Scholar] [CrossRef]
  8. Atif, R.M.; Shahid, L.; Waqas, M.; Ali, B.; Rashid, M.A.R.; Azeem, F.; Nawaz, M.A.; Wani, S.H.; Chung, G. Insights on Calcium–Dependent Protein Kinases(CPKs) Signaling for Abiotic Stress Tolerance in Plants. Int. J. Mol. Sci. 2019, 20, 5298. [Google Scholar] [CrossRef]
  9. Yang, Q.; Pan, J.; Shen, G.; Guo, B. Yellow light promotes the growth and accumulation of bioactive flavonoids in Epimedium pseudowushanense. J. Photochem. Photobiol. B 2019, 197, 111550. [Google Scholar] [CrossRef]
  10. Liu, S.; Hu, L.; Jiang, D.; Xi, W. Effect of Post–Harvest LED and UV Light Irradiation on the Accumulation of Flavonoids and Limonoids in the Segments of Newhall Navel Oranges (Citrus sinensis Osbeck). Molecules 2019, 24, 1755. [Google Scholar] [CrossRef]
  11. Fan, X.; He, C.; Ji, M.; Sun, X.; Luo, H.; Li, C.; Tong, H.; Zhang, W.; Sun, Z.; Chu, W. Visible light–induced deoxygenation/cyclization of salicylic acid derivatives and aryl acetylene for the synthesis of flavonoids. Chem. Commun. 2022, 58, 6348–6351. [Google Scholar] [CrossRef]
  12. Fu, B.; Ji, X.; Zhao, M.; He, F.; Wang, X.; Wang, Y.; Liu, P.; Niu, L. The influence of light quality on the accumulation of flavonoids in tobacco(Nicotiana tabacum L.) leaves. J. Photochem. Photobiol. B 2016, 162, 544–549. [Google Scholar] [CrossRef] [PubMed]
  13. Chen, K.; Hu, Y.; Chen, L.; Zhang, J.; Qiao, H.; Li, W.; Zhang, K.; Fang, Y. Role of dehydration temperature on flavonoids composition and free–form volatile profile of raisins during the drying process. Food Chem. 2022, 374, 131747. [Google Scholar] [CrossRef] [PubMed]
  14. Jia, X.; Wang, Y.; Zhao, J.; Gao, Y.; Zhang, C.; Feng, X.; Ding, X. Effect of Glomus mosseae, cadmium; and elevated air temperature on main flavonoids and phenolic acids contents in alfalfa. Environ. Sci. Pollut. Res. Int. 2023, 30, 44819–44832. [Google Scholar] [CrossRef]
  15. Yuan, Y.; Shuai, L.; Chen, S.; Huang, L.; Qin, S.; Yang, Z. Flavonoids and antioxidative enzymes in temperature–challenged roots of Scutellaria baicalensis Georgi. Z. Für Naturforschung C 2012, 67, 77–85. [Google Scholar] [CrossRef]
  16. Gouot, J.C.; Smith, J.P.; Holzapfel, B.P.; Walker, A.R.; Barril, C. Grape berry flavonoids: A review of their biochemical responses to high and extreme high temperatures. J. Exp. Bot. 2019, 70, 397–423. [Google Scholar] [CrossRef]
  17. Goh, H.H.; Khairudin, K.; Sukiran, N.A.; Normah, M.N.; Baharum, S.N. Metabolite profiling reveals temperature effects on the VOCs and flavonoids of different plant populations. Plant Biol. 2016, 18, 130–139. [Google Scholar] [CrossRef]
  18. He, Y.; Gao, Y.; Hong, H.; Geng, J.; Chen, Q.; Zhou, Y.; Zhu, Z. Megalurothrips usitatus Directly Causes the Black–Heads and Black–Tail Symptoms of Cowpea along with the Production of Insect–Resistance Flavonoids. Plants 2023, 12, 3865. [Google Scholar] [CrossRef]
  19. Xie, Y.; Yang, W.; Tang, F.; Chen, X.; Ren, L. Antibacterial activities of flavonoids: Structure–activity relationship and mechanism. Curr. Med. Chem. 2015, 22, 132–149. [Google Scholar] [CrossRef]
  20. Straney, D.; Khan, R.; Tan, R.; Bagga, S. Host recognition by pathogenic fungi through plant flavonoids. Adv. Exp. Med. Biol. 2002, 505, 9–22. [Google Scholar]
  21. Chen, T.; Zhou, Y.; Zhang, J.; Peng, Y.; Yang, X.; Hao, Z.; Lu, Y.; Wu, W.; Cheng, T.; Shi, J.; et al. Integrative analysis of transcriptome and proteome revealed nectary and nectar traits in the plant–pollinator interaction of Nitraria Tangutorum Bobrov. BMC Plant Biol. 2021, 21, 230. [Google Scholar] [CrossRef]
  22. Wang, F.; Ge, S.; Xu, X.; Xing, Y.; Du, X.; Zhang, X.; Lv, M.; Liu, J.; Zhu, Z.; Jiang, Y. Multiomics Analysis Reveals New Insights into the Apple Fruit Quality Decline under High Nitrogen Conditions. J. Agric. Food Chem. 2021, 69, 5559–5572. [Google Scholar] [CrossRef] [PubMed]
  23. Ibrahim, M.H.; Jaafar, H.Z. The relationship of nitrogen and C/N ratio with secondary metabolites levels and antioxidant activities in three varieties of Malaysian kacip Fatimah(Labisia pumila Blume). Molecules 2011, 16, 5514–5526. [Google Scholar] [CrossRef] [PubMed]
  24. Morales–Quintana, L.; Ramos, P. A Talk between Flavonoids and Hormones to Reorient the Growth of Gymnosperms. Int. J. Mol. Sci. 2021, 22, 12630. [Google Scholar] [CrossRef]
  25. Peer, W.A.; Murphy, A.S. Flavonoids and auxin transport: Modulators or regulators? Trends Plant Sci. 2007, 12, 556–563. [Google Scholar] [CrossRef]
  26. Sun, H.; Cui, H.; Zhang, J.; Kang, J.; Wang, Z.; Li, M.; Yi, F.; Yang, Q.; Long, R. Gibberellins Inhibit Flavonoid Biosynthesis and Promote Nitrogen Metabolism in Medicago truncatula. Int. J. Mol. Sci. 2021, 22, 9291. [Google Scholar] [CrossRef]
  27. Li, J.; Yang, Y.; Chai, M.; Ren, M.; Yuan, J.; Yang, W.; Dong, Y.; Liu, B.; Jian, Q.; Wang, S.; et al. Gibberellins modulate local auxin biosynthesis and polar auxin transport by negatively affecting flavonoid biosynthesis in the root tips of rice. Plant Sci. 2020, 298, 110545. [Google Scholar] [CrossRef]
  28. Araújo, W.L.; Martins, A.O.; Fernie, A.R.; Tohge, T. 2–Oxoglutarate: Linking TCA cycle function with amino acid; glucosinolate; flavonoid; alkaloid; and gibberellin biosynthesis. Front. Plant Sci. 2014, 5, 552. [Google Scholar] [CrossRef]
  29. Wu, B.; Li, Y.; Zhao, W.; Meng, Z.; Ji, W.; Wang, C. Transcriptomic and Lipidomic Analysis of Lipids in Forsythia suspensa. Front. Genet. 2021, 12, 758326. [Google Scholar] [CrossRef]
  30. Guo, J.; Zhou, X.; Wang, T.; Wang, G.; Cao, F. Regulation of flavonoid metabolism in ginkgo leaves in response to different day–night temperature combinations. Plant Physiol. Biochem. 2020, 147, 133–140. [Google Scholar] [CrossRef]
  31. Zhang, M.; Lu, X.; Ren, T.; Marowa, P.; Meng, C.; Wang, J.; Yang, H.; Li, C.; Zhang, L.; Xu, Z. Heterologous overexpression of Apocynum venetum flavonoids synthetase genes improves Arabidopsis thaliana salt tolerance by activating the IAA and JA biosynthesis pathways. Front. Plant Sci. 2023, 14, 1123856. [Google Scholar] [CrossRef]
  32. Ding, M.; He, Y.; Zhang, K.; Li, J.; Shi, Y.; Zhao, M.; Meng, Y.; Georgiev, M.I.; Zhou, M. JA–induced FtBPM3 accumulation promotes FtERF–EAR3 degradation and rutin biosynthesis in Tartary buckwheat. Plant J. 2022, 111, 323–334. [Google Scholar] [CrossRef] [PubMed]
  33. Wang, Y.; Mao, Z.; Jiang, H.; Zhang, Z.; Wang, N.; Chen, X. Brassinolide inhibits flavonoid biosynthesis and red–flesh coloration via the MdBEH2.2–MdMYB60 complex in apple. J. Exp. Bot. 2021, 72, 6382–6399. [Google Scholar] [CrossRef] [PubMed]
  34. Li, X.; Zhang, L.; Ahammed, G.J.; Li, Z.X.; Wei, J.P.; Shen, C.; Yan, P.; Zhang, L.P.; Han, W.Y. Nitric oxide mediates brassinosteroid–induced flavonoid biosynthesis in Camellia sinensis L. J. Plant Physiol. 2017, 214, 145–151. [Google Scholar] [CrossRef] [PubMed]
  35. Shi, L.; Tan, Y.; Sun, Z.; Ren, A.; Zhu, J.; Zhao, M. Exogenous Salicylic Acid(SA) Promotes the Accumulation of Biomass and Flavonoid Content in Phellinus igniarius (Agaricomycetes). Int. J. Med. Mushrooms 2019, 21, 955–963. [Google Scholar] [CrossRef]
  36. Rodrigues, J.M.; Coutinho, F.S.; Dos Santos, D.S.; Vital, C.E.; Ramos, J.R.L.S.; Reis, P.B.; Oliveira, M.G.A.; Mehta, A.; Fontes, E.P.B.; Ramos, H.J.O. BiP–overexpressing soybean plants display accelerated hypersensitivity response(HR) affecting the SA–dependent sphingolipid and flavonoid pathways. Phytochemistry 2021, 185, 112704. [Google Scholar] [CrossRef]
  37. Gao, G.; Lv, Z.; Zhang, G.; Li, J.; Zhang, J.; He, C. An ABA–flavonoid relationship contributes to the differences in drought resistance between different sea buckthorn subspecies. Tree Physiol. 2021, 41, 744–755. [Google Scholar] [CrossRef]
  38. Brunetti, C.; Sebastiani, F.; Tattini, M. Review: ABA; flavonols; and the evolvability of land plants. Plant Sci. 2019, 280, 448–454. [Google Scholar] [CrossRef]
  39. Mattus–Araya, E.; Guajardo, J.; Herrera, R.; Moya–León, M.A. ABA Speeds Up the Progress of Color in Developing F. chiloensis Fruit through the Activation of PAL, CHS and ANS, Key Genes of the Phenylpropanoid/Flavonoid and Anthocyanin Pathways. Int. J. Mol. Sci. 2022, 23, 3854. [Google Scholar] [CrossRef]
  40. Han, C.; Chen, G.; Zheng, D.; Feng, N. Transcriptomic and metabolomic analyses reveal that ABA increases the salt tolerance of rice significantly correlated with jasmonic acid biosynthesis and flavonoid biosynthesis. Sci. Rep. 2023, 13, 20365. [Google Scholar] [CrossRef]
  41. Yu, W.; Gong, F.; Xu, H.; Zhou, X. Molecular Mechanism of Exogenous ABA to Enhance UV–B Resistance in Rhododendron chrysanthum Pall. by Modulating Flavonoid Accumulation. Int. J. Mol. Sci. 2024, 25, 5248. [Google Scholar] [CrossRef]
  42. Harbart, V.; Frede, K.; Fitzner, M.; Baldermann, S. Regulation of carotenoid and flavonoid biosynthetic pathways in Lactuca sativa var capitate L. in protected cultivation. Front. Plant Sci. 2023, 14, 1124750. [Google Scholar] [CrossRef] [PubMed]
  43. Winkel–Shirley, B. Flavonoid biosynthesis. A colorful model for genetics; biochemistry; cell biology; and biotechnology. Plant Physiol. 2001, 126, 485–493. [Google Scholar] [CrossRef] [PubMed]
  44. Dixon, R.A.; Paiva, N.L. Stress–Induced Phenylpropanoid Metabolism. Plant Cell. 1995, 7, 1085–1097. [Google Scholar] [CrossRef] [PubMed]
  45. Liu, W.; Feng, Y.; Yu, S.; Fan, Z.; Li, X.; Li, J.; Yin, H. The Flavonoid Biosynthesis Network in Plants. Int. J. Mol. Sci. 2021, 22, 12824. [Google Scholar] [CrossRef]
  46. Vogt, T. Phenylpropanoid biosynthesis. Mol. Plant. 2010, 3, 2–20. [Google Scholar] [CrossRef]
  47. Ververidis, F.; Trantas, E.; Douglas, C.; Vollmer, G.; Kretzschmar, G.; Panopoulos, N. Biotechnology of flavonoids and other phenylpropanoid–derived natural products. Part I: Chemical diversity; impacts on plant biology and human health. Biotechnol. J. 2007, 2, 1214–1234. [Google Scholar] [CrossRef]
  48. Koukol, J.; Conn, E.E. The metabolism of aromatic compounds in higher plants. IV. Purification and properties of the phenylalanine deaminase of Hordeum vulgare. J. Biol. Chem. 1961, 236, 2692–2698. [Google Scholar] [CrossRef]
  49. Tanaka, Y.; Uritani, I. Purification and properties of phenylalanine ammonia–lyase in cut–injured sweet potato. J. Biochem. 1977, 81, 963–970. [Google Scholar] [CrossRef]
  50. Havir, E.A. Phenylalanine ammonia–lyase: Purification and characterization from soybean cell suspension cultures. Arch. Biochem. Biophys. 1981, 211, 556–563. [Google Scholar] [CrossRef]
  51. Lim, H.W.; Park, S.S.; Lim, C.J. Purification and properties of phenylalanine ammonia–lyase from leaf mustard. Mol. Cells. 1997, 7, 715–720. [Google Scholar] [CrossRef]
  52. Gao, X.; Hu, Y.; Xu, Z.; Peng, D.; Guo, Q. Expression profiling of the phenylalanine ammonia–lyase(PAL) gene family in ginkgo biloba L. Plant Signal Behav. 2023, 18, 2271807. [Google Scholar] [CrossRef] [PubMed]
  53. Huang, J.; Gu, M.; Lai, Z.; Fan, B.; Shi, K.; Zhou, Y.H.; Yu, J.Q.; Chen, Z. Functional analysis of the Arabidopsis PAL gene family in plant growth; development; and response to environmental stress. Plant Physiol. 2010, 153, 1526–1538. [Google Scholar] [CrossRef] [PubMed]
  54. Joos, H.J.; Hahlbrock, K. Phenylalanine ammonia–lyase in potato (Solanum tuberosum L.). Genomic complexity; structural comparison of two selected genes and modes of expression. Eur. J. Biochem. 1992, 204, 621–629. [Google Scholar] [CrossRef]
  55. Yang, Y.H.; Wang, C.J.; Li, R.F.; Zhang, Z.Y.; Yang, H.; Chu, C.Y.; Li, J.T. Overexpression of RgPAL family genes involved in phenolic biosynthesis promotes the replanting disease development in Rehmannia glutinosa. J. Plant Physiol. 2021, 257, 153339. [Google Scholar] [CrossRef]
  56. De Jong, F.; Hanley, S.J.; Beale, M.H.; Karp, A. Characterisation of the willow phenylalanine ammonia–lyase (PAL) gene family reveals expression differences compared with poplar. Phytochemistry 2015, 117, 90–97. [Google Scholar] [CrossRef]
  57. Jiang, H.; Fu, Y.; Li, C.; Chen, M.; Gu, Z.; Shan, Y.; Tan, X. Cadmium decreased superoxide anion derived from NADPH oxidase through overload of calcium in wheat seedling. Pak. J. Bot. 2020, 52, 1589–1594. [Google Scholar] [CrossRef]
  58. Feng, Y.; Huang, Q.; Zhang, R.; Li, J.; Luo, K.; Chen, Y.; Santalla, M. Molecular characterisation of PAL gene family reveals their role in abiotic stress response in lucerne (Medicago sativa). Crop Pasture Sci. 2022, 73, 300–311. [Google Scholar] [CrossRef]
  59. Mo, F.; Li, L.; Zhang, C.; Yang, C.; Chen, G.; Niu, Y.; Si, J.; Liu, T.; Sun, X.; Wang, S.; et al. Genome–wide analysis and expression profiling of the phenylalanine ammonia–lyase gene family in Solanum tuberosum. Int. J. Mol. Sci. 2022, 23, 6833. [Google Scholar] [CrossRef]
  60. Yang, X.; Liu, T.; Yang, R.; Fan, H.; Liu, X.; Xuan, Y.; Wang, Y.; Chen, L.; Duan, Y.; Zhu, X. Overexpression of GmPAL Genes Enhances Soybean Resistance Against Heterodera glycines. Mol. Plant-Microbe Interact. 2024, 37, 416–423. [Google Scholar] [CrossRef]
  61. Rohde, A.; Morreel, K.; Ralph, J.; Goeminne, G.; Hostyn, V.; De Rycke, R.; Kushnir, S.; Van Doorsselaere, J.; Joseleau, J.P.; Vuylsteke, M.; et al. Molecular phenotyping of the pal1 and pal2 mutants of Arabidopsis thaliana reveals far–reaching consequences on phenylpropanoid; amino acid; and carbohydrate metabolism. Plant Cell. 2004, 16, 2749–2771. [Google Scholar] [CrossRef]
  62. Olsen, K.M.; Lea, U.S.; Slimestad, R.; Verheul, M.; Lillo, C. Differential expression of four Arabidopsis PAL genes; PAL1 and PAL2 have functional specialization in abiotic environmental–triggered flavonoid synthesis. J. Plant Physiol. 2008, 165, 1491–1499. [Google Scholar] [CrossRef] [PubMed]
  63. Lavhale, S.G.; Kalunke, R.M.; Giri, A.P. Structural; functional and evolutionary diversity of 4–coumarate–CoA ligase in plants. Planta 2018, 248, 1063–1078. [Google Scholar] [CrossRef] [PubMed]
  64. Shen, G.; Pang, Y.; Wu, W.; Deng, Z.; Zhao, L.; Cao, Y.; Sun, X.; Tang, K. Cloning and characterization of a flavanone 3–hydroxylase gene from Ginkgo biloba. Biosci. Rep. 2006, 26, 19–29. [Google Scholar] [CrossRef]
  65. Zhang, C.; Guo, Q.; Liu, Y.; Liu, H.; Wang, F.; Jia, C. Molecular cloning and functional analysis of a flavanone 3–hydroxylase gene from blueberry. J. Hortic. Sci. Biotechnol. 2016, 92, 57–64. [Google Scholar] [CrossRef]
  66. Wang, L.; Lui, A.C.W.; Lam, P.Y.; Liu, G.; Godwin, I.D.; Lo, C. Transgenic expression of flavanone 3–hydroxylase redirects flavonoid biosynthesis and alleviates anthracnose susceptibility in sorghum. Plant Biotechnol. J. 2020, 18, 2170–2172. [Google Scholar] [CrossRef]
  67. Wang, Y.; Shi, Y.; Li, K.; Yang, D.; Liu, N.; Zhang, L.; Zhao, L.; Zhang, X.; Liu, Y.; Gao, L.; et al. Roles of the 2–Oxoglutarate–Dependent Dioxygenase Superfamily in the Flavonoid Pathway: A Review of the Functional Diversity of F3H, FNS I, FLS, and LDOX/ANS. Molecules 2021, 26, 6745. [Google Scholar] [CrossRef]
  68. Chen, C.; Chen, H.; Zhang, Y.; Thomas, H.R.; Frank, M.H.; He, Y.; Xia, R. TBtools: An Integrative Toolkit Developed for Interactive Analyses of Big Biological Data. Mol. Plant. 2020, 13, 1194–1202. [Google Scholar] [CrossRef]
  69. Tamura, K.; Stecher, G.; Kumar, S. MEGA11: Molecular Evolutionary Genetics Analysis Version 11. Mol. Biol. Evol. 2021, 38, 3022–3027. [Google Scholar] [CrossRef]
  70. Subramanian, B.; Gao, S.; Lercher, M.J.; Hu, S.; Chen, W.H. Evolview v3: A webserver for visualization; annotation; and management of phylogenetic trees. Nucleic Acids Res. 2019, 47, W270–W275. [Google Scholar] [CrossRef]
  71. Bailey, T.L.; Williams, N.; Misleh, C.; Li, W.W. MEME: Discovering and analyzing DNA and protein sequence motifs. Nucleic Acids Res. 2006, 34, W369–W373. [Google Scholar] [CrossRef]
  72. Wang, Y.; Tang, H.; Debarry, J.D.; Tan, X.; Li, J.; Wang, X.; Lee, T.-H.; Jin, H.; Marler, B.; Guo, H.; et al. MCScanX: A toolkit for detection and evolutionary analysis of gene synteny and collinearity. Nucleic Acids Res. 2012, 40, e49. [Google Scholar] [CrossRef] [PubMed]
  73. Tong, X.; Cao, A.; Wang, F.; Chen, X.; Xie, S.; Shen, H.; Jin, X.; Li, H. Calcium-Dependent Protein Kinase Genes in Glycyrrhiza uralensis Appear to be Involved in Promoting the Biosynthesis of Glycyrrhizic Acid and Flavonoids under Salt Stress. Molecules 2019, 24, 1837. [Google Scholar] [CrossRef]
Figure 1. Distribution map of PAL family genes on the chromosomes of three Glycyrrhiza species. (AC) correspond to G. glabra, G. inflata, and G. uralensis, respectively. “chr1”, “chr2”, etc., represent different chromosomes, and different colors indicate different characteristics of the chromosomes. The PAL genes are marked in red, and the arrows indicate their positions on the chromosomes. The scale on the left side of the chromosome represents the chromosome length (in Mb).
Ijms 26 04073 g001
Figure 2. Phylogenetic tree of PAL family genes in G. uralensis, G. inflata, G. glabra, G. max, and A. thaliana. “Gu”, “Gi”, “Gg”, “Gm”, and “At” represent G. uralensis, G. inflata, G. glabra, G. max, and A. thaliana, respectively. The phylogenetic tree is divided into three branches: Clade A, Clade B, and Clade C. The gene names on the branches represent different PAL gene members of each species, and the phylogenetic tree shows the degree of genetic relationship among these gene members.
Ijms 26 04073 g002
Figure 3. Collinearity relationship diagram of PAL family genes among chromosomes of G. uralensis, G. inflata, and G. glabra. Gu, Gi, and Gg represent G. uralensis, G. inflata, and G. glabra, respectively. “GgChr–GgChr8”, “GiChr1–GiChr8”, and “GuChr1–GuChr7” represent different chromosomes of the corresponding Glycyrrhiza species. Different colored lines connect the chromosomes of different species, with each line representing a collinear region between chromosomes, indicating the conserved order and orientation of genes in these regions.
Ijms 26 04073 g003
Figure 4. Analysis of promoter cis-acting element, conserved motif, and gene structure of PAL family genes in G. uralensis, G. inflata, G. glabra, G. max, and A. thaliana: (A) Analysis of the distribution of cis-acting elements in the PAL promoter region. Different-colored ellipses represent different types of elements. The horizontal axis represents the base positions from the 5′ to the 3′ end of the promoter. (B) Presents of the number of different cis-acting elements in each PAL gene in the form of a heat map, which is reflected by the depth of color. The specific values are marked within the squares. (C) Phylogenetic tree-based evolutionary relationship analysis of PAL genes from different species. The branches reflect the degree of genetic relatedness. (D) Conserved motif analysis of the PAL genes from different species. Squares of different colors represent different motifs, visually presenting the types and positions of motifs contained in the genes. (E) Gene structure analysis of the PAL genes. The black lines and green bars represent the introns and exons, respectively.
Ijms 26 04073 g004
Figure 5. Expression analysis of PALs in various tissues and under different treatments in three Glycyrrhiza species: (A) Expression levels of PALs in different tissues of three Glycyrrhiza species. The horizontal axis represents different tissue types, including Root, Leaf, and Stem. (B) Expression levels of PAL genes in the roots of three Glycyrrhiza species under 200 mM NaCl treatment. Each numerical value represents the average relative expression level obtained from three independent replicate experiments. (C) Expression levels of PAL genes in the roots of three Glycyrrhiza species under 10% PEG treatment. Each value in the figure represents the average relative expression level obtained from three replicate experiments. Gura, Ggla, and Ginf represent G. uralensis, G. glabra, and G. inflata, respectively.
Ijms 26 04073 g005
Figure 6. Analysis of phenotypes and flavonoid contents of the transgenic A. thaliana lines: (AC) are the growth status of 15-, 25-, and 45-day WT plants, overexpressing GuPAL1 plants, Atpal1 mutant plants, and Atpal1 functional complementation plants, respectively. WT: Wild type; Atpal1: Atpal mutant; Atpal1/GuPAL1: Atpal1 functional complementation lines. Bar = 1 cm. (D,E) represent the bar charts of flavonoid contents in the intact plant and underground parts, respectively, of 45-day-old WT, GuPAL1, Atapl1 mutant, and Atpal1/GuPAL1 A. thaliana plants, using the 45-day-old plant materials as samples. (mean ± standard error, n = 3). The t-test was used for significant difference analysis between WT and GuPAL1-OE plants, WT and Atpal1 mutant, WT and Atpal1/GuPAL1 complementation lines, with *, **, and *** denoting significant differences at p < 0.05, 0.01, and 0.001 levels, respectively.
Ijms 26 04073 g006
Figure 7. Transcriptomic analysis of A. thaliana overexpressing GuPAL1: (A) GO annotation of up-regulated genes in the transcriptome of GuPAL1-OE A. thaliana. (B) KEGG annotation of up-regulated genes in the transcriptome of GuPAL1-OE A. thaliana. (C) KEGG enrichment of up-regulated genes in the transcriptome of GuPAL1-OE A. thaliana.
Ijms 26 04073 g007
Figure 8. Transcriptomic expression analysis and content detections of pathways of flavonoid, ZT, SA, and ABA in transgenic Arabidopsis. Heatmaps of the expressions of up-regulated genes located in the pathways of flavonoid biosynthesis (A), ZT biosynthesis (B), and SA signaling (C,D). (EG) Detections of the contents of ZT (E), SA (F), and ABA (G) in different parts of the transgenic Arabidopsis. The samples from 45-day-old A. thaliana plants of WT, GuPAL1, Atpal1 mutant, and Atpal1/GuPAL1 were collected for analysis. The t-test was used for significant difference analysis between WT and GuPAL1-OE plants, WT and Atpal1 mutant, WT and Atpal1/GuPAL1 complementation lines, with **, and *** denoting significant differences at p < 0.01 and 0.001 levels, respectively.
Ijms 26 04073 g008
Figure 9. Protein–Protein Interaction (PPI) Analysis of GuPAL1. Red, orange, and blue colors represent GuPAL1, PPI-predicted genes that directly interact with GuPAL1, and other flavonoid and plant hormone-related pathway differentially co-expressed genes (DCGs), respectively. Hierarchical clustering analysis was performed using Euclidean distance and the complete linkage method.
Ijms 26 04073 g009
Disclaimer/Publisher’s Note: The statements, opinions and data contained in all publications are solely those of the individual author(s) and contributor(s) and not of MDPI and/or the editor(s). MDPI and/or the editor(s) disclaim responsibility for any injury to people or property resulting from any ideas, methods, instructions or products referred to in the content.

