3.1 Basic Characteristics of QSAR in Ecotoxicology
From more than one decade the European Union institutions, e.g. Organization for Economic Cooperation and Development (OECD) through its Registration, Evaluation, and Authorization of Chemicals (REACH) management system [
63,
64], the United States Environmental Protection Agency (EPA) as part of the premanufactory notification assessment, as well as the World Health Organization have been developing impressive programs on the regulatory assessment of chemical safety by using of the QSAR data bases and of the associated automated expert systems [
65–
73]. This because, with the tones of chemicals that force their way onto the market each year and due to their commercial and industrial disposal into the environment, it becomes of first importance to predict their toxicological activities from the molecular structure in order to properly design the risk assessment measures [
67–
77].
Nevertheless, in order to best accomplish such a goal, both a conceptual and a computational strategy need to be adopted. As such, while, for instance, a certain set of parameters has been identified for environmental studies, i.e. bioaccumulation, chemical degradation (aqueous and gas phase), biodegradation, soil sorption, and ecotoxicity, two major aspects have been identified for QSAR analyses, namely the quality and the chemical domain of the QSAR [
69,
71,
72].
Concerning the parameters to be evaluated, they are analytically transposed into the so called
endpoints, representing specific experimental and measurement quantities giving information about the environmental risk degree. They are thus identified with the QSAR activities (biophores or toxicophores) to be correlated and are usually expressed as log-based continuous toxicological data (e.g. median lethal concentration-LC
50, 50% effect concentration-EC
50, 50% grow inhibition concentration-IGC
50) [
74–
77].
On the other hand, a useful QSAR model has to satisfy selection criteria in order to be validated.
From the statistical point of view the ratio of data points to the number of variables should be higher or equal to 5 (the so called Topliss-Costello rule [
78]) and to provide a correlation factor
r > 0.84.
As descriptors, those directly related to molecular structure of chemical are preferable. It is worth noting here that the quantum chemical parameters have an advantage against those of topological nature; still the quantum parameters to be used has to be relatively easily obtainable, for instance those based on ground state or valence state properties of compounds are preferable to those based on transition-state calculations [
10].
If descriptors are taken from experiments, the experimental conditions must be specified. Nevertheless, the best models predicting ecotoxic effects have to be mechanistic interpretable, though that structure-activity correlation permits reconstruction or prediction of the basic phenomena that take place at the molecular level.
Regarding the outliers they have to be treated with caution, as they are not necessarily outside of the chemical domain but depending on the QSAR model (i.e. of the correlated descriptors) employed [
79]. Moreover, the atypical data (presumed outliers) may represent compounds acting by a different mechanism, inducing an inhibition or belonging to dissimilar chemical structure. However, they should not be excluded from an analysis unless relevant alternative QSAR models were constructed. With this issue, we arrive at the chemical domain problem or at the representative set of compounds for the QSAR analysis.
Based on previous criteria in order for a QSAR analysis to be well conducted, a compromise between breath (variety) and depth (representability) characteristics through the existing chemicals within that domain have to be considered.
This way, the two-fold process of dissimilarity- and similarity- based selection is achieved [
10]. The motivation for this criteria is that, while similar compounds (usually based on substitutions) assures the basic congenericity QSAR condition, considering dissimilar chemicals can predict how (however subtle) alterations in molecular structure can lead to changes in the mechanism of toxicity action and potency in the tested series of compounds. In short, this condition can be regarded as structural heterogeneity of compounds.
After all, it is widely recognized that ecotoxicity action is a multivariate process involving xenobiotics leading with immediate and long-term effects due o various transformations products. Therefore, a QSAR approach may provide information of the bio-up-take (i.e. of key process) through the selected descriptors that can be integrated in an expert system of toxic prediction.
However, with a view to designing an ecotoxicological mechanistic battery for different species on QSAR grounds, the first stage of unicellular organism level is undertaken here.
3.2 Bio-ecological Issues of Unicellular Organisms
We often think of unicellular organisms as having a simple, primitive structure. This is definitely an erroneous view when applied to the ciliates; they are probably the most complex of all unicellular organisms.
Unlike multicellular organisms, which have cells specialized for performing the various body functions, single-celled organisms must perform all these functions with a single cell, and so their structure may be much more complex than the cells of larger organisms.
Movement, sensitivity to the environment, water balance, and food capture must all be accomplished with the machinery in a single cell [
80,
81a–d]. As protozoans these organisms are classified according to their means of locomotion: by cilia (
Ciliophora), flagella (
Sarcomastigophora), or pseudopodia (
Rhizopoda), while non-motile protists are classified as sporozoans in the phylum
Apicomplexa.
Many of these single-celled organisms feed by engulfing smaller organisms directly into temporary intracellular vacuoles. These food vacuoles circulate in a characteristic manner within the cells while enzymes are secreted into them for digestion [
81b].
However, form the taxonomy points of view they are classified downwards, from kingdom to species as:
Protista > Ciliophora > Cyrtophora > Oligohymenophorea > Hymenostomatia > Hymenostomatida > Tetrahymeni > Tetrahymenidae > Tetrahymena[
81c].
However, it is worth restricting the discussion to ciliates only since they include about 7500 known species of some of the most complex single-celled organisms ever, as well as some of the largest free-living protists; a few genera may reach two millimeters in length, and are abundant in almost every environment with liquid water: ocean waters, marine sediments, lakes, ponds, and rivers, and even soils. Because individual ciliate species vary greatly in their tolerance of pollution, the ciliates found in a body of water can be used to gauge the degree of pollution quickly.
More specifically, ciliates are classified on the basis of cilia arrangement, position, and ultrastructure. Such work now involves electron microscopy and comparative molecular biology to estimate relationships.
In the most recent classification of ciliates, the group is divided into eight classes:
Prostomatea Benthic and
Karyorelictida Benthic (mostly in marine forms),
Litostomatea (including
Balantidium and
Didinium),
Spirotrichea (including
Stentor,
Stylonychia, and tintinnids),
Phyllopharyngea (including suctorians),
Nassophorea (including
Paramecium and
Euplotes),
Oligohymenophorea (including
Tetrahymena, Vorticella and
Colpidium), and Colpodea (including
Colpoda) [
81a].
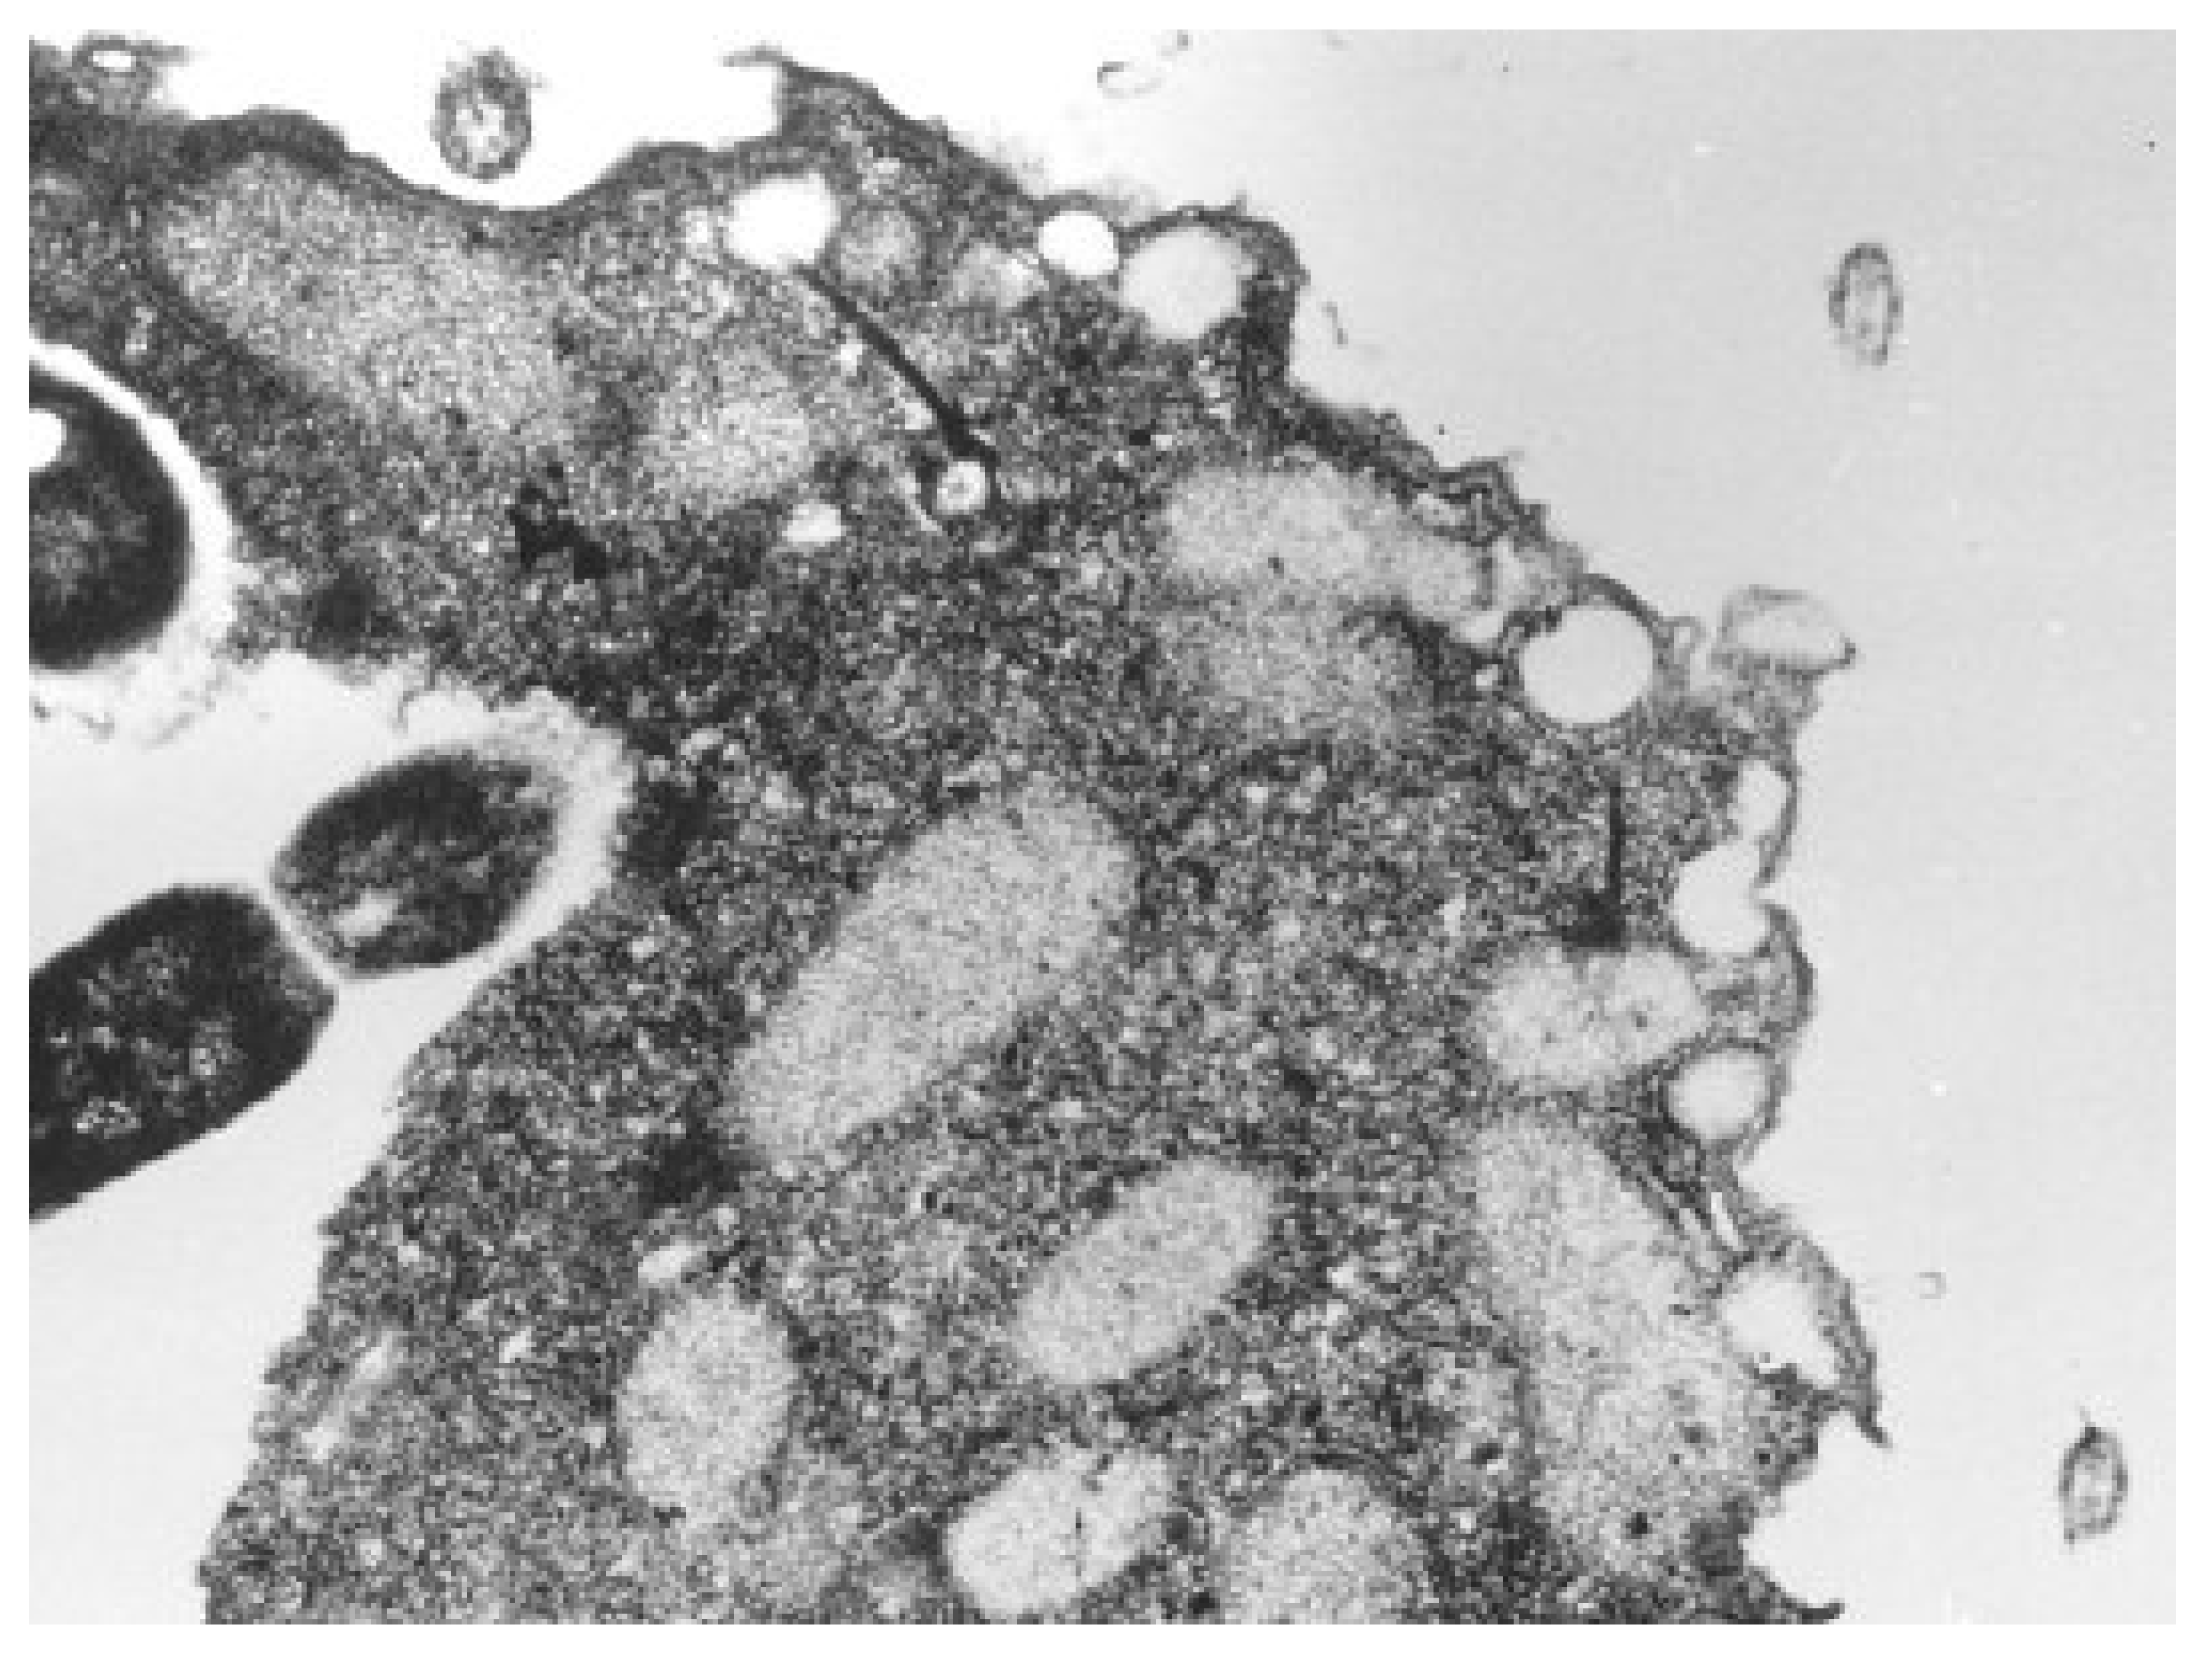
Nevertheless, most frequently studied unicellular organisms through QSAR toxicological analysis are from the Tetrahymena genus of ciliated protozoa. All species of the genus Tetrahymena are morphologically very similar; they display multiple nuclei: a diploid micronucleus found only in conjugating strains and a polyploid macronucleus present in all strains, which is the site of gene expression during vegetative growth, see
Figure 3[
82,
83].
Tetrahymena species are very common in aquatic habitats and are non-pathogenic, have a short generation time and can be grown to high cell density in inexpensive media [
81d]. As such, ecological, morphological, biochemical, and molecular features have been used over the years in attempts to classify them.
The earliest classifications were based on morphological and ecological data. At this level the presence or absence of a caudal cilium was regarded as an important character. Later, three morphological species complexes were distinguished: the pyriformis complex with smaller, bacterivorous species and less somatic kinetics; the rostrata complex with larger parasitic or histophagous species, more somatic kinetics, and the ability to form resting cysts; and the patula complex with species that undergo microstome-macrostome transformation. Within the complexes, particularly the pyriformis complex, species are distinguishable by their mating capacity and/or isozyme patterns. Finally, another approach based on the degree of parasitism was suggested. Since, the
Tetrahymena species are free-living, as well as facultative and obligate parasites, it was suggested an evolutionary lineage from free-living species, considering
Tetrahymena pyriformis to be the basal species, to facultative parasites, and then to obligate parasites [
80,
81a,
82,
84].
Accordingly, Tetrahymena pyriformis, a teardrop-shaped, unicellular, ciliated freshwater protozoan about 50 μm long, is found as the best candidate whose ecotoxicological activity is considered through the present S-SAR toward establishing a mechanistically coherent view of a certain class of xenobiotics on inter-correlated species.
3.3 Spectral-SAR Ecotoxicity of Tetrahymena pyriformis
Quite often, despite the tendency to submit a large class of descriptors to a QSAR analysis, this is not the best strategy [
69], at least in ecotoxicology, and whenever a specific mode of action or the elucidation of the causal mechanistically scheme is envisaged.
More focused studies in ecotoxicology, and especially regarding T. pyriformis, have found that hydrophobicity (LogP) and electrophilicity (ELUMO) phenomena plays a particular place in explaining the ecotoxicology of the species.
While hydrophobicity describes the penetration power of the xenobiotics though biological membranes, the other descriptors to be considered reflect the electronic and specific interaction between the ligand and target site of receptor.
Moreover, it was convincingly argued that the classical Hammett constant can be successfully rationalized by a pure structural index as the energy of the lowest unoccupied molecular orbital (
LUMO) is [
79]. These facts open the attractive perspective of considering the ecotoxicological studies through employing the Hansch-type structure-activity expansion:
thus also providing enough information from transport, electronic affinity and specific interaction at the molecular level, respectively.
However, in the present study, besides considering
LogP as compulsory descriptor the molecular polarizability (
POL) will be considered for modelling the electronic affinity for its inherent definition that implies the radius of the electrostatic sphere of electrostatic interaction. This way, the first stage of binding, through the radius of interaction, is accounted [
85].
Then, the steric descriptor is chosen here, for simplicity, as the total molecular energy (ETOT) in its ground state, for the reason that it is calculated at the optimum molecular geometry where the stereospecificity is included.
Under these circumstances the ecotoxic activity to
Tetrahymena pyriformis, determined in a population growth impairment assay with a 40 h static design and population density measured spectrophotometrically as the endpoint
A=Log (1/IGC
50) [
86–
90], from a series of xenobiotics of which majority are of phenol type is in
Table 3 considered.
It is worth mentioning that the number of compounds is in relevant ratio with the number of descriptors used, according with above Topliss-Costello rule, and that both chemical variability and congenericity are fulfilled since most of them reflect the phenolic toxicity.
The standard QSAR analysis of data of
Table 3 for all possible models of actions reveals the multivariate equations displayed in
Table 4, together with their associate statistics:
as correlation factor, standard error of estimate and Fisher index, respectively, in terms of the total number of residues, measuring the spreading of the input activities with respect to their estimated counterparts,
and the total sum of squares,
measuring the dispersion of the measured activities around their average:
while the number of compounds and descriptors were fixed to N = 26 and M = 3, in each endpoint case, respectively.
Before attempting a mechanistic analysis of the results, let us apply the S-SAR techniques to the same data of
Table 3 by using the key (or spectral) equation-type (
17) with the associated determinant completed with orthogonal and spectral coefficients of
Eqs. (12) and
(15), in each considered model of ecotoxic action, respectively.
More explicitly, in
equations (27)–
(29), the spectral equations are presented with their determinant forms that once expanded produce the spectral multi-linear dependencies of
Table 5.
Remarkably, one may easily note the striking similitude of the equations in
Tables 4 and
5, respectively. Moreover, in
equations (27) the spectral determinant was written in both possible ways of orthogonalization, nevertheless leading to the same results in
Table 5. That is the computational proof that Spectral-SAR indeed provides a viable alternative to standard QSAR at each level of modelling, being independent of number of descriptors, compounds, or order of orthogonalization. We advocate on the computational advantage of S-SAR though lesser steps of computation and by the full analyticity of the delivered structure-activity equation, through a simple transparent determinant.
However, conceptually, S-SAR achieves a degree of novelty with respect to normal QSAR though that the spectral equation is given in terms of vectors rather than variables. Such features marks a fundamental achievements since this way we can deal at once with whole available data (of activity and descriptors) within a generalized vectorial space. Consequently, we may also use the spectral norm of the activity,
as the general tool by means which various models can be compared no matter of which dimensionality and of which multi-linear degree since they all reduce to a single number. This could help fulfill QSAR's old dream of providing a conceptual basis for the comparison of various models and end points by becoming a true science. Even more, while also accurately reproducing the statistics of the standard QSAR, the actual S-SAR permits the introduction of an alternative way of computing correlation factors by using the above spectral norm concept. As such the so called algebraic S-SAR correlation factor is defined as the ratio of the spectral norm of the predicted activity versus that of the measured one:
Applying
Eq. (31) to the present case of the measured spectral norm of
T. pyriformis activity |||
Y〉
MEASURED|| = 6.83243 the algebraic S-SAR correlation factors for the actual predicted models are given in
Table 6 along the individual spectral norm of activity and the standard statistical correlation factor values.
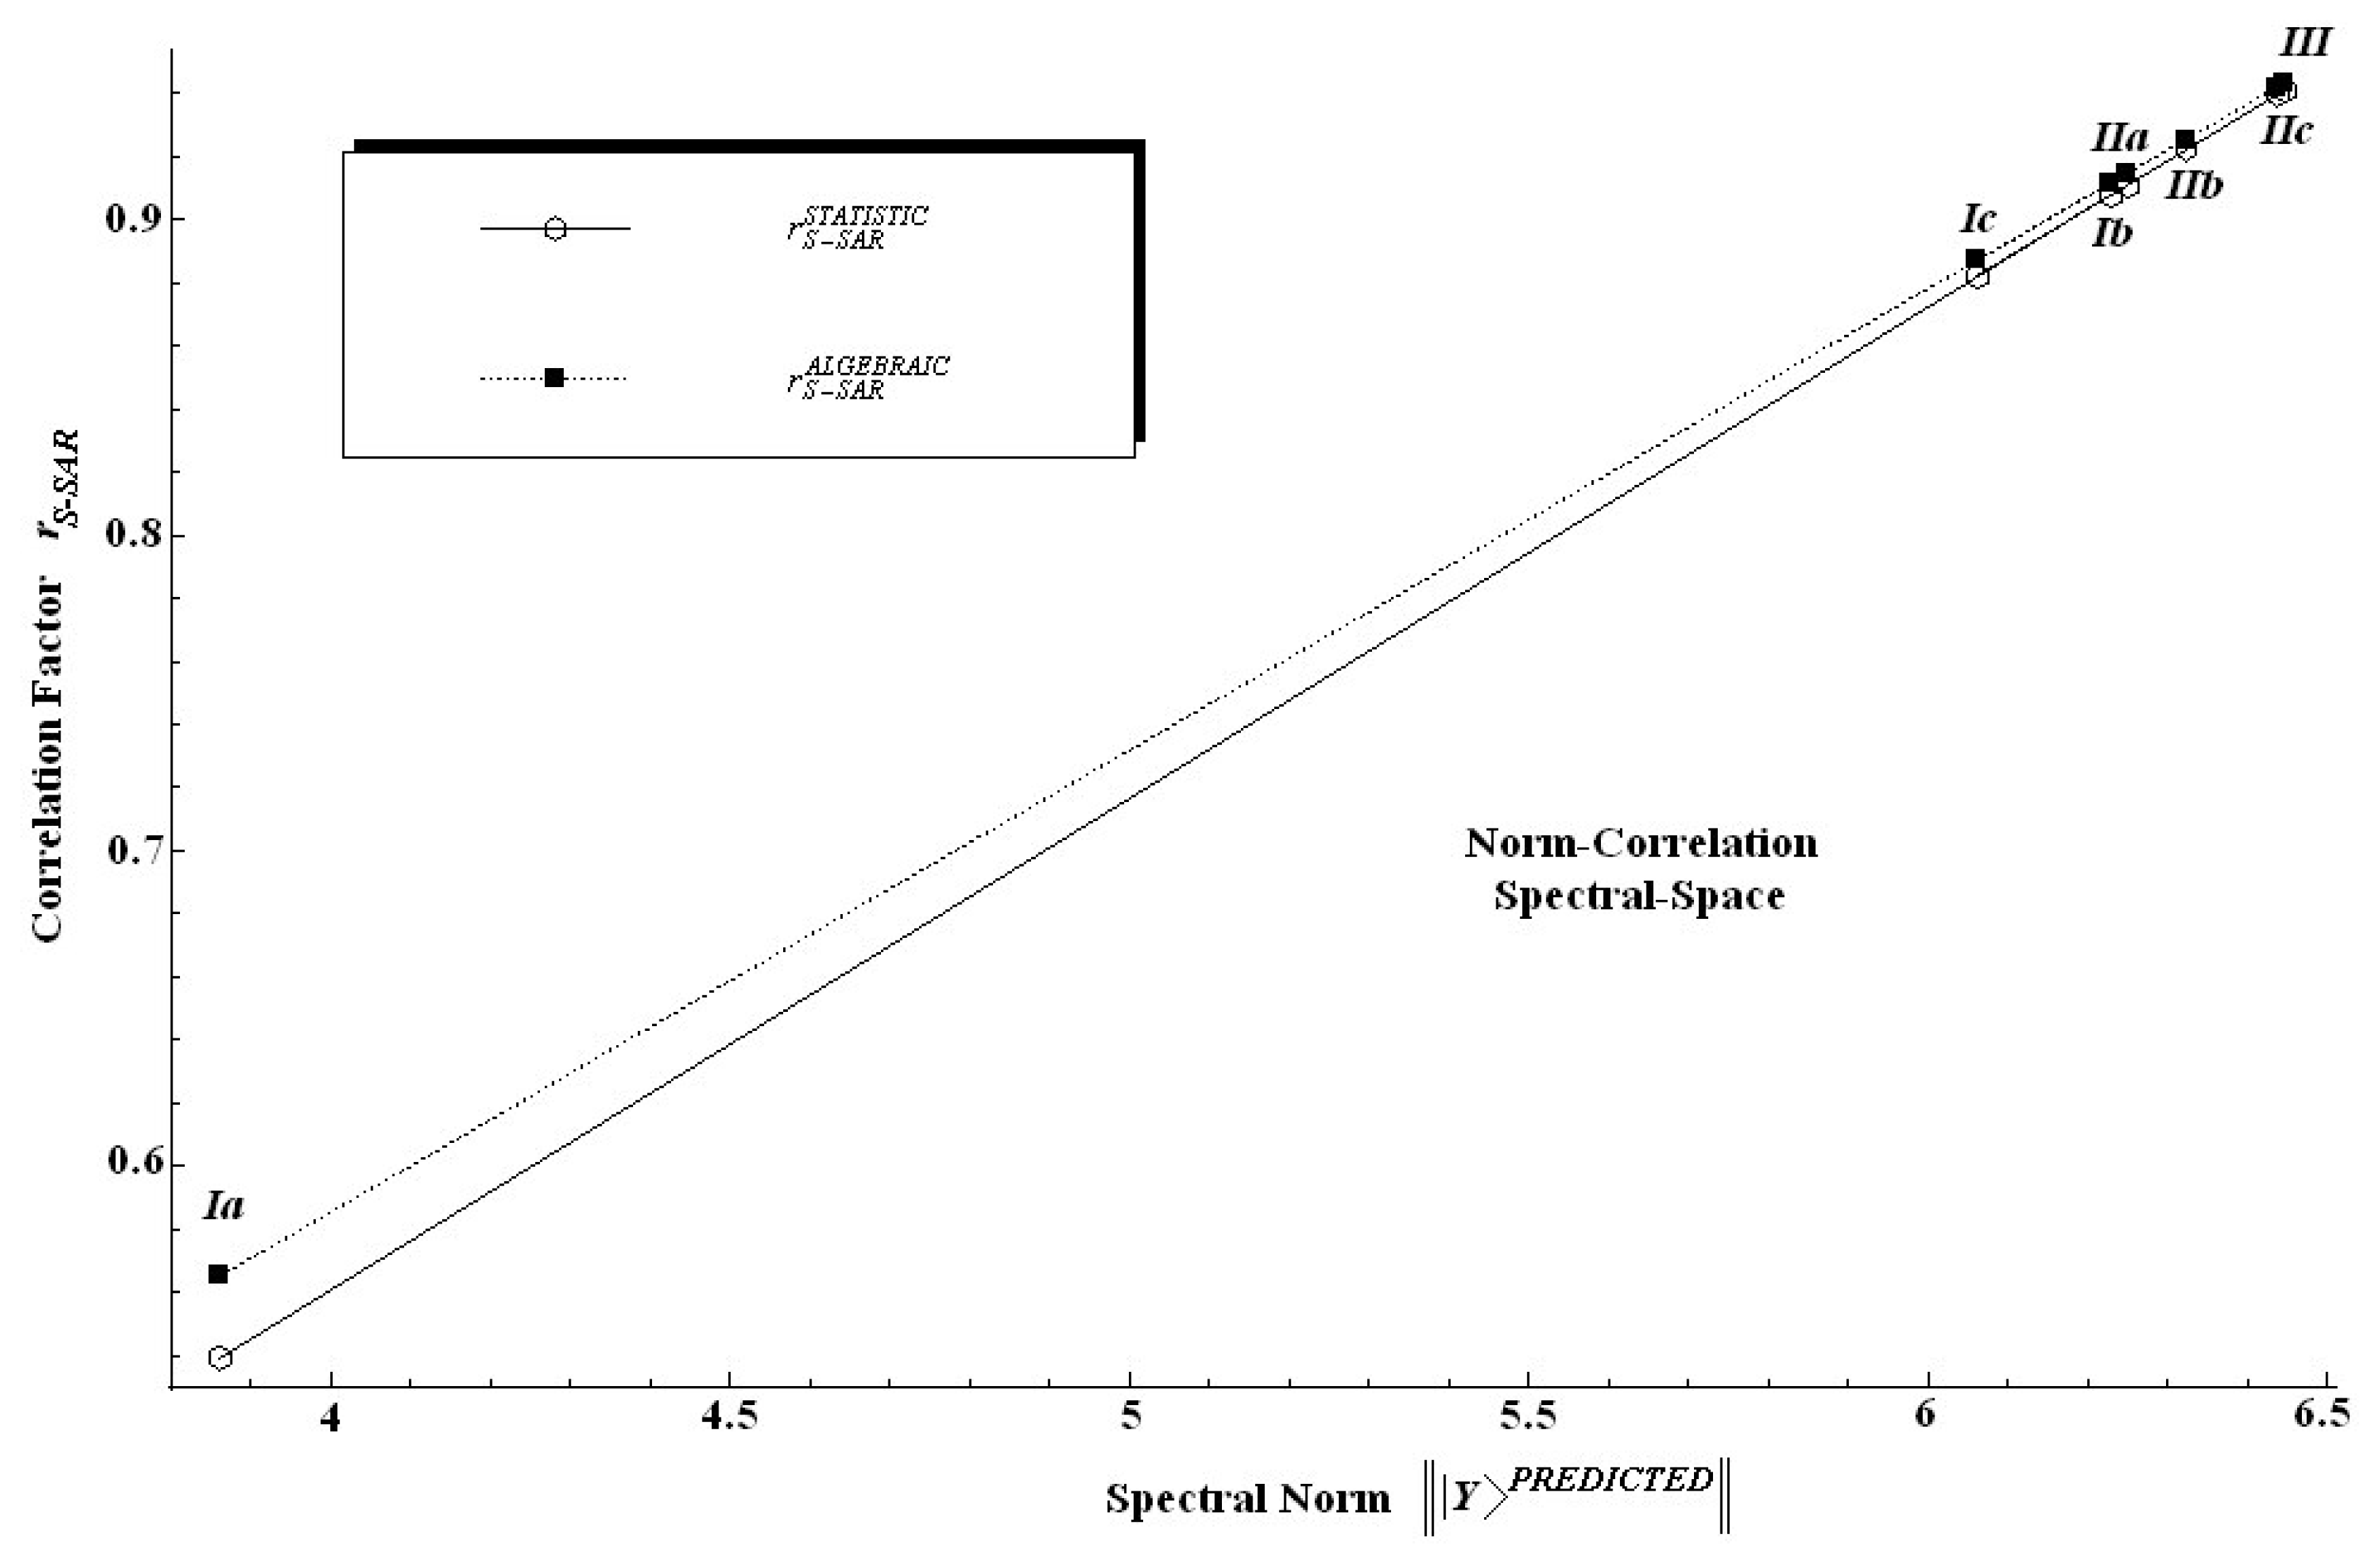
The findings in
Table 6 are twice relevant: first, because it is clear that the spectral norm parallels the statistic correlation factor; second, because, since the introduced algebraic correlation factor does the same job, it poses slightly higher values on a systematic basis.
In other words, one can say that in an algebraic sense the S-SAR furnishes systematically higher correlation factors than the standard QSAR does. This feature is also depicted in
Figure 4 from where it is also noted that both correlation factors tend to approach each other near the ideal correlation factor, i.e. in the proximity of
r = 1.00.
Nevertheless, we should note at this point that while a certain model does not satisfy the correlation factor criteria for being validated, i.e. r > 0.84, as is the case of the model (Ia) when only hydrophobicity is taken into account, this does not mean that the descriptor or chemical domain is less relevant; it is merely an indication that this descriptor may be further considered in a multivariate combination with others until produce better model.
Indeed, both within standard QSAR and S-SAR approaches all models except (Ia) are characterized by relevant statistics.
Next, aiming to see whether the obtained models can provide us a mechanistic model of chemical-biological interaction of tested xenobiotics on T. pyriformis species, the introduced spectral norm is employed in conjunction with algebraic or statistic correlation factors to compute the spectral paths between these models. Such an endeavor may lead to an intra-species analysis of models and form the first step for designing of integrated test batteries (or an expert system) at the inter-species level of ecotoxicology.
In this respect,
Table 7 presents the computed spectral distance between the models of the measured Log(1/IGC
50) endpoint of
Table 3 though considering all path combinations that contain a single model for each class, with one and two descriptors, towards the closest model, i.e. (
III), with respect to the ideal one. It follows that the paths are grouped according to the intermediary passing model while extreme models (initial and final) are kept fixed. Such ordered paths can be rationalized since a selection criterion is further introduced. Since paths are involved, one may learn from the well-established principle of nature according to which the events are linked by closest paths (in all classical and quantum spaces).
Therefore, we may formulate the S-SAR least path principle as follows: the hierarchy of models is driven by the minimum distance between endpoints (predicted norm of activities) of different classes of descriptors and of their combinations; whenever multiple minimum paths are possible, that principle applies iteratively downwards between individual intermediate models of paths, starting with that one with minimal spectral norm.
In our case, according to the enounced minimum spectral path rule, the diagram of
Figure 5 is constructed. It emphasizes different mechanistic hierarchies of the
T. pyriformis toxicophores. It comes out that, for instance, while three minimum paths result from
Table 7, namely
Ib-IIa-III,
Ib-IIb-III, and
Ib-IIc-III, only one is selected as giving the primary hierarchy,
Ib-IIa-III, based on the fact that the spectral norm of
IIa is the closest one to
Ib. This is a purely mechanistic result since the correlation order in
Table 6 would require that
IIc be the next model chosen when starting from model
Ib. At this point, we see that what is ordered from a statistical point of view may be degenerate in path length between the spectral norms. Therefore it appears that statistics might not be the most adequate criterion for SAR validity, since models with different correlations factors may be equally inter-related through spectral norms. Used exclusively, the statistic criteria will give little information about the subsidiary inter-species correlations in a unitary picture. On the contrary, the spectral path rule is able to formulate a scheme of connected paths between the models employing the natural principle of minimal action.
Minimal action here means that minimal length between spectral norms of different categories of endpoints is more favorable and comes firstly into a process driven by the succession of activities. Thus, once the path
Ib-IIa-III is naturally selected as the primary hierarchy of the ecotoxicity mechanism of
T. pyriformis, one can expect that, in this interpretation of the minimum spectral paths, the envisioned sequence of actions towards the measured one can be causally modeled as the action of polarizability followed by that of hydrophobicity and finally by that of total energy, through the optimization of molecular geometry during the chemical-biological interactions involved. This picture tells that the covalent interaction is the most dominant one, in this case, and drives the approach between the xenobiotics and the cells of organism; then enters into action the transfer through cellular membrane and finally the stabilization being assured by the stereo-specificity of the compounds linked to the receptor site. This way, a molecular mechanism may be coherently formulated in terms of norms of actions and of their inter-distances.
Whenever the primary route is inhibited, the second hierarchy of action follows by excluding the models previously involved and based on the same least principle of action. The second initial model will be chose that which is nearest to the first one on the spectral norm scale. Then, from all equivalent paths the next step is made toward the closes neighbor in the spectral norm sense.
The second hierarchy results along the endpoints path
Ic-IIb-III, see
Figure 5. This tells us that, by some subsidiary, slower action, the stereo-specificity selection is the first stage of the chemical-biological interaction analyzed, followed by membrane transport and only then by the stabilization of chemical bonds through polarizability.
If the secondary route is somehow repressed, as well the third way of ecotoxicological action of
T. pyriformis is also revealed as in
Figure 5,
Ia-IIc-III, again on the minimal activity action grounds constructed.
It is not surprising that the application of minimal action principles on the spectral activity norms furnished many, however ordered, ways in which chemical-biological interaction are present in nature. This is in accordance with the heuristically truth that the Nature reserves the privilege to develop many paths to achieve an action. The present S-SAR approach gives these new possibilities of hierarchically modelling of activities, in a way that the statistical analysis appears to be limited to single choices. Nevertheless, further work has to be performed by employing S-SAR method and of its minimal spectral path principle on many species and class of compounds in order to better validate the present results and algorithm.


