Near Infrared Spectroscopy for On-line Monitoring of Alkali- Free Cloth /Phenolic Resin Prepreg During Manufacture

Abstract
:1. Introduction
2. Results and Discussion
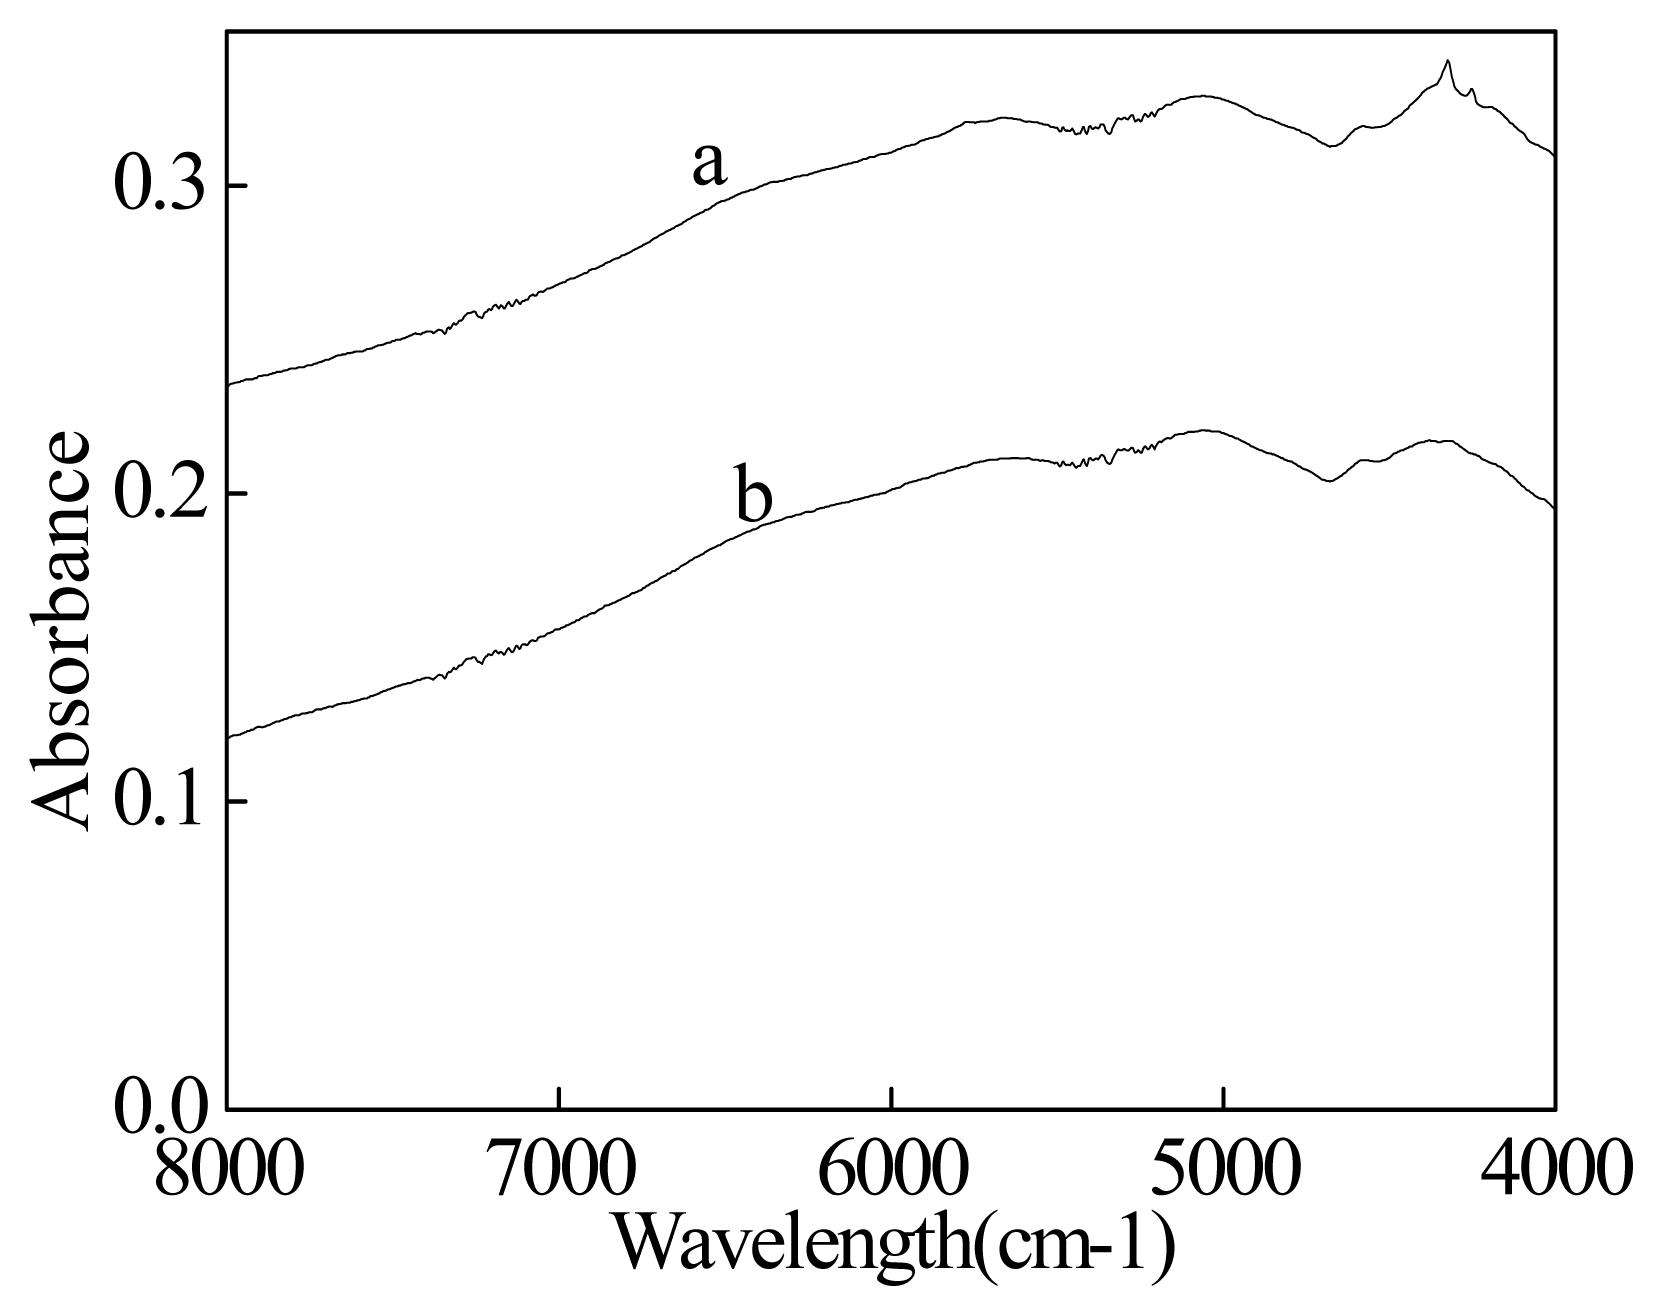
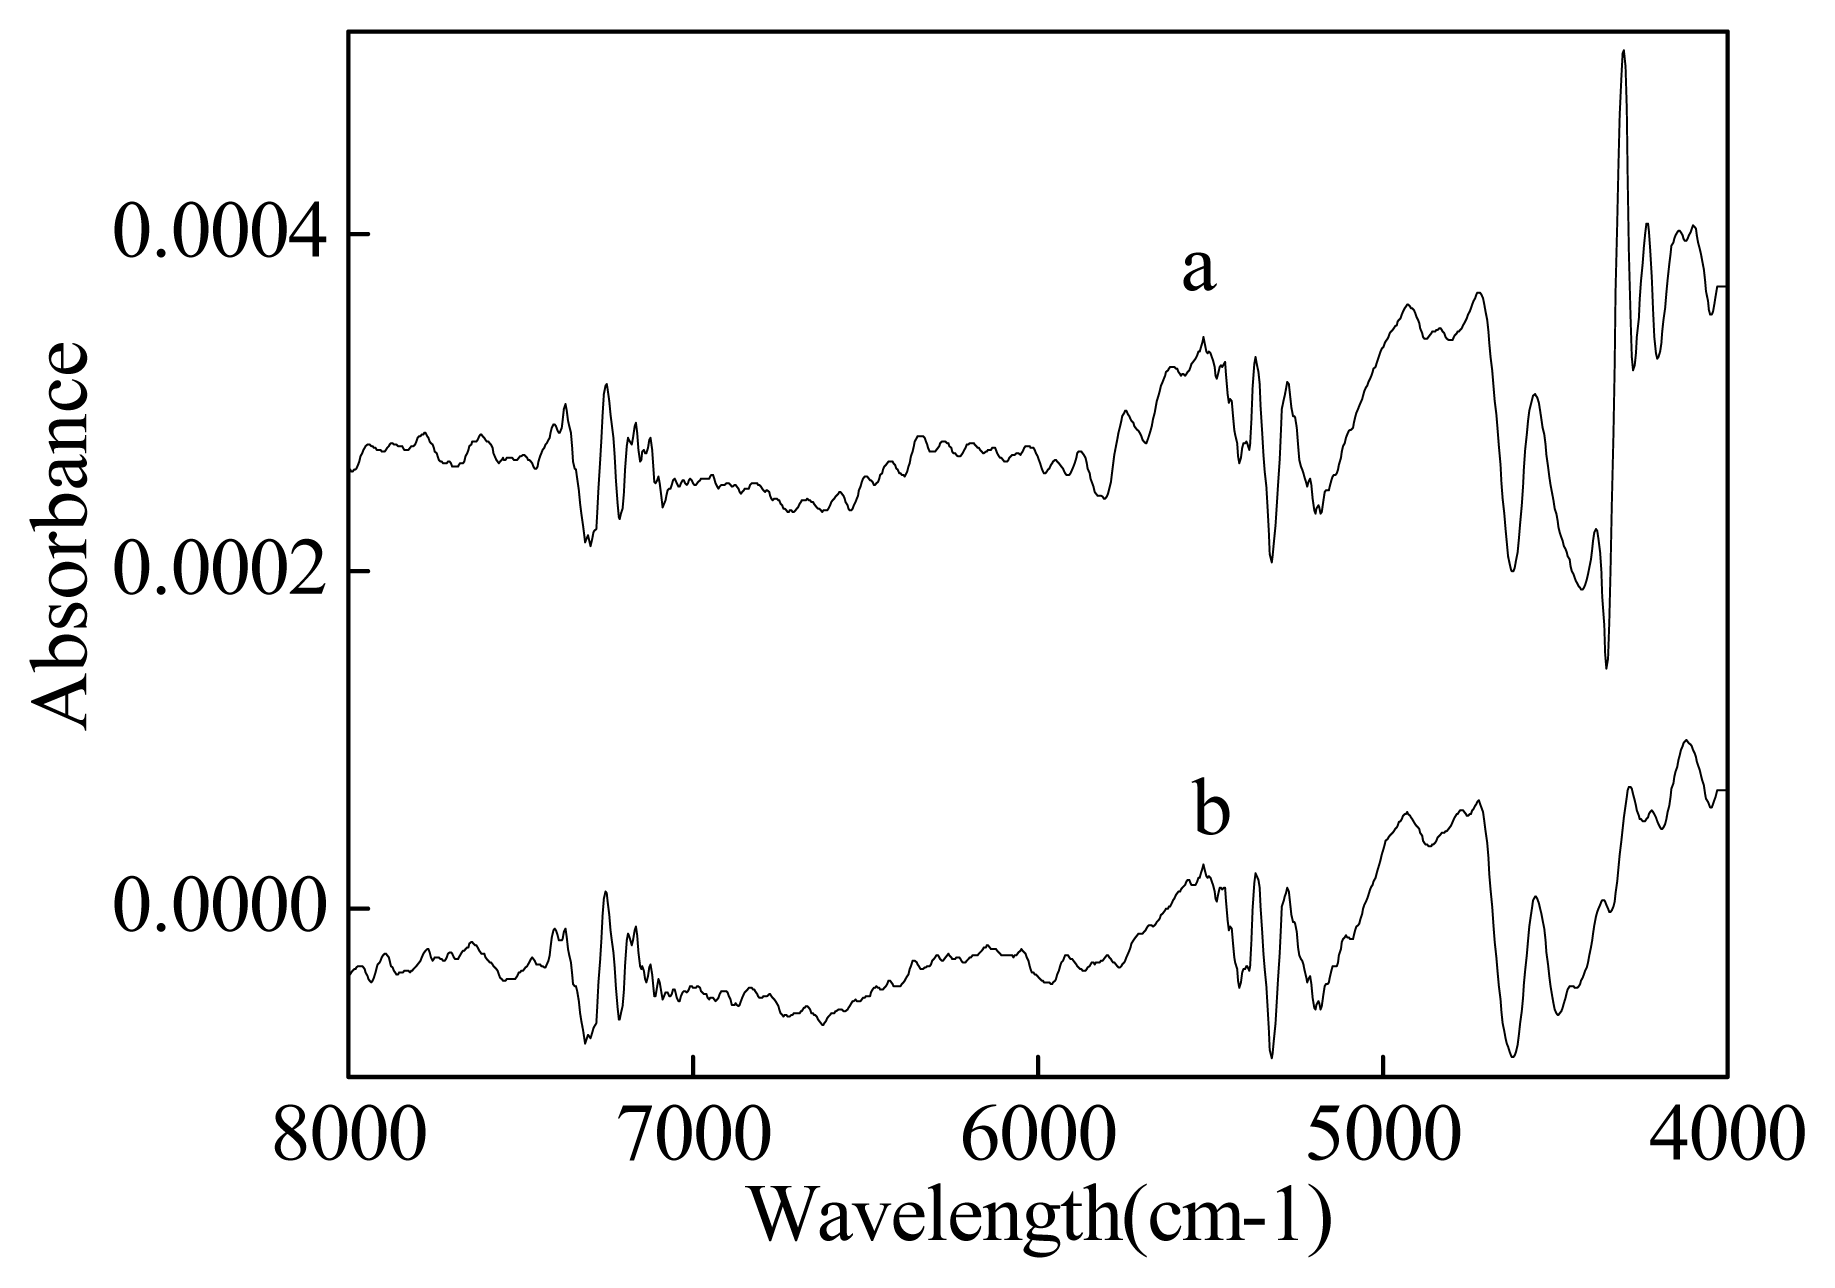
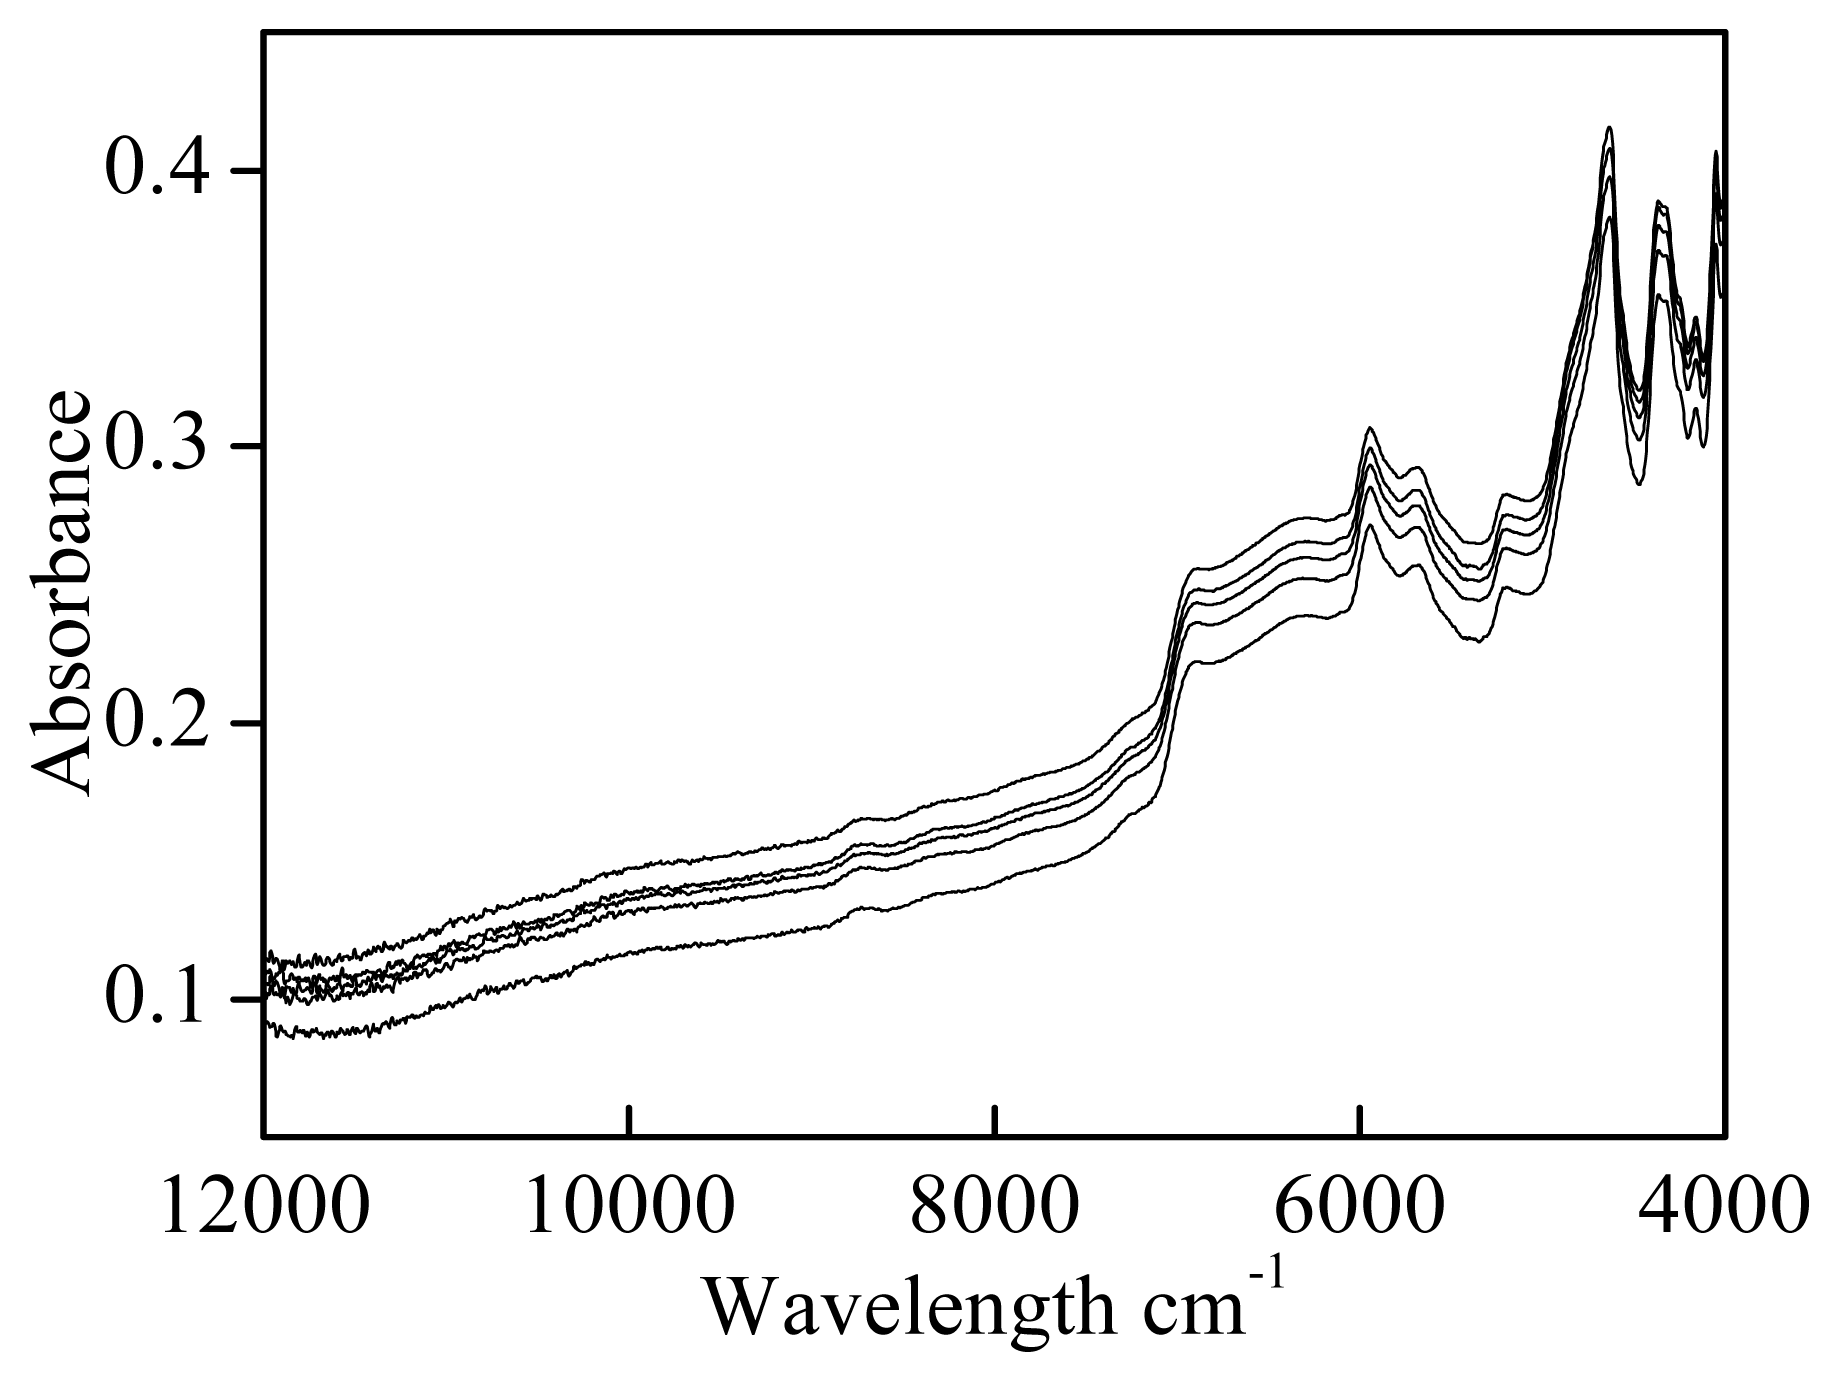
2.1 NIR spectra information of materials
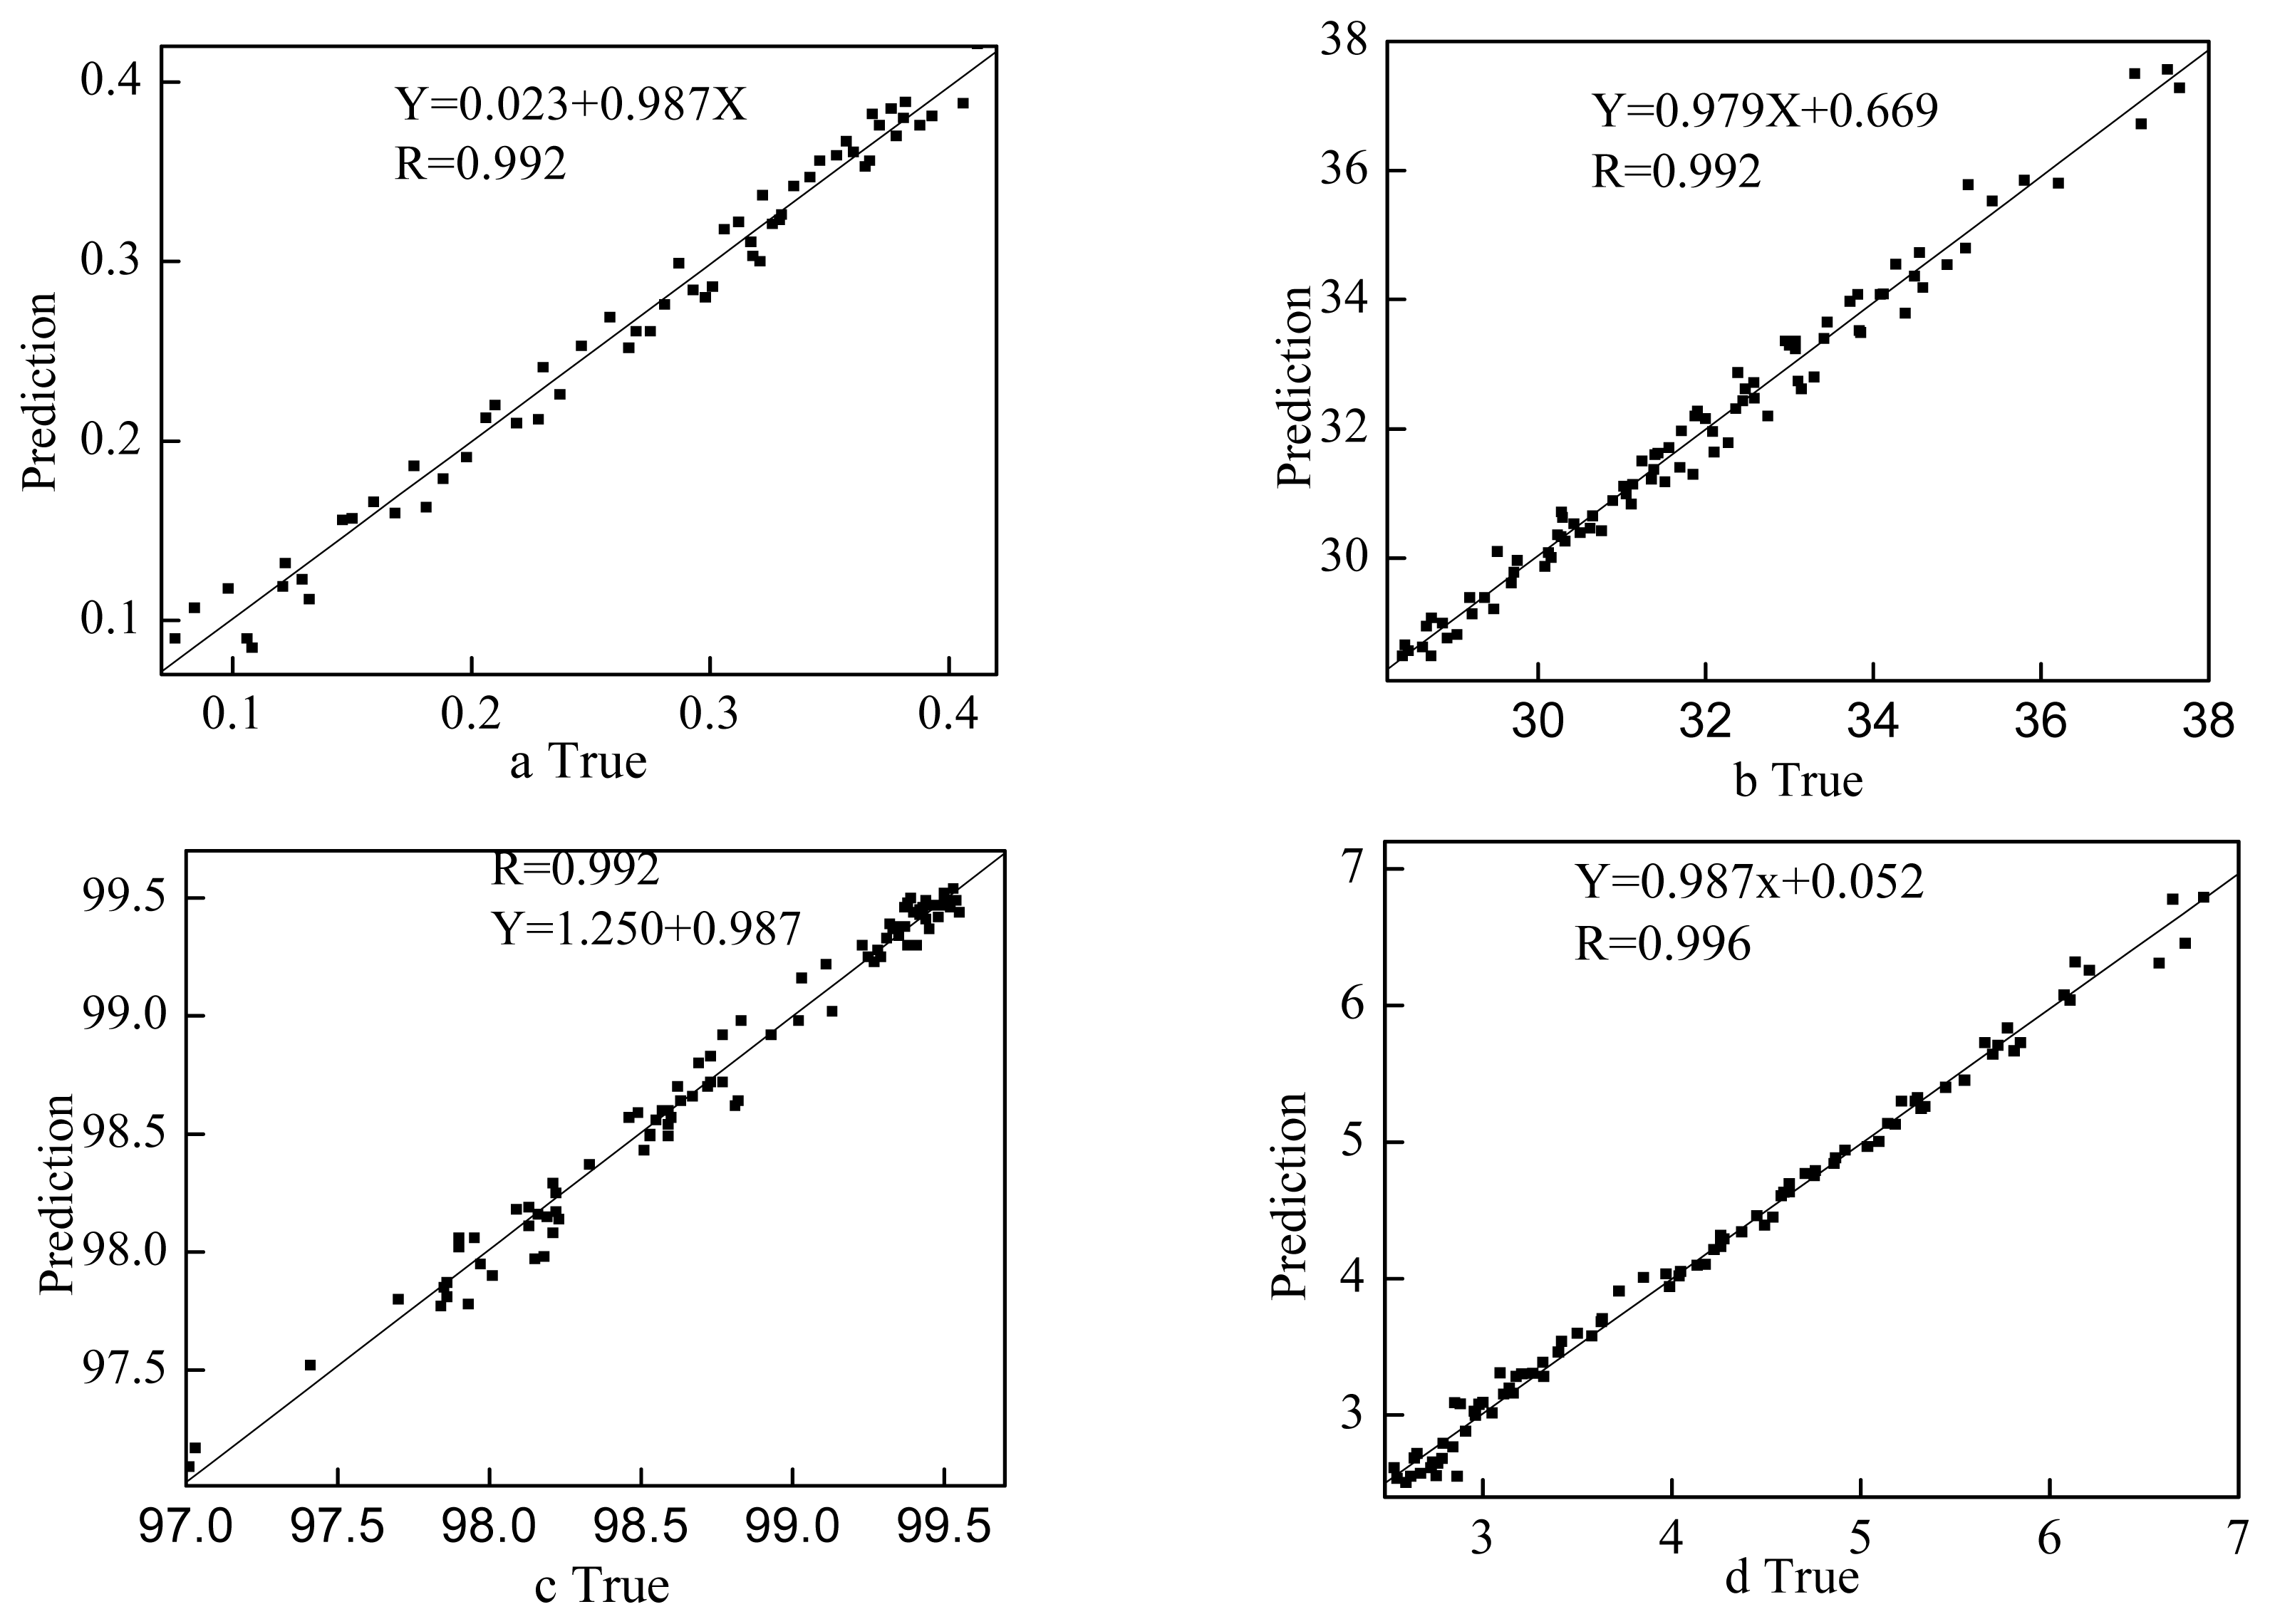
2.2 Quantitative analysis models
2.2.1 Sizing content model
2.2.2 Model of volatiles content, soluble resin content and resin content
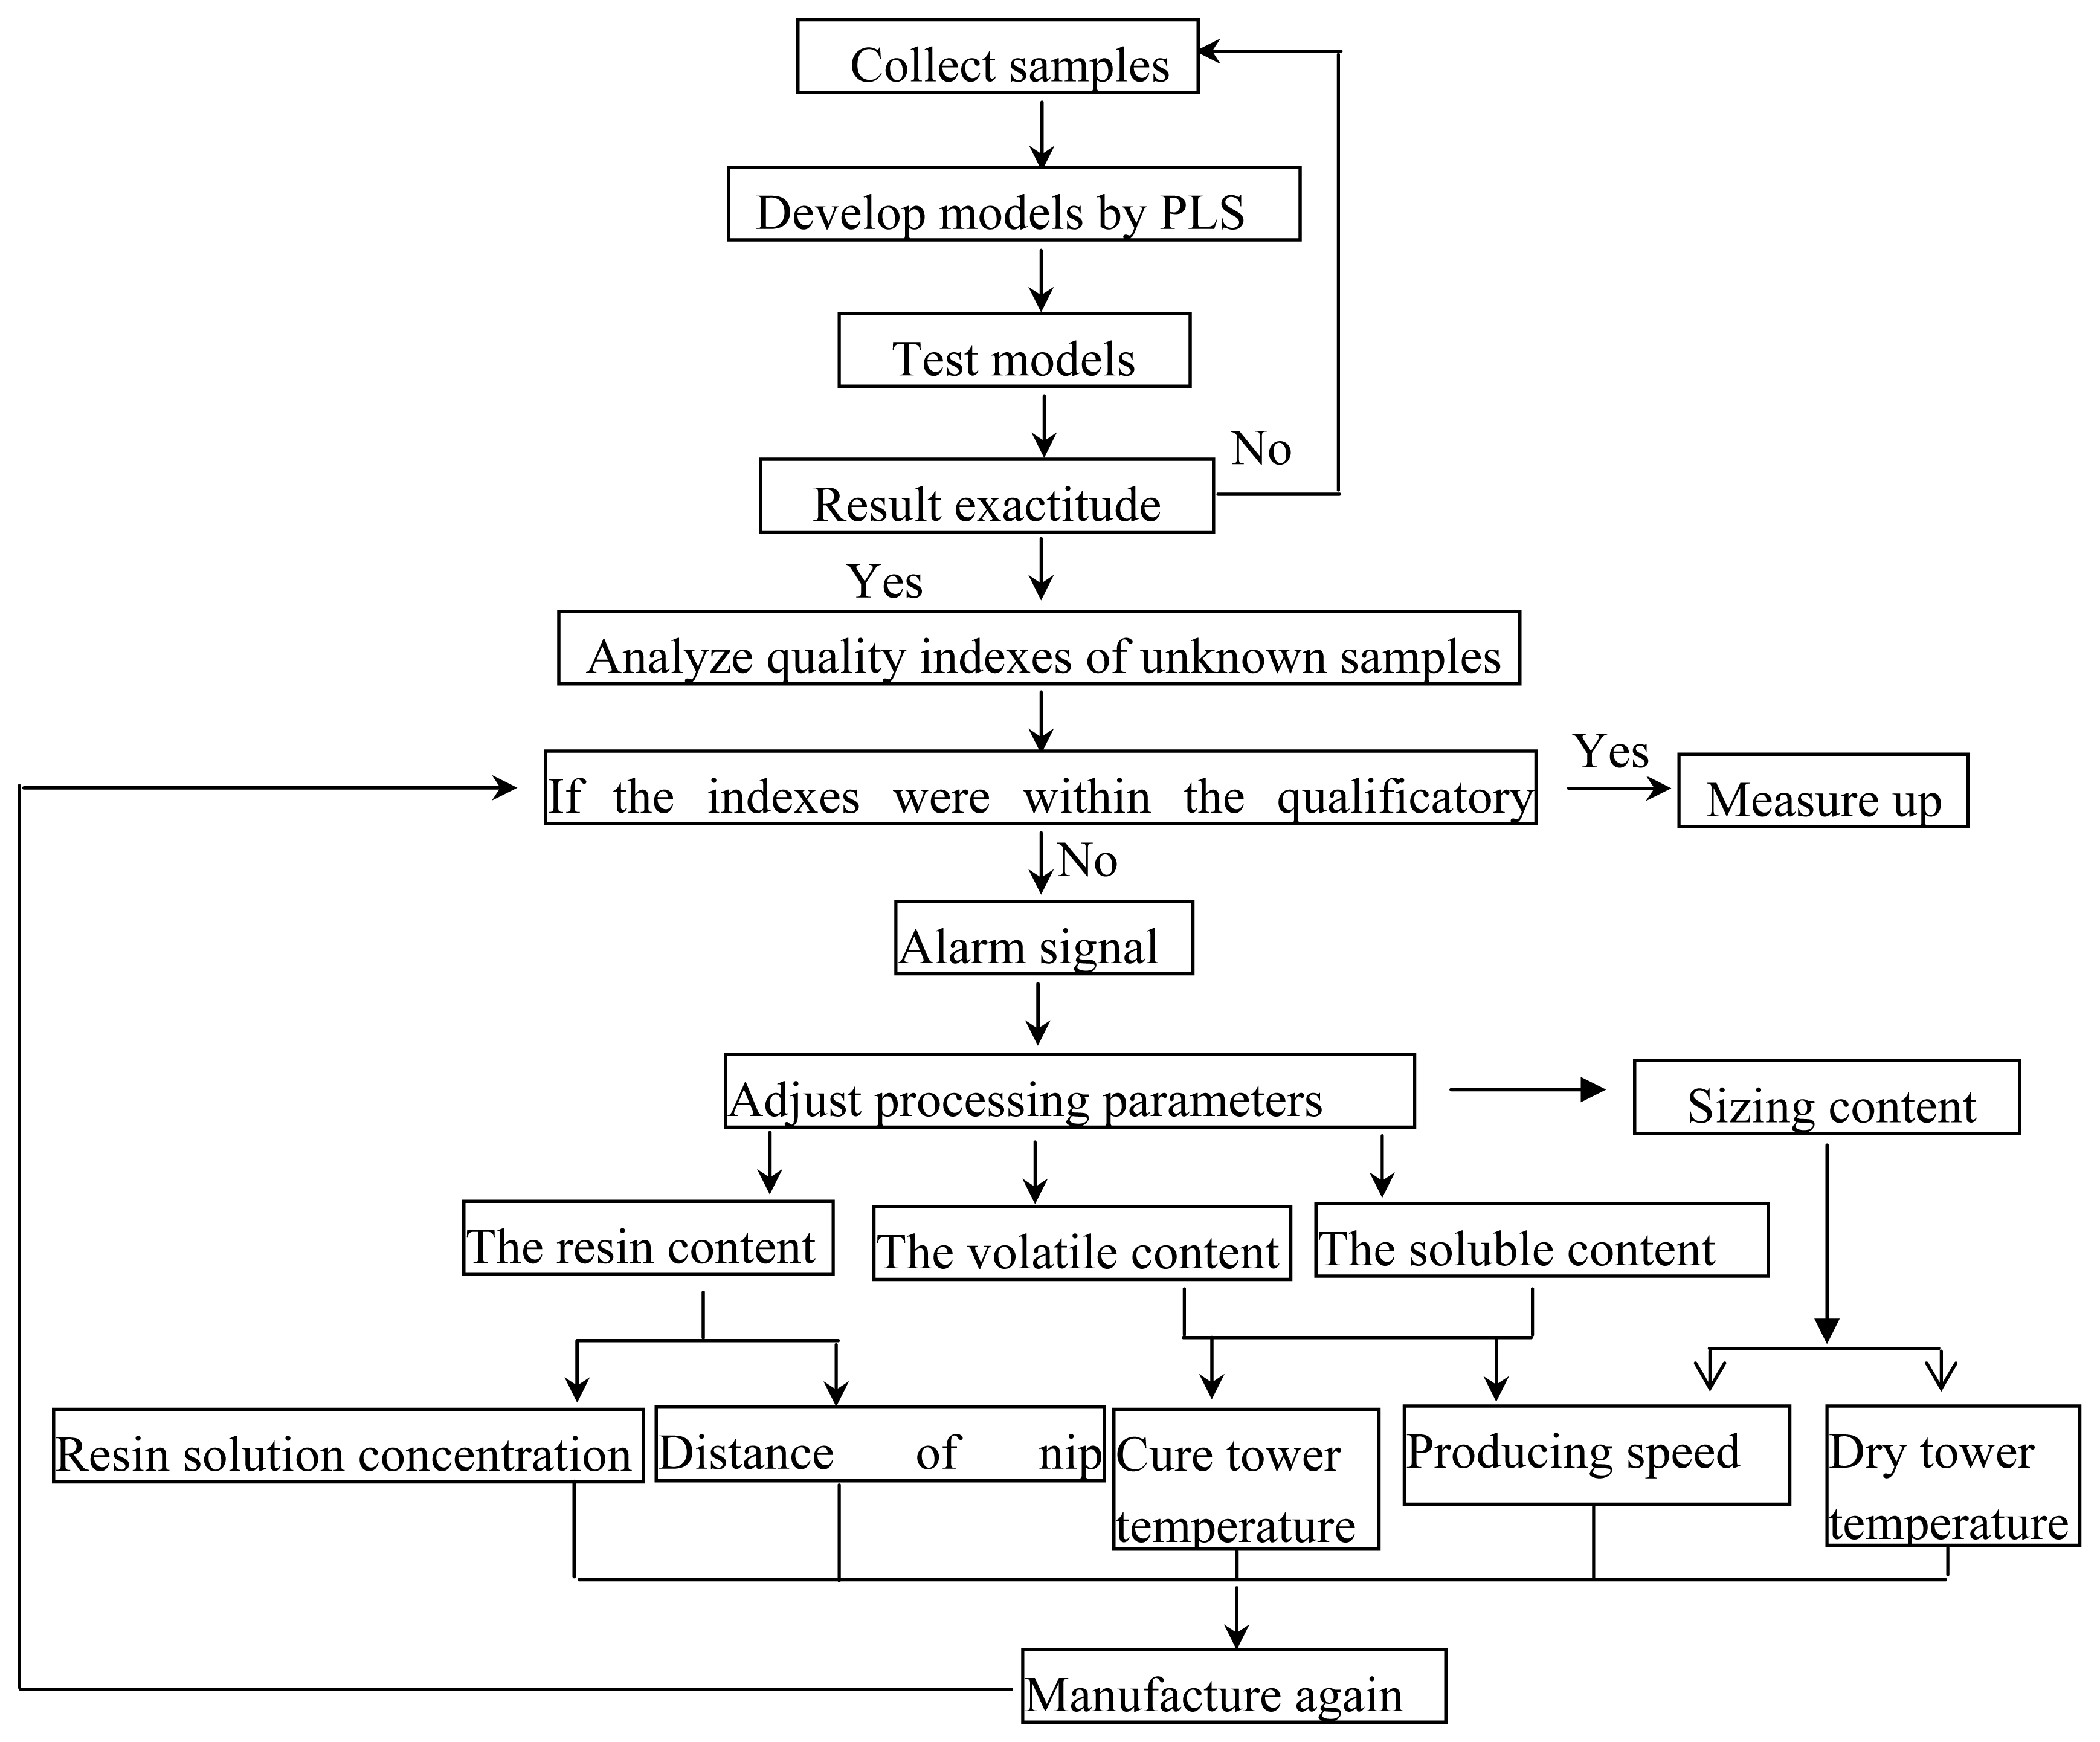
2.3 On-line quality monitoring
Conclusions
3. Experimental Section
3.1 Materials
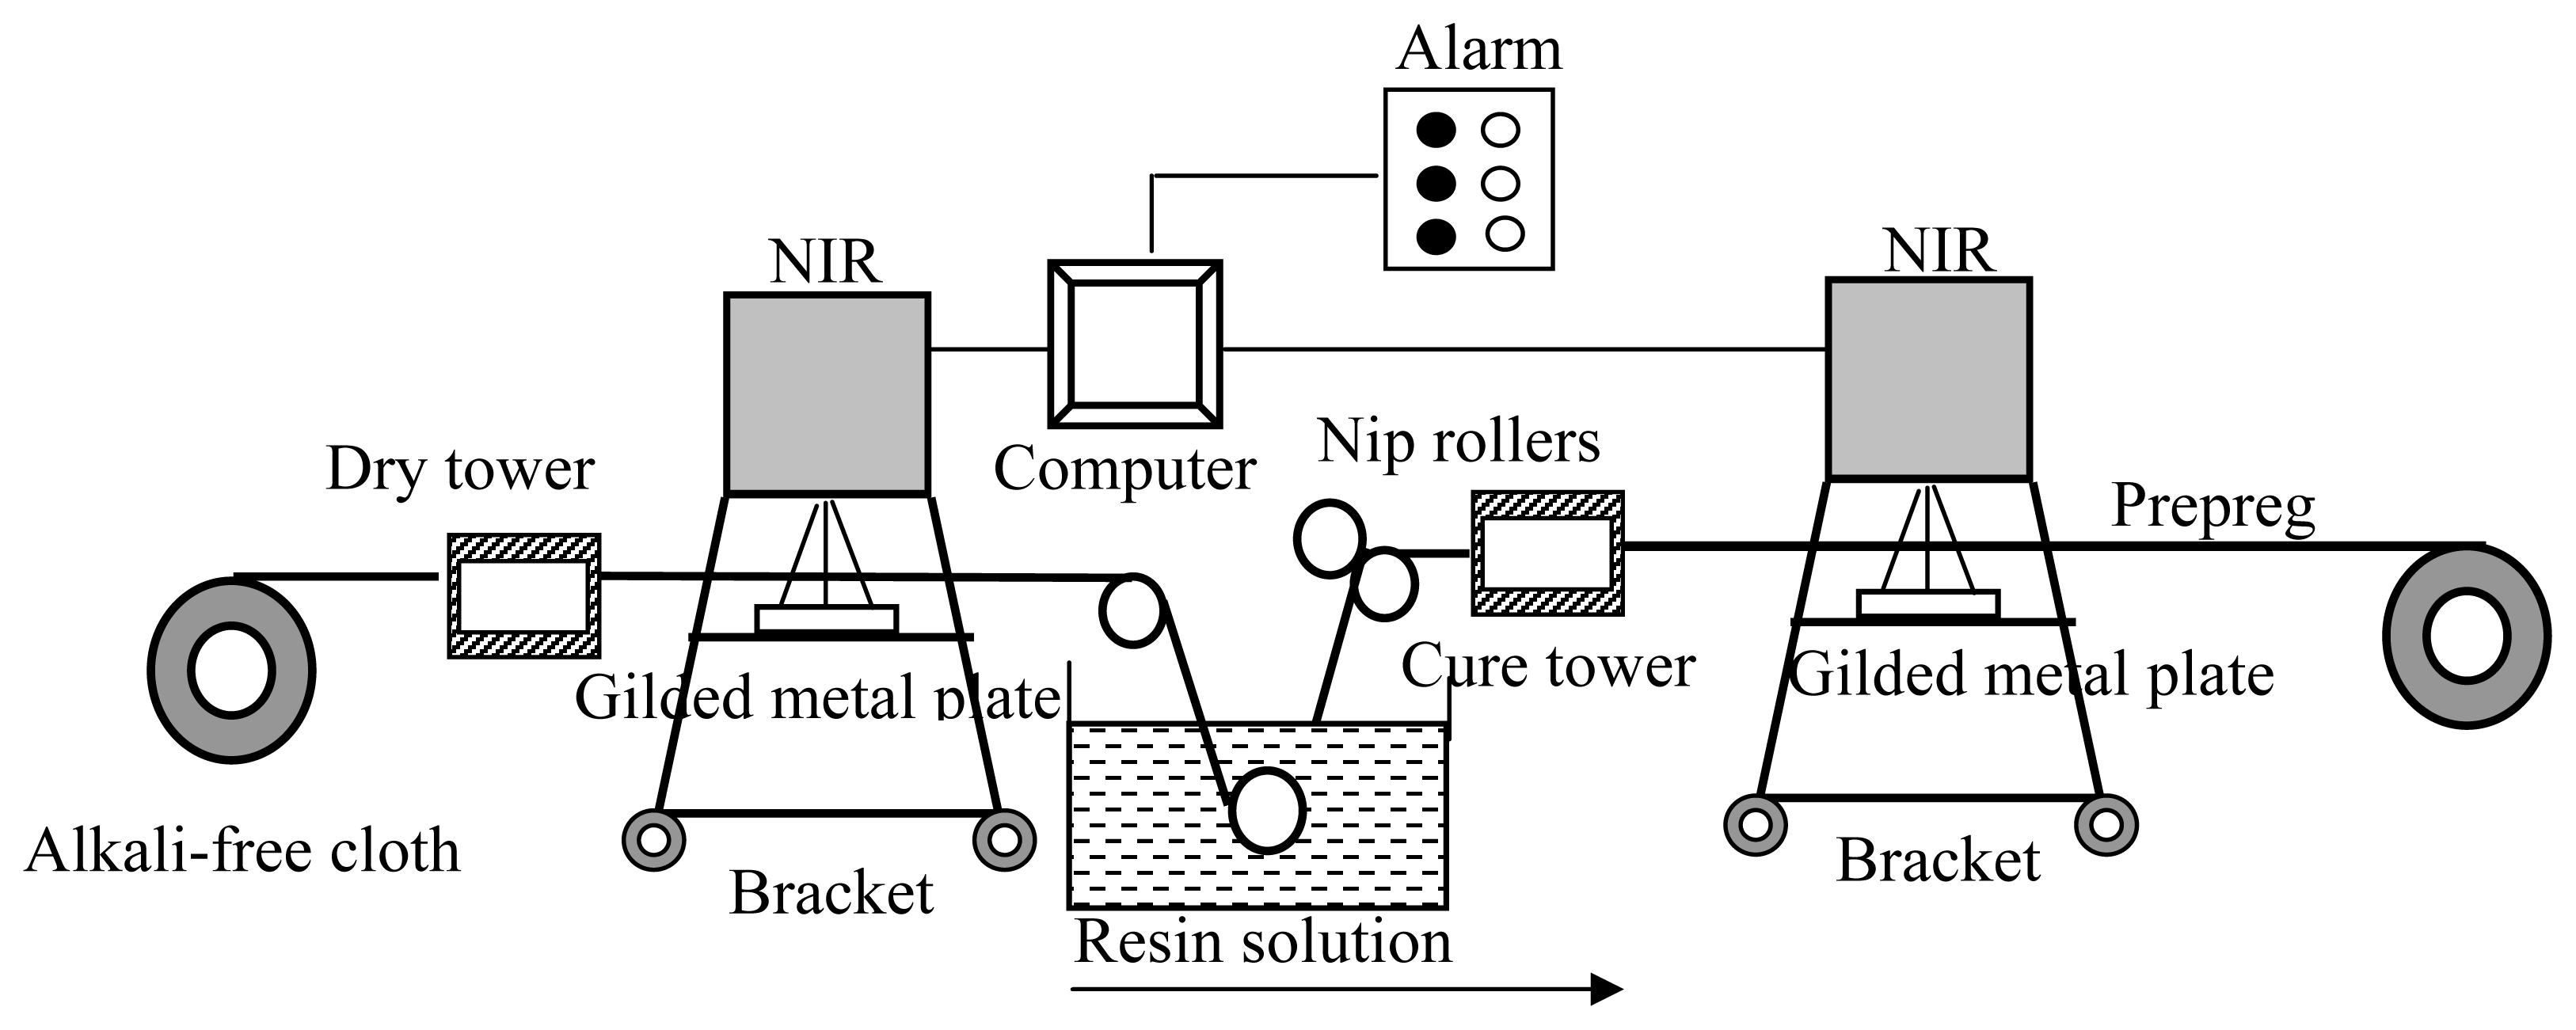
3.2 The design of on-line analysis system
3.3 Manufacture of prepreg cloth and analysis of NIR spectral data
3.4 Chemical analysis
3.5 Statistical analysis


| Calibration (N = 90) | Prediction(N = 27) | |||||||
|---|---|---|---|---|---|---|---|---|
| Quality indexes | Max | Min | Mean | SD | Max | Min | Mean | SD |
| Volatile content (%) | 6.81 | 2.51 | 4.16 | 1.21 | 6.65 | 2.51 | 4.37 | 1.24 |
| Resin content (%) | 37.65 | 28.38 | 31.96 | 2.27 | 37.12 | 28.38 | 32.04 | 2.12 |
| Soluble resin content (%) | 99.55 | 97.01 | 98.75 | 0.64 | 99.54 | 97.01 | 98.93 | 0.66 |
| Calibration (N = 60) | Prediction(N = 20) | |||||||
|---|---|---|---|---|---|---|---|---|
| Quality indexes | Max | Min | Mean | SD | Max | Min | Mean | SD |
| Sizing content (%) | 0.41 | 0.076 | 0.267 | 0.097 | 0.40 | 0.085 | 0.29 | 0.091 |
| Model | Pre-processing routine | R2 | RMSECV | RMSEP | Number of factors |
|---|---|---|---|---|---|
| Sizing | 1stDER (smoothing points:17) (7501–6098 and 5453–4246) cm−1 | 93.16 | 0.608 | 0.732 | 5 |
| Model | Pre-processing routine | R2 | RMSECV | RMSEP | Number of factors |
|---|---|---|---|---|---|
| Volatile | 1stDER +VN (smoothing points:17) (7501–6098 and 5453–4246) cm−1 | 98.59 | 0.131 | 0.171 | 3 |
| Resin | VN (7501–6098 and 4600–4246) cm−1 | 93.59 | 0.56 | 0.65 | 6 |
| Soluble | 1stDER +MSC (smoothing points:17) (7501–5450 and 4600–4246) cm−1 | 98.41 | 0.085 | 0.149 | 9 |
| Quality indexes | true | Prediction | SD |
|---|---|---|---|
| Volatile content (%) | 3.12 | 3.05 | 0.023 |
| Resin content (%) | 31.26 | 31.57 | 0.065 |
| Soluble resin content | 99.31 | 99.19 | 0.039 |
| Sizing content (%) | 0.35 | 0.39 | 0.086 |
| N = 27 | N = 20 | |||
|---|---|---|---|---|
| Resin content | Volatile content | Soluble resin content | Sizing content | |
| SD (%) | 0.393 | 0.111 | 0.153 | 0.012 |
| t experiment | 1.058 | 1.685 | 0.407 | 0.372 |
| t critical | 2.056 | 2.093 | ||
Acknowledgements
References and Notes
- Banks, R.; Mouritz, A.P.; John, S.; Coman, F.; Paton, R. Development of a new structural prepreg: characterization of handling, drape and tack properties. Compos. Struct 2004, 66, 169– 174. [Google Scholar]
- Mariatti, M.; Nasir, M.; Ismail, H. Effect of sample cutting direction on mechanical properties of woven thermoplastic prepreg. Polym. Test 2000, 19, 617–624. [Google Scholar]
- Hyoung, G.K.; Dai, G.L. Dielectric cure monitoring for glass/polyester prepreg composites of handling. drape and tack properties. Compos. Struct 2002, 57, 91–99. [Google Scholar]
- Hayes, B.S; Gilbert, E.N.; Seferis, J.C. Scaling complications of dual temperature cure resin prepreg systems in airplane part manufacture. Composites: Part A 2000, 31, 717–725. [Google Scholar]
- Teagle, P.R. The quality control and non-destructive evaluation of composite aerospace components. Composites 1983, 14, 115–128. [Google Scholar]
- Molyneux, M. Prepreg tape and fabric technology for advanced composites. Composites 1983, 14, 87–91. [Google Scholar]
- Huang, Y.D.; Liu, L.; Zhang, Z.Q.; Wang, Y. On-line monitoring of resin content for film impregnation process. Comp. Sci. Tech 1998, 58, 1531–1534. [Google Scholar]
- Huang, Y.D.; Liu, L.; Sun, Y.F.; Qiu, J.H.; Nakayama, N.; Kumazawa, T. Continouous monitoring of resin content in prepreg unidirectional tapes by beta-ray method. Adv. Comp. Letters 2002, 11, 28–32. [Google Scholar]
- Broughton, W.R.; Chester, R.J. The development of a portable ultrasonic facility for NDT of graphite/epoxy composites. Non-Destructive. Test 1986, 32(2), 38–40. [Google Scholar]
- Anderson, M.J.; Faull, J.A.; Menson, S.M. Evaluation of electrostatic air coupled ultrasonic technology for measuring changes in resin content in carbon prepreg tow materials. J. Adv. Mater. 1997, 28, 2–7. [Google Scholar]
- Miralbes, C. Quality control in the milling industry using near infrared transmittance spectroscopy. Food. Chem 2004, 88, 621–628. [Google Scholar]
- Dessipri, E.; Minopoulou, E.; Chryssikos, G.D.; Gionis, V.; Paipetis, A.; Panayiotou, C. Use of FT-NIR spectroscopy for on-line monitoring of formaldehyde-based resin synthesis. Eur. Polym. J 2003, 39, 1533–1540. [Google Scholar]
- Rohe, T.; Becker, W. Near infrared (NIR) spectroscopy for in-line monitoring of polymer extrusion processes. Talanta 1999, 50, 283–290. [Google Scholar]
- Marengoa, E.; Bobbaa, M.; Robotti, E. Hydroxyl and acid number prediction in polyester resins by near infrared spectroscopy and artificial neural networks. Anal Chim Acta 2004, 511, 313–322. [Google Scholar]
- Escola, M.A.; Moina, C.A. The determination of the degree of cure in epoxy paints by infrared spectroscopy. Polym. Test 2005, 24, 572–575. [Google Scholar]
- Garrido, M.; Lázaro, I.; Larrechi, M.S. Multivariate resolution of rank-deficient near-infrared spectroscopy data from the reaction of curing epoxy resins using the rank augmentation strategy and multivariate curve resolution alternating least squares approach. Anal. Chim. Acta 2004, 515, 65–73. [Google Scholar]
- Curda, L.; Kukackova, O. NIR spectroscopy: a useful tool for rapid monitoring of processed cheeses manufacture. J. Food. Eng 2004, 61, 557–560. [Google Scholar]
- Li, W.; Huang, Y.D.; Liu, L. The application of near infrared spectroscopy in the quality control analysis of glass/phenolic resin prepreg. J. Mater. Sci 2006, 41, 7183–7189. [Google Scholar]
- Li, W.; Huang, Y.D.; Liu, L. On-line monitoring of resin content and volatile content in carbon/phenolic resin prepreg cloth by near-infrared spectroscopy. Polym. Polym. Comp 2006, 14, 537–543. [Google Scholar]
© 2007 by MDPI Reproduction is permitted for noncommercial purposes.
Share and Cite
Jiang, B.; Huang, Y.D. Near Infrared Spectroscopy for On-line Monitoring of Alkali- Free Cloth /Phenolic Resin Prepreg During Manufacture. Int. J. Mol. Sci. 2007, 8, 541-552. https://doi.org/10.3390/i8060541
Jiang B, Huang YD. Near Infrared Spectroscopy for On-line Monitoring of Alkali- Free Cloth /Phenolic Resin Prepreg During Manufacture. International Journal of Molecular Sciences. 2007; 8(6):541-552. https://doi.org/10.3390/i8060541
Chicago/Turabian StyleJiang, Bo, and Yu Dong Huang. 2007. "Near Infrared Spectroscopy for On-line Monitoring of Alkali- Free Cloth /Phenolic Resin Prepreg During Manufacture" International Journal of Molecular Sciences 8, no. 6: 541-552. https://doi.org/10.3390/i8060541
APA StyleJiang, B., & Huang, Y. D. (2007). Near Infrared Spectroscopy for On-line Monitoring of Alkali- Free Cloth /Phenolic Resin Prepreg During Manufacture. International Journal of Molecular Sciences, 8(6), 541-552. https://doi.org/10.3390/i8060541