3.1. GA-PLS
In PLS analysis, the descriptors data matrix is decomposed to orthogonal matrices with an inner relationship between the dependent and independent variables. Therefore, unlike MLR analysis, the multicolinearity problem in the descriptors is omitted by PLS analysis. Because a minimal number of latent variables are used for modeling in PLS; this modeling method coincides with noisy data better than MLR. In order to find the more convenient set of descriptors in PLS modeling, genetic algorithm was used. To do so, many different GA-PLS runs were conducted using different initial set of populations. The data set (compounds tested against
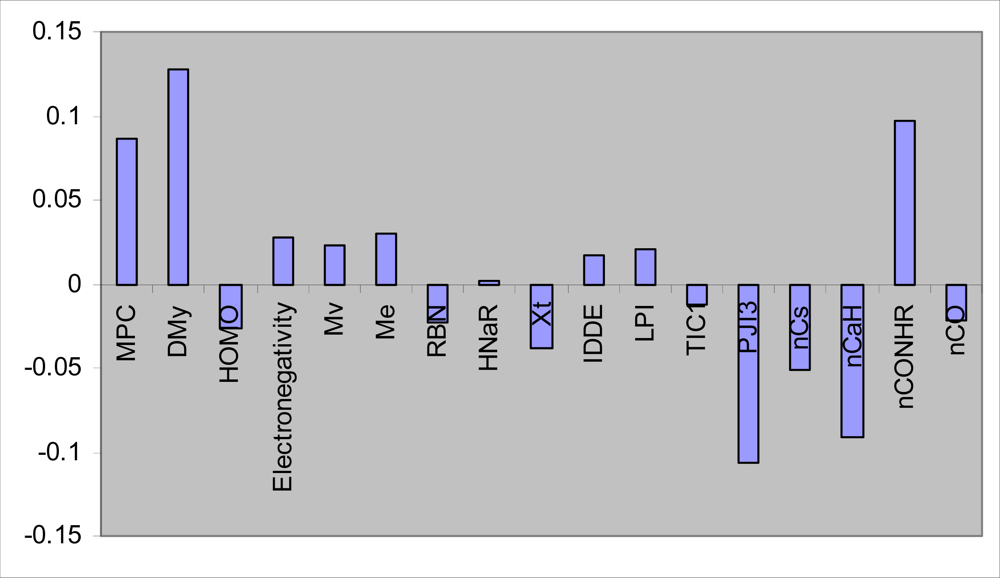
S. aureus, n = 31) was divided into two groups: calibration set (n = 25) and prediction set (n = 6). Given 25 calibration samples; the leave-one-out cross-validation procedure was used to find the optimum number of latent variables for each PLS model. The most convenient GA-PLS model that resulted in the best fitness contained 17 indices, 5 of them being those obtained by MLR. The PLS estimate of coefficients for these descriptors are given in
Figure 1.
As it is observed, a combination of quantum, topological, geometrical, constitutional, and functional group descriptors have been selected by GA-PLS to account the antimicrobial activity of the studied compounds. The majority of these descriptors are topological indices. The resulted GA-PLS model possessed very high statistical quality R
2 = 0.96 and Q
2 = 0.91. The values of pMIC using PLS model (refined from cross-validation or external prediction set) along with the corresponding relative errors of prediction (REP) are shown in
Table 3. Very small values of relative errors confirm the accuracy of the proposed GA-PLS model for modeling antimicrobial activity of the studied compounds.
The data set (compounds tested against
C. albicans, n = 28) was again divided into two groups: calibration set (n = 23) and prediction set (n = 5). Given 23 calibration samples; the leave-one-out cross-validation procedure was used to find the optimum number of latent variables for each PLS model. Here, the most convenient GA-PLS model contained 15 indices, five of them being those obtained by MLR. The PLS estimate of coefficients for these descriptors are given in
Figure 2. As it is observed, a combination of quantum, topological, geometrical and functional group descriptors have been selected by GA-PLS to account the antimicrobial activity of the compounds. The majority of these descriptors are topological indices again. The resulted GA-PLS model possessed very high statistical quality R
2 = 0.91 and Q
2 = 0.87. The values of pMIC using PLS model along with the corresponding REPs are shown in
Table 4. Very small values of relative errors confirm the accuracy of the proposed GA-PLS model for modeling antimicrobial activity of the studied compounds.
3.2. FA-MLR and PCRA
Table 5 shows the five factor loadings of the variables (after VARIMAX rotation) for the compounds tested against
S. aureus. As it is observed, about 79% of variances in the original data matrix could be explained by selected four factors.
Based on the procedure explained in the experimental section, the following three-parametric equation was derived.
Equation 1 could explain 73% of the variance and predict 68% of the variance in pMIC data. This equation describes the effect of geometrical (PJI3), functional group (nCONHR) and quantum (DMy) indices on antimicrobial activity.
When factor scores were used as the predictor parameters in a multiple regression equation using forward selection method (PCRA), the following equation was obtained:
Equation 2 also shows high equation statistics (81% explained variance and 79% predict variance in pMIC data). Since factor scores are used instead of selected descriptors, and any factor-score contains information from different descriptors, loss of information is thus avoided and the quality of PCRA equation is better than those derived from FA-MLR.
As it is observed from
Table 5, in the case of each factor, the loading values for some descriptors are much higher than those of the others. These high values for each factor indicate that this factor contains higher information about which descriptors. It should be noted that all factors have information from all descriptors but the contribution of descriptor in different factors are not equal. For example, factors 1 and 2 have higher loadings for topological, constitutional and functional group indices, whereas information about quantum and functional group descriptors is highly incorporated in factors 3 and 4. Therefore, from the factor scores used by equation E
2, significance of the original variables for modeling the activity can be obtained. Factor score 1 indicates importance of Mv, HNar, nCaH and IDDE (topological, constitutional and functional group descriptors, respectively). Factor score 2 indicates importance of RBN and Me (constitutional descriptors), Factor score 3 and 4 signify the importance of DMy, and nCONHR (quantum and functional group descriptors, respectively).
Table 6 shows the five factor loadings of the variables (after VARIMAX rotation) for the compounds tested against
C. albicans. As it is observed, about 80% of variances in the original data matrix could be explained by selected five factors.
Based on the procedure explained in the experimental section, the following four-parametric equation was derived.
Equation 3 could explain and predict 85% and 81% of the variance in pMIC data, respectively. This equation describes the effect of topological (piID and PW3), functional group (nCp) and geometrical (ASP) indices on the antimicrobial activity.
When factor scores were used as the predictor parameters in a multiple regression equation using forward selection method (PCRA), the following equation was obtained:
Equation 4 shows also high equation statistics (88% explained variance and 83% predicted variance in pMIC data). It should be noted that the variables (factor scores) used in Equation 4 are perfectly orthogonal to each other. Since factor scores are used instead of selected descriptors, and any factor-score contains information from different descriptors, loss of information is thus avoided and the quality of PCRA equation is better than those derived from FA-MLR.
As it is observed from
Table 6, in the case of each factor, the loading values for some descriptors are much higher than those of the others. Factors 1 and 2 have higher loadings for topological, quantum and functional group indices, whereas information about geometrical, quantum and topological descriptors is highly incorporated in factors 3, 4 and 5. Therefore, from the factor scores used by equation E
4, significance of the original variables for modeling the activity can be obtained. Factor score 1 indicates importance of PW5, piID and electronegativity (topological and quantum descriptors). Factor score 2 indicates importance of HOMO nCp and nNR
2 (quantum and functional group descriptor). Factor score 3 signifies the importance of ASP and L/Bw (geometrical descriptors) and factor score 4 and 5 signify the importance of quantum and topological descriptors (DMz and PW3).
Comparison between the results obtained by GA-PLS and the other employed regression methods indicates higher accuracy of this method in describing antimicrobial activity of the studied compounds.
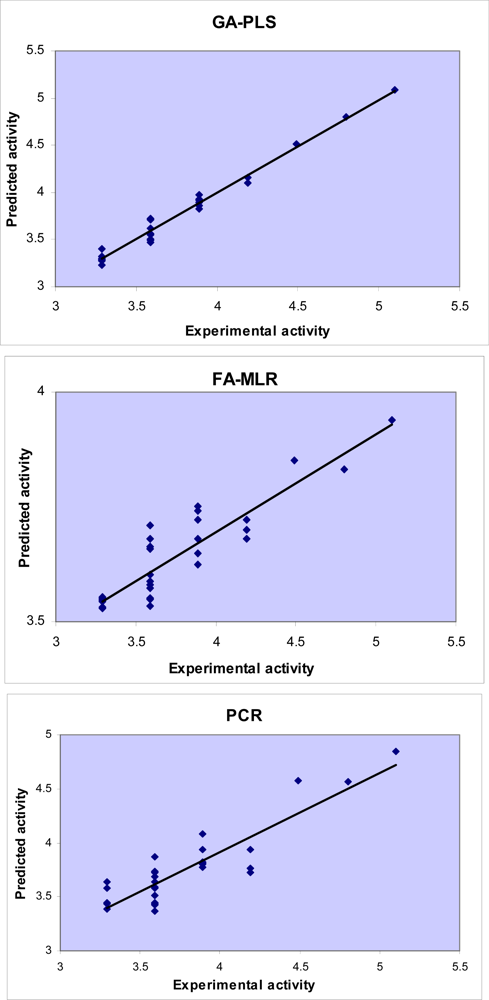
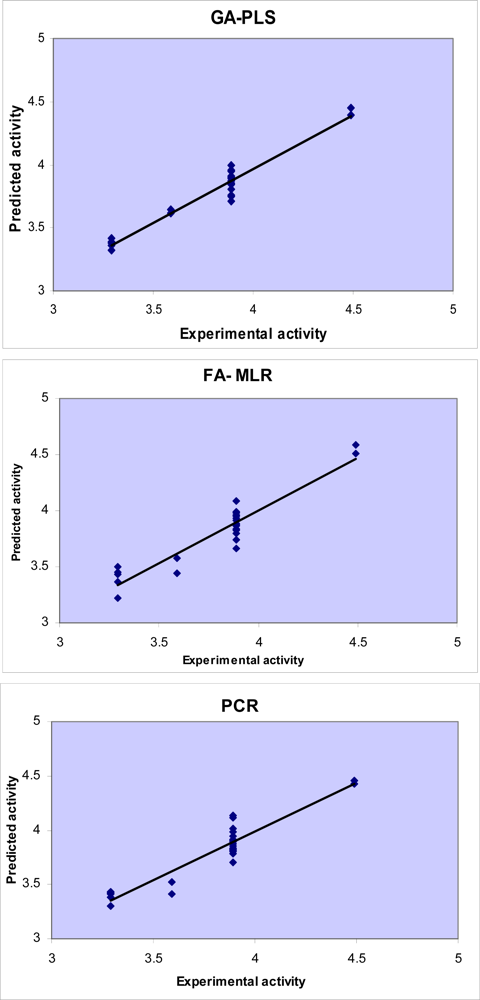
Difference in accuracy of the different regression methods used in this study is visualized in
Figures 3 and
4 by plotting the predicted activity (by cross-validation) against the experimental values. Obviously, all linear models represented scattering of data around a straight line with slope and intercept close to one and zero, respectively. As it is observed, the plot of data resulted by GA-PLS represents the lowest scattering and that obtained by FA-MLR and PCR analysis have lower accuracy. It should be mentioned that the model which GA-PLS method provides is better than that MLR analysis provided in our previous study [
25]. In fact, MLR analysis could explain and predict 55% and 35% of variances in the pMIC data (compounds tested against
S. aureus) and predict 82% and 73% of variances in the pMIC data (compounds tested against
C. albicans).


