1. Introduction
Hydrogen peroxide (H
2O
2) has many applications [
1,
2,
3,
4], including as a bleaching agent for everything from teeth to wood pulp, for the treatment of wastewater and effluent, encouraging the root growth of rice seedlings, and as a disinfectant in the food and pharmaceuticals industry. To measure the H
2O
2 concentration, several methods [
5,
6,
7,
8,
9,
10,
11] including optical interferometry, spectrophotometric, fluorimetric, and chemiluminescence methods have been proposed. Chiu
et al. [
5] and Chen
et al. [
6] demonstrated the use of a heterodyne interferometer to measure various concentrations of solution with high sensitivity (3 × 10
−5 RIU) and resolution (0.06%) within a wide measurement range of solution concentrations. However, their method could not determine the concentration of specific chemical components within a complicated mixture. Chen
et al. [
7] fabricated a H
2O
2 sensor with entrapped horseradish peroxidase by using mesoporous silica deposited on a polyaniline modified platinum electrode. Their results showed a good linearity of response between the cathode and H
2O
2 concentration within the range of 0.02 to 18.5 mM. In addition, their proposed sensor preserved 80% of the enzymatic activity after 16 days. Tanner
et al. [
8] proposed a novel OPDV UV absorption method for measuring the H
2O
2 concentration in rainwater. The major advantages of the OPDV method are the high stability of the reagent and low interference effects between the reagent and the inorganic constituents in the rainwater. They obtained a detection limit of 5.8 nmol for 20 cm
3 rainwater. Vieira and Fatibello-Filho [
9] developed an enzymatic source of peroxidase by extraction from zucchini. In the guaiacol, H
2O
2, and peroxidase reaction, strong absorbance could be measured at 470 nm by a spectrophotometric flow system. They evaluated the concentration of guaiacol obtained with their proposed method and showed a low detection limit of 2.1 × 10
−6 mol/L at a guaiacol concentration of 0.05 mol/L. El-Essi
et al. [
10] developed an H
2O
2 sensor that used the sol-gel method for determining the H
2O
2 concentration. They monitored the absorbance of oxidized variamine blue at a wavelength of 550 nm and evaluated the performance of the proposed sensor under various conditions of pH, concentration, temperature and stability of variamine blue. Onoda
et al. [
11] developed a phosphine-based fluorescent reagent to determine the H
2O
2 concentration with fluorometric analysis. Their method provided a rapid derivatization reaction within 2 min at room temperature. Rapoport
et al. [
12] used a special assay that included superoxide dismutase, catalase, and methanol in the tested reaction system where the H
2O
2 concentration can be obtained by analyzing the fluorescence signal. Feng
et al. [
13] reported on a KMnO4-OP chemiluminescence method. They demonstrated the influence of the acid selection, potassium permanganate concentration, and sensitizer selection on the proposed method. Regardless of the type of measurement technique applied, all these proposed methods employ a complex chemical reaction to form an indicator, which produces absorbance variations, or fluorescent emissions, or acts as an illuminator. Analysis of the variations in the absorbance, fluorescence intensity, or illumination at a specific wavelength is needed to obtain the H
2O
2 concentration. Furthermore, none of these methods can be used to provide a reusable H
2O
2 sensor, the consequence of which is the consumption of vast quantities of reacted chemicals for measuring the H
2O
2 concentration. The comparisons of the proposed methods are summarized in
Table 1.
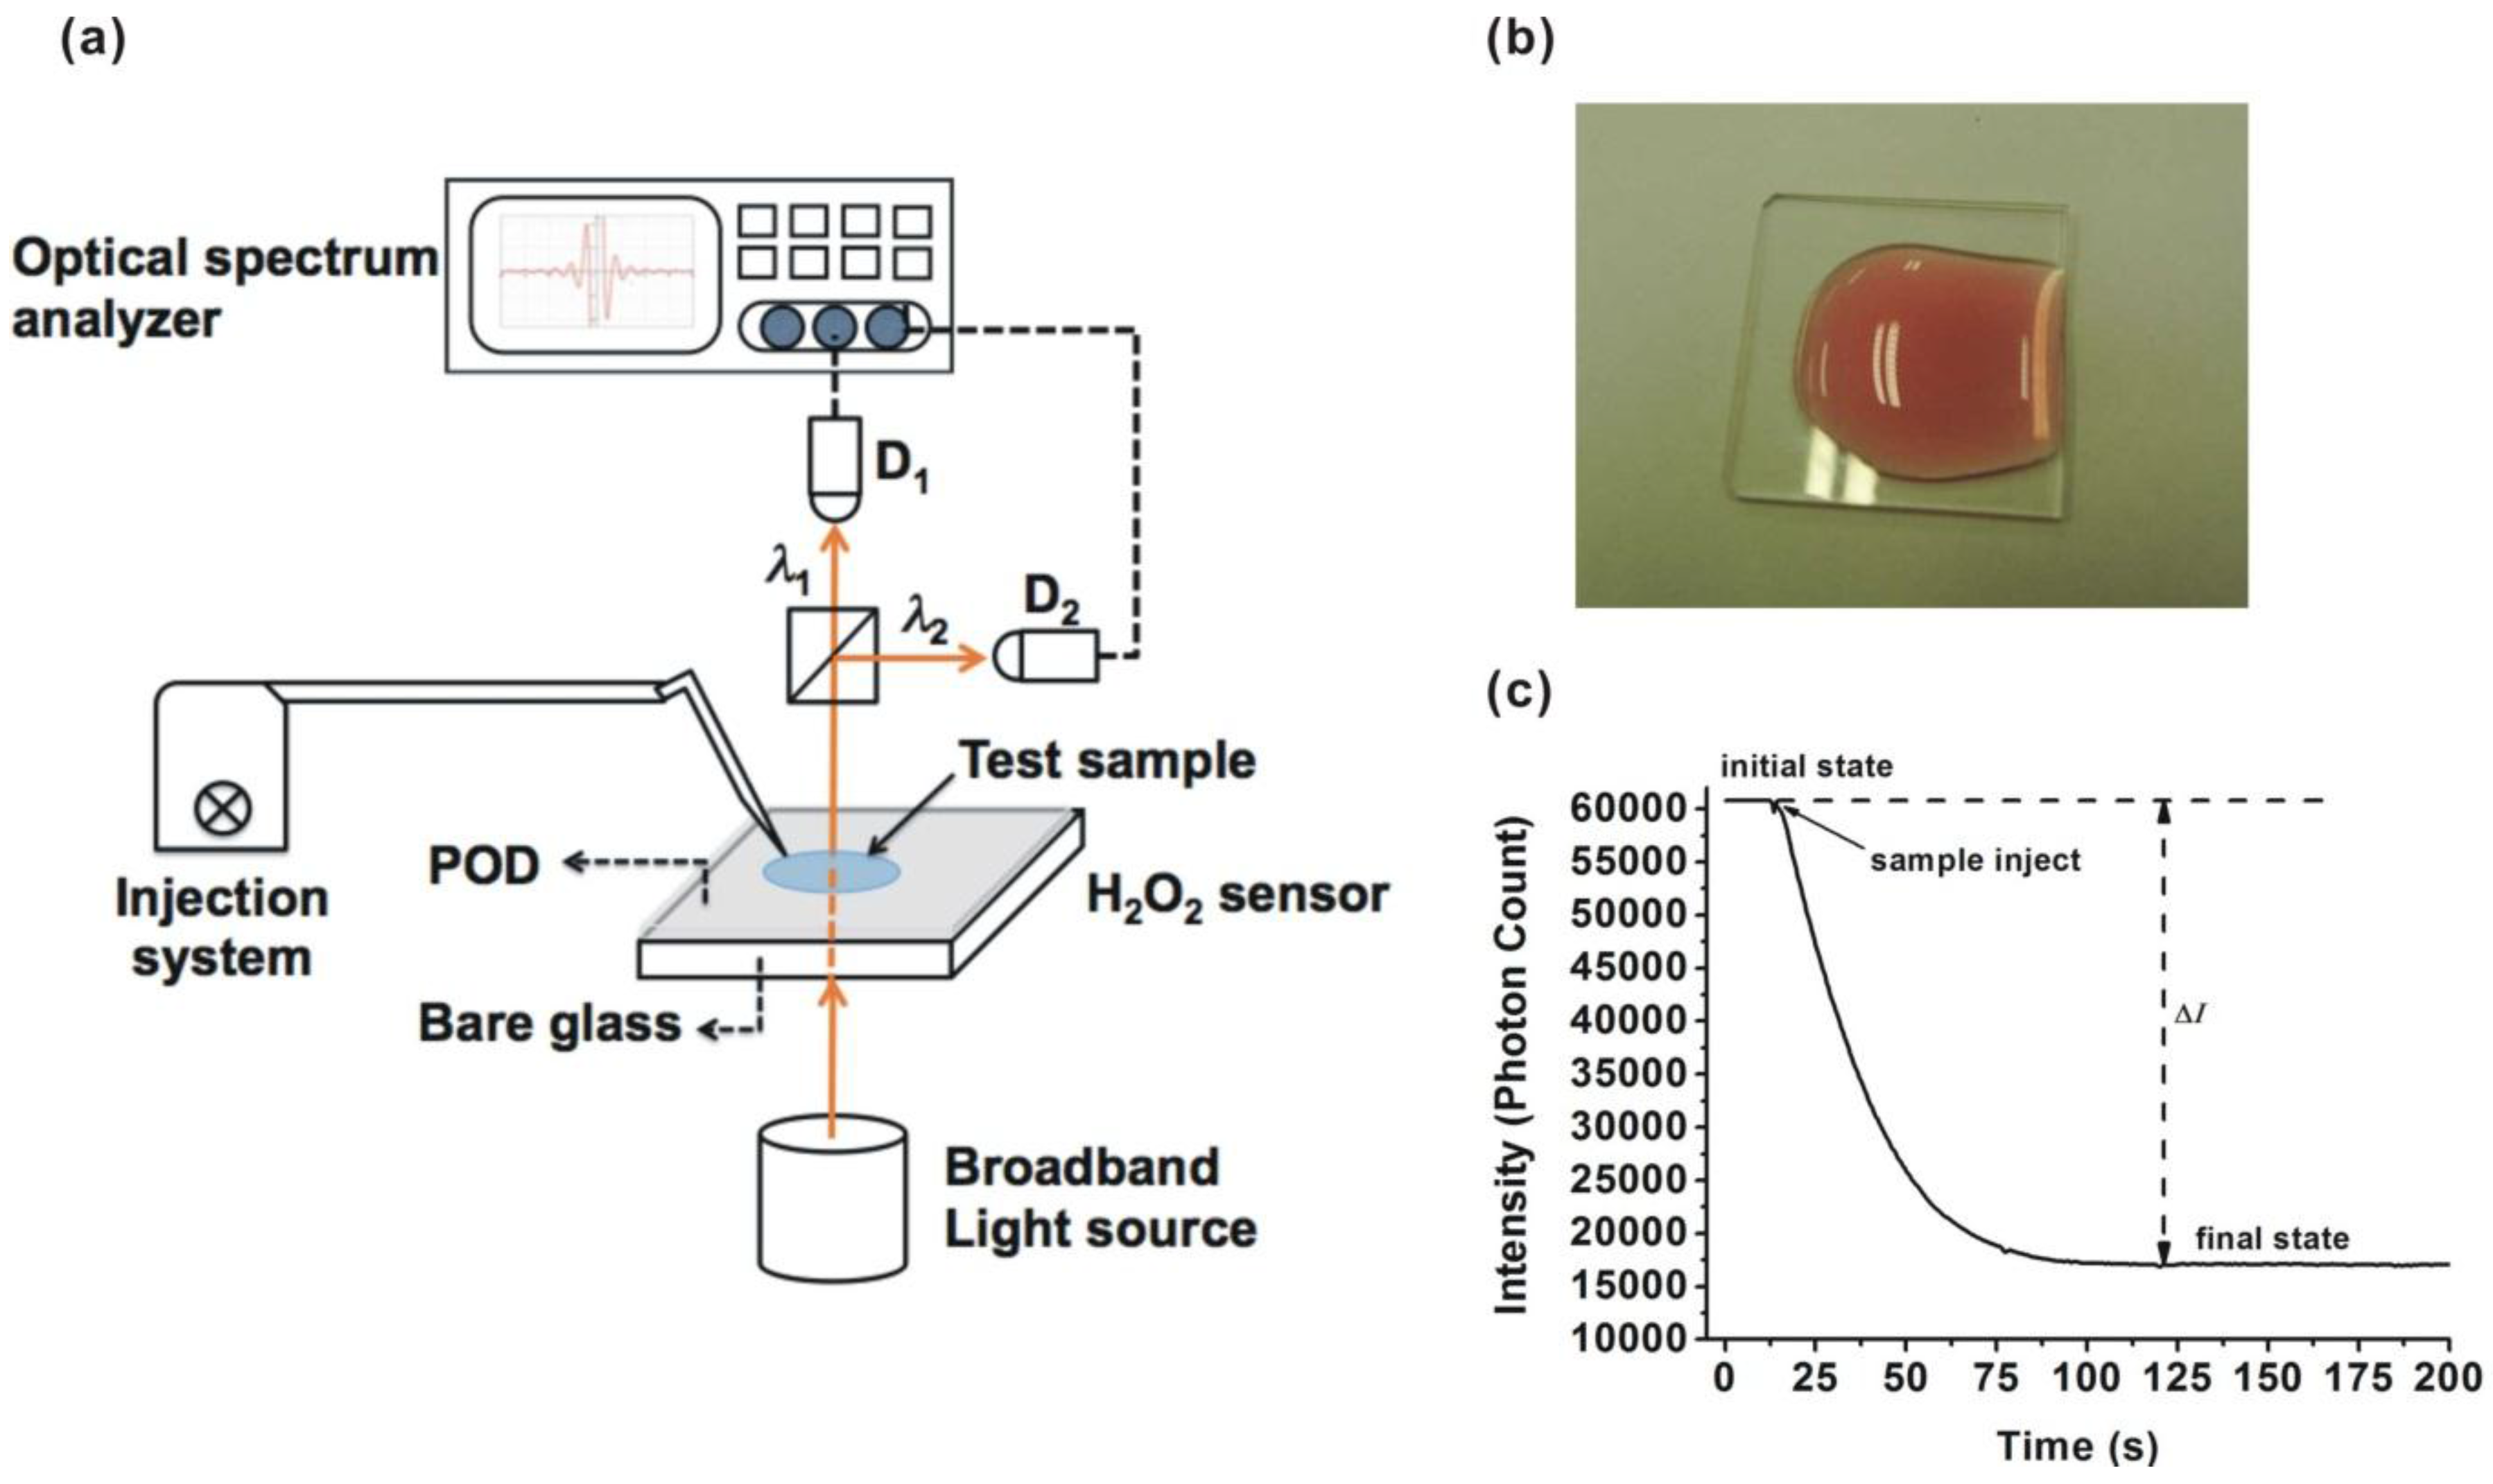
To reduce the cost of the reacted chemicals, we fabricated an enzymatic H2O2 sensor by immobilizing peroxidase enzyme (POD) on a glass substrate with various POD concentrations. The fabrication procedure for production of the proposed sensor is simple and reproducible. Based on the chemical reaction of the proposed method, the primary absorption peak is at 510 nm. The transmission intensity at a wavelength of 510 nm is strongly related to the H2O2 concentration so can be used for quantitative analysis. The results show high linearity within a range of H2O2 concentrations from 5 × 10⁻⁵% to 1 × 10⁻³%. The sensitivity and resolution can be as high as 41,400 (photon count/%) and 3.49 × 10⁻⁵%, respectively. Furthermore, the proposed sensor exhibits a shorter response time (less than 3 min) than other methods and offers reproducible performance over 10 applications.
Table 1.
Comparisons of the proposed methods.
Table 1.
Comparisons of the proposed methods.
| Ref. | Method | Enzyme | Sensor Property |
|---|
| [5,6] | Interferometry | None | D-type fiber/right angle prism |
| [7] | Amperometric | Horseradish peroxidase (HRP) | SBA-15 entrapped HRP deposited on polyaniline |
| [8] | Spectrometric | None | No rigid fabricated sensor, solutions of pyridine-2 6-dicarboxylic acid, H2O2, and vanadate |
| [9] | Spectrometric | Peroxidase from zucchini | No rigid fabricated sensor, reaction with solutions of supernatant, guaiacol, H2O2, and peroxidase |
| [10] | Spectrometric | Horseradish peroxidase (HRP) | HRP entrapped in silicate glass matrix with Sol-Gel method |
| [11] | Fluorimetric | None | No rigid fabricated sensor, reaction with solutions of phosphine-based fluorescent reagent, H2O2, and sodium tungstate dihydrate |
| [12] | Fluorimetric | Superoxide dismutase (SOD) | No rigid fabricated sensor, reaction with solutions of SOD, H2O2, and Nash reagent |
| [13] | Chemiluminescence | None | No rigid fabricated sensor, reaction with solutions of octylphenyl polyglycol ether (OP), acidic KMnO4, and H2O2 |
| This work | Spectrometric | Horseradish peroxidase (HRP) | HRP immobilized on glass substrate |
3. Experimental Results and Discussion
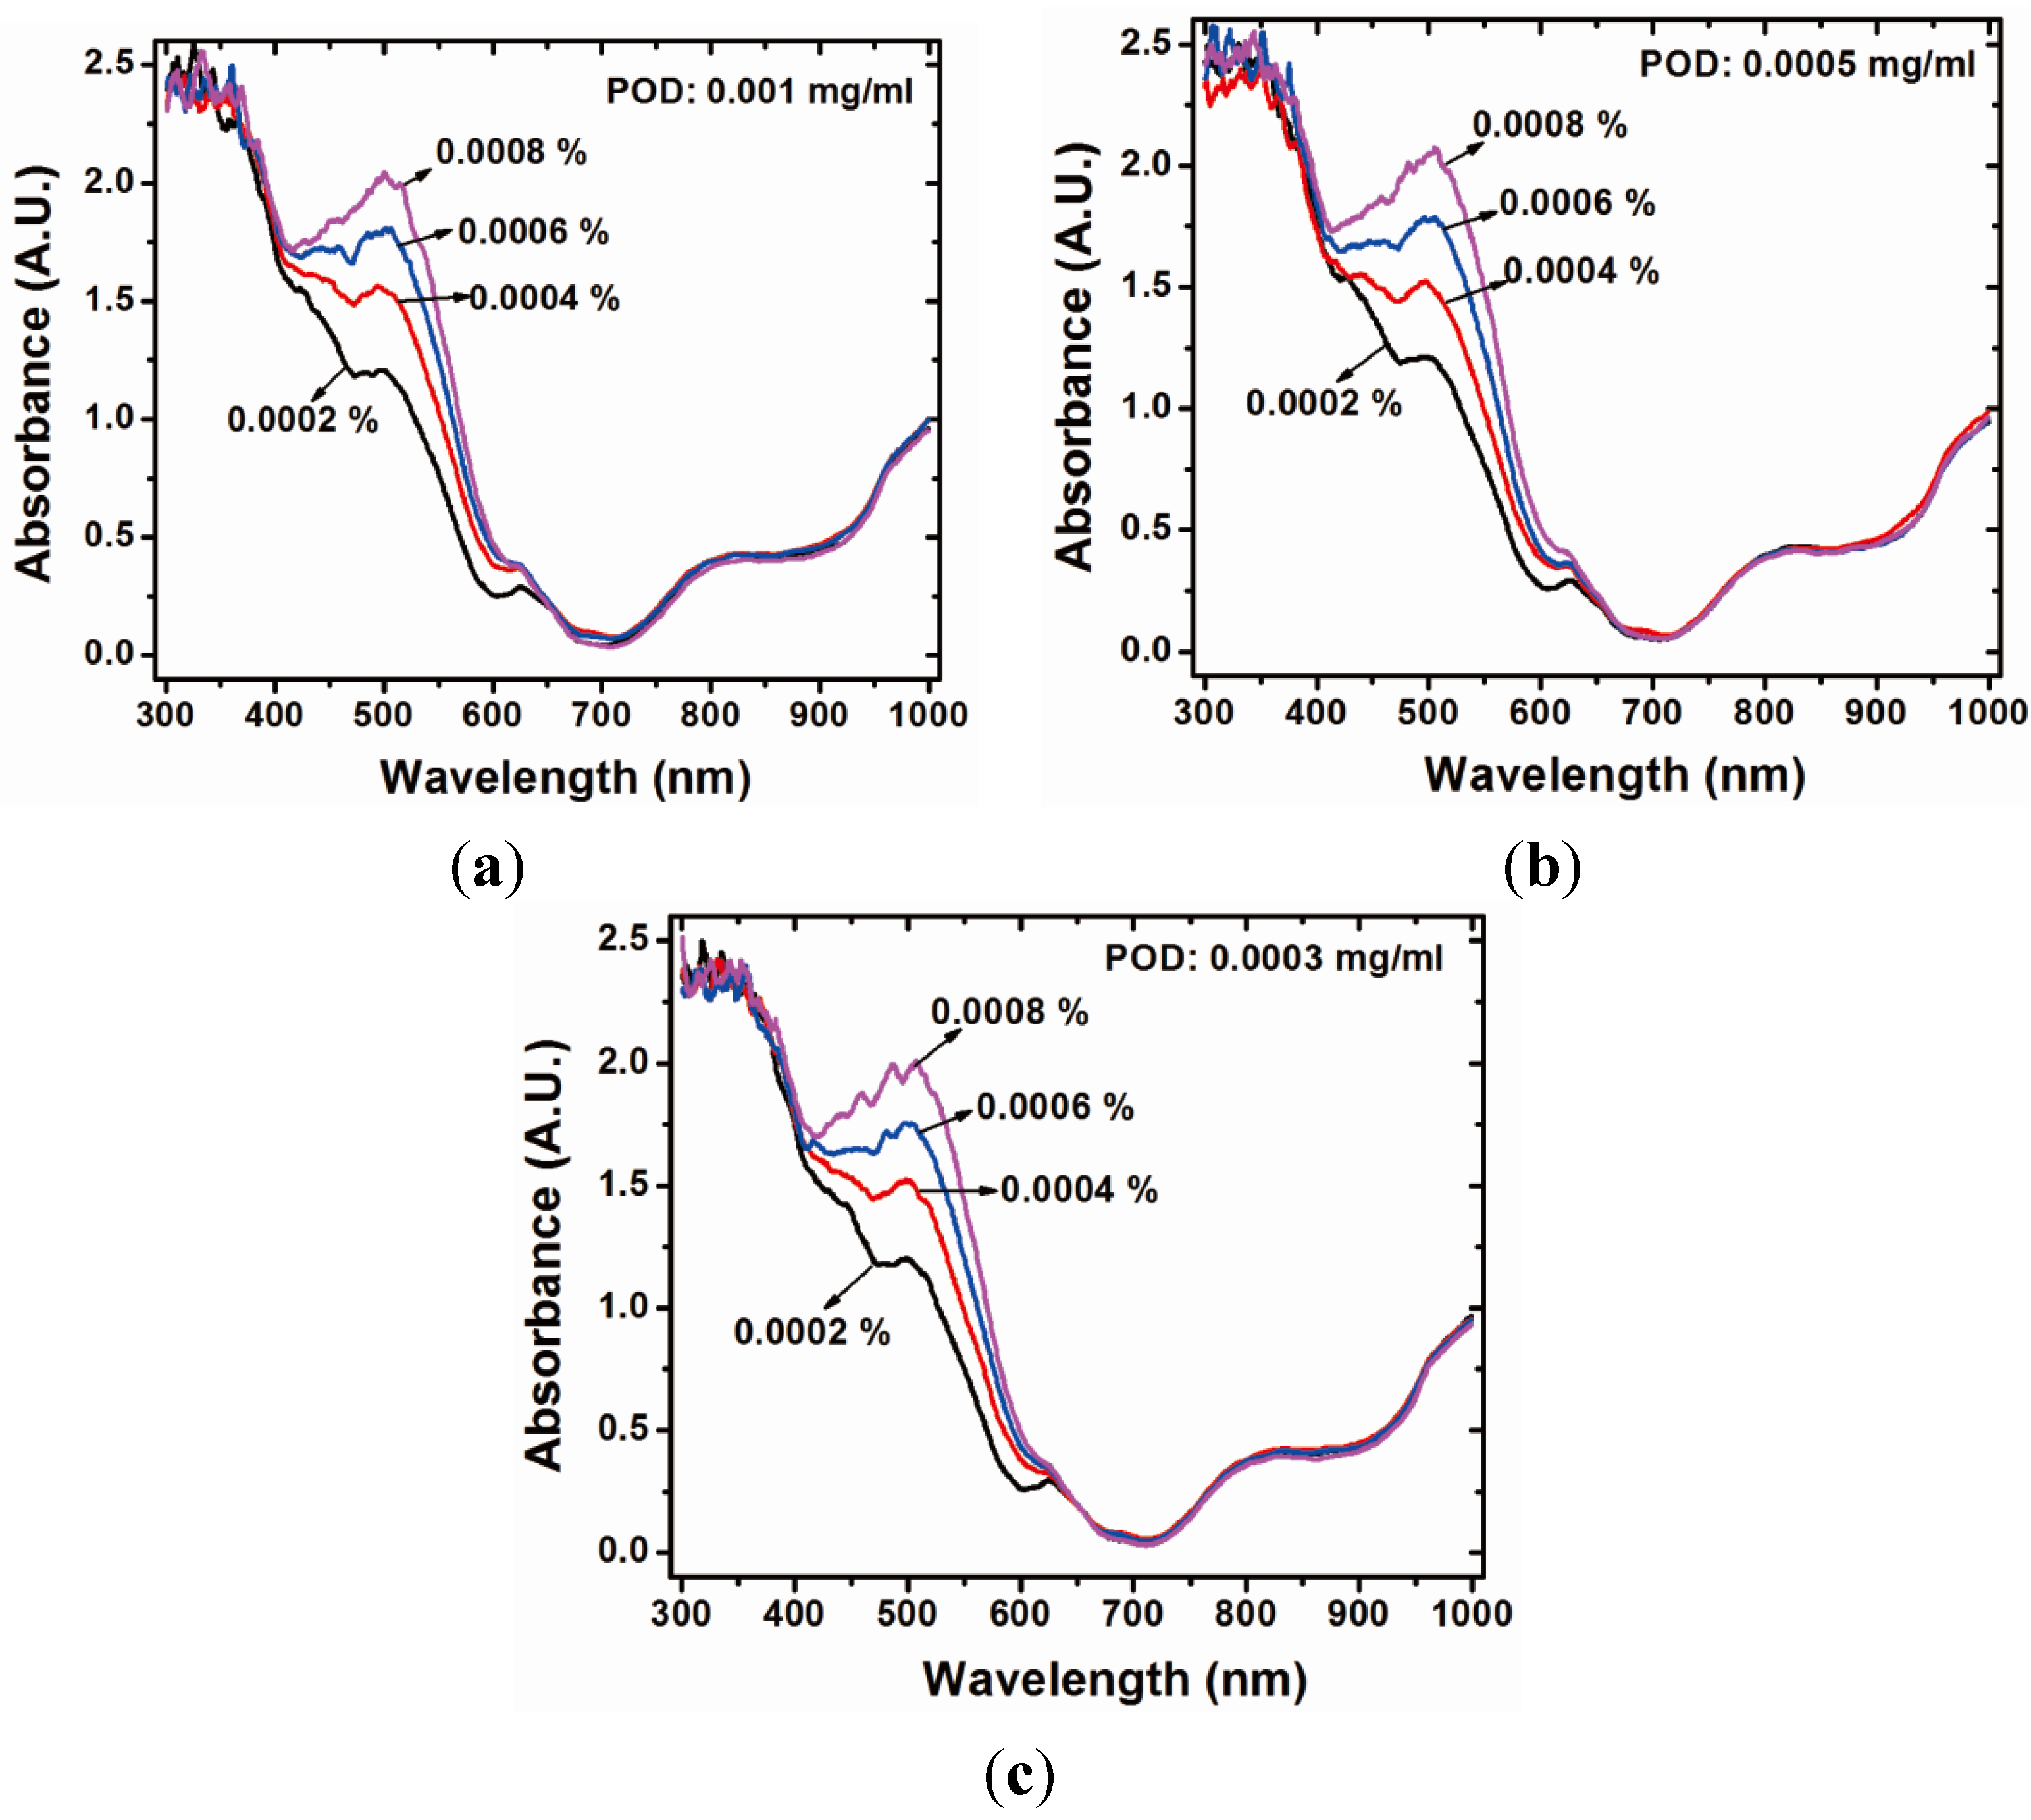
The absorbance of the colored product under various hydrogen peroxide concentrations is shown in
Figure 2. An examination of
Figure 2a shows that the absorbance of the colored product is strongly related to the H
2O
2 concentration within the wavelength range of 350 nm to 600 nm. Obviously, the optimal variation of absorbance is monitored at 510 nm and 450 nm for comparison in this study. In addition,
Figure 2 shows the similarity of behavior of the absorbance under various concentrations of POD.
Figure 2.
Absorbance behavior of the proposed sensor with various POD concentrations: (a) 0.001 mg/mL; (b) 0.0005 mg/mL; and (c) 0.0003 mg/mL.
Figure 2.
Absorbance behavior of the proposed sensor with various POD concentrations: (a) 0.001 mg/mL; (b) 0.0005 mg/mL; and (c) 0.0003 mg/mL.
To demonstrate the performance of the proposed sensor, various concentrations of H2O2 were prepared for measurement. In this study, the H2O2 concentration was within the range of 10−3%−10−4%, the POD concentration was controlled at 0.001, 0.0005 and 0.0003 mg/mL and the volumes of the chromogen solution and H2O2 were 8 mL and 2 mL, respectively. The wavelength was monitored at 510 nm and 450 nm.
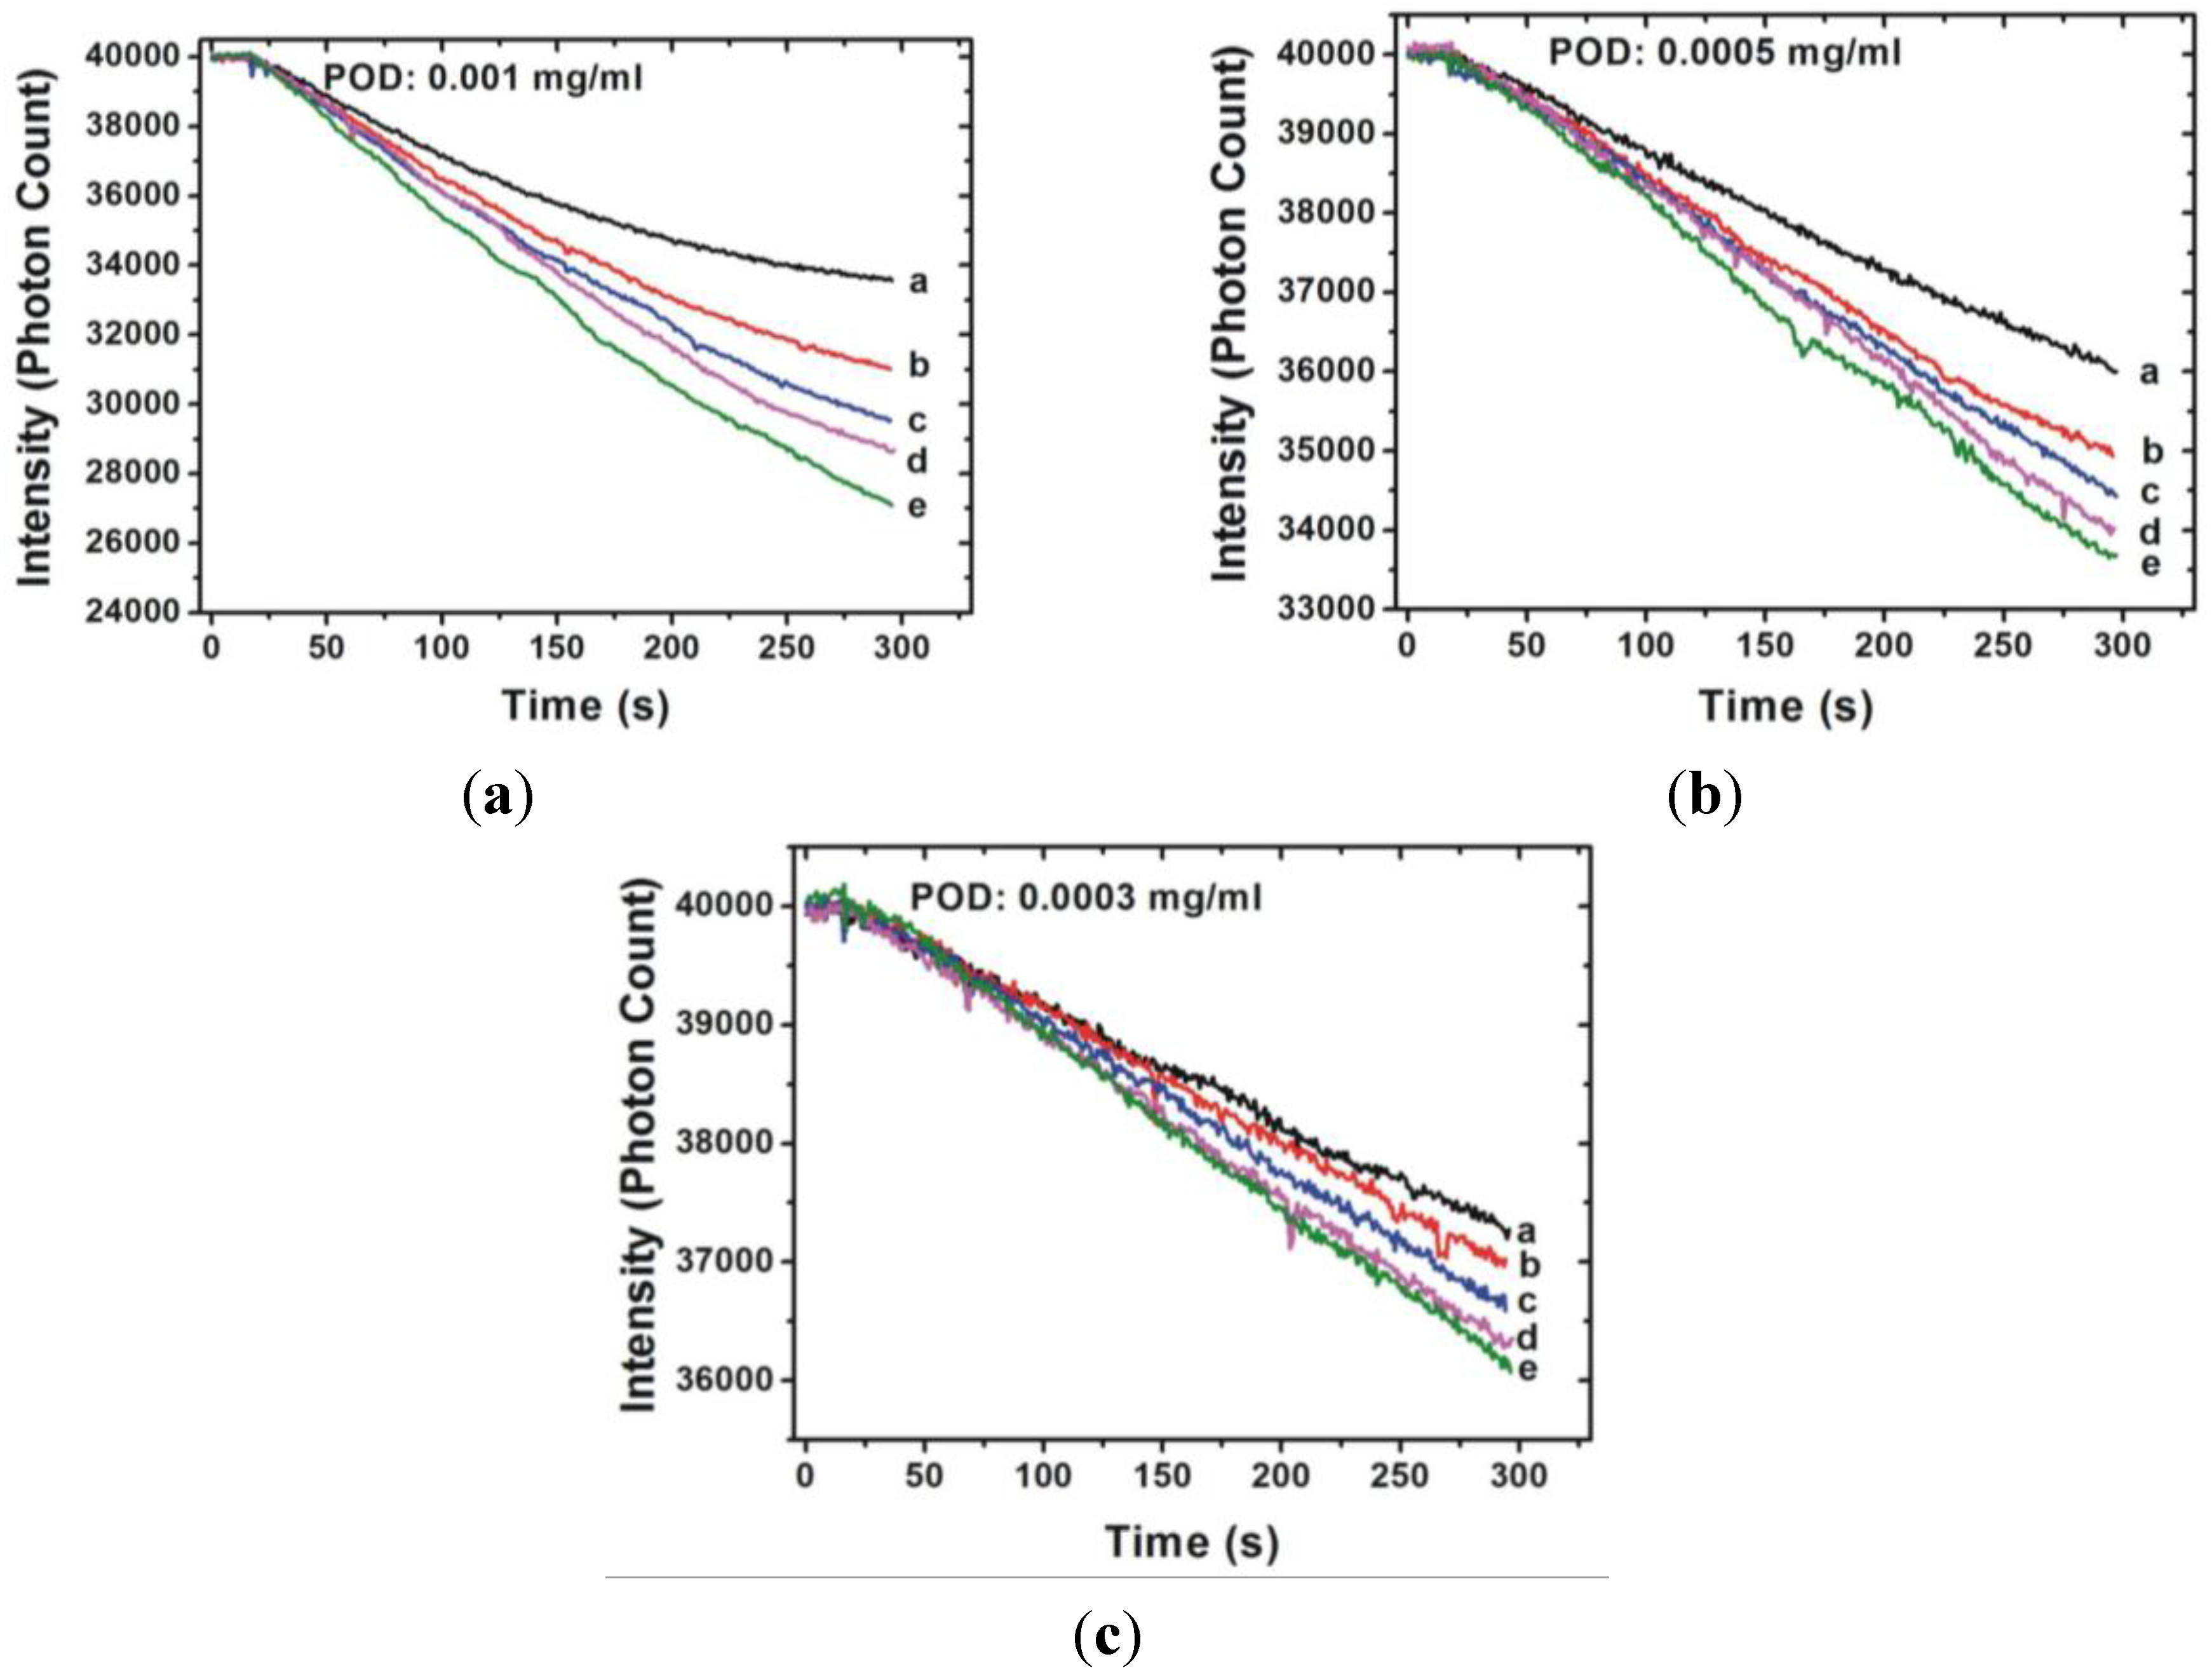
The transmittance-time response curves of various hydrogen peroxide concentrations are shown in
Figure 3 and
Figure 4.
Figure 3 shows the results obtained when the monitoring wavelength was at 510 nm and
Figure 4 shows the results of monitoring at 450 nm. As can be seen in
Figure 3, the reaction time is strongly related to the POD concentration, indicating that the higher the POD concentration, the shorter the reaction time. The reaction time was shorter than 200 s when the POD concentration was 0.001 mg/mL. In contrast to the results obtained when the monitoring wavelength was at 510 nm, the reaction time cannot easily by judge when the monitored wavelength is 450 nm. No matter what wavelength is considered for monitoring, Δ
I is related to the hydrogen peroxide concentration. In other words, Δ
I depends on the absorption behavior of the colored product.
Figure 3.
Transmittance-time response behavior of various H2O2 concentrations (a: 0.0001%; b: 0.00015%; c: 0.0002%; d: 0.00025; e: 0.0003%; f: 0.00035; g: 0.0004; h: 0.00045%) measured by the sensor with various POD concentrations ((a) 0.001 mg/mL; (b) 0.0005 mg/mL; and (c) 0.0003 mg/mL) at monitored wavelengths of 510 nm.
Figure 4.
Transmittance-time response behavior of various H2O2 concentrations (a: 0.0001%; b: 0.00015%; c: 0.0002%; d: 0.00025; e: 0.0003%) measured by the sensor with various POD concentrations ((a) 0.001 mg/mL; (b) 0.0005 mg/mL; and (c) 0.0003 mg/mL) at monitored wavelengths of 450 nm.
Figure 4.
Transmittance-time response behavior of various H2O2 concentrations (a: 0.0001%; b: 0.00015%; c: 0.0002%; d: 0.00025; e: 0.0003%) measured by the sensor with various POD concentrations ((a) 0.001 mg/mL; (b) 0.0005 mg/mL; and (c) 0.0003 mg/mL) at monitored wavelengths of 450 nm.
Figure 2 shows stronger absorption of the colored product at the wavelength of 510 nm. The more material that is absorbed, the greater the change of the photon count of the transmission light (Δ
I). The Δ
I of each hydrogen peroxide concentration was smaller when the monitoring wavelength was 450 nm than the results obtained when monitoring at 510 nm. Furthermore, it is difficult to determine the termination of the chemical reaction when the monitoring wavelength is 450 nm. The reason might be because the intermediate product is still generated. By contrast with the results with a monitoring wavelength of 510 nm, the termination of the reaction is easy to determine and is within approximately 300 s.
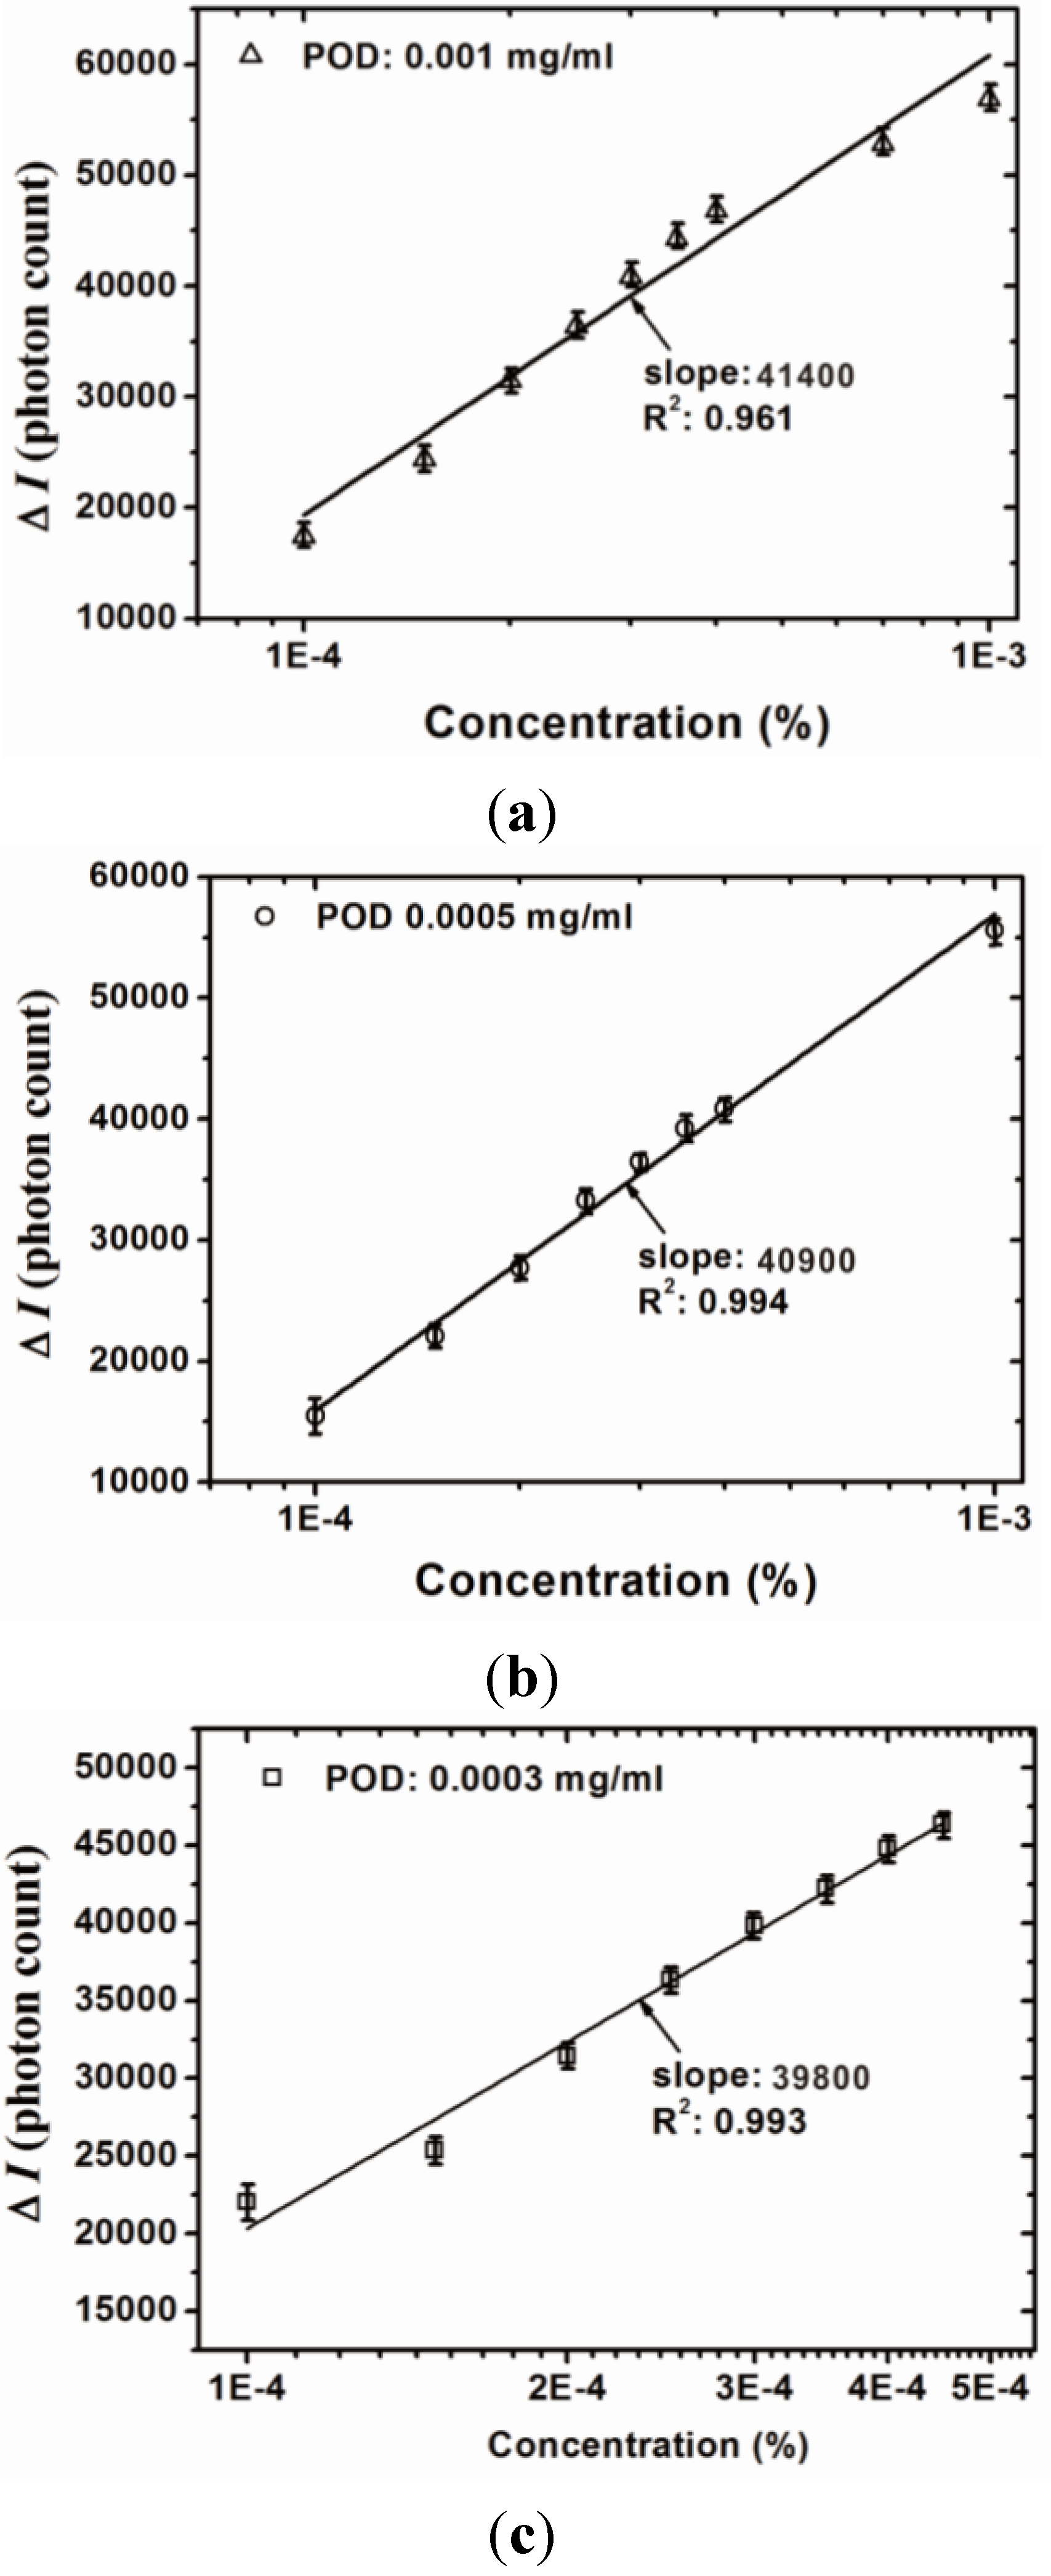
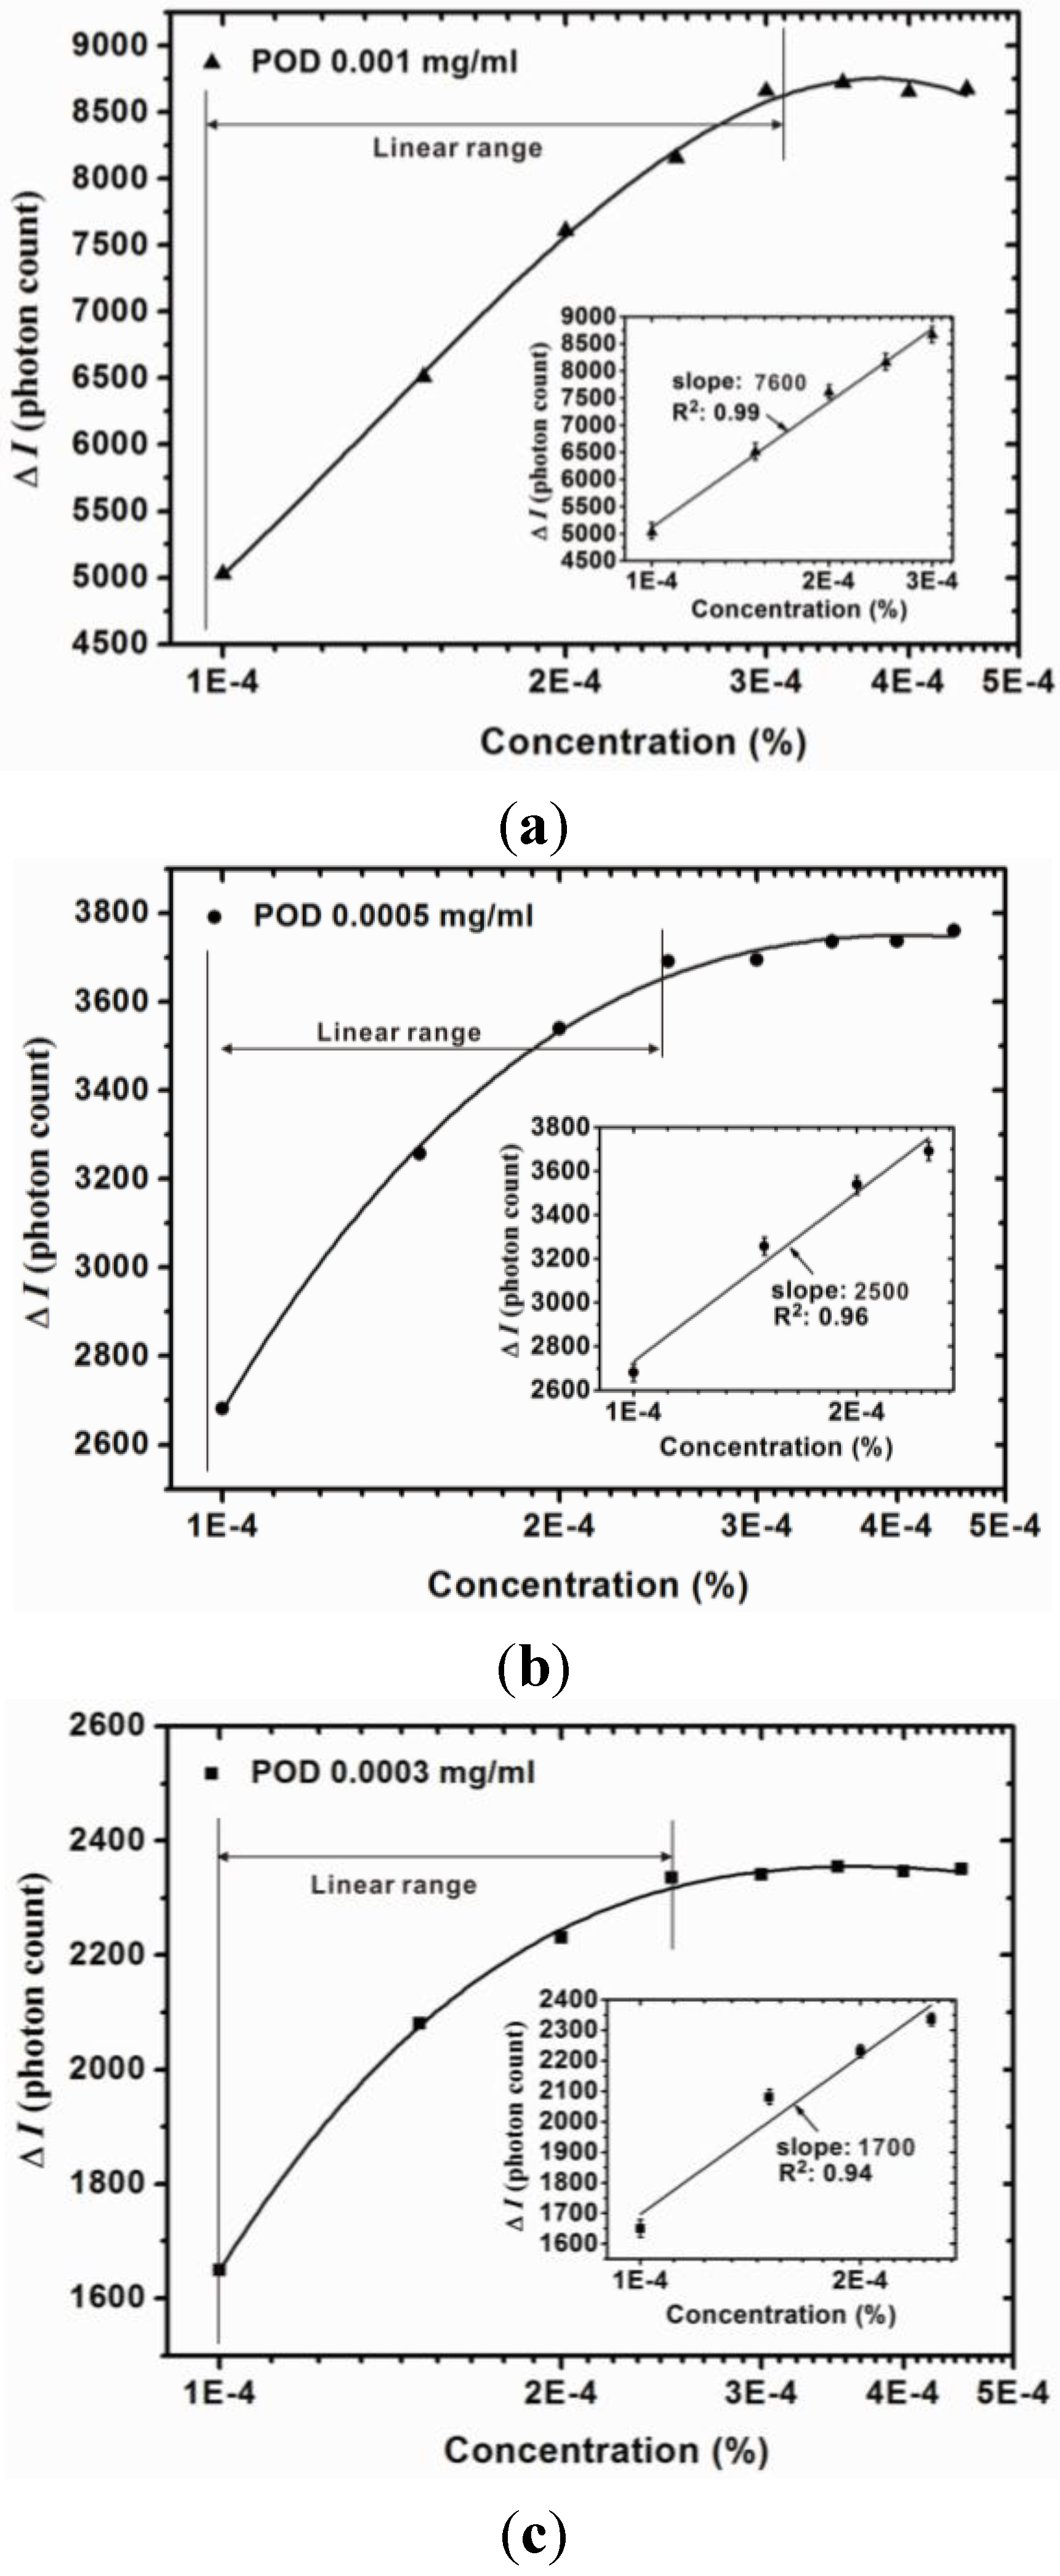
The quantitative analysis results of the proposed sensor are shown in
Figure 5 and
Figure 6, which indicate the calibration curve measured by using the proposed sensor with different POD concentrations and monitored wavelengths. Measurements were performed 10 times and the mean values and standard deviation were plotted. It is clear that the measurement range of the H
2O
2 concentration is related to the monitoring wavelength and exhibits greater linearity when the monitoring wavelength is 510 nm. The slope of the calibration curve indicates the sensitivity of the proposed sensor. It can be seen that the sensitivity increases with an increasing POD concentration. In addition, the sensitivity is also related to the monitoring wavelength and the results show that greater sensitivity can be obtained when the monitoring wavelength is 510 nm. In contrast, when monitoring at 450 nm, the calibration curve exhibited saturation as H
2O
2 concentration reached 3 × 10
−4%. The linear ranges and corresponding calibration curves of the proposed sensors monitored at a wavelength of 450 nm are shown in
Figure 6. The optimal measurement conditions are obtained when the POD concentration is controlled at 0.001 mg/mL and the monitoring wavelength is 510 nm. The resolution of the proposed sensor can be represented as [
16]:
where
K and
S are the intersection and slope of the calibration curve, respectively; Δ
Ires and Δ
C represent the resolutions of the photon counter and concentration, respectively.
Figure 5.
Calibration curve of the proposed sensor with various POD concentrations ((a) 0.001 mg/mL; (b) 0.0005 mg/mL; and (c) 0.0003 mg/mL) at a monitored wavelength of 510 nm.
Figure 5.
Calibration curve of the proposed sensor with various POD concentrations ((a) 0.001 mg/mL; (b) 0.0005 mg/mL; and (c) 0.0003 mg/mL) at a monitored wavelength of 510 nm.
Figure 6.
Calibration curve of proposed sensor with various POD concentrations ((a) 0.001 mg/mL; (b) 0.0005 mg/mL; and (c) 0.0003 mg/mL) at a monitored wavelength of 450 nm.
Figure 6.
Calibration curve of proposed sensor with various POD concentrations ((a) 0.001 mg/mL; (b) 0.0005 mg/mL; and (c) 0.0003 mg/mL) at a monitored wavelength of 450 nm.
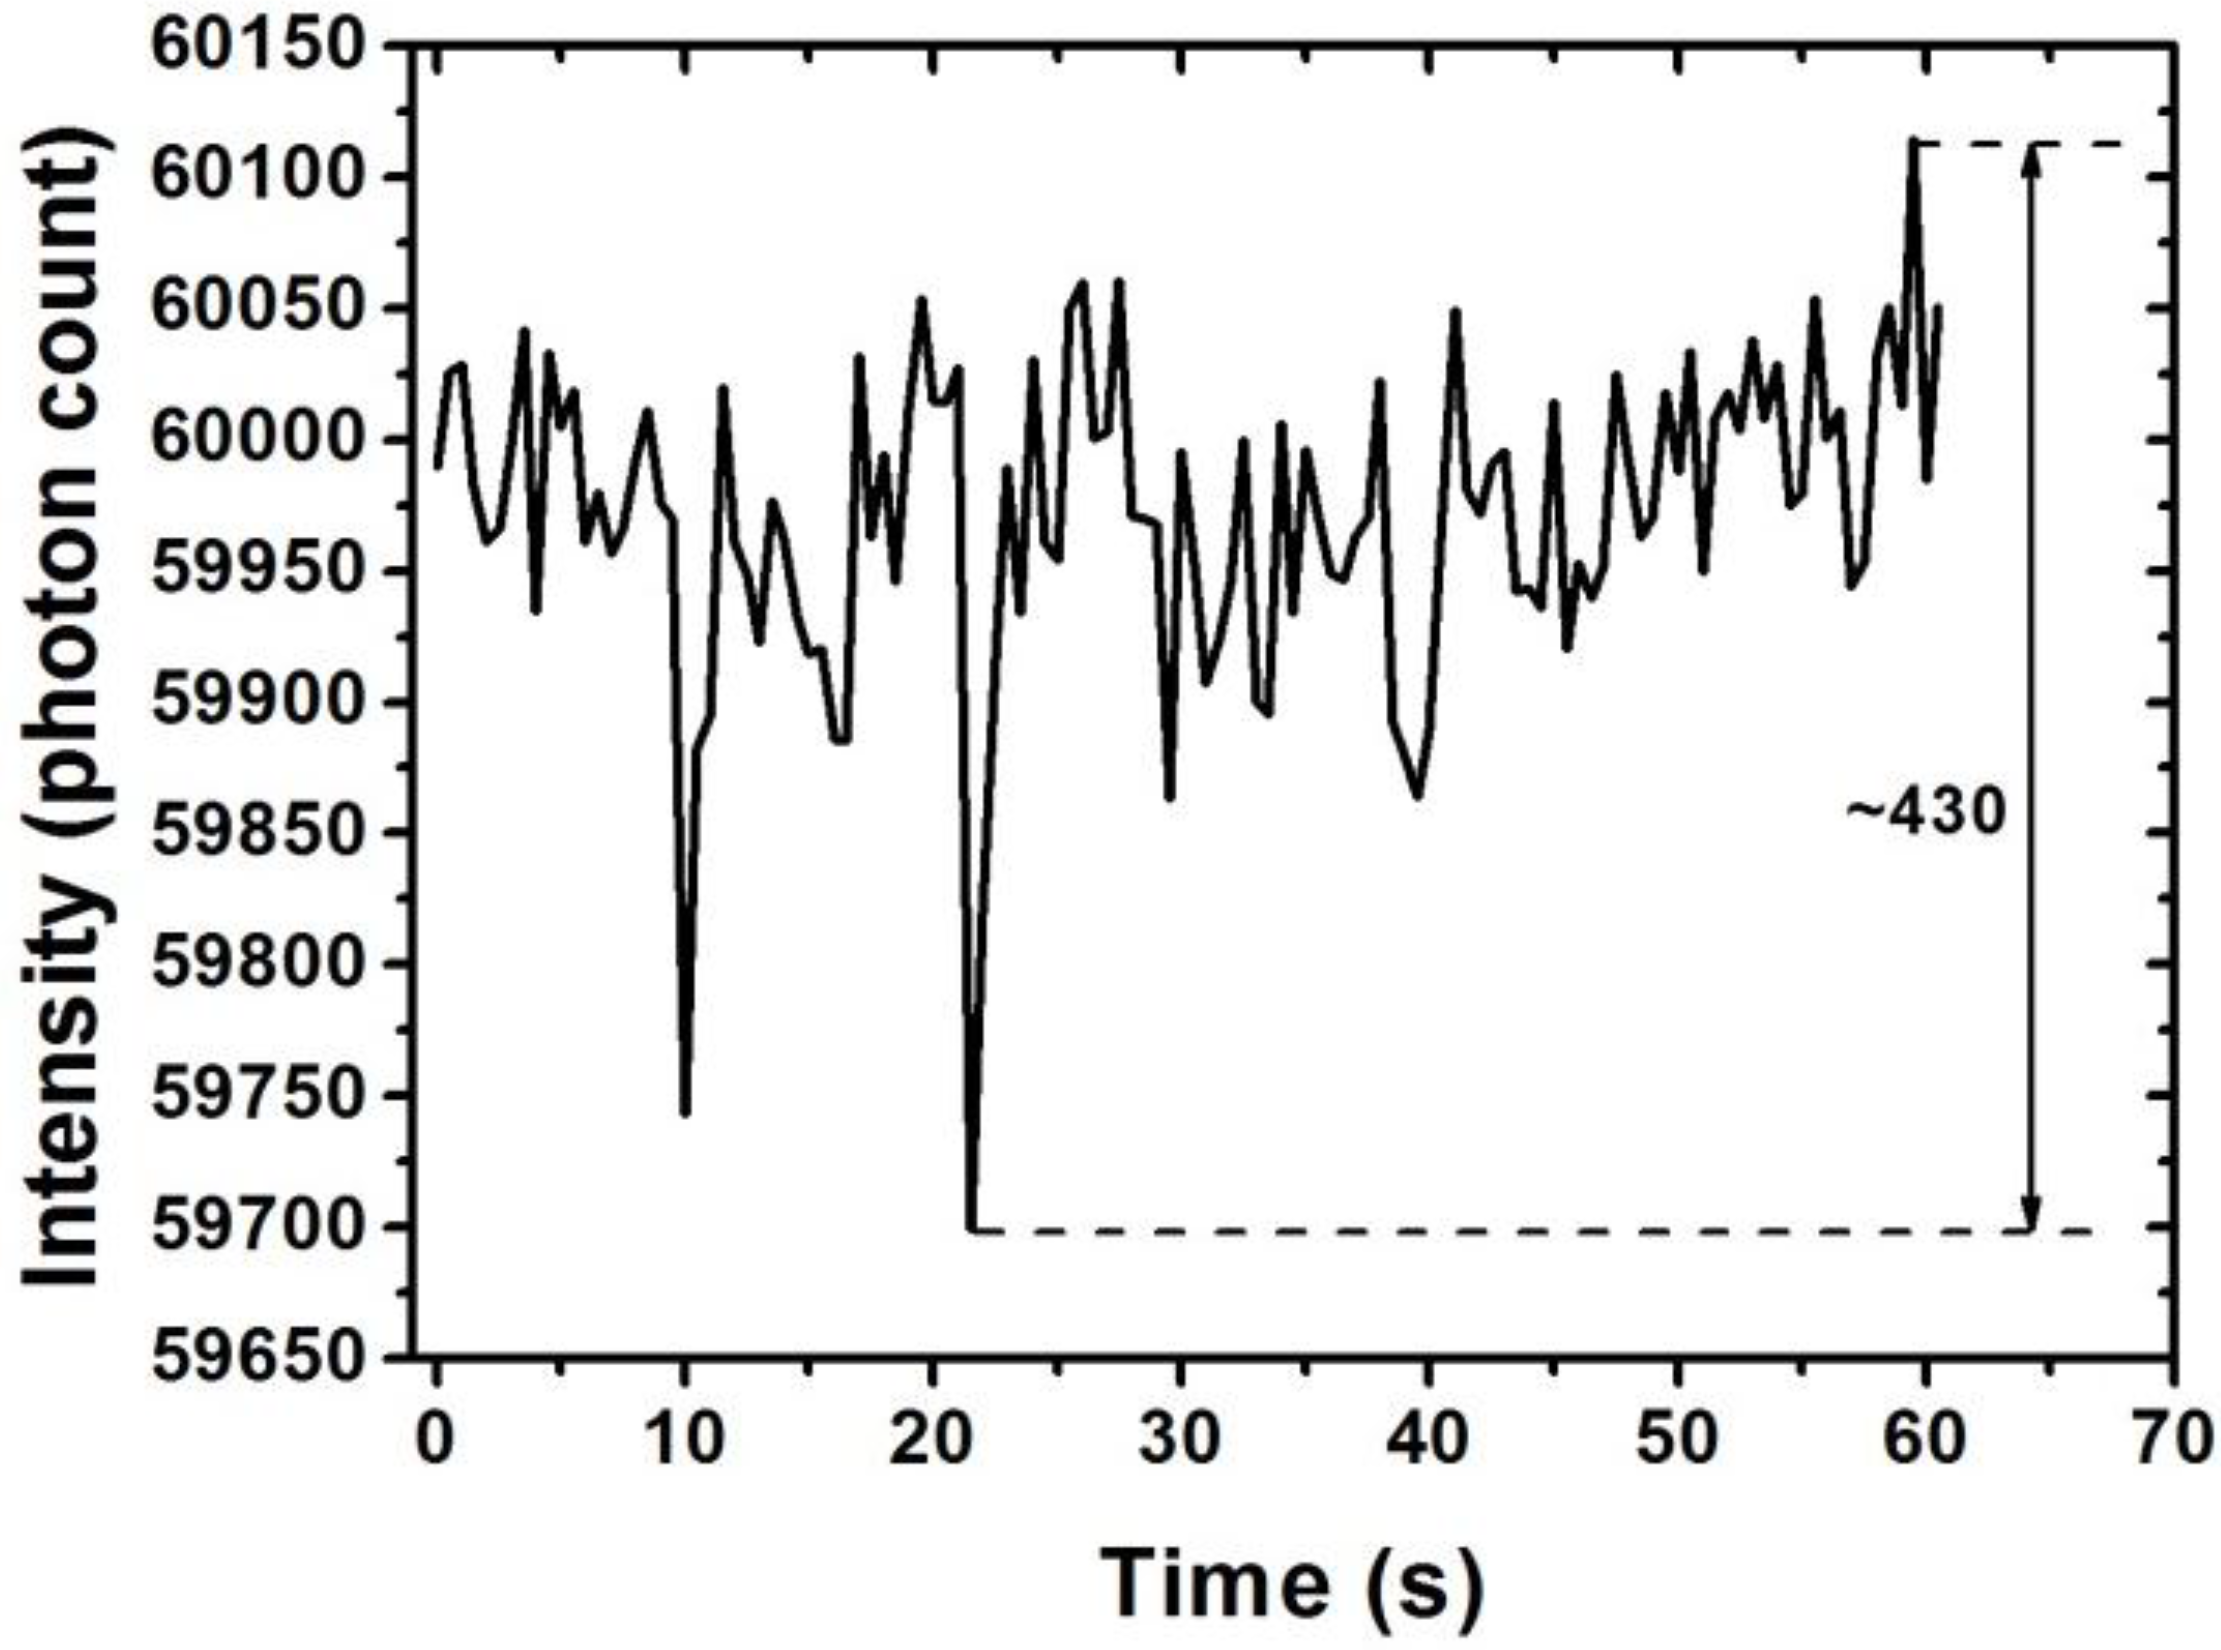
It is obvious that Δ
Ires, which is the result of the photon counter resolution (theoretically one photon can be detected, but unexpected electronic noise will decrease the accuracy of photon counting), will affect the resolution of the proposed method. Therefore, the actual Δ
Ires can be indicated by stability evaluation of the photon counter, as shown in
Figure 7. Stability evaluation of the proposed sensor was conducted with a bare H
2O
2 sensor by recording the transmission intensity variation at the monitored wavelength of 510 nm within 1 min. The largest intensity variation was approximately 430 photon counts.
The resolution of the proposed method can be calculated using Equation (2) and the results are summarized in
Table 2. The results show that the sensitivity of the proposed sensor decreases as the POD concentration increases. With a high POD concentration the proposed sensor exhibits high sensitivity regardless of whether the monitoring wavelength is at 510 nm or 450 nm. Furthermore, the resolution of the proposed sensor decreases as the POD concentration decreases, the optimal resolution being obtained with a high POD concentration. Therefore, the optimal fabrication condition for the proposed sensor is with a POD concentration of 0.001 mg/mL and the optimal sensitivity and resolution are 41,400 (photon count/%) and 3.49 × 10
−5%, respectively.
Figure 7.
Stability evaluation of the photon counter.
Figure 7.
Stability evaluation of the photon counter.
Table 2.
Sensitivity and resolution of the proposed sensor.
Table 2.
Sensitivity and resolution of the proposed sensor.
| Monitoring Wavelength (nm) | POD Concentration (mg/mL) | Sensitivity (Photon Count/%) | ΔIres | Resolution |
|---|
| Theoretical (10−8%) | Real (10−5%) |
|---|
| 510 | 0.001 | 41,400 | | 8.11 | 3.49 |
| 0.0005 | 40,900 | 430 | 9.72 | 4.18 |
| 0.0003 | 39,800 | | 11.74 | 5.05 |
| 450 | 0.001 | 7600 | | 10.37 | 4.46 |
| 0.0005 | 2500 | 430 | 12.37 | 5.32 |
| 0.0003 | 1700 | | 16.23 | 6.98 |
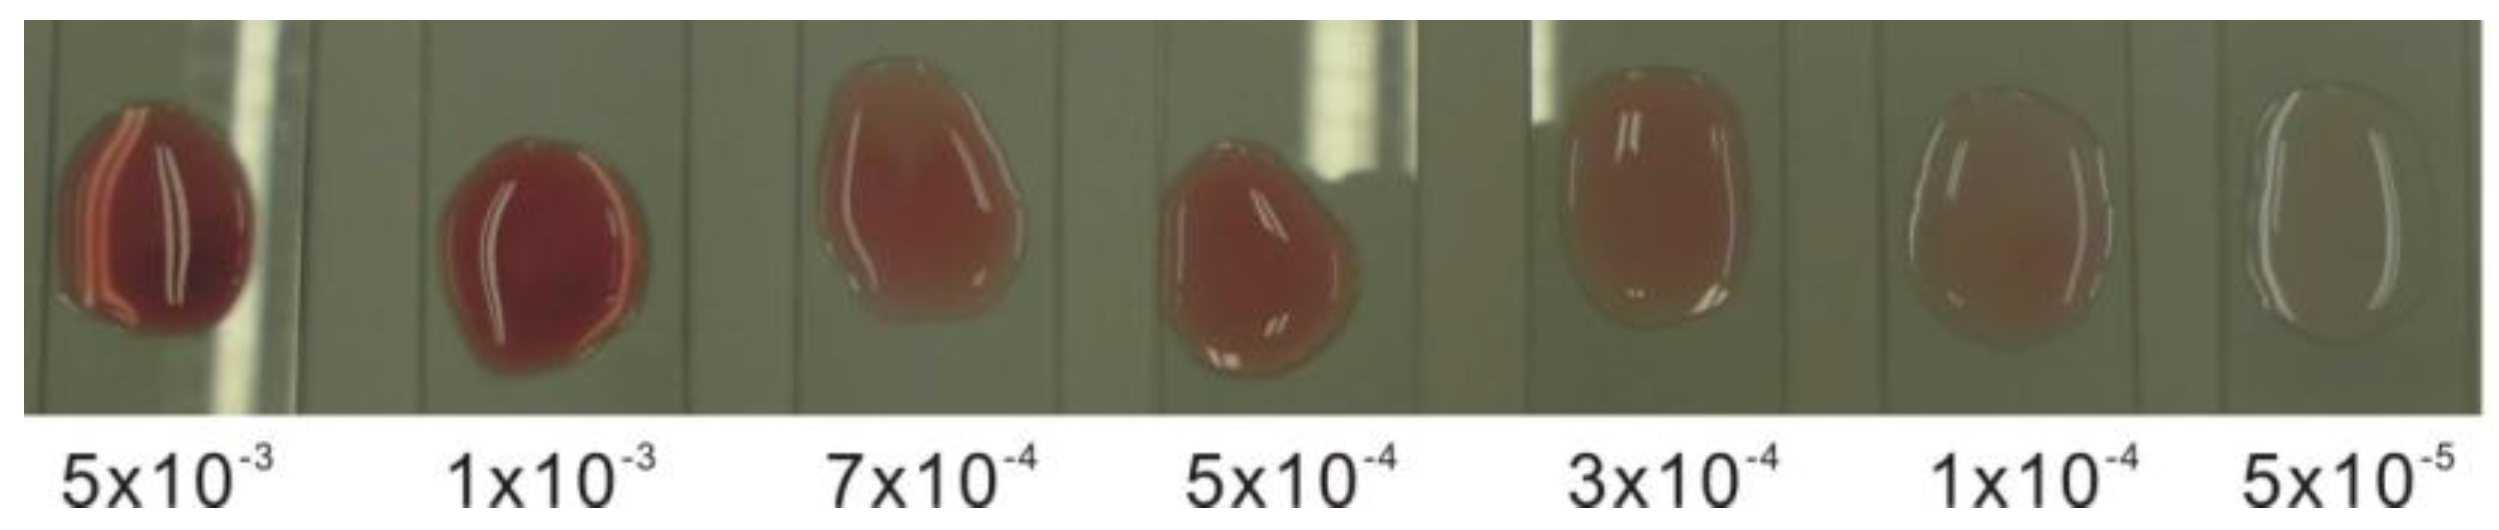
Figure 8 illustrates the results of qualitative analysis obtained by using the proposed sensor (POD concentration: 0.001 mg/mL) to measure various H
2O
2 concentrations. In the color chart comparison method [
15], the approximate quantity of an unknown concentration can be obtained by comparison with an indicator color chart. It is obvious that the colored product generated by the proposed sensor gets darker in color as the H
2O
2 concentration increases and can be easily distinguished visually. The detection limit of qualitative analysis is approximately 5 × 10
−5%.
Figure 8.
Qualitative analysis of the proposed sensor. The H2O2 concentration varied from 5 × 10⁻⁵% to 5 × 10⁻³% with the POD concentration controlled at 0.001 mg/mL.
Figure 8.
Qualitative analysis of the proposed sensor. The H2O2 concentration varied from 5 × 10⁻⁵% to 5 × 10⁻³% with the POD concentration controlled at 0.001 mg/mL.
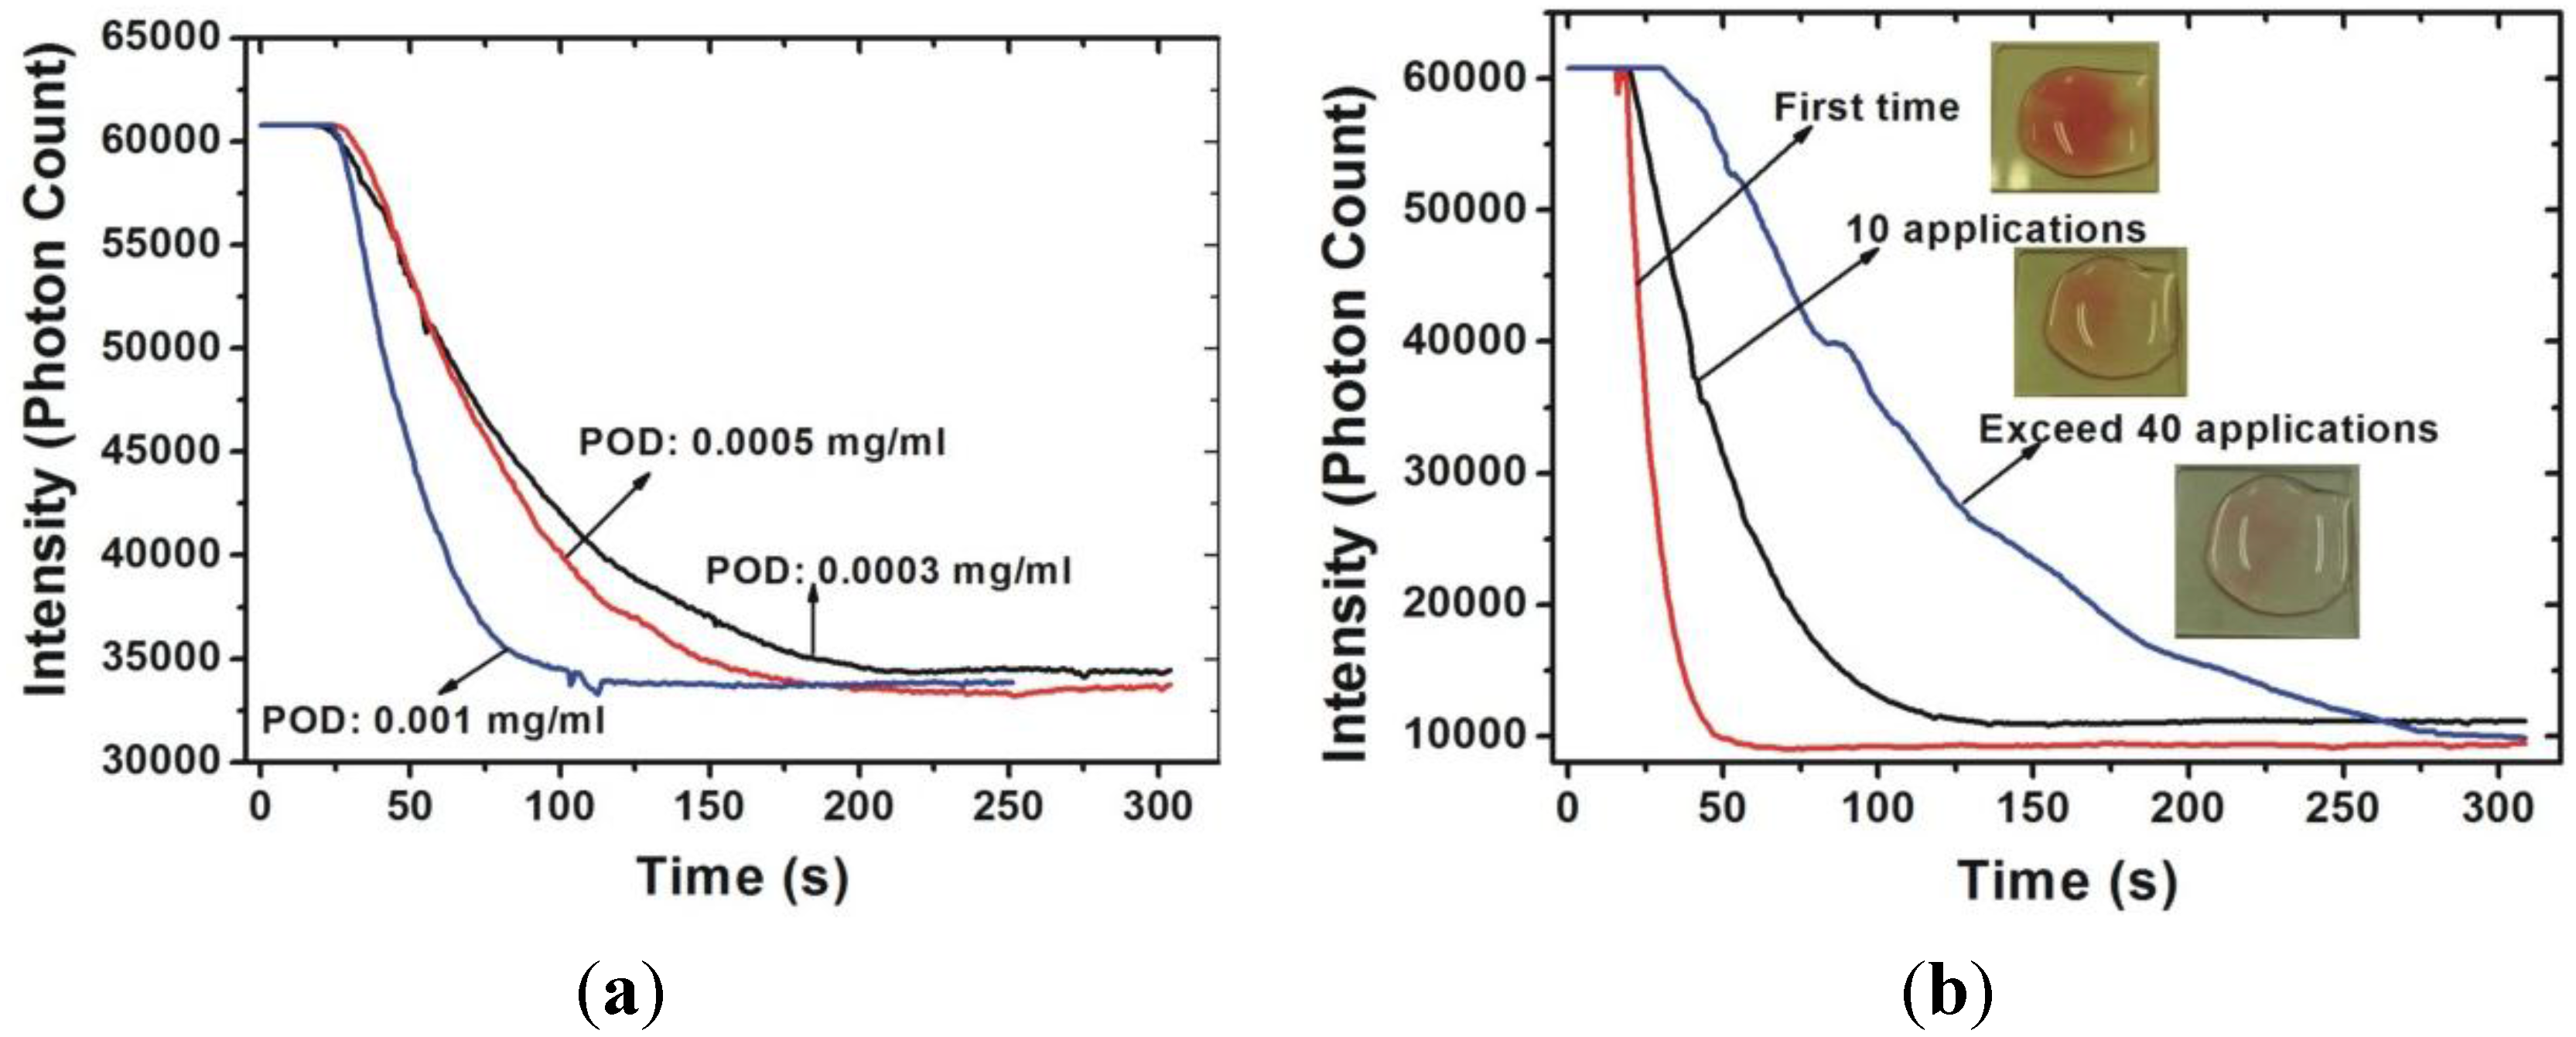
Figure 9 demonstrates the reliability of the proposed sensor as indicated by the transmittance-time response curves for two conditions. First, the POD concentration will affect the chemical reaction of catalytic POD. A higher POD concentration leads to a faster reaction which causes a shorter response time and sharper tendency of the transmittance-time response curve.
Figure 9a shows the transmittance-time response curves for the test samples measured by the proposed sensor with various POD concentrations. It is clear that the reaction time decreases as the POD concentration is increased and the optimal reaction time is shorter than 150 s as measured by the sensor with a POD concentration of 0.001 mg/mL. In addition, the tendency of the transmittance-time response curve is sharper with a higher POD concentration. Second, the activity of the POD will decrease as the number of applications of the proposed sensor increase and the reaction time of the proposed sensor will increase as the application number increases. Moreover, the color of the colored product will become lighter as the number of applications increases. As can be seen in
Figure 9b, the behavior of the transmittance-time response of the proposed sensor remains identical for 10 applications. When the application of the sensor exceeds 40 times, the response time of the chemical reaction will exceed 300 s. Combined with the chromogen results, shown in the inset of
Figure 9b, it can be seen that the activity of the POD immobilized on the proposed sensor is still operative but the efficiency in converting the H
2O
2 into oxygen and water is lower. Based on these results, we can conclude that the proposed sensor can preserve similar behavior (chemical reaction terminated within 150 s) over 10 applications. Furthermore, it can still be used even after 40 applications, in which case the chemical reaction will terminate within 360 s.
Figure 9.
Reliability of the proposed sensor: (a) transmittance-time response curves with various POD concentrations; and (b) transmittance-time response curves for various application numbers measured by the proposed sensor with POD concentration of 0.001 mg/mL.
Figure 9.
Reliability of the proposed sensor: (a) transmittance-time response curves with various POD concentrations; and (b) transmittance-time response curves for various application numbers measured by the proposed sensor with POD concentration of 0.001 mg/mL.
The performance of the proposed sensor was compared with the performance of methods described in some other previous works and noted in Introduction section. The results of the comparison are summarized in
Table 3 mentioning key aspects such as the detection limit, resolution, linear range, response time, and reusability. As shown by the comparison, the proposed method provided a reusable H
2O
2 sensor with high sensitivity, low detection limit, and fast determination of H
2O
2 concentration within the measurement range of 10
−4%–10
−3%. Furthermore, the proposed sensor has both quantitative and qualitative characteristics. Therefore, the proposed sensor can be adopted for visual detection in food-safety evaluation or determination the residual H
2O
2 concentration released from a single-use chopstick.
Table 3.
Performance of different H2O2 concentration measurement methods.
Table 3.
Performance of different H2O2 concentration measurement methods.
| Ref. | Detection Limit | Resolution | Linear Range | Response Time | Reusability |
|---|
| [5,6] | 10% | 0.06% | 10%–90% | X | X |
| [7] | 0.02 mM | 417.5 μA/mM | 0.04–12 mM | ~5 s | X |
| [8] | 5.8 nmol | X | 0.05–50 ppm | X | X |
| [9] | 2.1 × 10⁻⁶ mol/L | X | 16–660 μmol/L | X | X |
| [10] | 5 × 10⁻⁵ M | X | Nonlinear | 1 h | X |
| [11] | 1.25 ng/μL | X | 1.25–50 ng/μL | <2 min | X |
| [12] | 5 μM | X | Nonlinear | X | X |
| [13] | 0.006 μmol/L | X | 10−8–6 × 10⁻⁵ mol/L | X | X |
| This work | 3.5 × 10⁻⁵% | 5 × 10⁻⁵% | 10−4–10−3% | <5 min | 10 times |


