
Optimization of High-Q Coupled Nanobeam Cavity for Label-Free Sensing

Abstract
:1. Introduction
2. Numerical Modeling
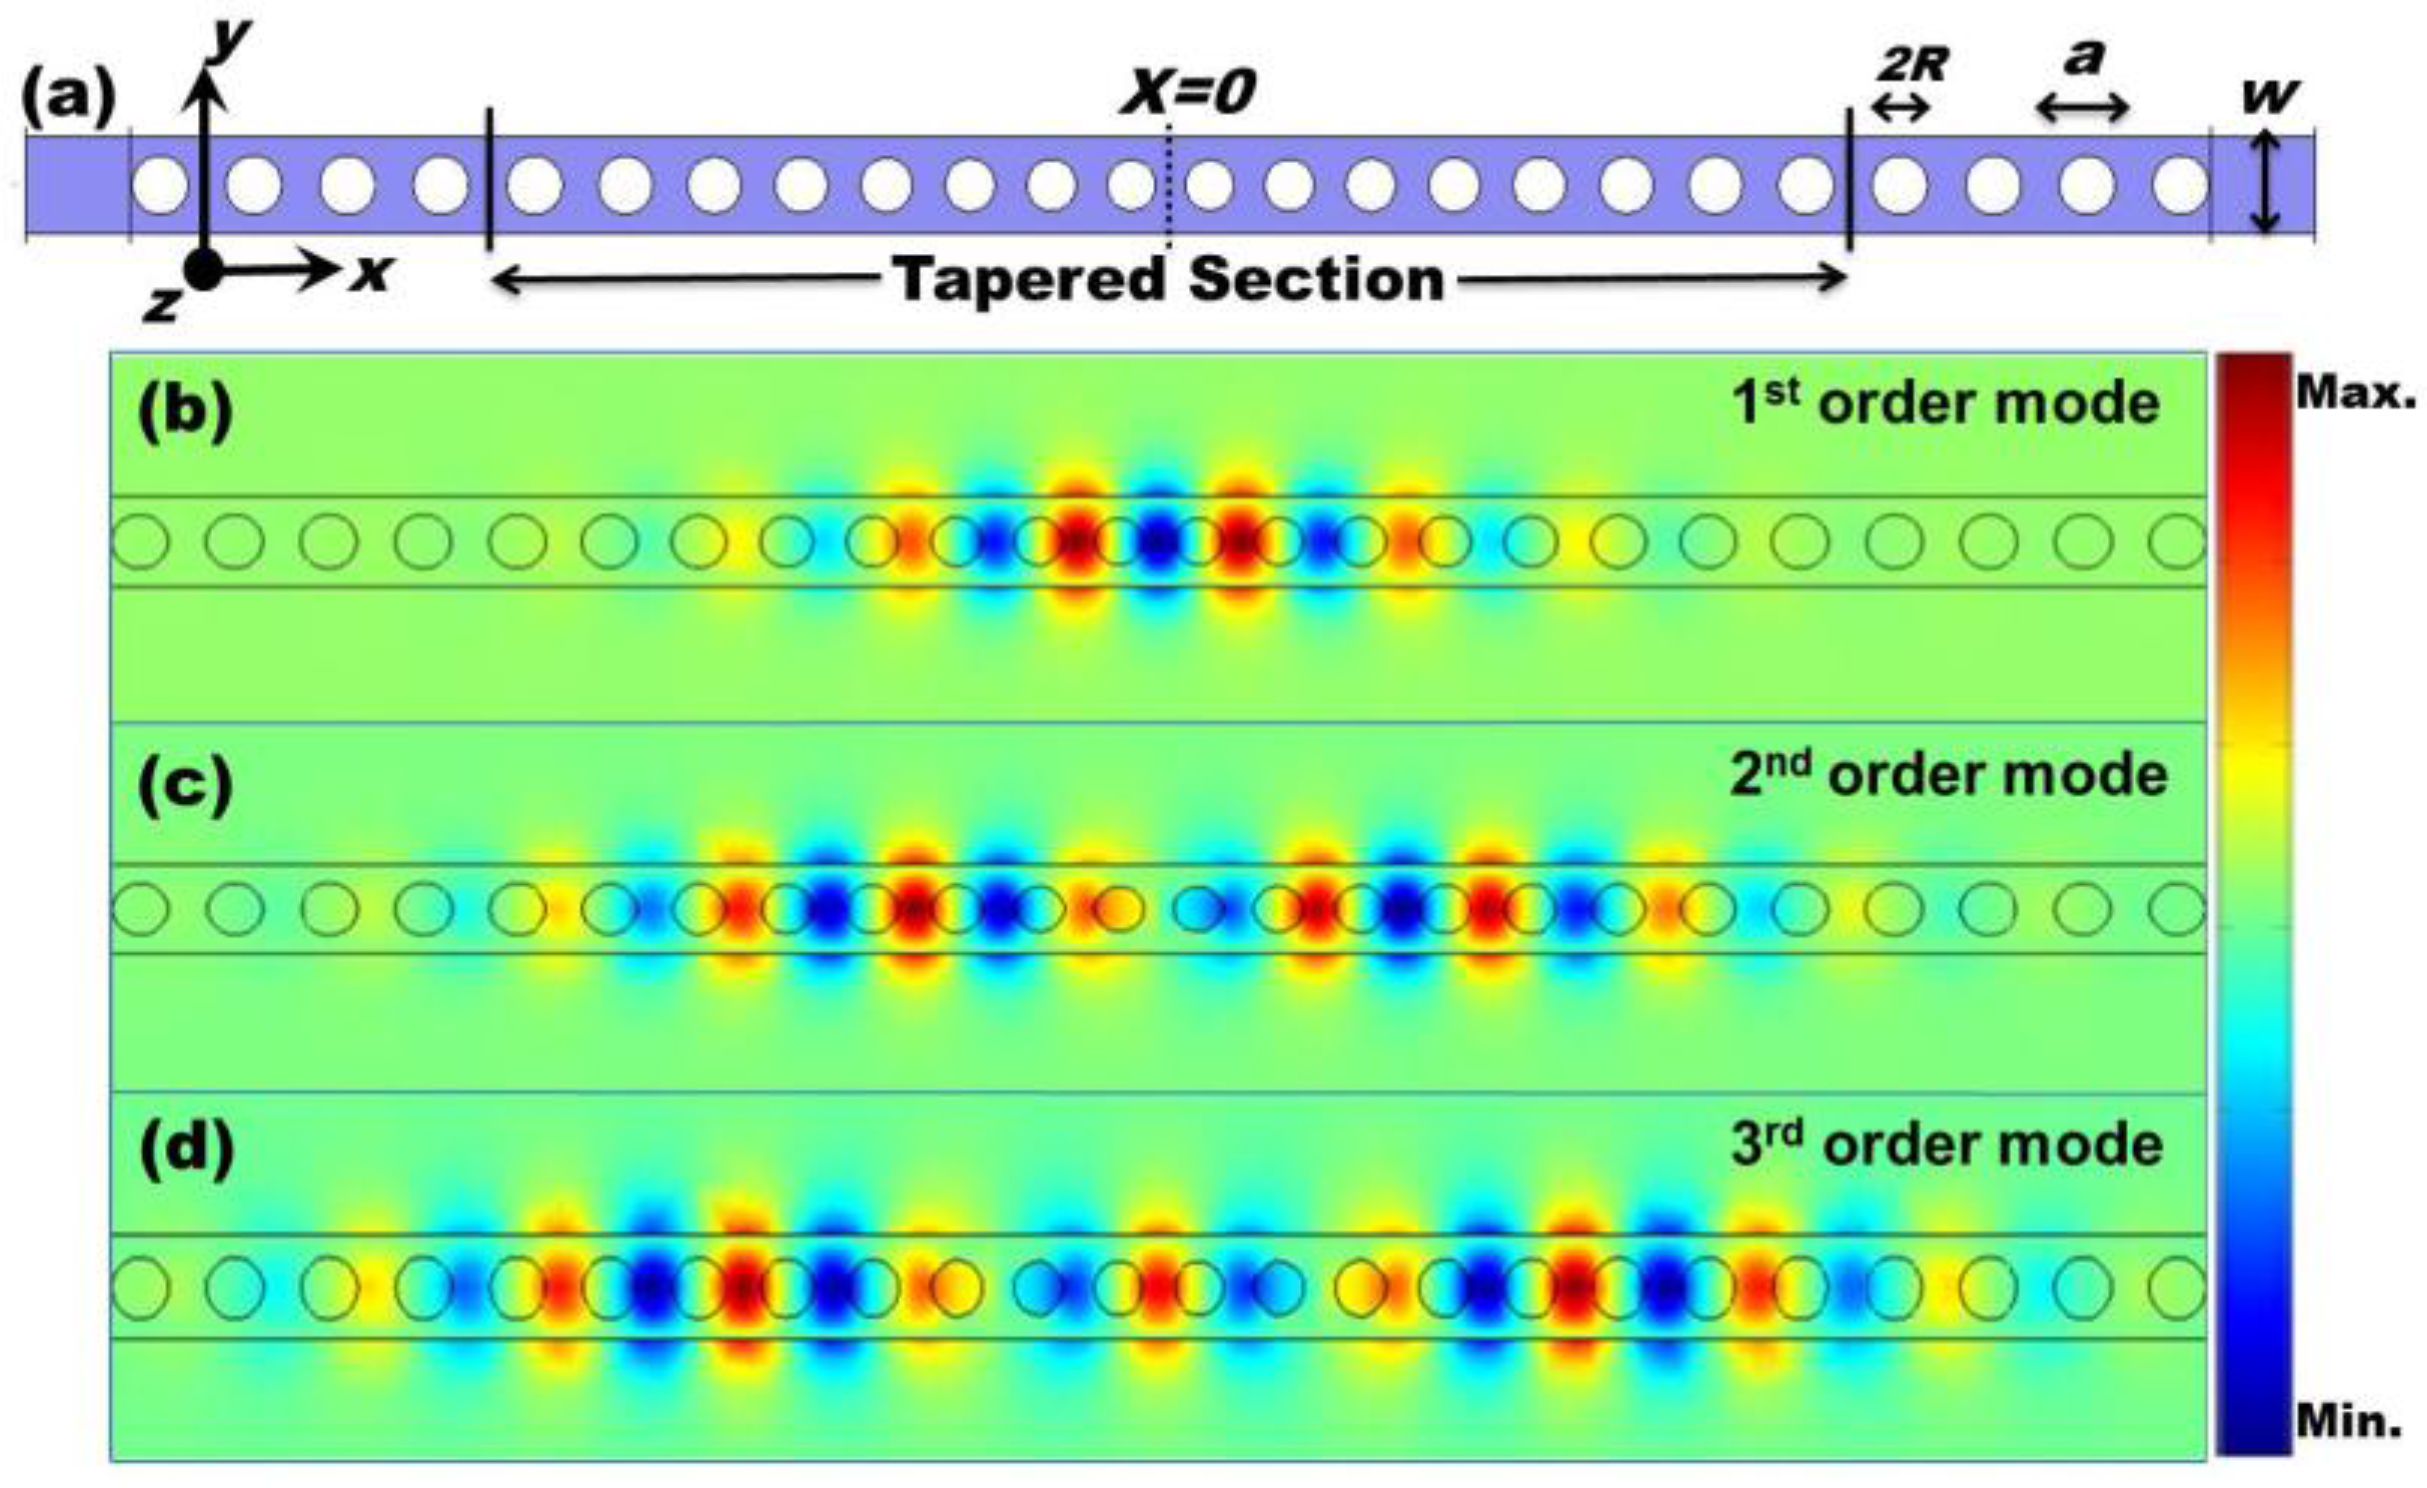
2.1. Single PhC NB Cavity

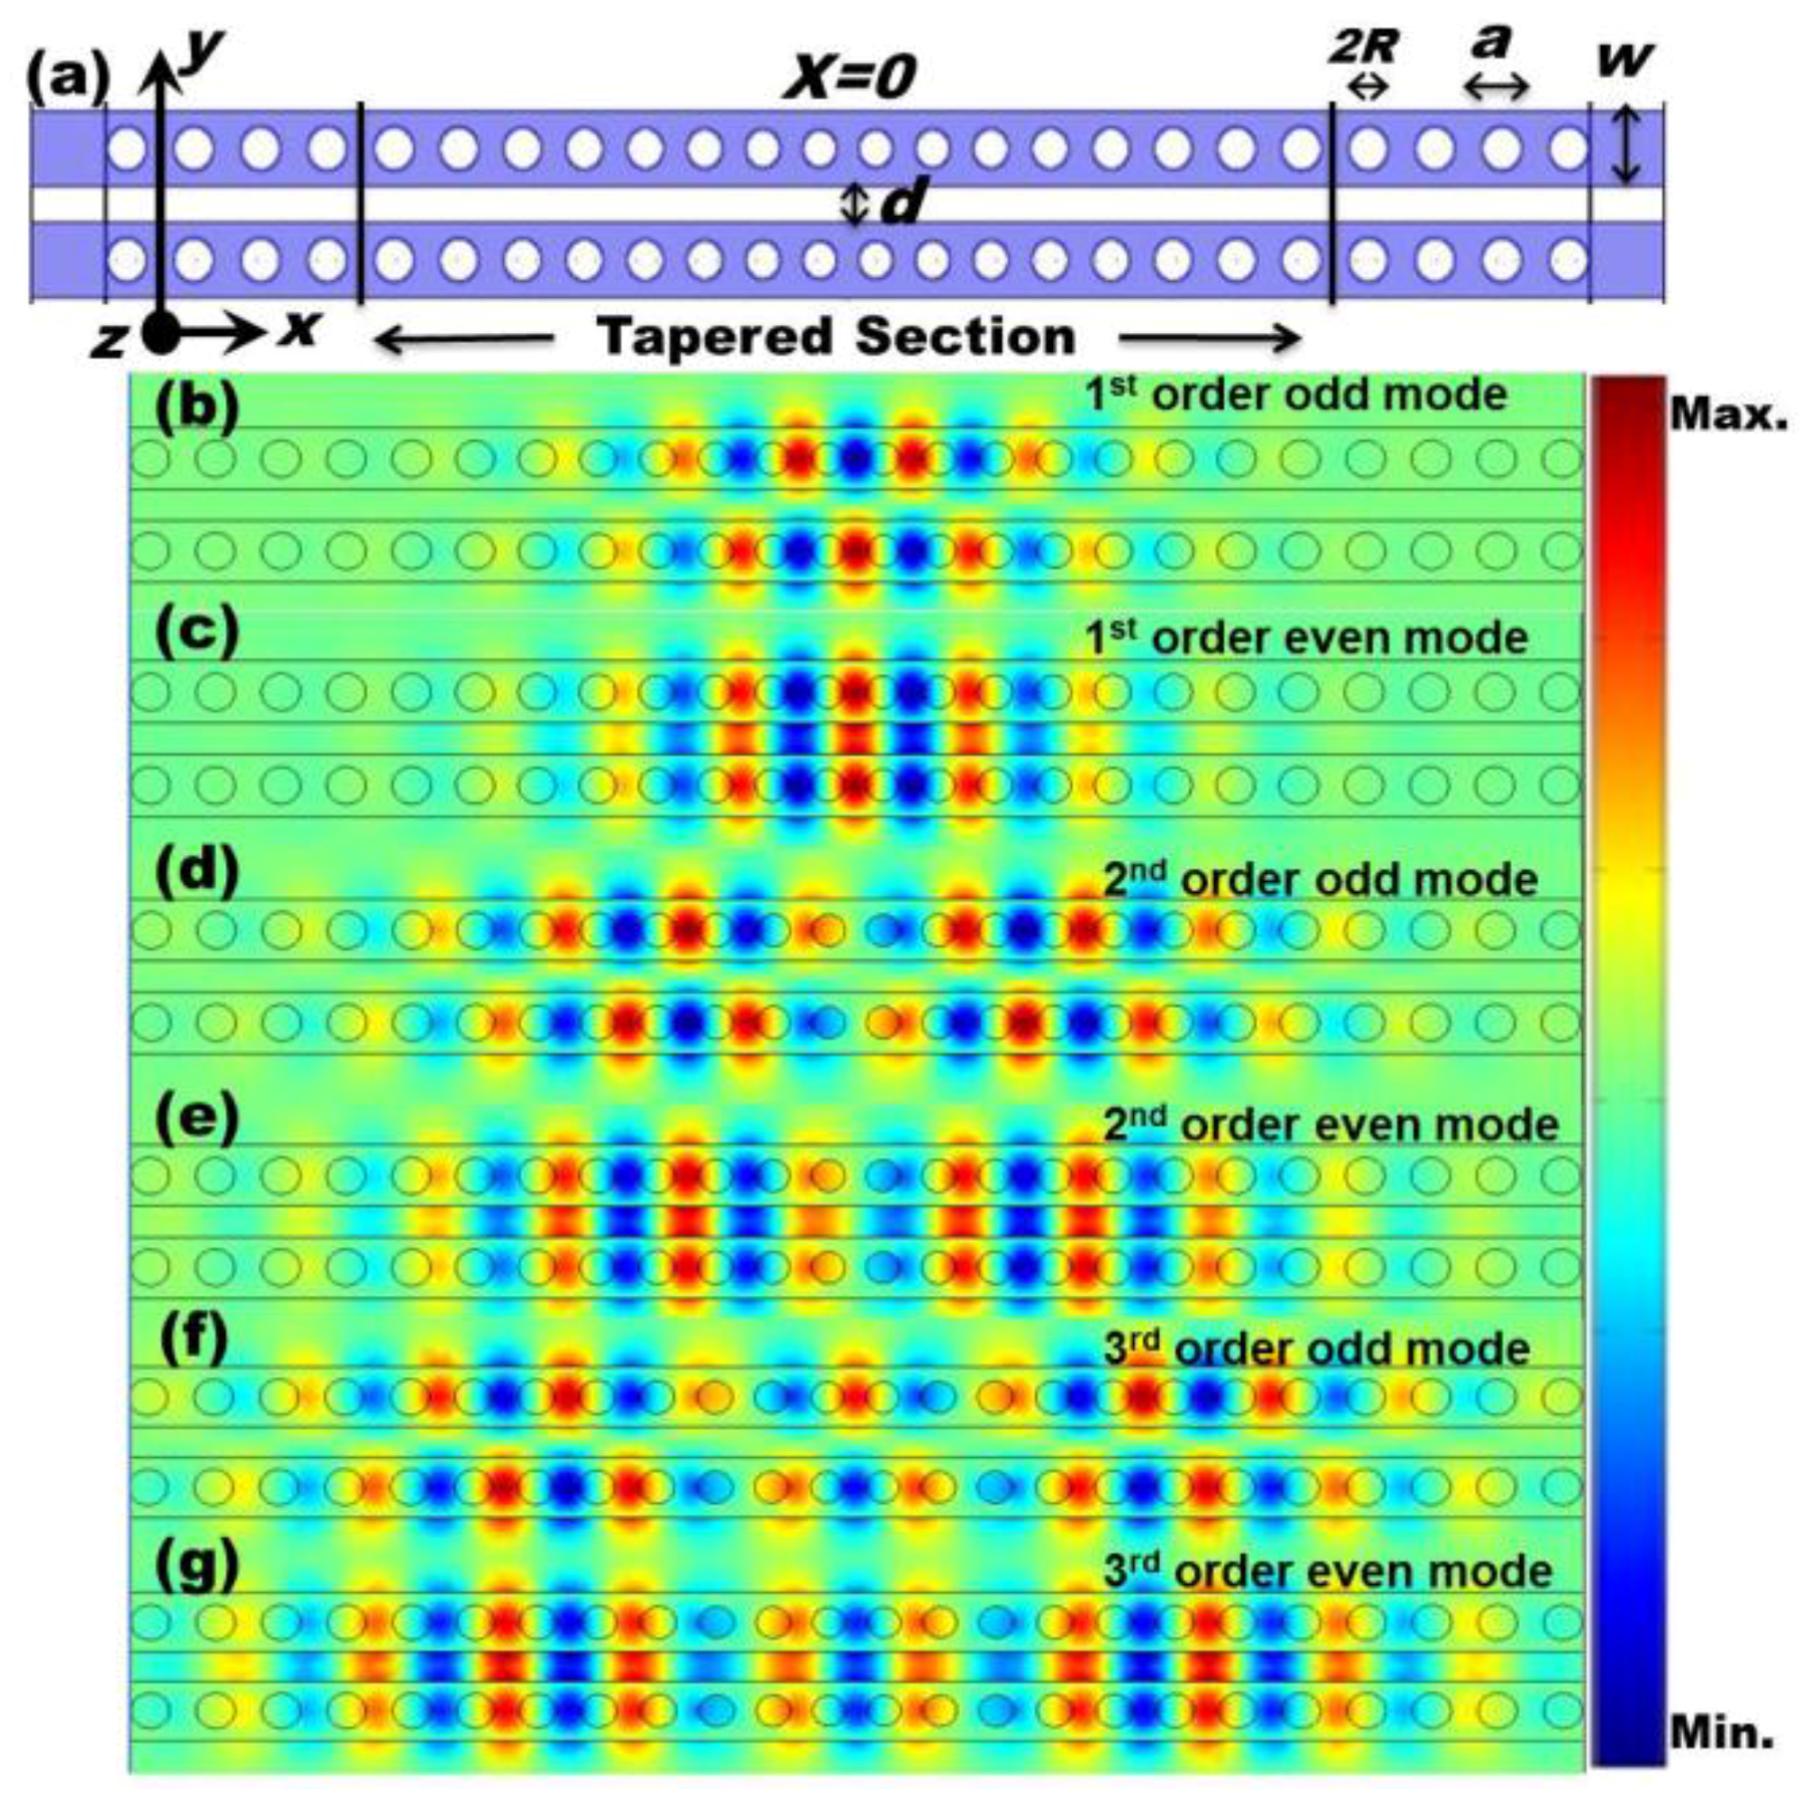
2.2. Coupled PhC NB Cavity


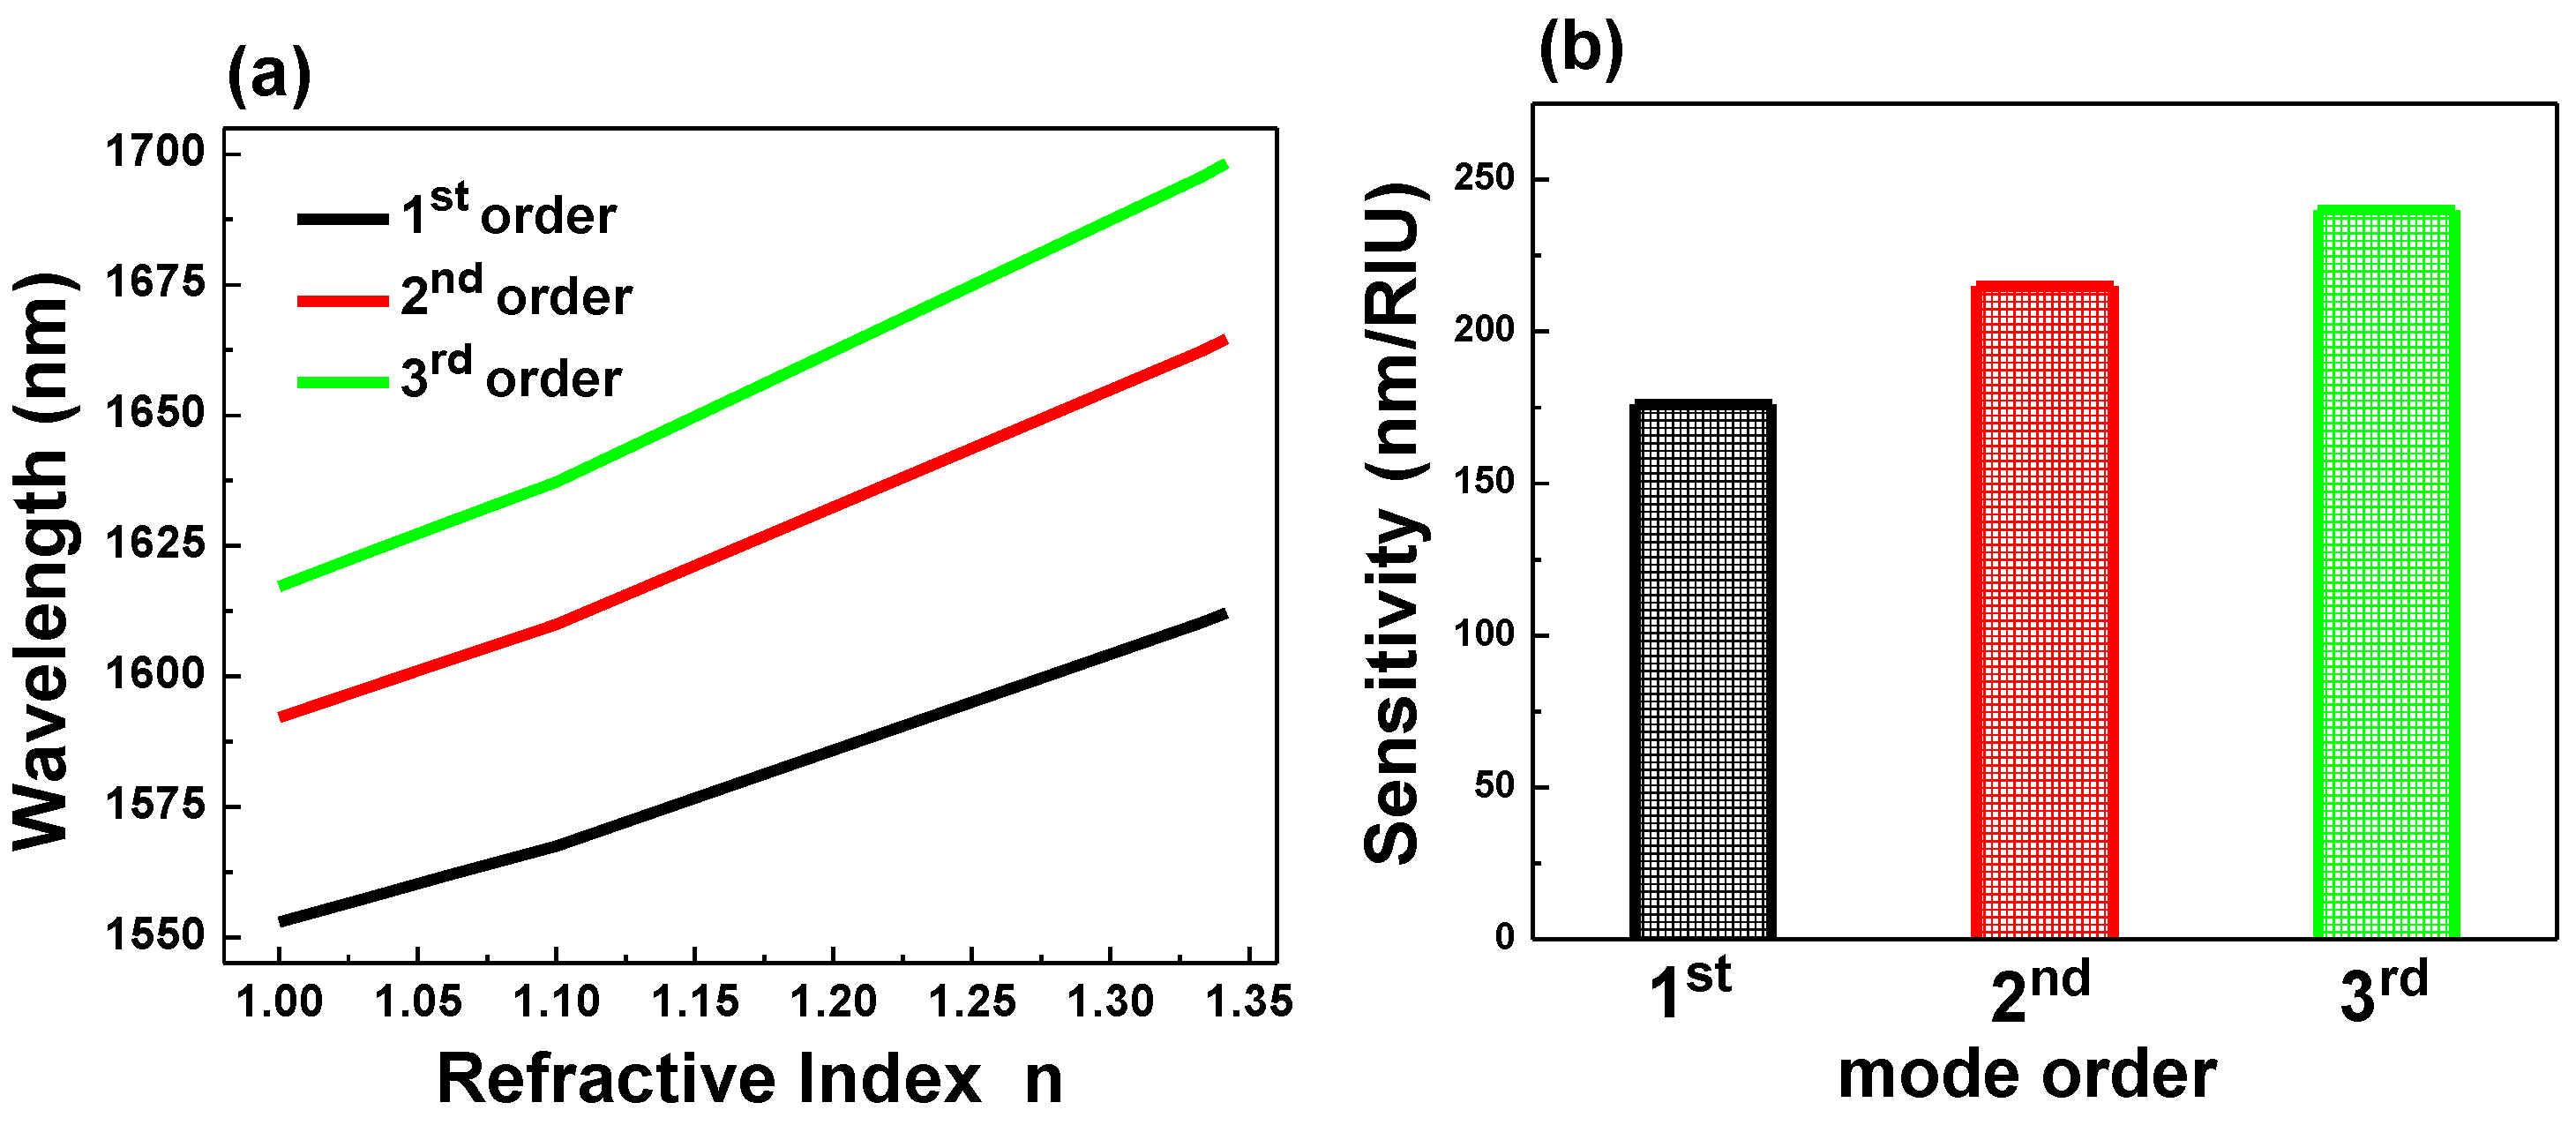
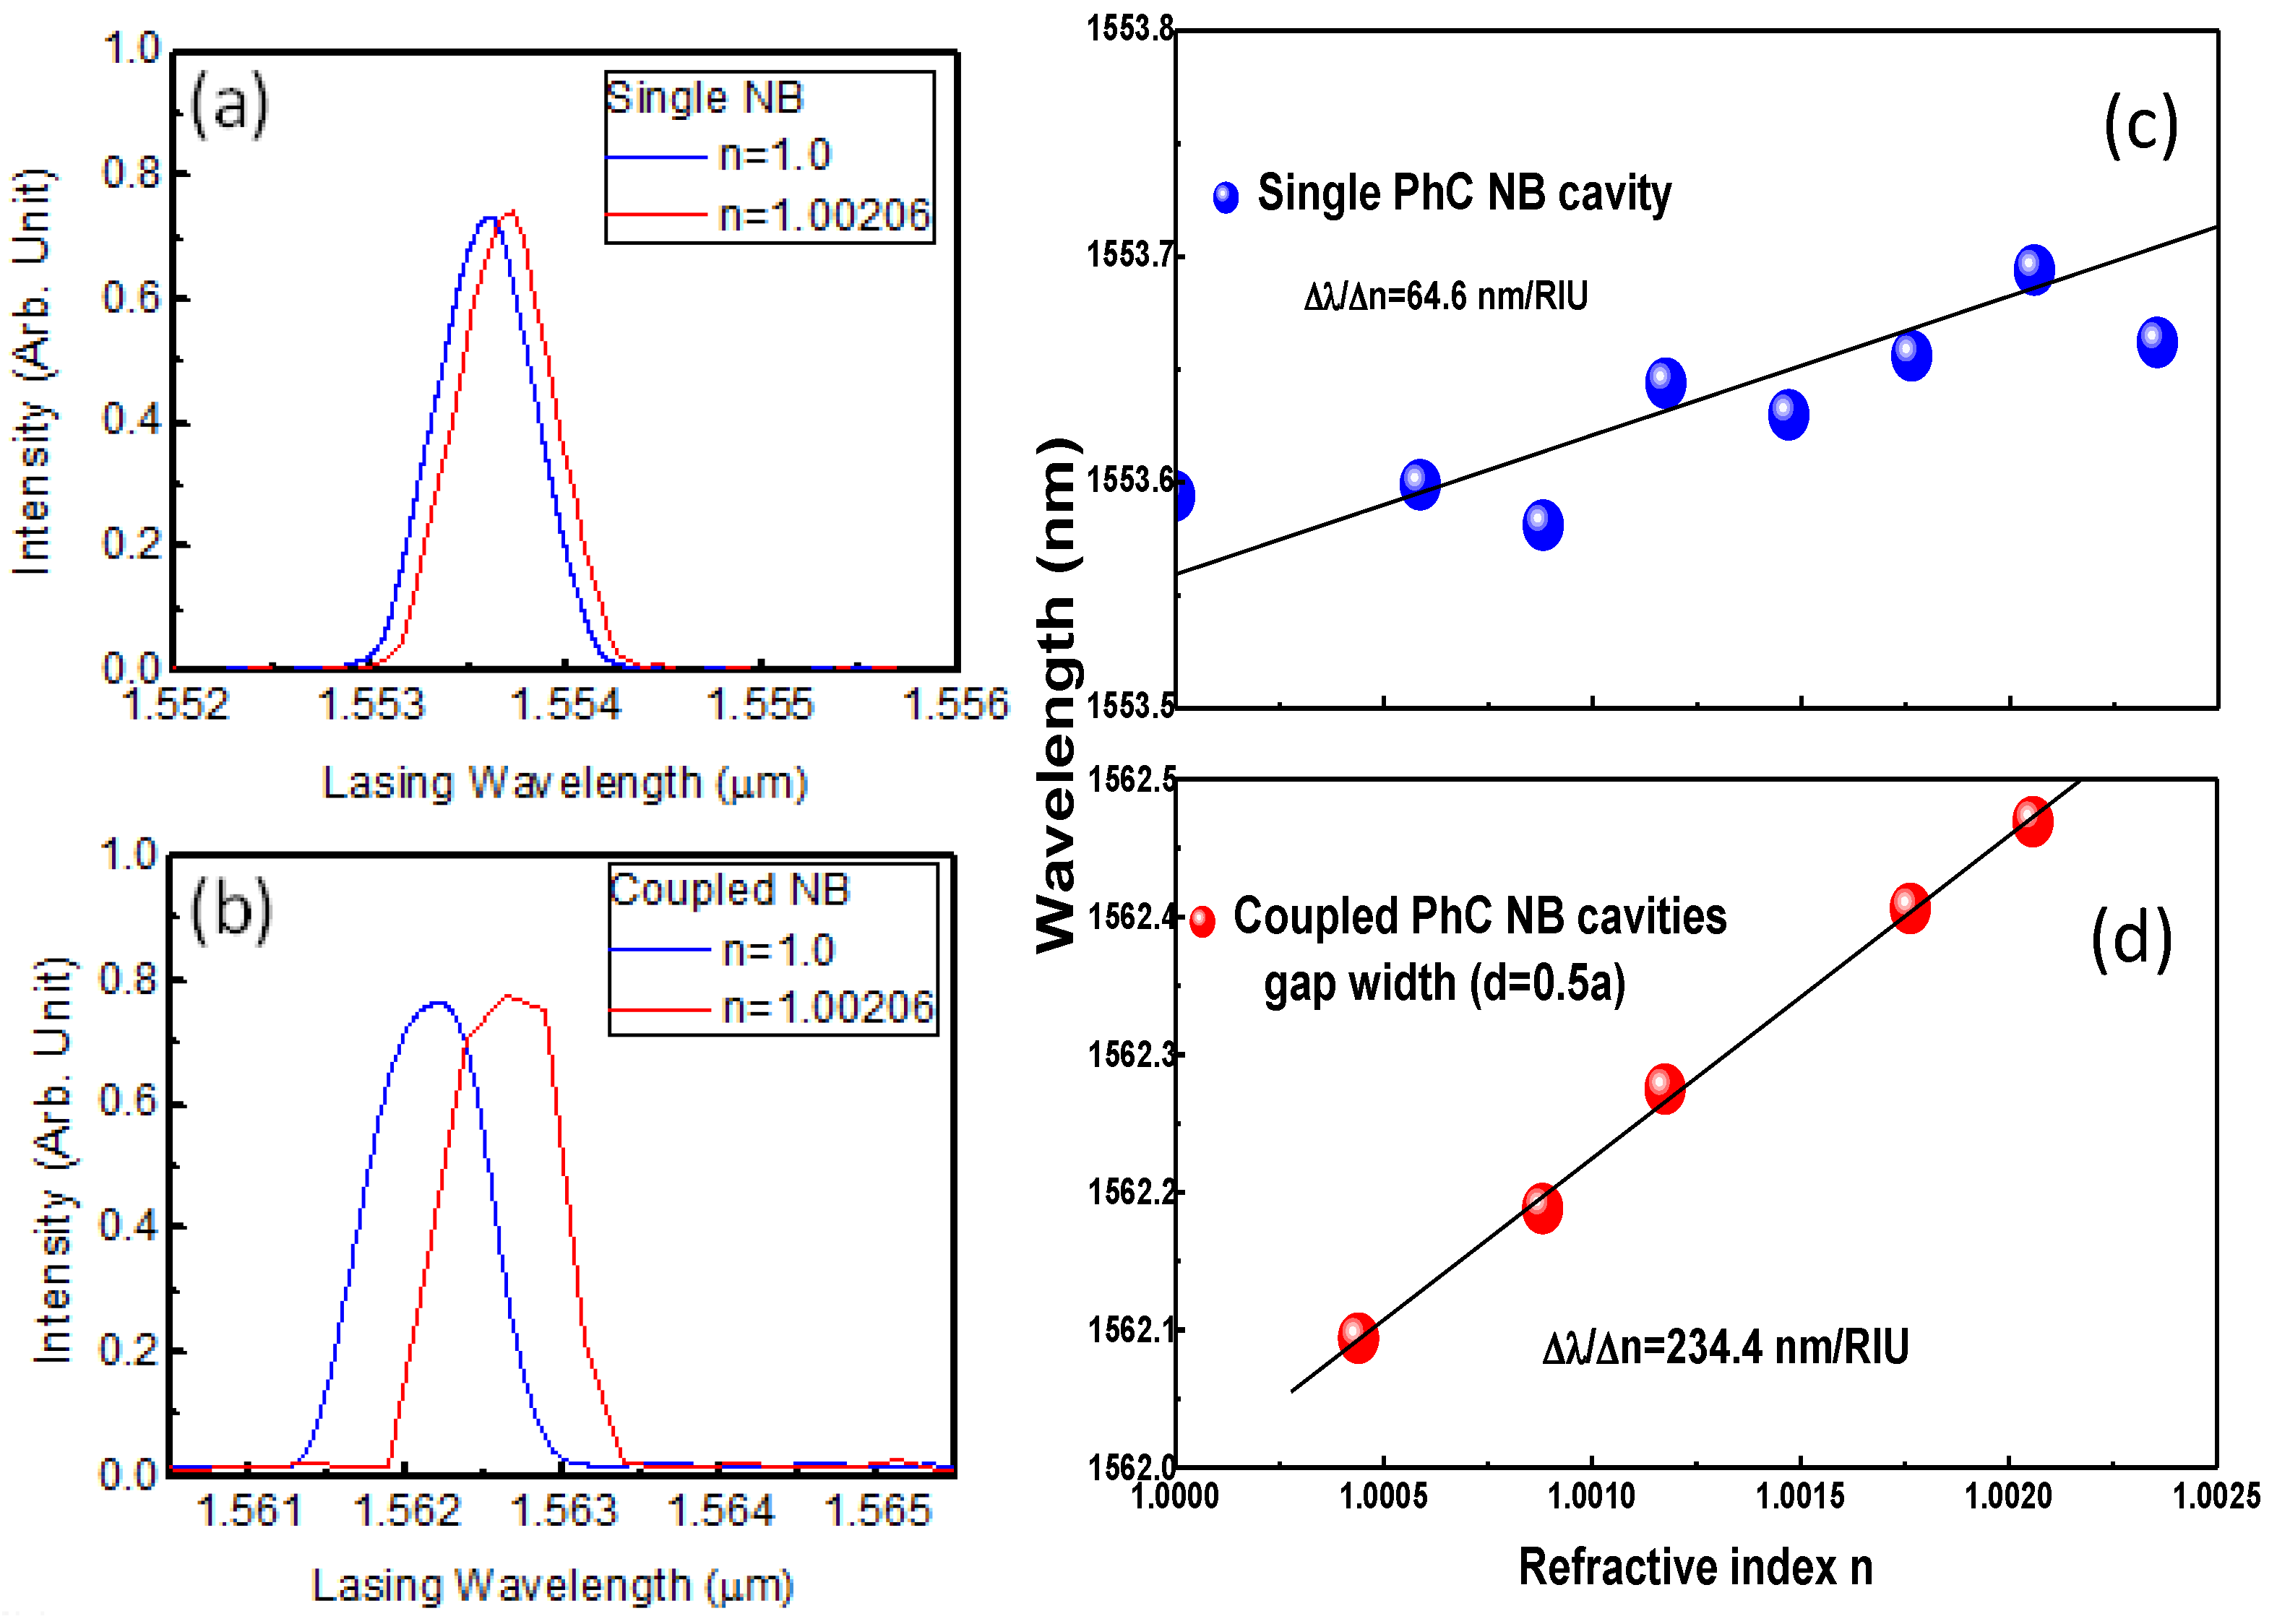
2.3. Sensitivity Calculation of the Single PhC NB Cavity
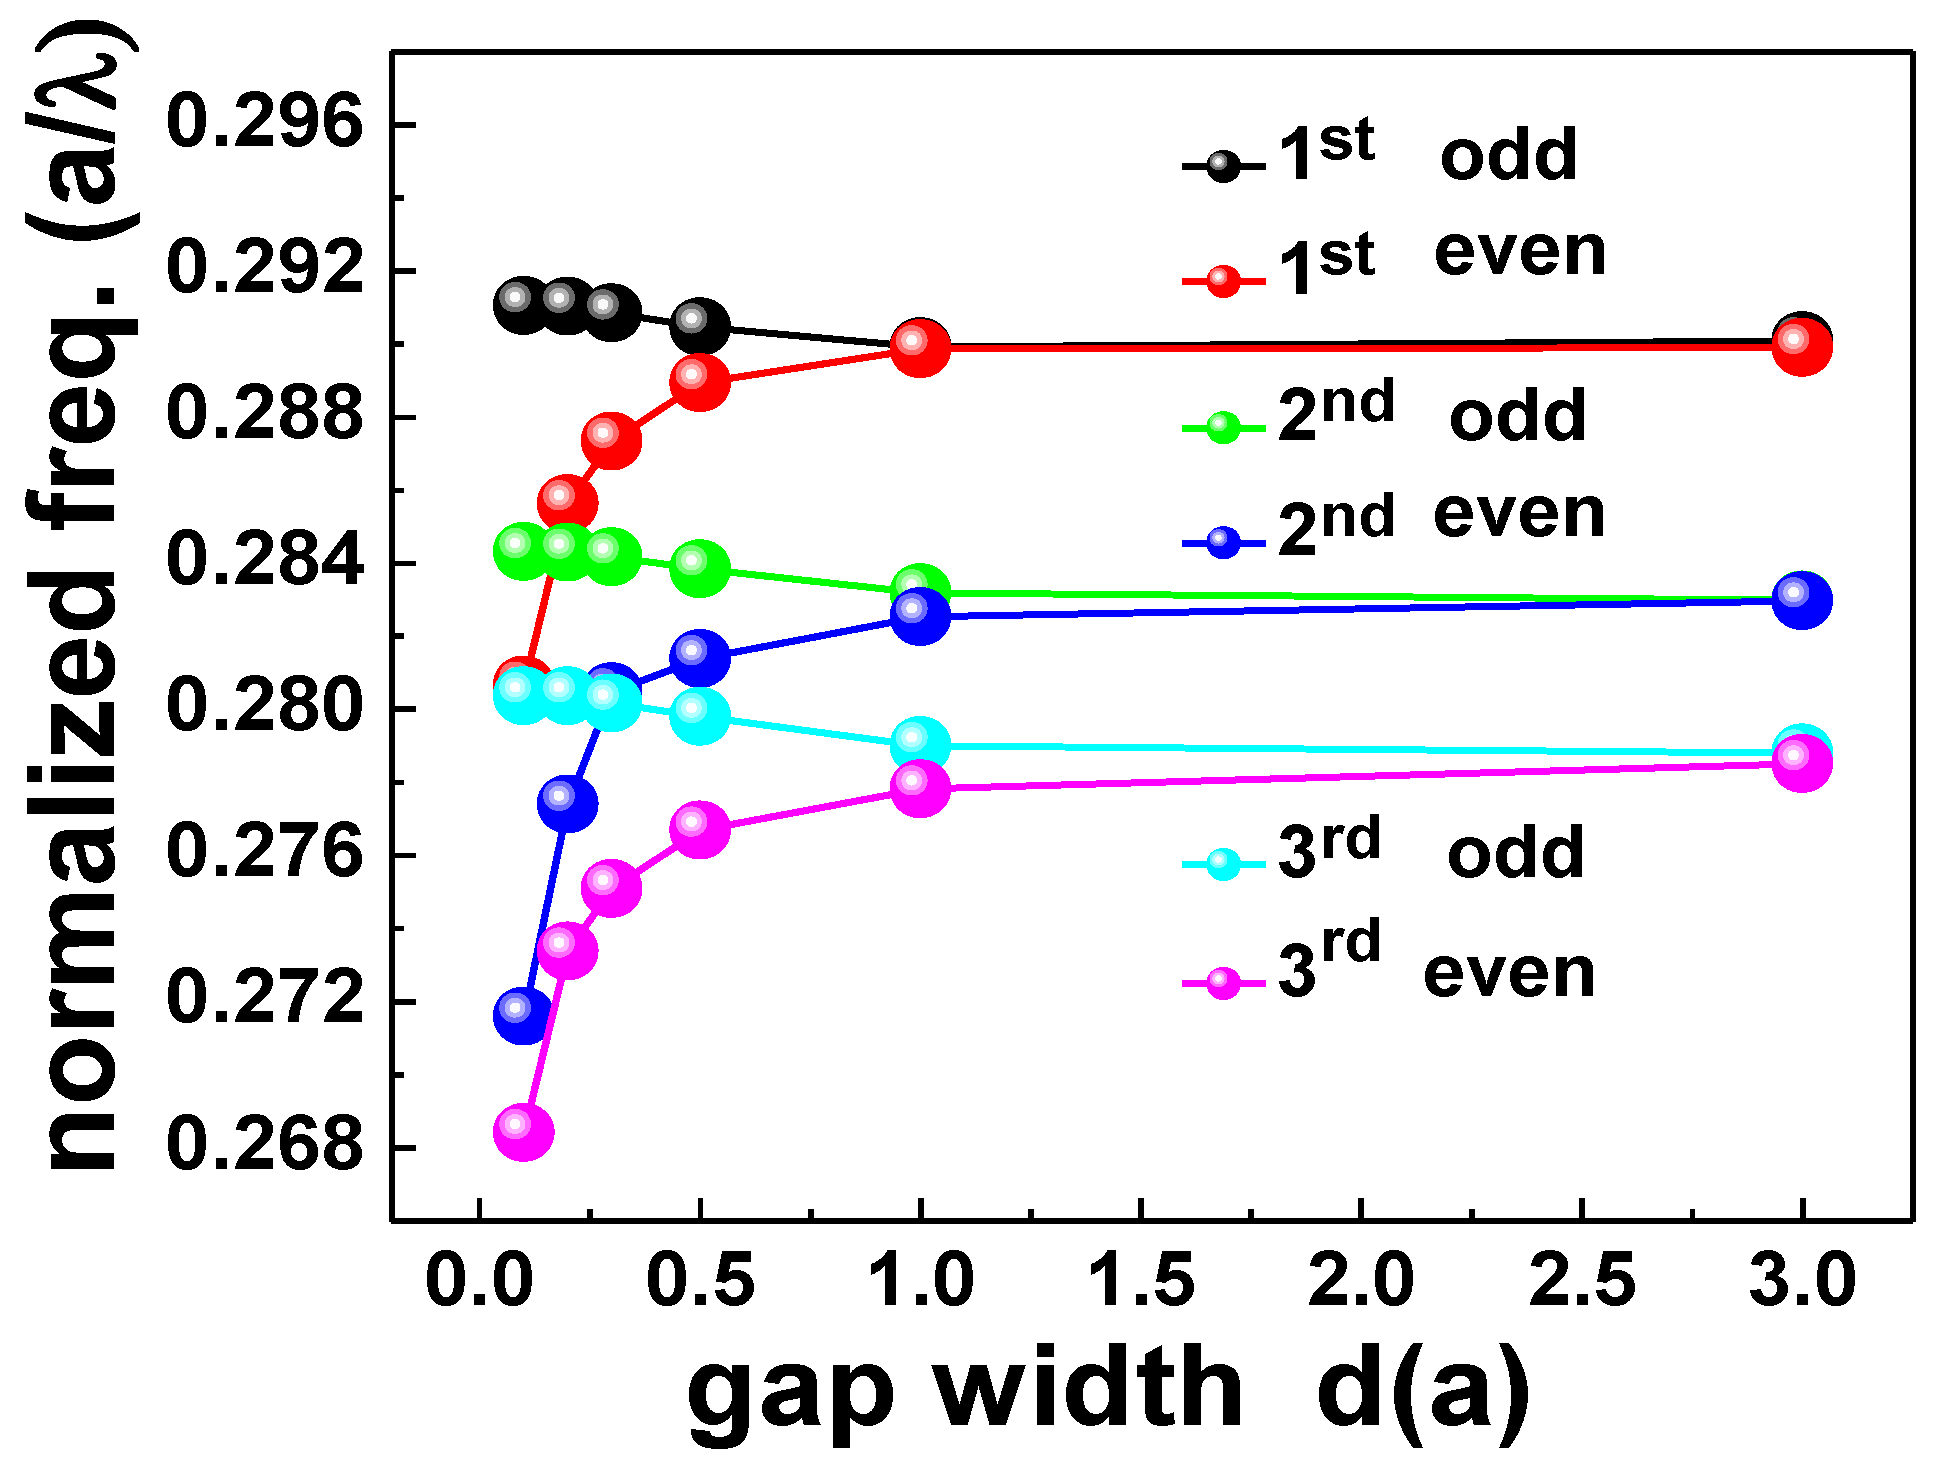
2.4. Sensitivity Calculation of the Coupled PhC NB Cavity


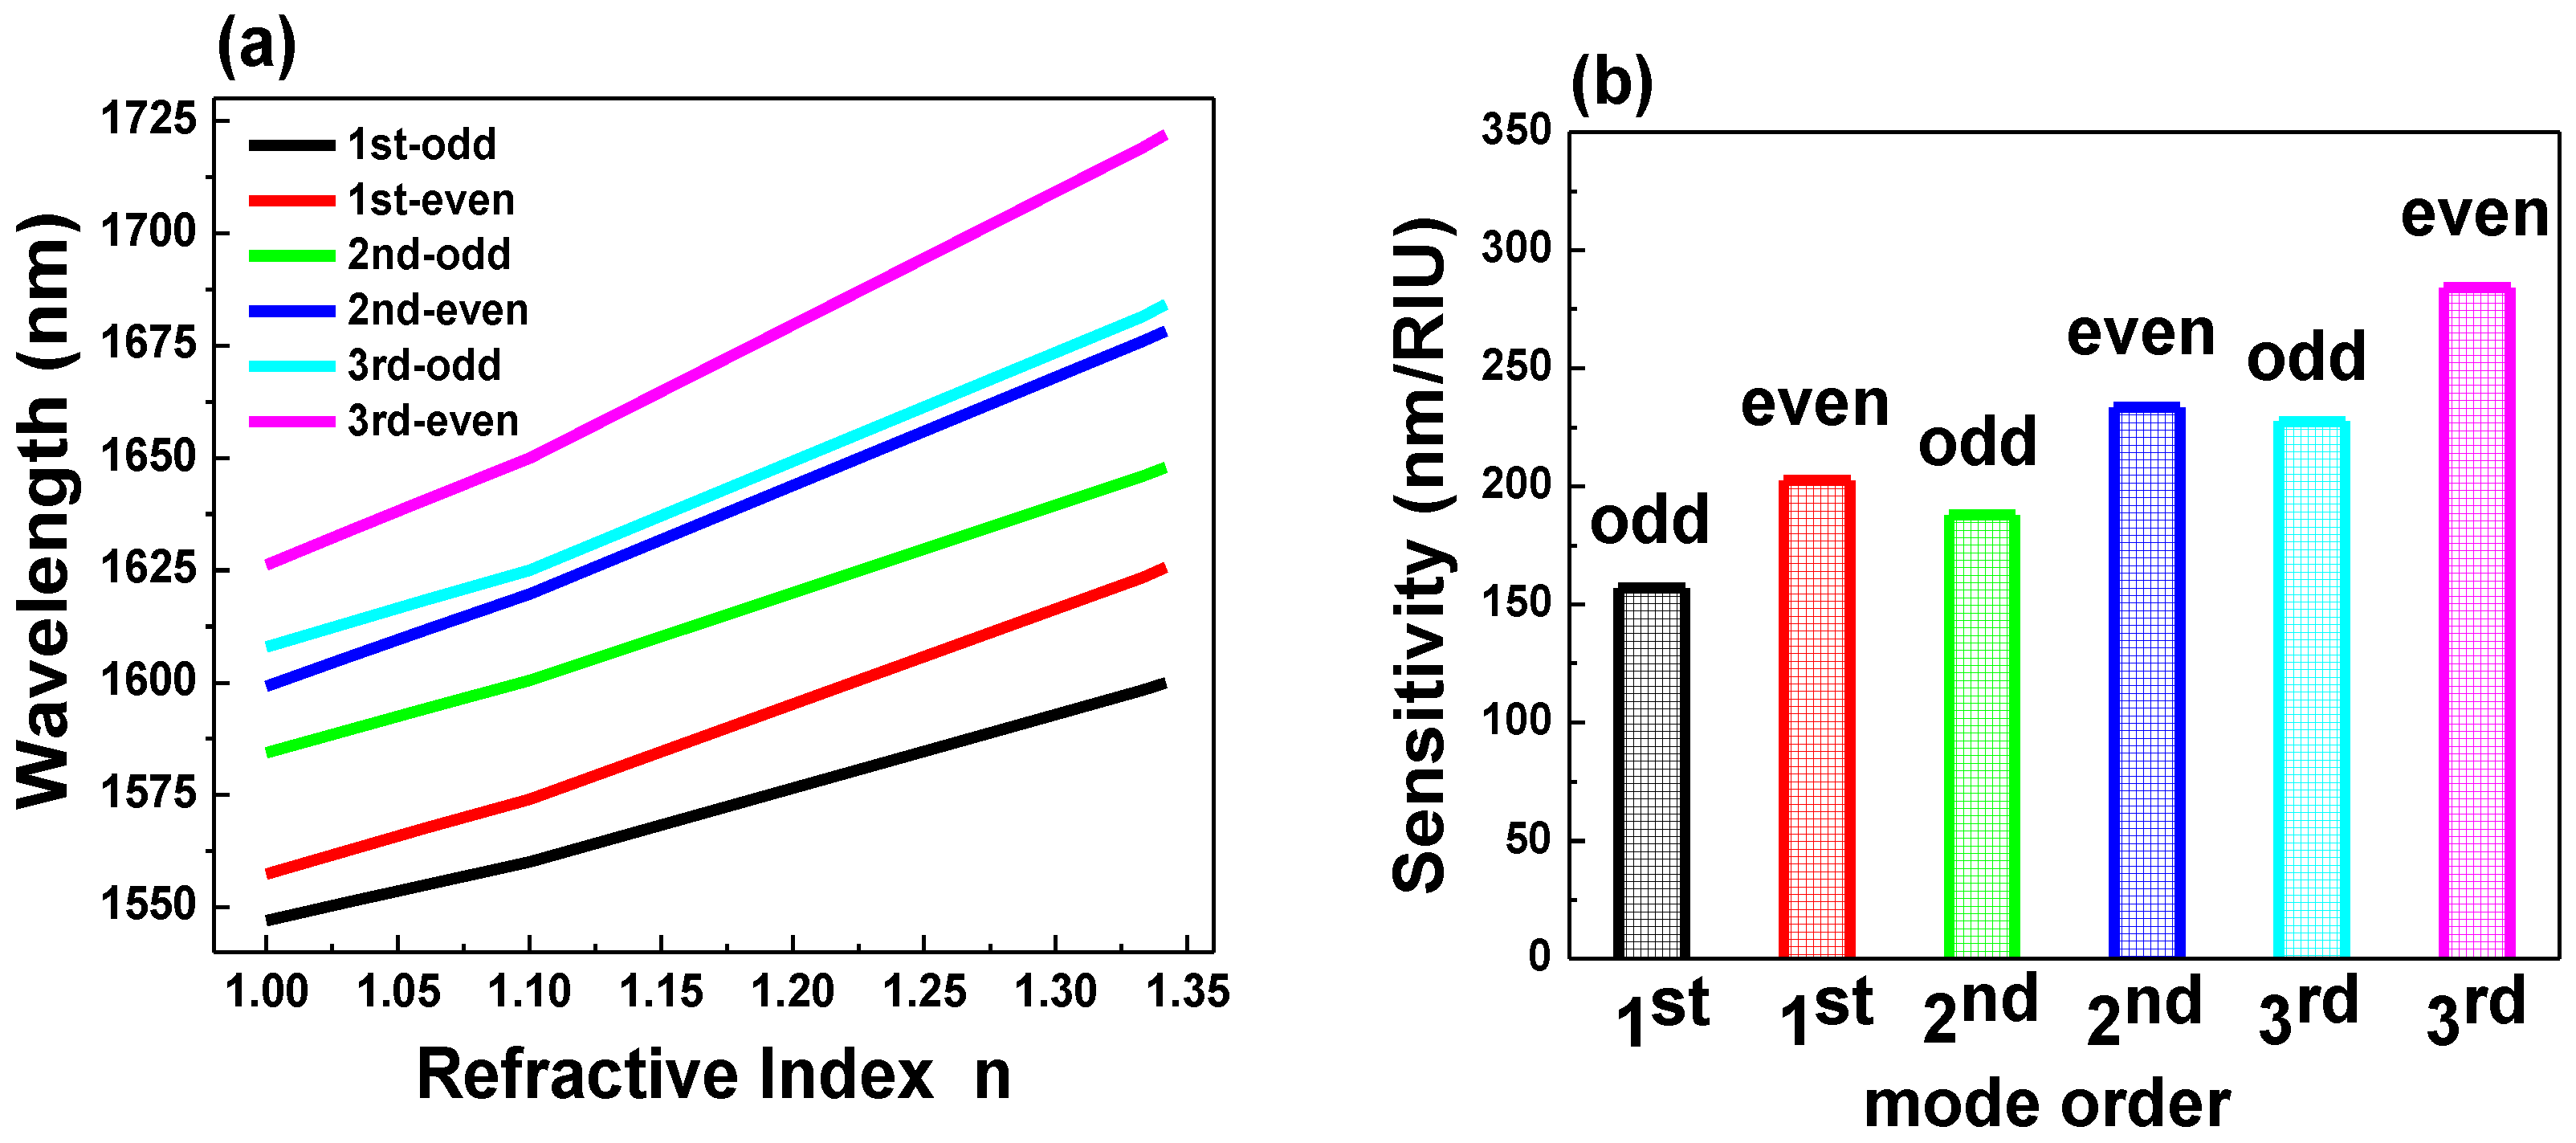
| Structure | Single PhC NB | Coupled PhC NB (Even Modes) | ||||
|---|---|---|---|---|---|---|
| Mode order | 1st | 2nd | 3rd | 1st | 2nd | 3rd |
| Sensitivity (nm/RIU) | 176 | 215 | 240 | 203 | 234 | 284 |
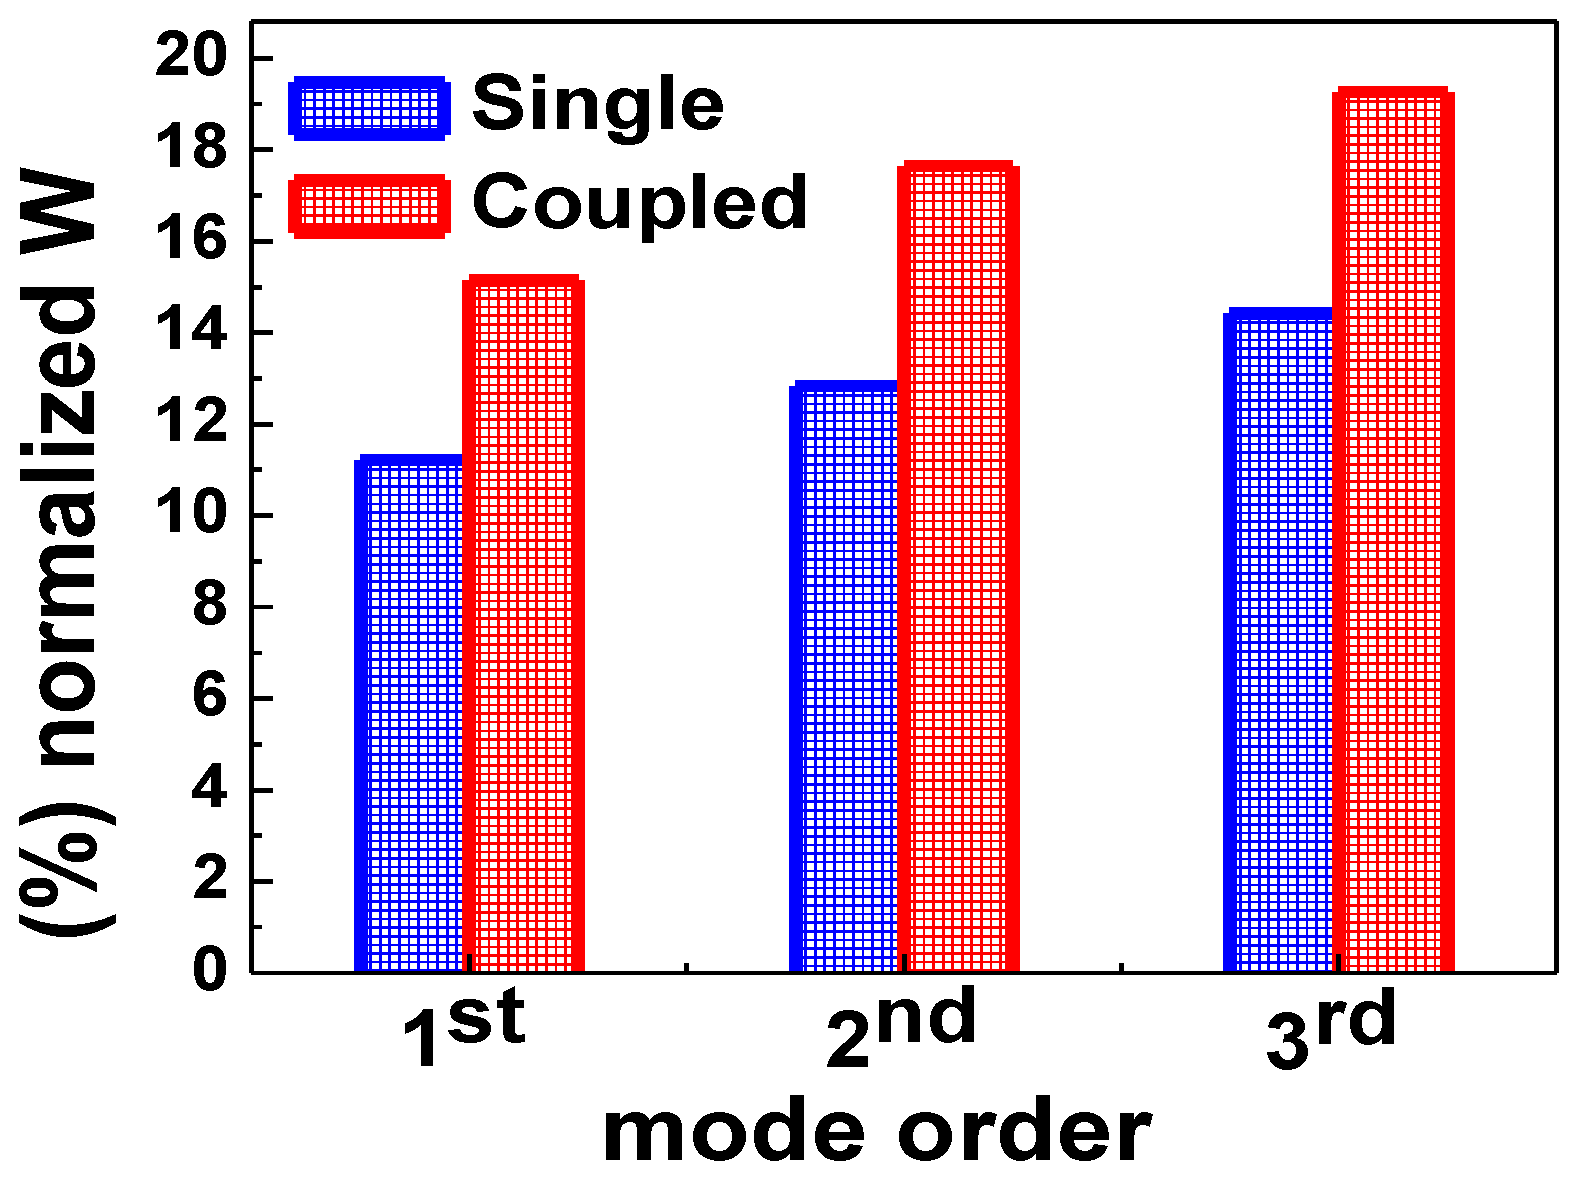
| Normalized Energy in air (%) | 11.2 | 12.8 | 14.4 | 15.2 | 17.6 | 19.4 |
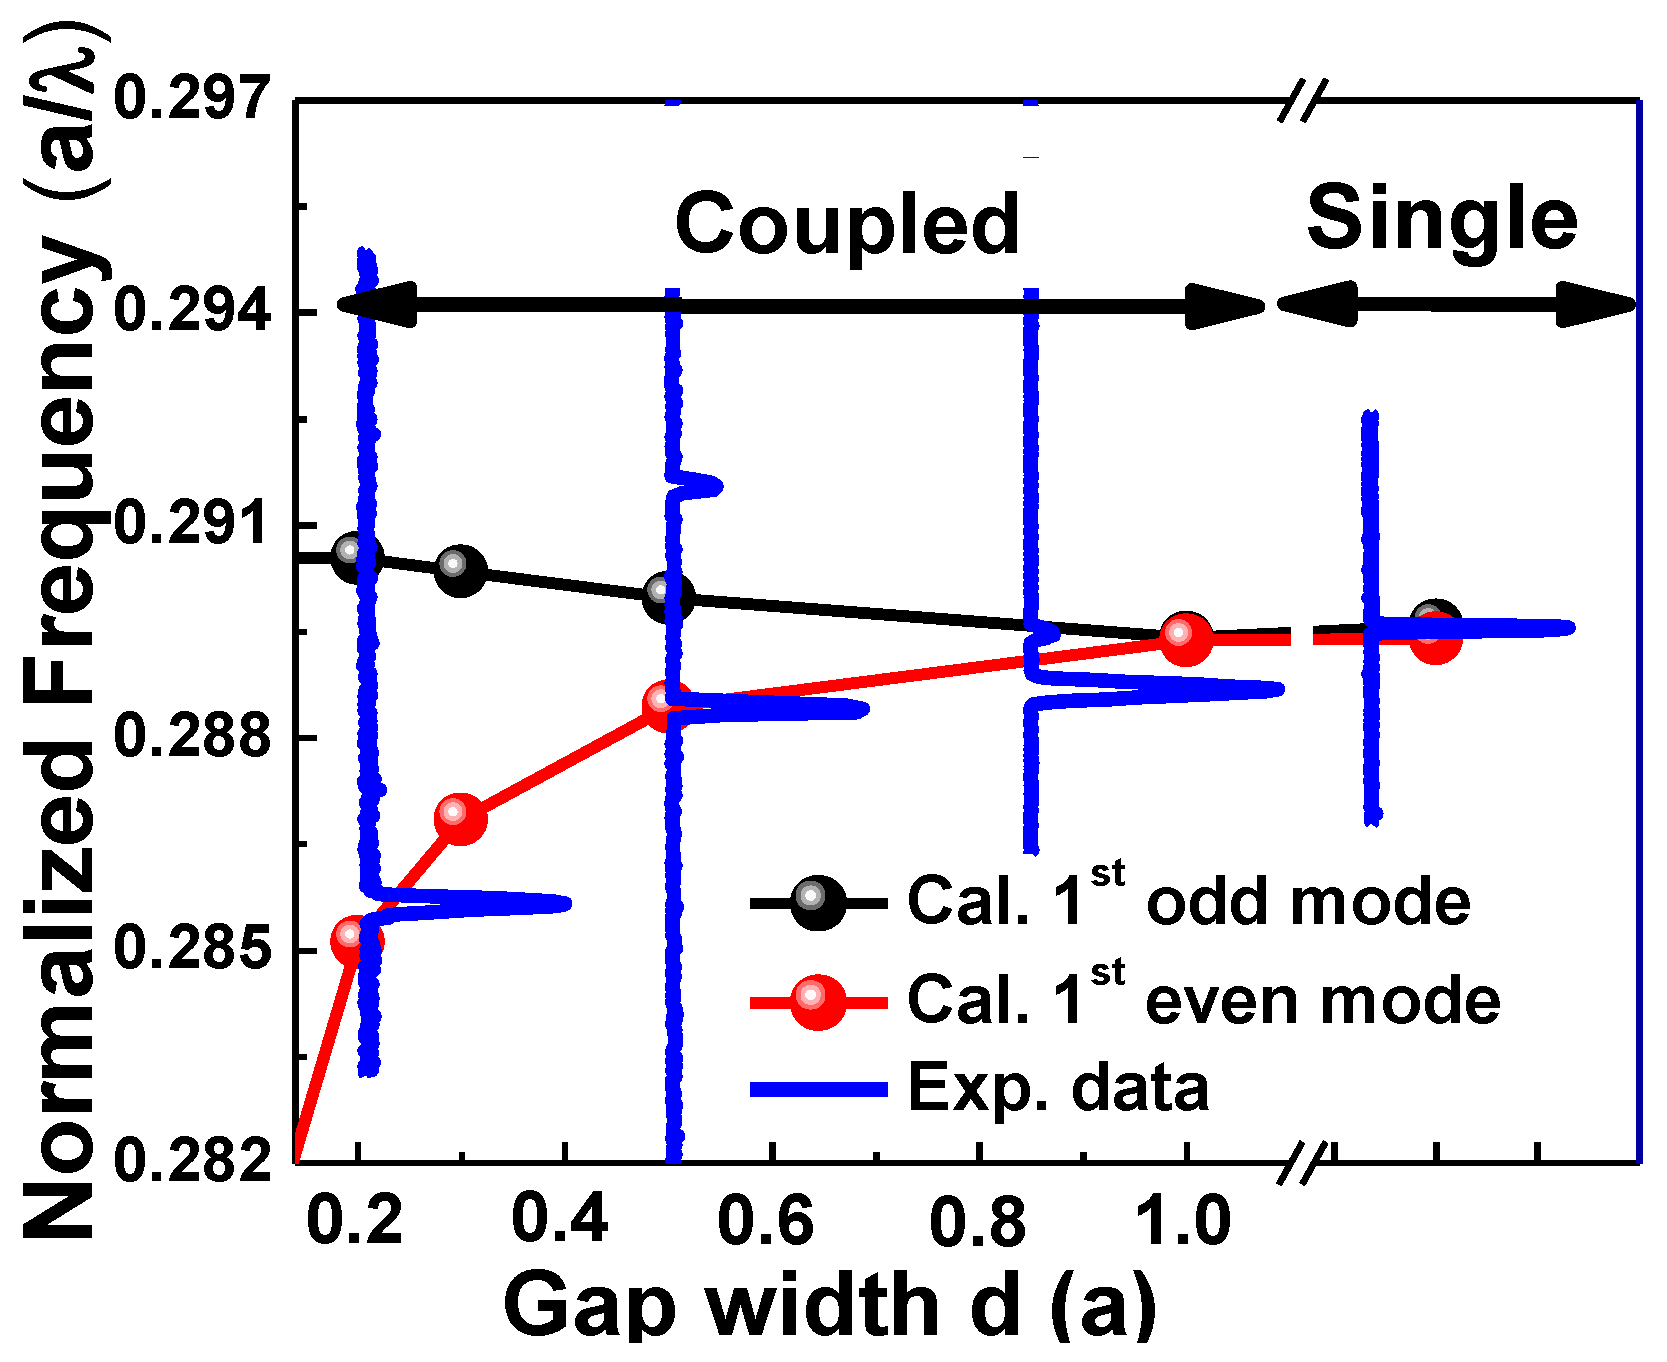
| Normalized frequency (a/λ) of the fundamental mode | 0.2900 (Cal. & Exp.) | 0.28896 (Cal. & Exp. at gap width d = 0.5a) | ||||
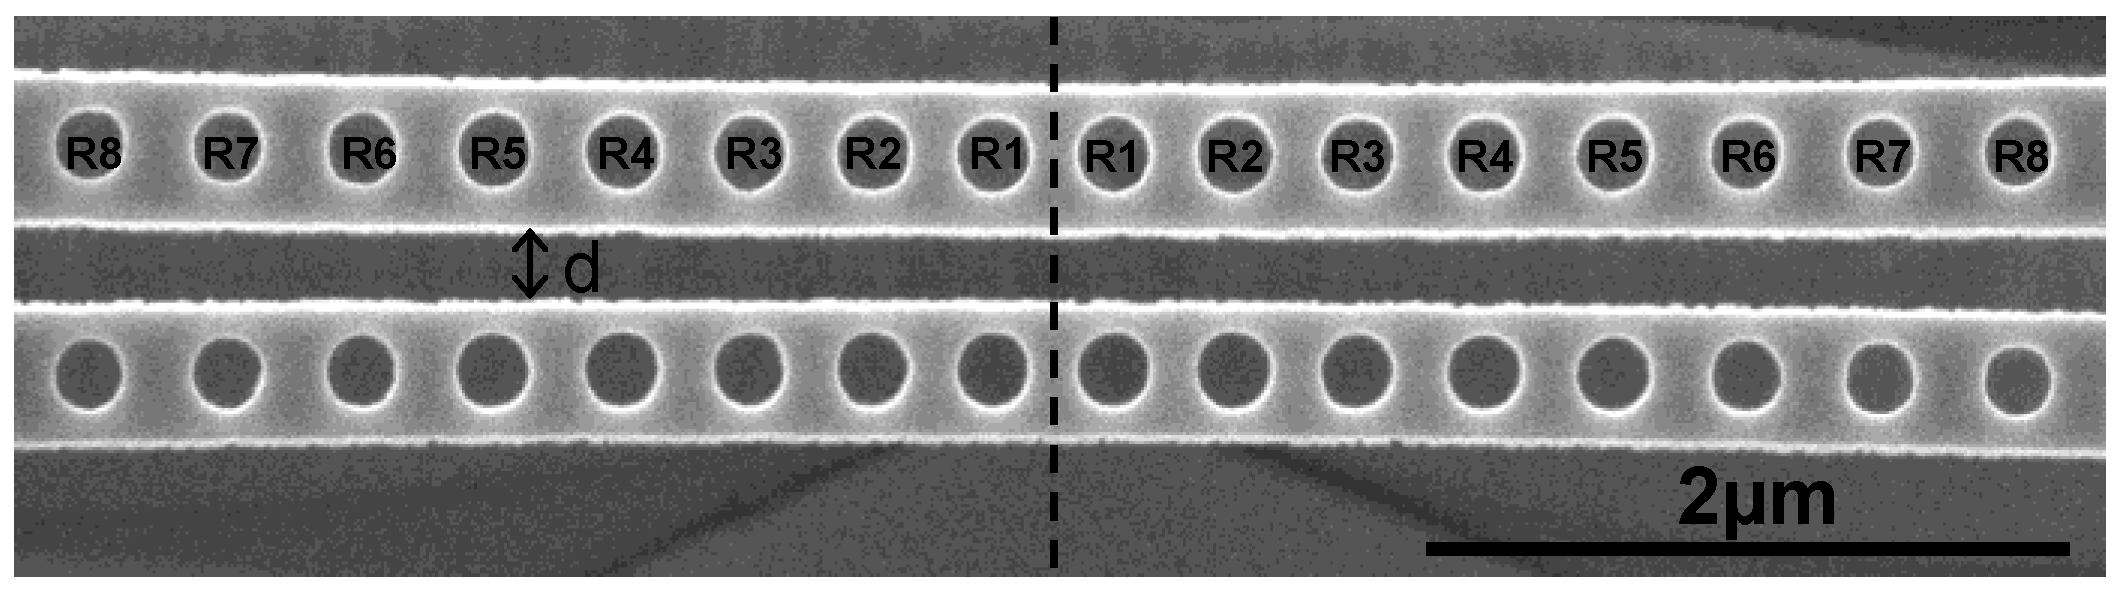
3. Fabrication and Optical Characterization


| Structure | Sensitivity S(Δλ/Δn) [nm.RIU−1] | Line-Width (δλ) [nm] | FOM (S/δλ) |
|---|---|---|---|
| PhC waveguide [45] | 88 | ||
| 1D-PhC cavity array [46] | 130 | ~0.78 | ~166 |
| Ho-cavity array [23] | 115 | ~0.78 | ~147 |
| 1D-PhC array [47] | 480 | ~10.33 | ~46.4 |
| 2D-PhC [48] | 510 | 10.0 | 51 |
| Slot PhC NB waveguides [43] | 700 | ~2.8 | ~250 |
| Slotted 2D-PhC [15] | 1538 | ~0.41 | ~3751.2 |
| Hybrid resonator [40] | 120 | ||
| Microring resonator [40] | 65 | ||
| Single PhCNB | 65 | ~0.45 | ~145 |
| Coupled PhCNB | 234 | ~0.63 | ~372 |
4. Conclusions
Acknowledgments
Author Contributions
Conflicts of Interest
References
- Ymeti, A.; Greve, J.; Lambeck, P.V.; Wink, T.; van Hovell, S.W.F.M.; Beumer, T.A.M.; Wijn, R.R.; Heideman, R.G.; Subramaniam, V.; Kanger, J.S. Fast, Ultrasensitive Virus Detection Using a Young Interferometer Sensor. Nano Lett. 2007, 7, 394–397. [Google Scholar] [CrossRef] [PubMed]
- Wu, S.Y.; Ho, H.P.; Law, W.C.; Lin, C.; Kong, S.K. Highly sensitive differential phase-sensitive surface plasmon resonance biosensor based on the Mach–Zehnder configuration. Opt. Lett. 2004, 29, 2378–2380. [Google Scholar] [CrossRef] [PubMed]
- Iqbal, M.; Gleeson, M.A.; Spaugh, B.; Tybor, F.; Gunn, W.G.; Hochberg, M.; Baehr-Jones, T.; Bailey, R.C.; Gunn, L.C. Label-Free Biosensor Arrays Based on Silicon Ring Resonators and High-Speed Optical Scanning Instrumentation. IEEE J. Sel. Top. Quantum Electrodyn. 2010, 16, 654–661. [Google Scholar] [CrossRef]
- De Vos, K.; Bartolozzi, I.; Schacht, E.; Bienstman, P.; Baets, R. Silicon-on-Insulator microring resonator for sensitive and label-free biosensing. Opt. Express 2007, 15, 7610–7615. [Google Scholar] [CrossRef] [PubMed]
- Mayer, K.M.; Lee, S.; Liao, H.; Rostro, B.C.; Fuentes, A.; Scully, P.T.; Nehl, C.L.; Hafner, J.H. A Label-Free Immunoassay Based Upon Localized Surface Plasmon Resonance of Gold Nanorods. ACS Nano 2008, 2, 687–692. [Google Scholar] [CrossRef] [PubMed]
- Kausaite-Minkstimiene, A.; Ramanaviciene, A.; Ramanavicius, A. Surface plasmon resonance biosensor for direct detection of antibodies against human growth hormone. Analyst 2009, 134, 2051–2057. [Google Scholar] [CrossRef] [PubMed]
- Carlborg, C.F.; Gylfason, K.B.; Kazmierczak, A.; Dortu, F.; Banuls Polo, M.J.; Maquieira Catala, A.; Kresbach, G.M.; Sohlstrom, H.; Moh, T.; Vivien, L. A packaged optical slot-waveguide ring resonator sensor array for multiplex label-free assays in labs-on-chips. Lab Chip 2010, 10, 257–396. [Google Scholar] [CrossRef] [PubMed]
- Banuls, M.-J.; Gonzalez-Pedro, V.; Barrios, C.A.; Puchades, R.; Maquieira, A. Selective chemical modification of silicon nitride/silicon oxide nanostructures to develop label-free biosensors. Biosens. Bioelectron. 2010, 25, 1460–1466. [Google Scholar] [CrossRef] [PubMed]
- Orosco, M.M.; Pacholski, C.; Miskelly, G.M.; Sailor, M.J. Protein-Coated Porous-Silicon Photonic Crystals for Amplified Optical Detection of Protease Activity. Adv. Mat. 2006, 18, 1393–1396. [Google Scholar] [CrossRef]
- Mandal, S.; Goddard, J.M.; Erickson, D.A. A multiplexed optofluidic biomolecular sensor for low mass detection. Lab Chip 2009, 9, 2924–2932. [Google Scholar] [CrossRef] [PubMed]
- Guo, Y.; Ye, J.Y.; Divin, C.; Huang, B.; Thomas, T.P.; Baker, J.R.; Norris, T.B. Real-Time Biomolecular Binding Detection Using a Sensitive Photonic Crystal Biosensor. Anal. Chem. 2010, 82, 5211–5218. [Google Scholar] [CrossRef] [PubMed]
- Lidstone, E.A.; Chaudhery, V.; Kohl, A.; Chan, V.; Wolf-Jensen, T.; Schook, L.B.; Bashir, R.; Cunningham, B.T. Label-free imaging of cell attachment with photonic crystal enhanced Microscopy. Analyst 2011, 136, 3608–3615. [Google Scholar] [CrossRef] [PubMed]
- Hennessy, K.; Badolato, A.; Winger, M.; Gerace, D.; Atatüre, M.; Gulde, S.; Fält, S.; Hu, E.L.; Imamoglu, A. Quantum nature of a strongly coupled single quantum dot–cavity system. Nature 2007, 445, 896–899. [Google Scholar] [CrossRef] [PubMed]
- Psaltis, D.; Quake, S.R.; Yang, C. Developing optofluidic technology through the fusion of microfluidics and optics. Nature 2006, 442, 381–386. [Google Scholar] [CrossRef] [PubMed]
- Di Falco, A.; O’Faolain, L.; Krauss, T.F. Chemical sensing in slotted photonic crystal heterostructure cavities. Appl. Phys. Lett. 2009, 94. [Google Scholar] [CrossRef]
- Jagerska, J.; Zhang, H.; Diao, Z.; le Thomas, N.; Houdre, R. Refractive index sensing with an air-slot photonic crystal nanocavity. Opt. Lett. 2010, 35, 2523–2525. [Google Scholar] [PubMed]
- Kita, S.; Nozaki, K.; Baba, T. Refractive index sensing utilizing a cw photonic crystal nanolaser and its array configuration. Opt. Express 2008, 16, 8174–8180. [Google Scholar] [CrossRef] [PubMed]
- McCutcheon, M.W.; Lončar, M. Design of a silicon nitride photonic crystal nanocavity with a Quality factor of one million for coupling to a diamond nanocrystal. Opt. Express 2008, 16, 19136–19145. [Google Scholar] [CrossRef] [PubMed]
- Loncar, M.; Scherer, A.; Qiu, Y. Photonic crystal laser sources for chemical detection. Appl. Phys. Lett. 2003, 82, 4648–4651. [Google Scholar] [CrossRef]
- Chow, E.; Grot, A.; Mirkarimi, I.W.; Sigalas, M.; Girolami, G. Ultracompact biochemical sensor built with two-dimensional photonic crystal microcavity. Opt. Lett. 2004, 29, 1093–1095. [Google Scholar] [CrossRef] [PubMed]
- Xu, T.; Zhu, N.; Xu, M.Y.-C.; Wosinski, L.; Aitchison, J.S.; Ruda, H.E. Pillar-array based optical sensor. Opt. Express 2010, 18, 5420–5425. [Google Scholar] [CrossRef] [PubMed]
- Kang, C.; Phare, C.T.; Vlasov, Y.A.; Assefa, S.; Weiss, S.M. Photonic crystal slab sensor with enhanced surface area. Opt. Express 2010, 18, 27930–27937. [Google Scholar] [CrossRef] [PubMed]
- Yang, D.; Tian, H.; Ji, Y. Nanoscale photonic crystal sensor arrays on monolithic substrates using side-coupled resonant cavity arrays. Opt. Express 2011, 19, 20023–20034. [Google Scholar] [CrossRef] [PubMed]
- Lai, W.; Chakravarty, S.; Zou, Y.; Chen, R.T. Silicon nano-membrane based photonic crystal microcavities for high sensitivity bio-sensing. Opt. Lett. 2012, 37, 1208–1210. [Google Scholar] [CrossRef] [PubMed]
- Lai, W.; Chakravarty, S.; Zou, Y.; Guo, Y.; Chen, R.T. Slow light enhanced sensitivity of resonance modes in photonic crystal biosensors. Appl. Phys. Lett. 2013, 102. [Google Scholar] [CrossRef] [PubMed]
- Yao, K.; Shi, Y. High-Q width modulated photonic crystal stack mode-gap cavity and its application to refractive index sensing. Opt. Express 2010, 20, 27039–27044. [Google Scholar] [CrossRef] [PubMed]
- Armaroli, A.; Morand, A.; Benech, P.; Bellanca, G.; Trillo, S. Comparative Analysis of a Planar Slotted Microdisk Resonator. J. Lightw. Technol. 2008, 27, 4009–4016. [Google Scholar] [CrossRef]
- Sherry, L.J.; Chang, S.; Schatz, G.C.; van Duyne, R.P. Localized Surface Plasmon Resonance Spectroscopy of Single Silver Nanocubes. Nano Lett. 2005, 5, 2034–2038. [Google Scholar] [CrossRef] [PubMed]
- Villeneuve, P.R.; Fan, S.; Joannopoulos, J.D.; Lim, K.-Y.; Petrich, G.S.; Kolodziejski, L.A.; Reif, R. Air-bridge microcavities. Appl. Phys. Lett. 1995, 67, 167–169. [Google Scholar] [CrossRef]
- Notomi, M.; Kuramochi, E.; Taniyama, H. Ultrahigh-Q Nanocavity with 1D Photonic Gap. Opt. Express 2008, 16, 11095–11102. [Google Scholar] [CrossRef] [PubMed]
- Deotare, P.B.; McCutcheon, M.W.; Frank, I.W.; Khan, M.; Loncar, M. High quality factor photonic crystal nanobeam cavities. Appl. Phys. Lett. 2009, 94, 121106. [Google Scholar] [CrossRef]
- Ahn, B.-H.; Kang, J.-H.; Kim, M.-K.; Song, J.-H.; Min, B.; Kim, K.-S.; Lee, Y.-H. One-dimensional parabolic-beam photonic crystal laser. Opt. Express 2010, 18, 5654–5660. [Google Scholar] [CrossRef] [PubMed]
- Kuramochi, E.; Taniyama, H.; Tanabe, T.; Kawasaki, K.; Roh, Y.-G.; Notomi, M. Ultrahigh-Q one-dimensional photonic crystal nanocavities with modulated mode-gap barriers on SiO2 claddings and on air claddings. Opt. Express 2010, 18, 15859–15869. [Google Scholar] [CrossRef] [PubMed]
- BRichards, C.; Hendrickson, J.; Olitzky, J.D.; Gibson, R.; Gehl, M.; Kieu, K.; Khankhoje, U.K.; Homyk, A.; Scherer, A.; Kim, J.-Y.; et al. Characterization of 1D photonic crystal nanobeam cavities using curved microfiber. Opt. Express 2010, 18, 20558–20564. [Google Scholar] [CrossRef] [PubMed]
- Gong, Y.; Ellis, B.; Shambat, G.; Sarmiento, T.; Harris, J.S.; Vuckovic, J. Nanobeam photonic crystal cavity quantum dot laser. Opt. Express 2010, 18, 8781–8789. [Google Scholar] [CrossRef] [PubMed]
- Quan, Q.; Loncar, M. Deterministic design of wavelength scale, ultra-high Q photonic crystal nanobeam cavities. Opt. Express 2011, 19, 18529–18542. [Google Scholar] [CrossRef] [PubMed]
- Zhang, Y.; McCutcheon, M.W.; Burgess, I.B.; Loncar, M. Ultra-high-Q TE/TM dual-polarized photonic crystal nanocavities. Opt. Lett. 2009, 34, 2694–2696. [Google Scholar] [CrossRef] [PubMed]
- Foubert, K.; Lalouat, L.; Cluzel, B.; Picard, E.; Peyrade, D.; de Fornel, F.; Hadji, E. An air-slotted nanoresonator relying on coupled high Q small V Fabry-Perot Nanocavities. Appl. Phys. Lett. 2009, 94. [Google Scholar] [CrossRef]
- Notomi, M.; Taniyama, H. On-demand ultrahigh-Q cavity formation and photon pinning via dynamic waveguide tuning. Opt. Express 2008, 16, 18657–18666. [Google Scholar] [CrossRef] [PubMed]
- Ciminelli, C.; Dell’Olio, F.; Conteduca, D.; Campanella, C.M.; Armenise, M.N. High performance SOI microring resonator for biochemical sensing. Opt. Laser Technol. 2014, 59, 60–67. [Google Scholar] [CrossRef]
- Estevez, M.-C.; Alvarez, M.; Lechuga, L.M. Integrated optical devices for lab-on-a-chip biosensing applications. Laser Photonics Rev. 2011. [Google Scholar] [CrossRef] [Green Version]
- Ciminelli, C.; Campanella, C.M.; Dell’Olio, F.; Campanella, C.E.; Armenise, M.N. Label-free optical resonant sensors for biochemical applications. Progress Quantum Electron. 2013, 37, 51–107. [Google Scholar] [CrossRef]
- Wang, B.; Dündar, M.A.; Nötzel, R.; Karouta, F.; He, S.; van der Heijden, R.W. Photonic crystal slot nanobeam slow light waveguides for refractive index sensing. App. Phys. Lett. 2010, 97. [Google Scholar] [CrossRef]
- Edlén, B. The Refractive Index of Air. Metrologia 1966, 2, 71–80. [Google Scholar] [CrossRef]
- Buswell, S.C.; Wright, V.A.; Buriak, J.M.; Van, V.; Evoy, S. Specific detection of proteins using photonic crystal waveguides. Opt. Express 2008, 16, 15949–15957. [Google Scholar] [CrossRef] [PubMed]
- Mandal, S.; Erickson, D. Nanoscale optofluidic sensor arrays. Opt. Express 2008, 16, 1623–1631. [Google Scholar] [CrossRef] [PubMed]
- Nunes, P.S.; Mortensen, N.A.; Kutter, J.P.; Mogensen, K.B. Photonic crystal resonator integrated in a microfluidic system. Opt. Lett. 2008, 33, 1623–1625. [Google Scholar] [CrossRef] [PubMed]
- Huang, M.; Yanik, A.A.; Chang, T.-Y.; Altug, H. Sub-wavelength nanofluidics in photonic crystal Sensors. Opt. Express 2009, 17, 24224–24233. [Google Scholar] [CrossRef] [PubMed]
© 2015 by the authors; licensee MDPI, Basel, Switzerland. This article is an open access article distributed under the terms and conditions of the Creative Commons Attribution license (http://creativecommons.org/licenses/by/4.0/).
Share and Cite
Yaseen, M.T.; Yang, Y.-C.; Shih, M.-H.; Chang, Y.-C. Optimization of High-Q Coupled Nanobeam Cavity for Label-Free Sensing. Sensors 2015, 15, 25868-25881. https://doi.org/10.3390/s151025868
Yaseen MT, Yang Y-C, Shih M-H, Chang Y-C. Optimization of High-Q Coupled Nanobeam Cavity for Label-Free Sensing. Sensors. 2015; 15(10):25868-25881. https://doi.org/10.3390/s151025868
Chicago/Turabian StyleYaseen, Mohammad Tariq, Yi-Chun Yang, Min-Hsiung Shih, and Yia-Chung Chang. 2015. "Optimization of High-Q Coupled Nanobeam Cavity for Label-Free Sensing" Sensors 15, no. 10: 25868-25881. https://doi.org/10.3390/s151025868