3. Experiments
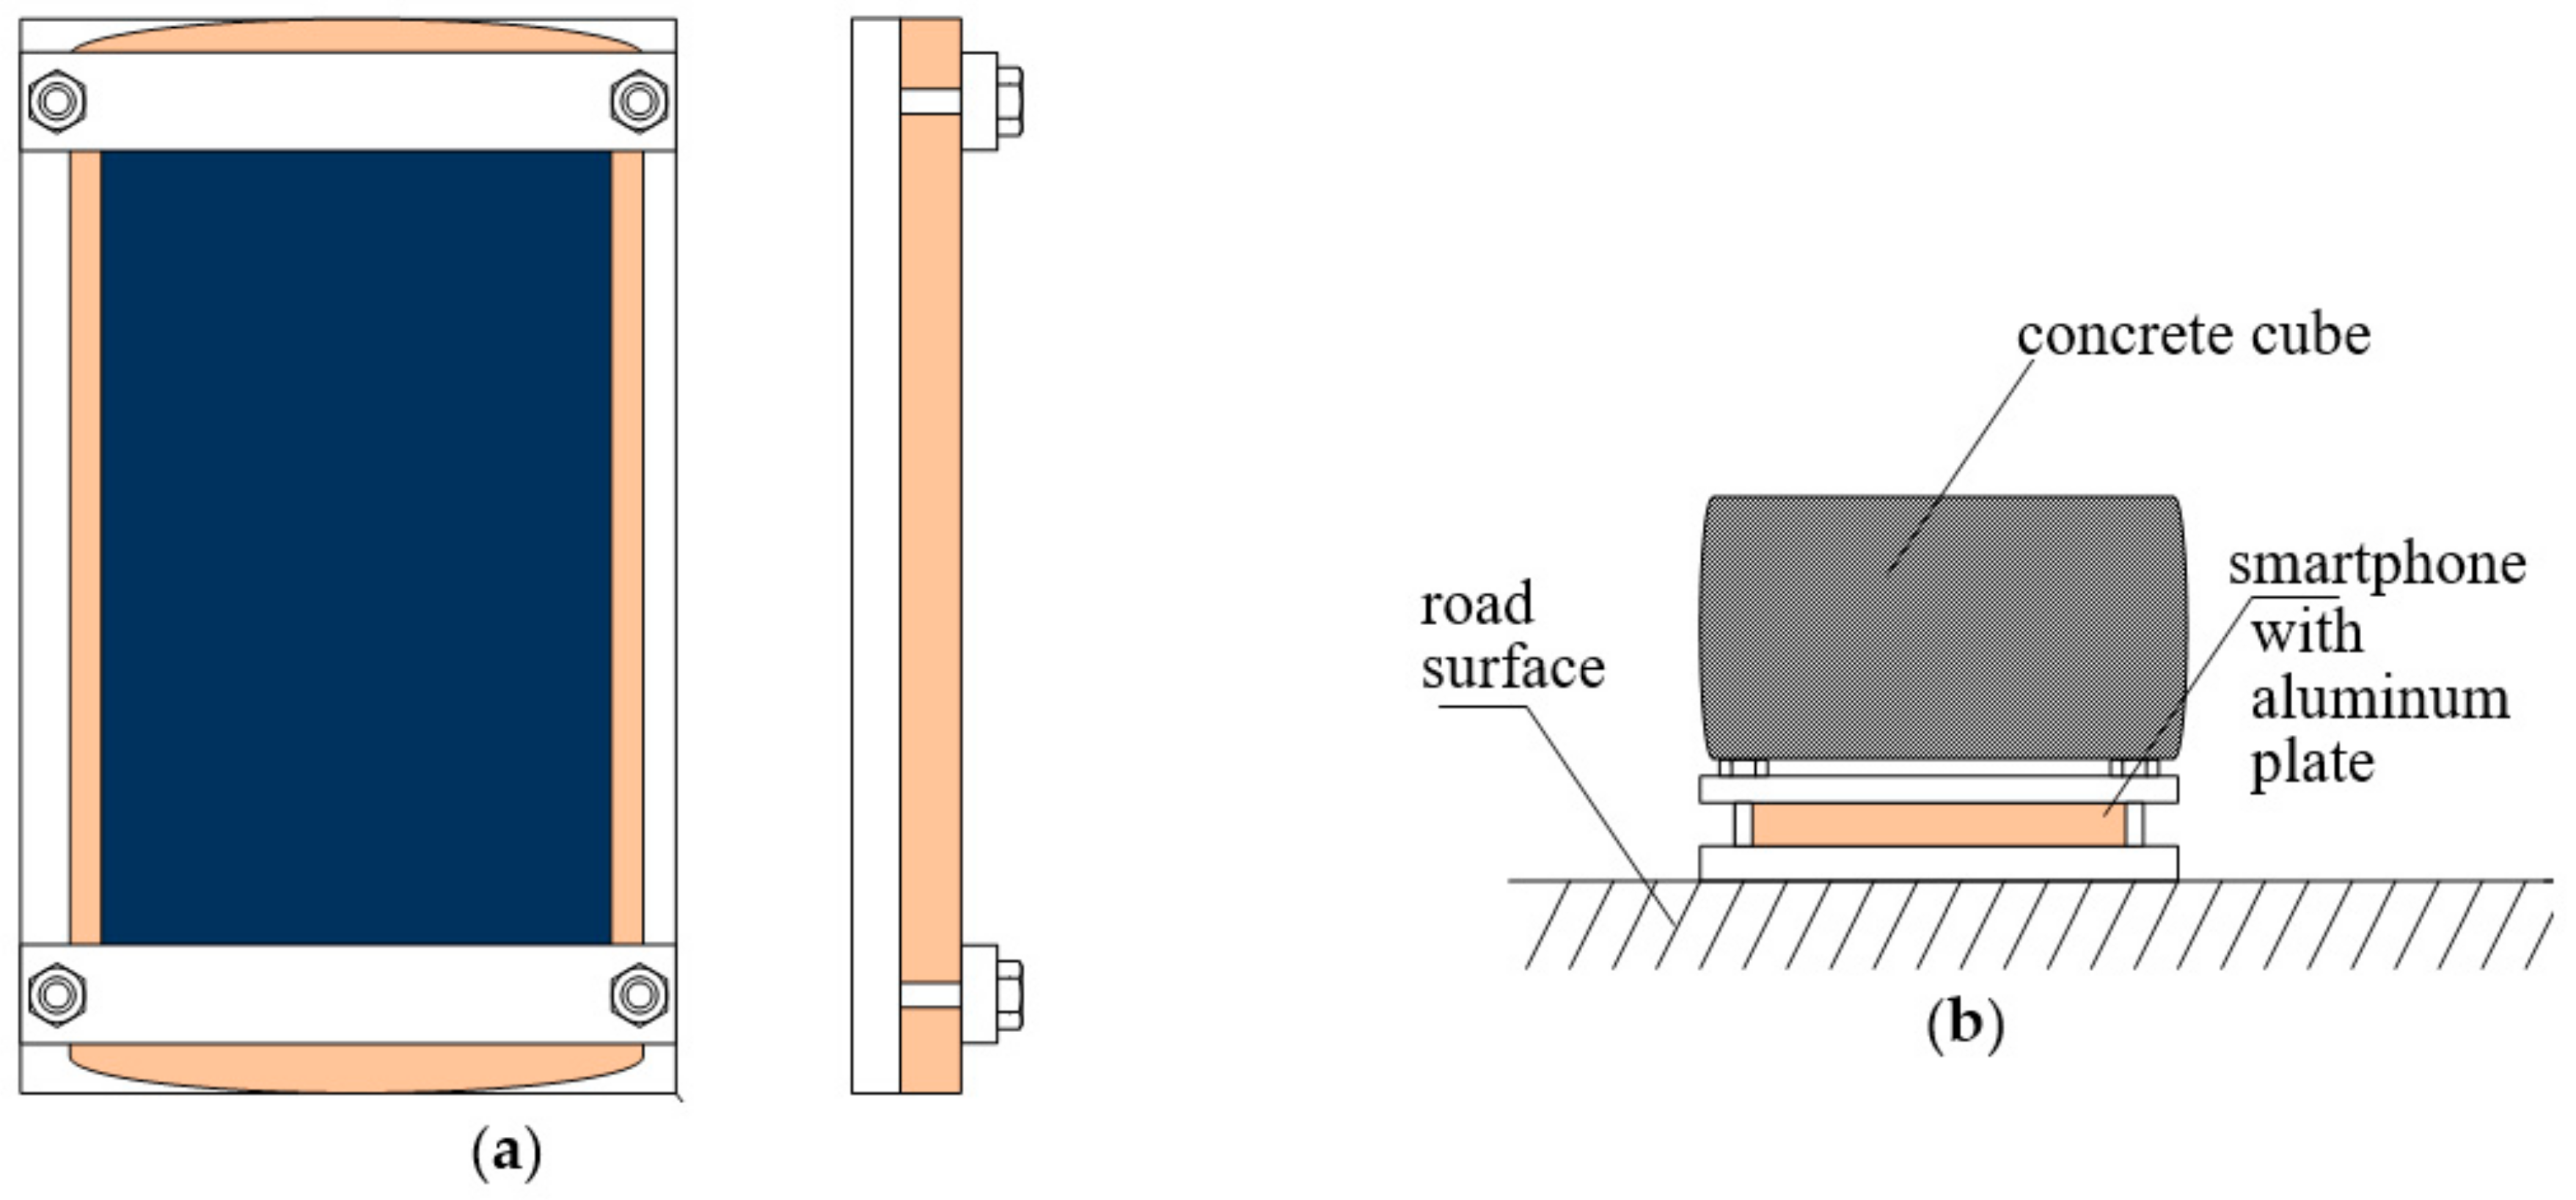
Extensive experiments were conducted to compare effectiveness of different low-cost sensing technologies in traffic-monitoring applications. During experiments, two different models of sensor node were utilized. An off-the-shelf smartphone (Redmi 3s, Xiaomi, Beijing, China) was adapted to implement the first model of sensor node (SN1), as presented in
Figure 1. In order to collect the data from built-in sensors of SN1, a mobile application was developed, which sends these data to server for further analysis. The sensors available in SN1 are listed in
Table 4. Additionally, the GPS module of SN1 was used to precisely determine the time when sensor readings were collected. This function enables synchronization of the datasets registered with use of multiple sensor nodes.
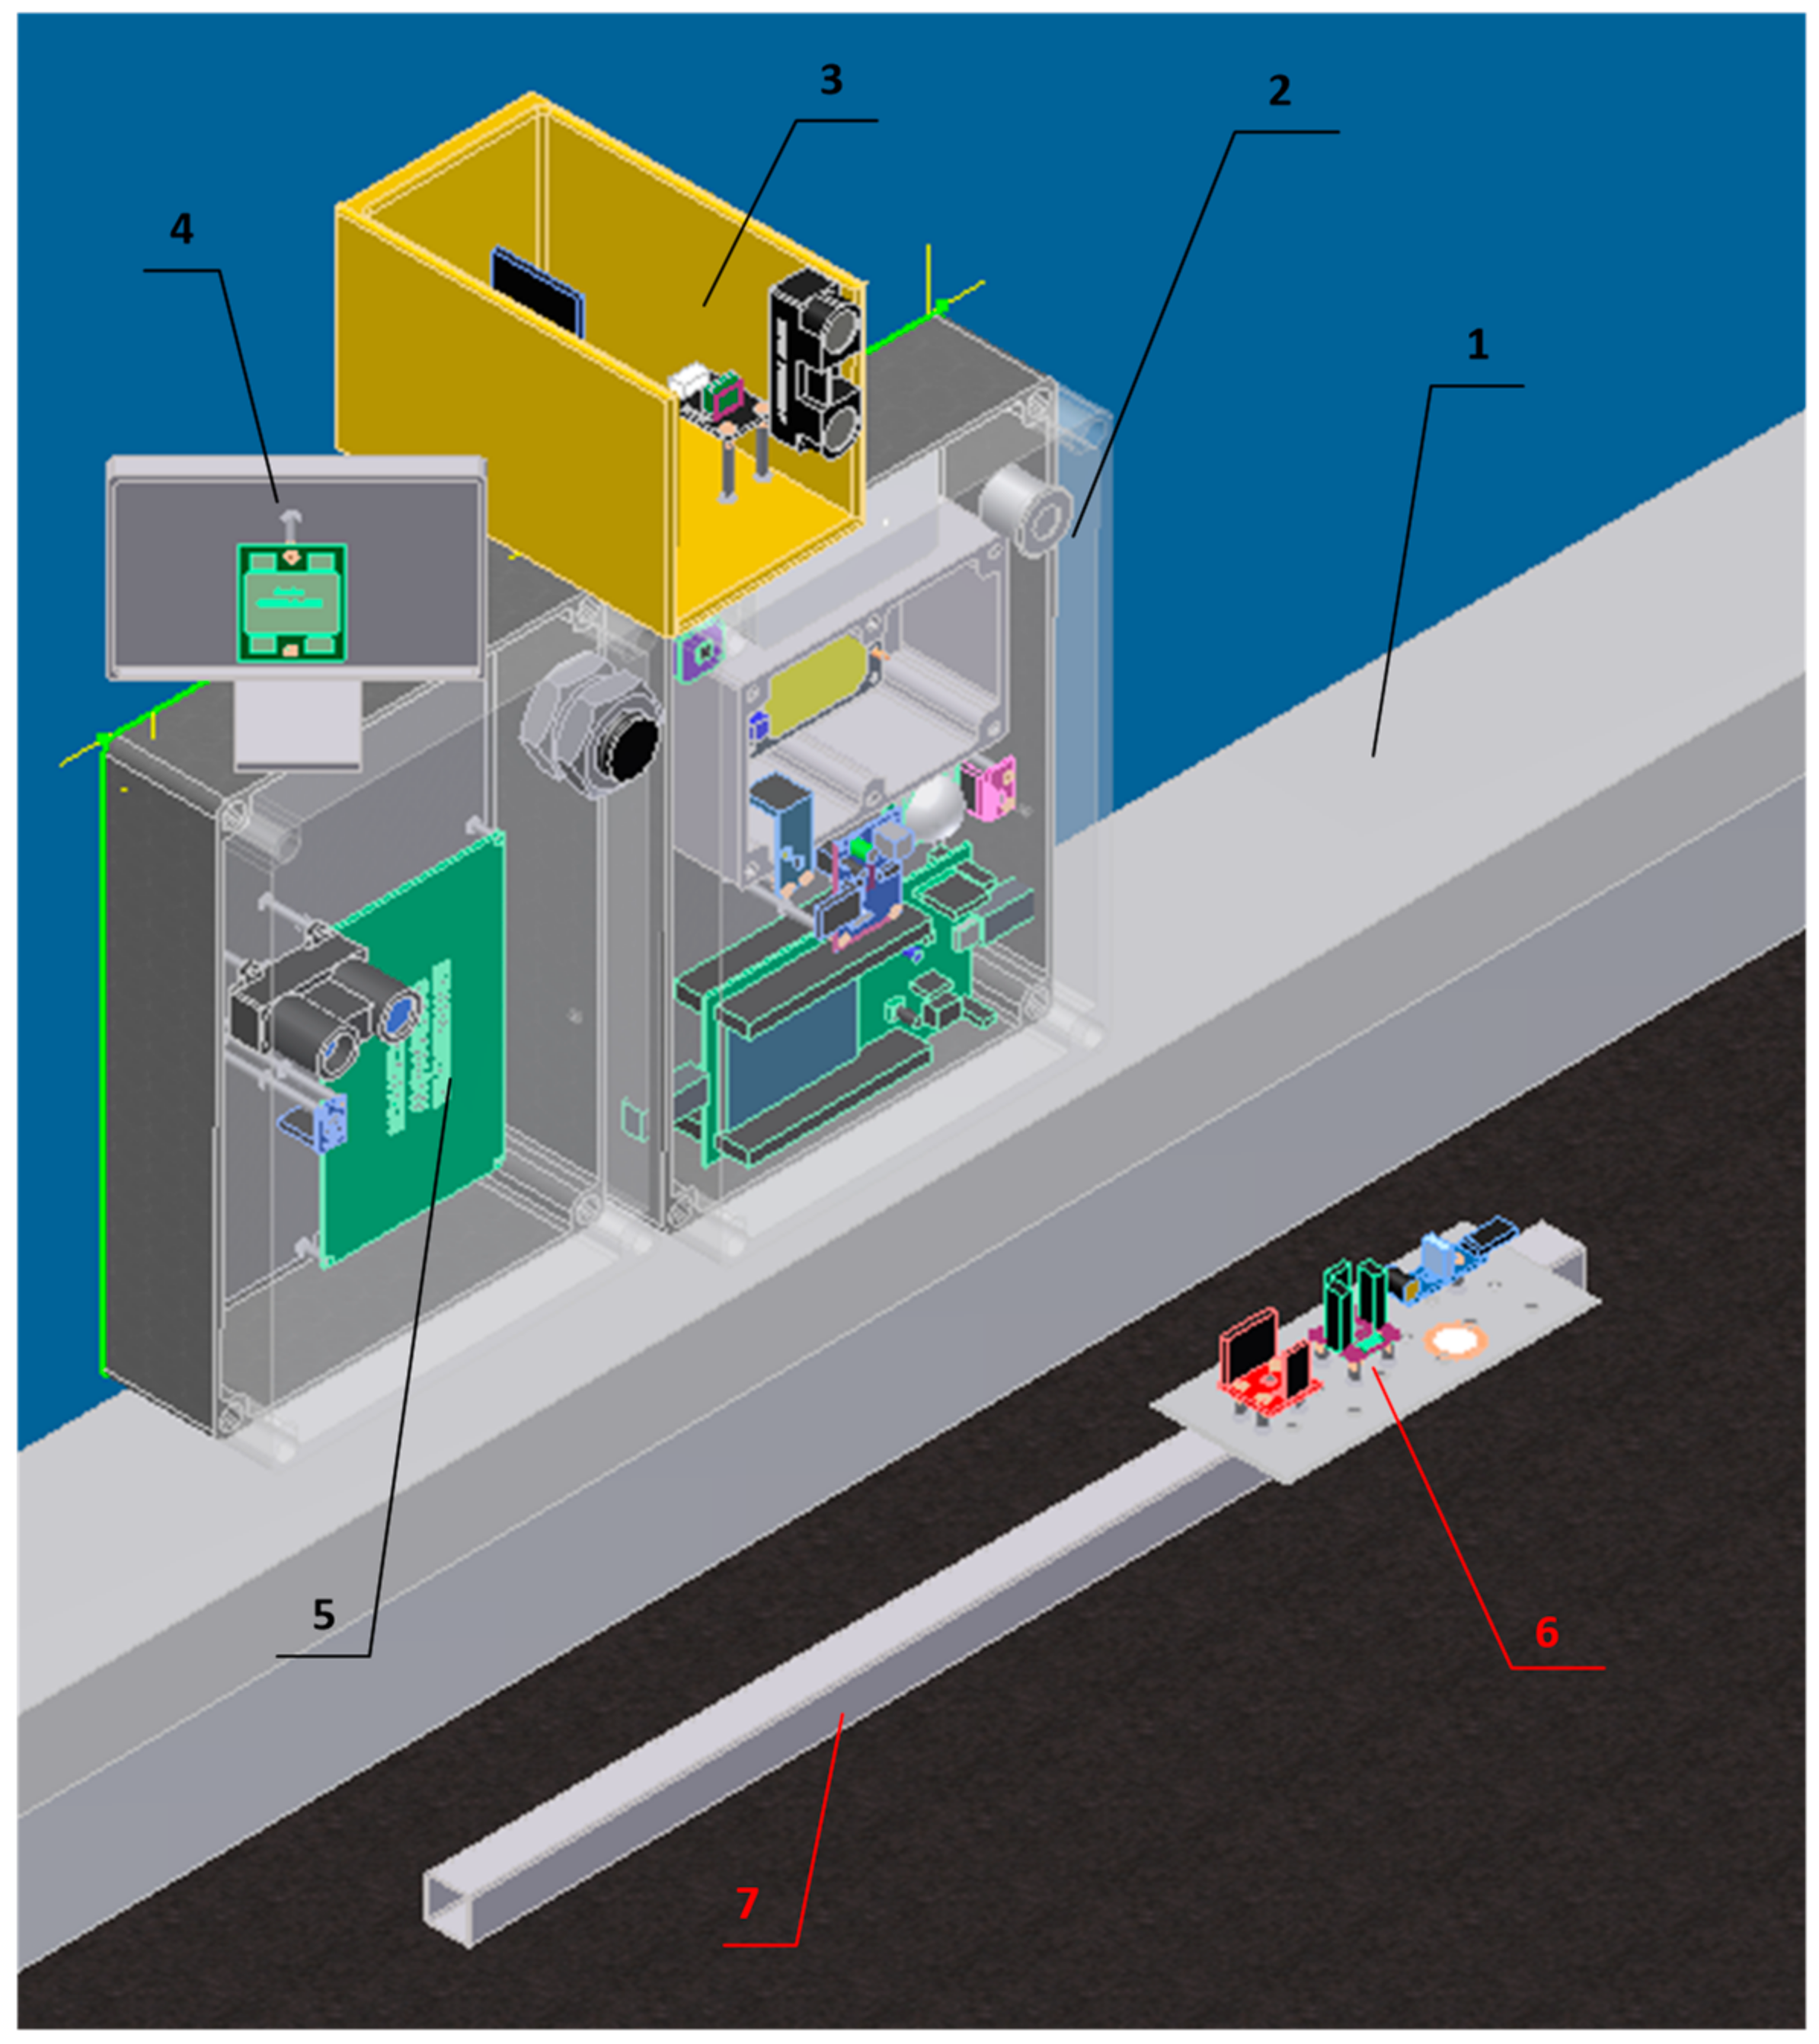
An extended set of sensors was installed in the second model of sensor node (SN2). The design of SN2 is shown in
Figure 2 and the installed sensors are listed in
Table 5. The sensor type was selected using a low cost threshold (10
$ in case of passive sensors and 50
$ active ones), low-cost sensors that offer the best sensitivity were purchased. Therefore, some expensive solutions, e.g., directional microphones, high-end accelerometers and seismic sensors, were excluded from the analysis. The presented construction of sensor node was based on results of preliminary experiments. During the preliminary research various methods of sensor installation were considered. The most promising options have been selected for the design of SN2.
The microwave radars (7644 HB100 and SEN0192) were placed in simple metal housings to reduce the impact of objects or persons behind the node on sensor readings. Radar SEN0192 was directed perpendicular to the axis of the road, while radar 7644 HB100 was oriented 45 degrees to this axis. Despite using simple housing, the influence of an environment was still high, thus a dedicated cover was designed for microwave radar HB100. The construction was presented in
Figure 3. The dedicated housing allows one to reduce the influence of background on the sensor readings and set direction of the microwave beam. During experiments, it was noticed that the stable shield on the opposite road side increases active sensors performance. Additionally, the angle between a metal object (e.g., vehicle) and the sensor beam also influences the measurements.
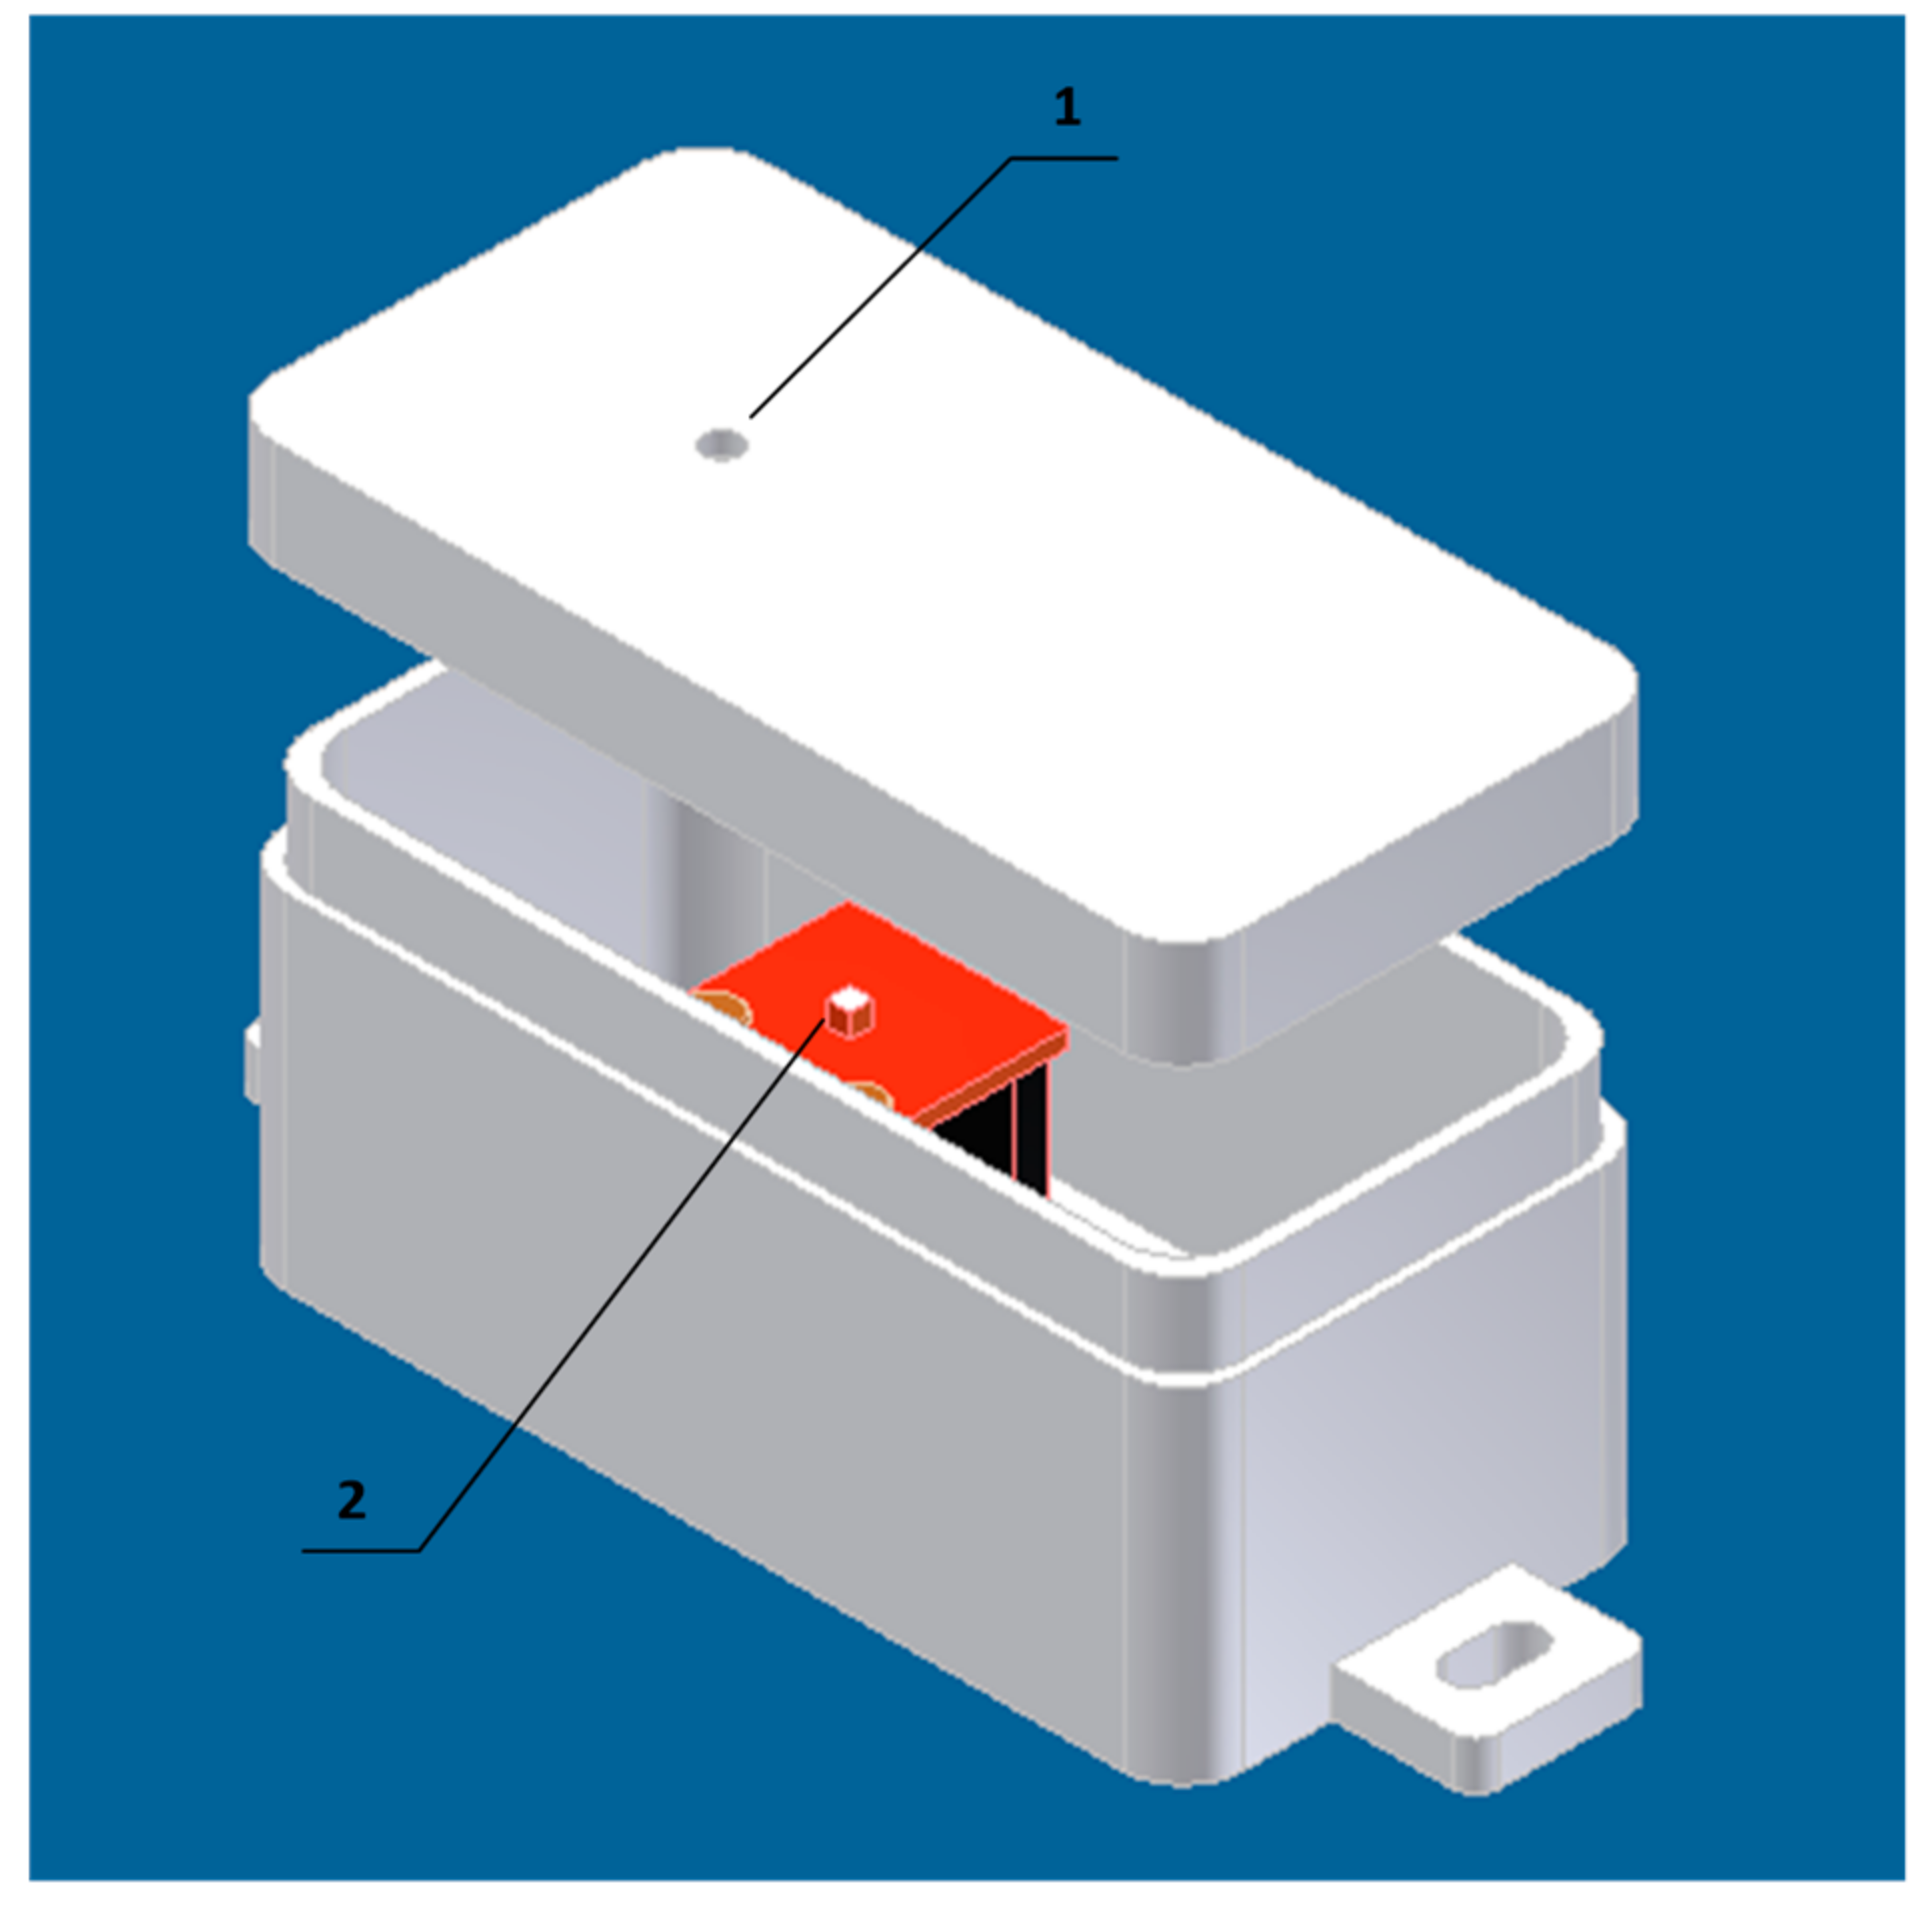
Additional housing was also designed for the light sensor ISL2915 (
Figure 4). A small hole was drilled in the opaque housing to adjust the direction of light rays that are detected by the sensor. This solution makes the sensor more sensitive to the changes of light intensity that are caused by passing vehicles. The preliminary tests have shown that without the proposed housing, the vehicle detection based on light sensor is impossible in bright sunlight.
Initial experiments were also performed to select appropriate installation method for vibration sensors (accelerometers). These experiments have revealed that the measurement of vibrations on road surface is more effective than the application of a bar stuck in the ground. Such observation is consistent with the result reported in related literature. Therefore, the accelerometers were mounted on a steel plate bolted to an aluminum profile (5 m long, cross section of 20 × 20 mm). The profile was glued to the surface of the road, as shown in
Figure 2.
During experiments two SN1 nodes were placed on opposite sides of a traffic lane. Distance between the nodes was of 3.5 m. Sensor readings were collected from one of the nodes in time intervals of 200 ms. The second node was used as a transmitter for the RSSI measurement. The time of car detection events was registered by human observers, when vehicles were passing between the sensor nodes. The events were also registered when no vehicle was present in vicinity of the sensor nodes. A dedicated mobile application was used by the observers to collect the events.
Similar experiments were performed with a single SN2 node. The SN2 node was placed on the curb, as presented in
Figure 2. In this case a car was parked on the opposite side of the road (in distance of 5.5 m from SN2) to obtain stable reference values of the measurements made by the active sensors (LIDAR, radar). The objective was to detect the vehicles passing between the SN2 node and the parked car (shield). The measurement data from SN2 were acquired with different frequencies for particular sensors. These frequencies were set according to specifications of the sensors.
Next part of the experiments with SN2 was devoted to vehicle localization in a detection area with accuracy of 1 m. During these experiments the human observers have registered time of three events: (1) vehicle enters detection area, (2) vehicle occupies half of the detection area, and (3) vehicle reaches end of the detection area. Length o the detection area was 2 m. A schema of the localization experiments is presented in
Figure 5. The reference data, describing the aforementioned events, were collected by two human observers. If an event was not confirmed by two observers, then such event was ignored. It should be also noted here that all the above discussed test scenarios for SN1 and SN2 were also used to examine the possibility of pedestrian detection.
The objective of localization experiments was to explore the possibility of localizing vehicle or pedestrian with use of the low-cost sensors that are originally designed for vehicle or pedestrian detection. During these experiments it was verified if the sensors installed on road side, which detects vehicles/pedestrians, can additionally recognize position of the detected target within detection area. Thus, the localization is considered in this study as a supplementary function of the detectors. It should be also noted here that vast amount of dedicated localization methods is available in the literature. Some of them use the same sensor types as considered in this study but in different configurations (e.g., radars installed on vehicle [
49]). These dedicated localization methods are out of the scope of this study.
The data registered during measurements by each sensor in SN1 and SN2 were aggregated with use of so-called sliding window [
50]. According to this method, if a new sensor reading is registered at time
t, then the aggregation is performed on a set of data readings for which the registration time
t’ satisfies condition
t −
w ≤
t’ ≤
t, where
w is size of the time window. Such set of sensor readings is used to calculate aggregates (statistics) of the measured values, i.e., minimum, maximum, median, average, and standard deviation. During initial research it was noticed that by increasing the window size up to 1 s the detection accuracy was increased. However, if the window is wider than 1 s, the measurements registered for two successive vehicles can be aggregated and the detection accuracy decreases significantly. Thus, the window size (
w) of 1 s was used for further experiments.
The presence of an object (vehicle or pedestrian) in the detection area was recognized based on the aggregated data, by using different machine learning methods, i.e., decision trees (DT), k-nearest neighbors algorithm (KNN), and multi-layer perceptron neural network (MLP). The machine learning methods were selected with regard to the computational requirements and possibility of implementation in cheap, energy-efficient software platforms.
The KNIME software with Weka tools [
51,
52] was used for classification purposes. The DT classifier uses a C4.5 algorithm (gain ratio was used as quality measure without pruning) thus no additional parameters has to be tuned. In case of MLP classifier the RPROP implementation of the multilayer feed-forward networks was used [
51], which performs a local adaptation of the weight-updates according to the behavior of the error function. Various structures of MLP were considered with one and two hidden layers. The number of hidden neurons was between 10 and 20. Each neuron had sigmoid activation function. The MLP structure with one hidden layer and 12 hidden neurons was selected, based on results of cross validation obtained for 100 iterations. Finally, the k-NN algorithm without weighting and linear search was used. Thus, only one parameter, i.e., the number o neighbors (
k) was tuned. Using the cross validation method, the optimal value of
k parameter was selected (
k = 3). Sensor data collected for 60 events (passing vehicles/pedestrians) were used for training of the machine learning algorithms. The data used for parameter selection was excluded from further evaluation process.
The machine learning algorithms were also applied for the localization problem to recognize three locations of a vehicle/pedestrian, as shown in
Figure 5.
During experiments, the machine learning algorithms were fed with three sets of the data aggregates. The first set of input data contained minimum, maximum, and median values. The second set consisted of average and standard deviation. In the third case, the values of minimum, maximum, average, and standard deviation are used. In order to evaluate accuracy of object detection, the aggregated data from sensor nodes were divided into training dataset and test dataset in the proportion of 60% to 40%. The detection (localization) accuracy was determined using the following formula:
where:
n—number of classes,
Ci—number of items in the test dataset that are correctly assigned to
i-th class, and
D—number of items in test dataset. It should be noted here that two classes (
n = 2) were taken into account for the detection problem: (1) object present in the detection area, (2) no object in the detection area. In case of the localization problem, four classes were considered (
n = 4): (1) object enters detection area, (2) object present in the detection area, (3) object reaches end of the detection area, (4) none of the above. The use of the accuracy measure was motivated by the fact that the prepared test dataset includes equal number of elements for each considered class.
4. Results and Discussion
The sensor data collected by SN1 were used to evaluate the accuracy of vehicle and pedestrian detection.
Table 6 shows the results that were obtained based on individual sensor readings with use of DT algorithm. Input data of the algorithm have included four aggregates: minimum, maximum, average, and standard deviation. The measurements collected by accelerometer, gyroscope and magnetometer were analyzed separately for the three axes, while the remaining sensors provided single value. It should be noted here that the accuracy values close to 50% can be obtained as random results.
During experiments with the standard off-the-shelf device (SN1) the high vehicle detection accuracy was achieved by using microphone, wireless communication (RSSI), and magnetometer. The accelerometer readings of SN1, due to sensor quality and type of the connection with surface, were insufficient to correctly recognize the vibrations. The vibrations were sufficiently detected only if a pedestrian was walking very closely to the sensor node (changes of sensor readings were observed for x and y axis). The data from gyroscope were characterized by strong noise, thus the results of classification were significantly affected. This effect can be observed for pedestrian run, where the accuracy values for x and z axes are quite different. Magnetometer readings are not affected by non-magnetic objects. Therefore, the magnetometer has provided accurate detection only for vehicles. In this case the accuracy is above 80%, while accuracy of pedestrian detection is close to 50%. The best results were obtained for x and z axis, thus at least those two should be considered to detect vehicles. The fact that magnetometer readings are unaffected by pedestrians enables distinguishing pedestrians from vehicles, when collecting data from several sensors.
Accurate results for both vehicles and pedestrians (accuracy over 90%) were obtained only with use of a microphone. The sound of car as well as walking and running person was detected using standard microphones installed in SM1. The sound of engines and running persons was easier to detect than the sound of a walking person. Thus, 8% decrease of accuracy was noticed when comparing the results obtained for walking person with those for running person. Finally, it should be noted that the microphone readings can be affected by sound sources other than the objects to be detected, e.g., vehicles in neighboring traffic lanes. During measurements discussed in this Section, the other sound sources were not present in vicinity of the sensor node.
The light sensor in SN1 was affected by sun reflections from vehicles and shadows of trees, thus its accuracy for vehicle and running pedestrian detection was relatively low. Only in case of slowly moving object (walking pedestrian) the light sensor was sufficient to detect the object in most cases (79% accuracy). Therefore, in SN2 the special housing was proposed and the data collection interval was decreased to 100 ms for this sensor type.
The detection results obtained with use of RSSI data shows that the RSSI sampling rate of 5 Hz allows us to detect vehicles with fair accuracy (85%). However, during experiments it was also observed that the effectiveness of RSSI-based detection strongly depends on sampling rate and height above road surface, at which the devices are installed. The detailed research results related to these aspects were presented by the authors in [
20].
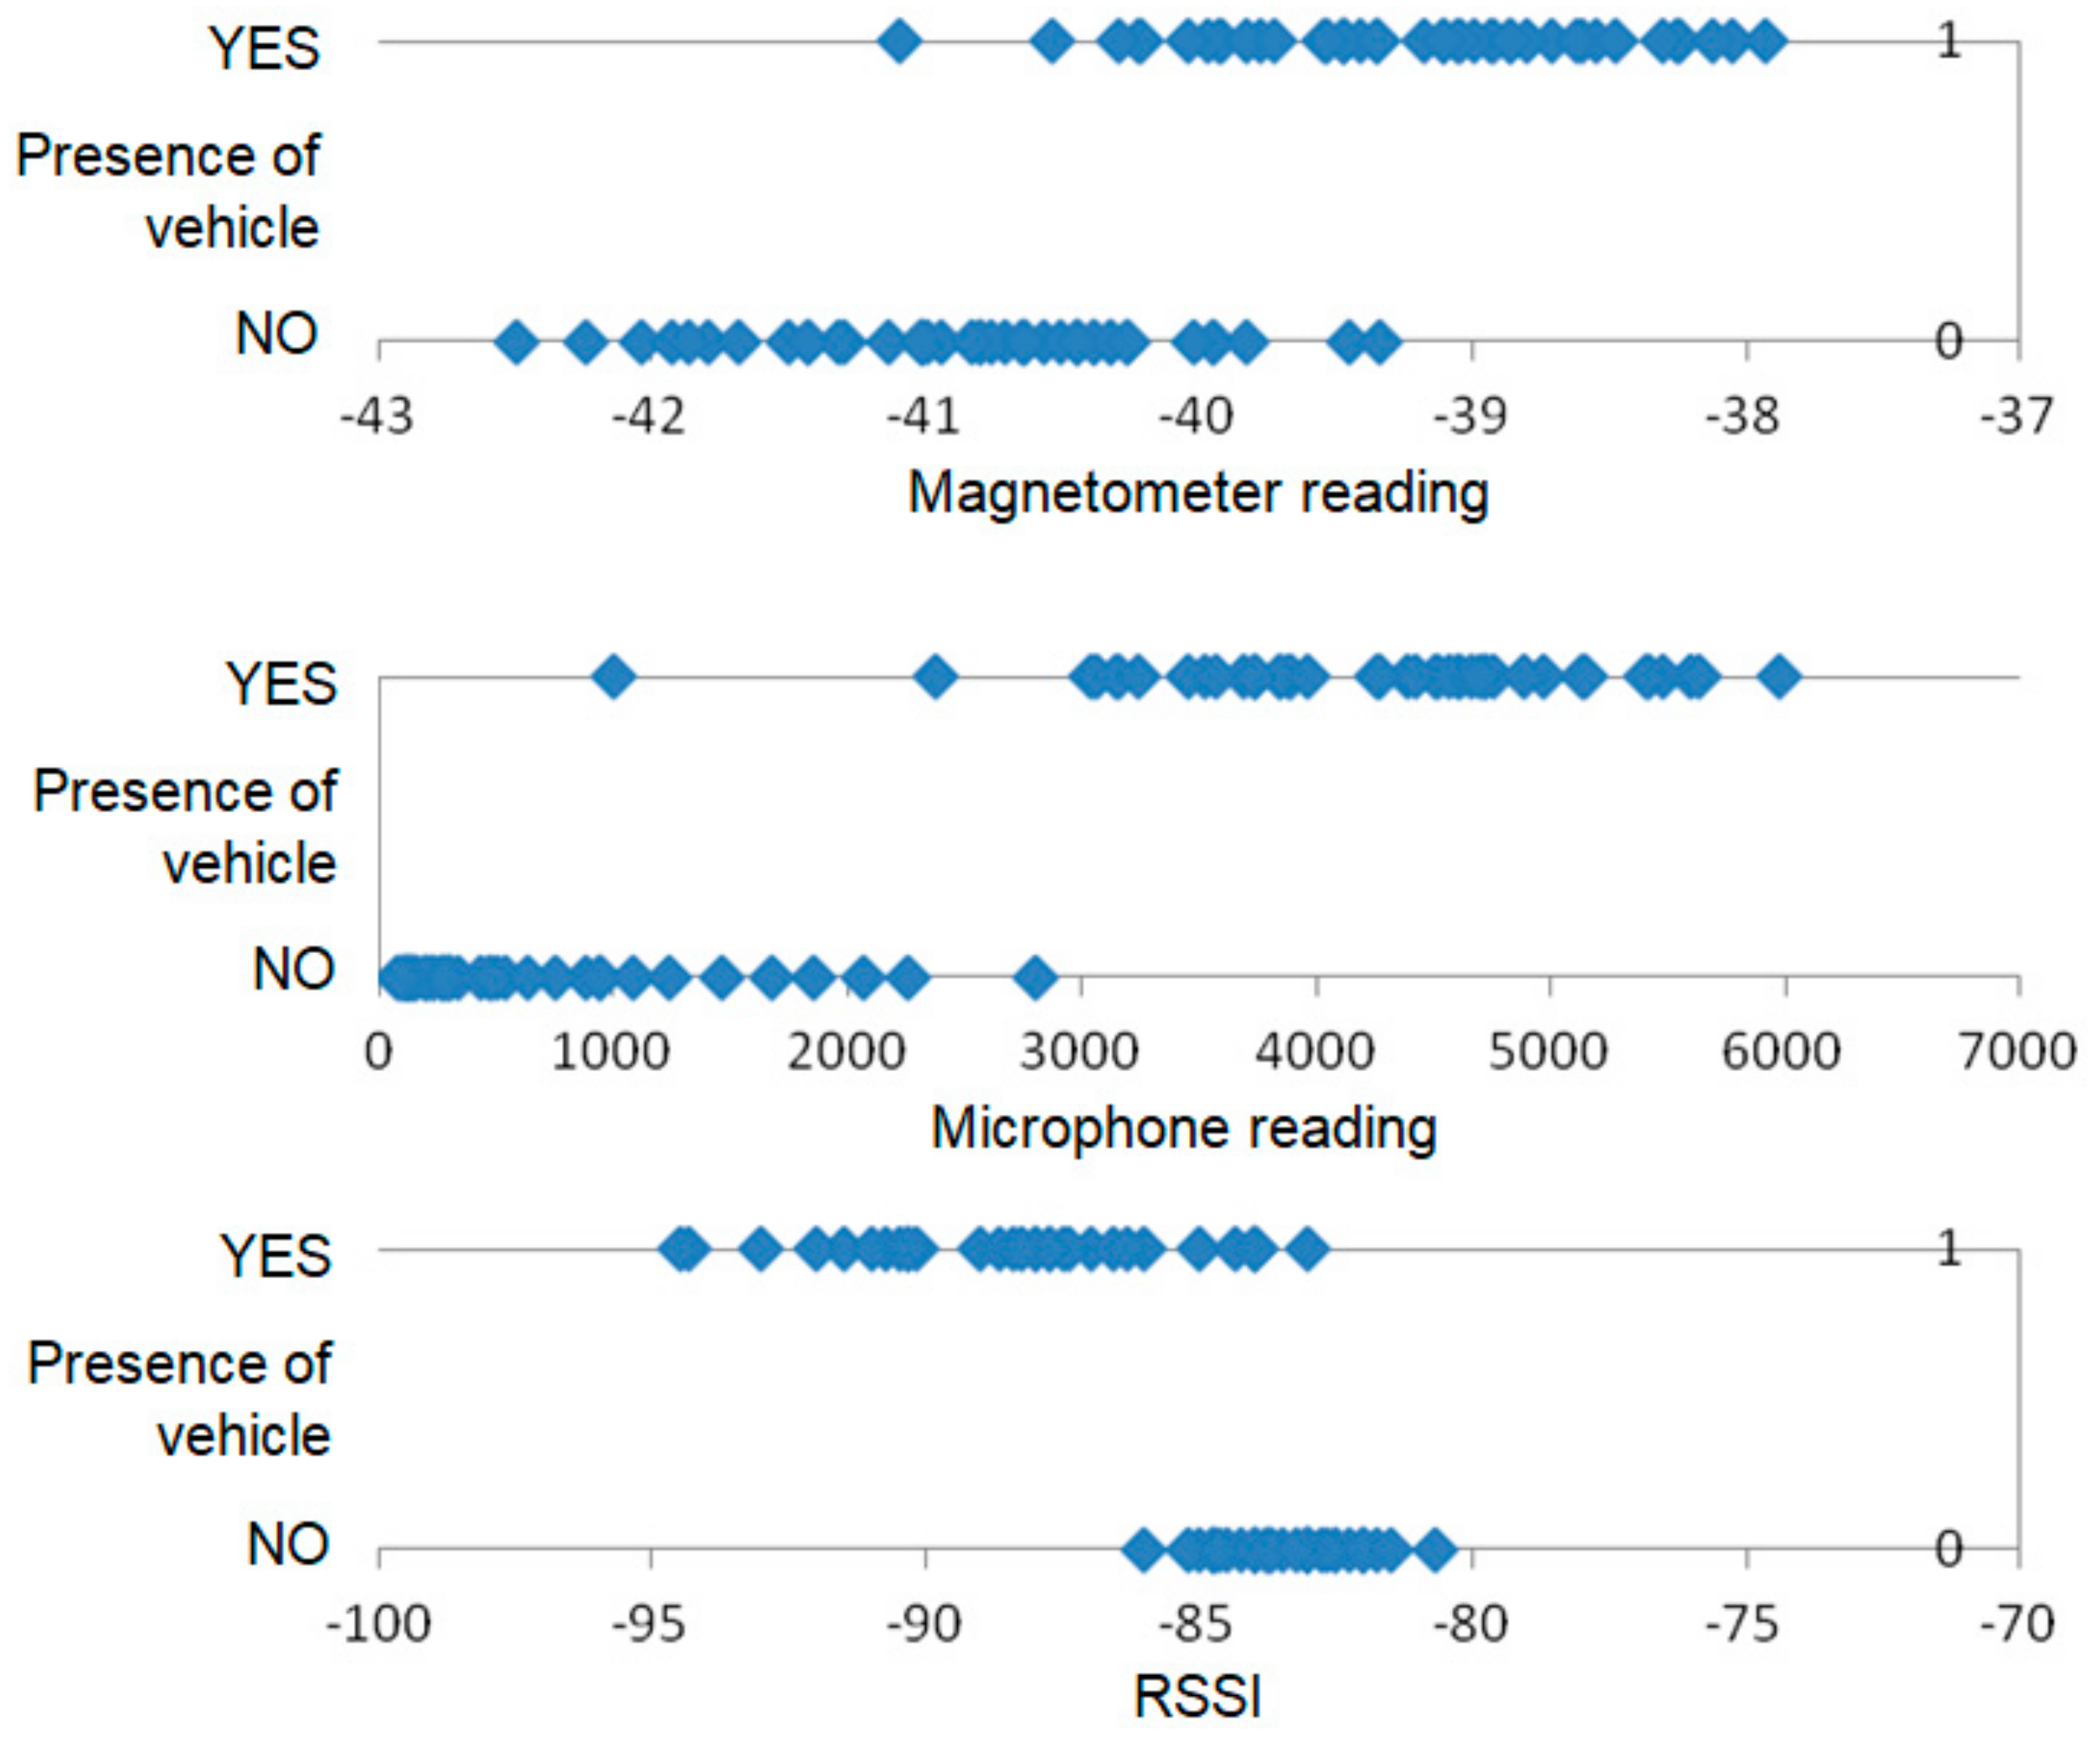
A subset of the data collected during the experiments with SN1 is depicted by the scatter plots in
Figure 6 and
Figure 7. The values presented in that scatter plots are average sensor readings determined for sliding window of 1 s. These charts allow us to compare the dispersion of measurement results for sensors that have provided high accuracy of detection. Additionally, the accelerometer was considered, as one of the sensors that have been used for vehicle detection in previous works.
The above discussed results show that for individual sensors there is no clear separation between the readings registered when a vehicle is present in the detection area and those collected in case of empty detection area, thus the data from multiple sensors should be considered.
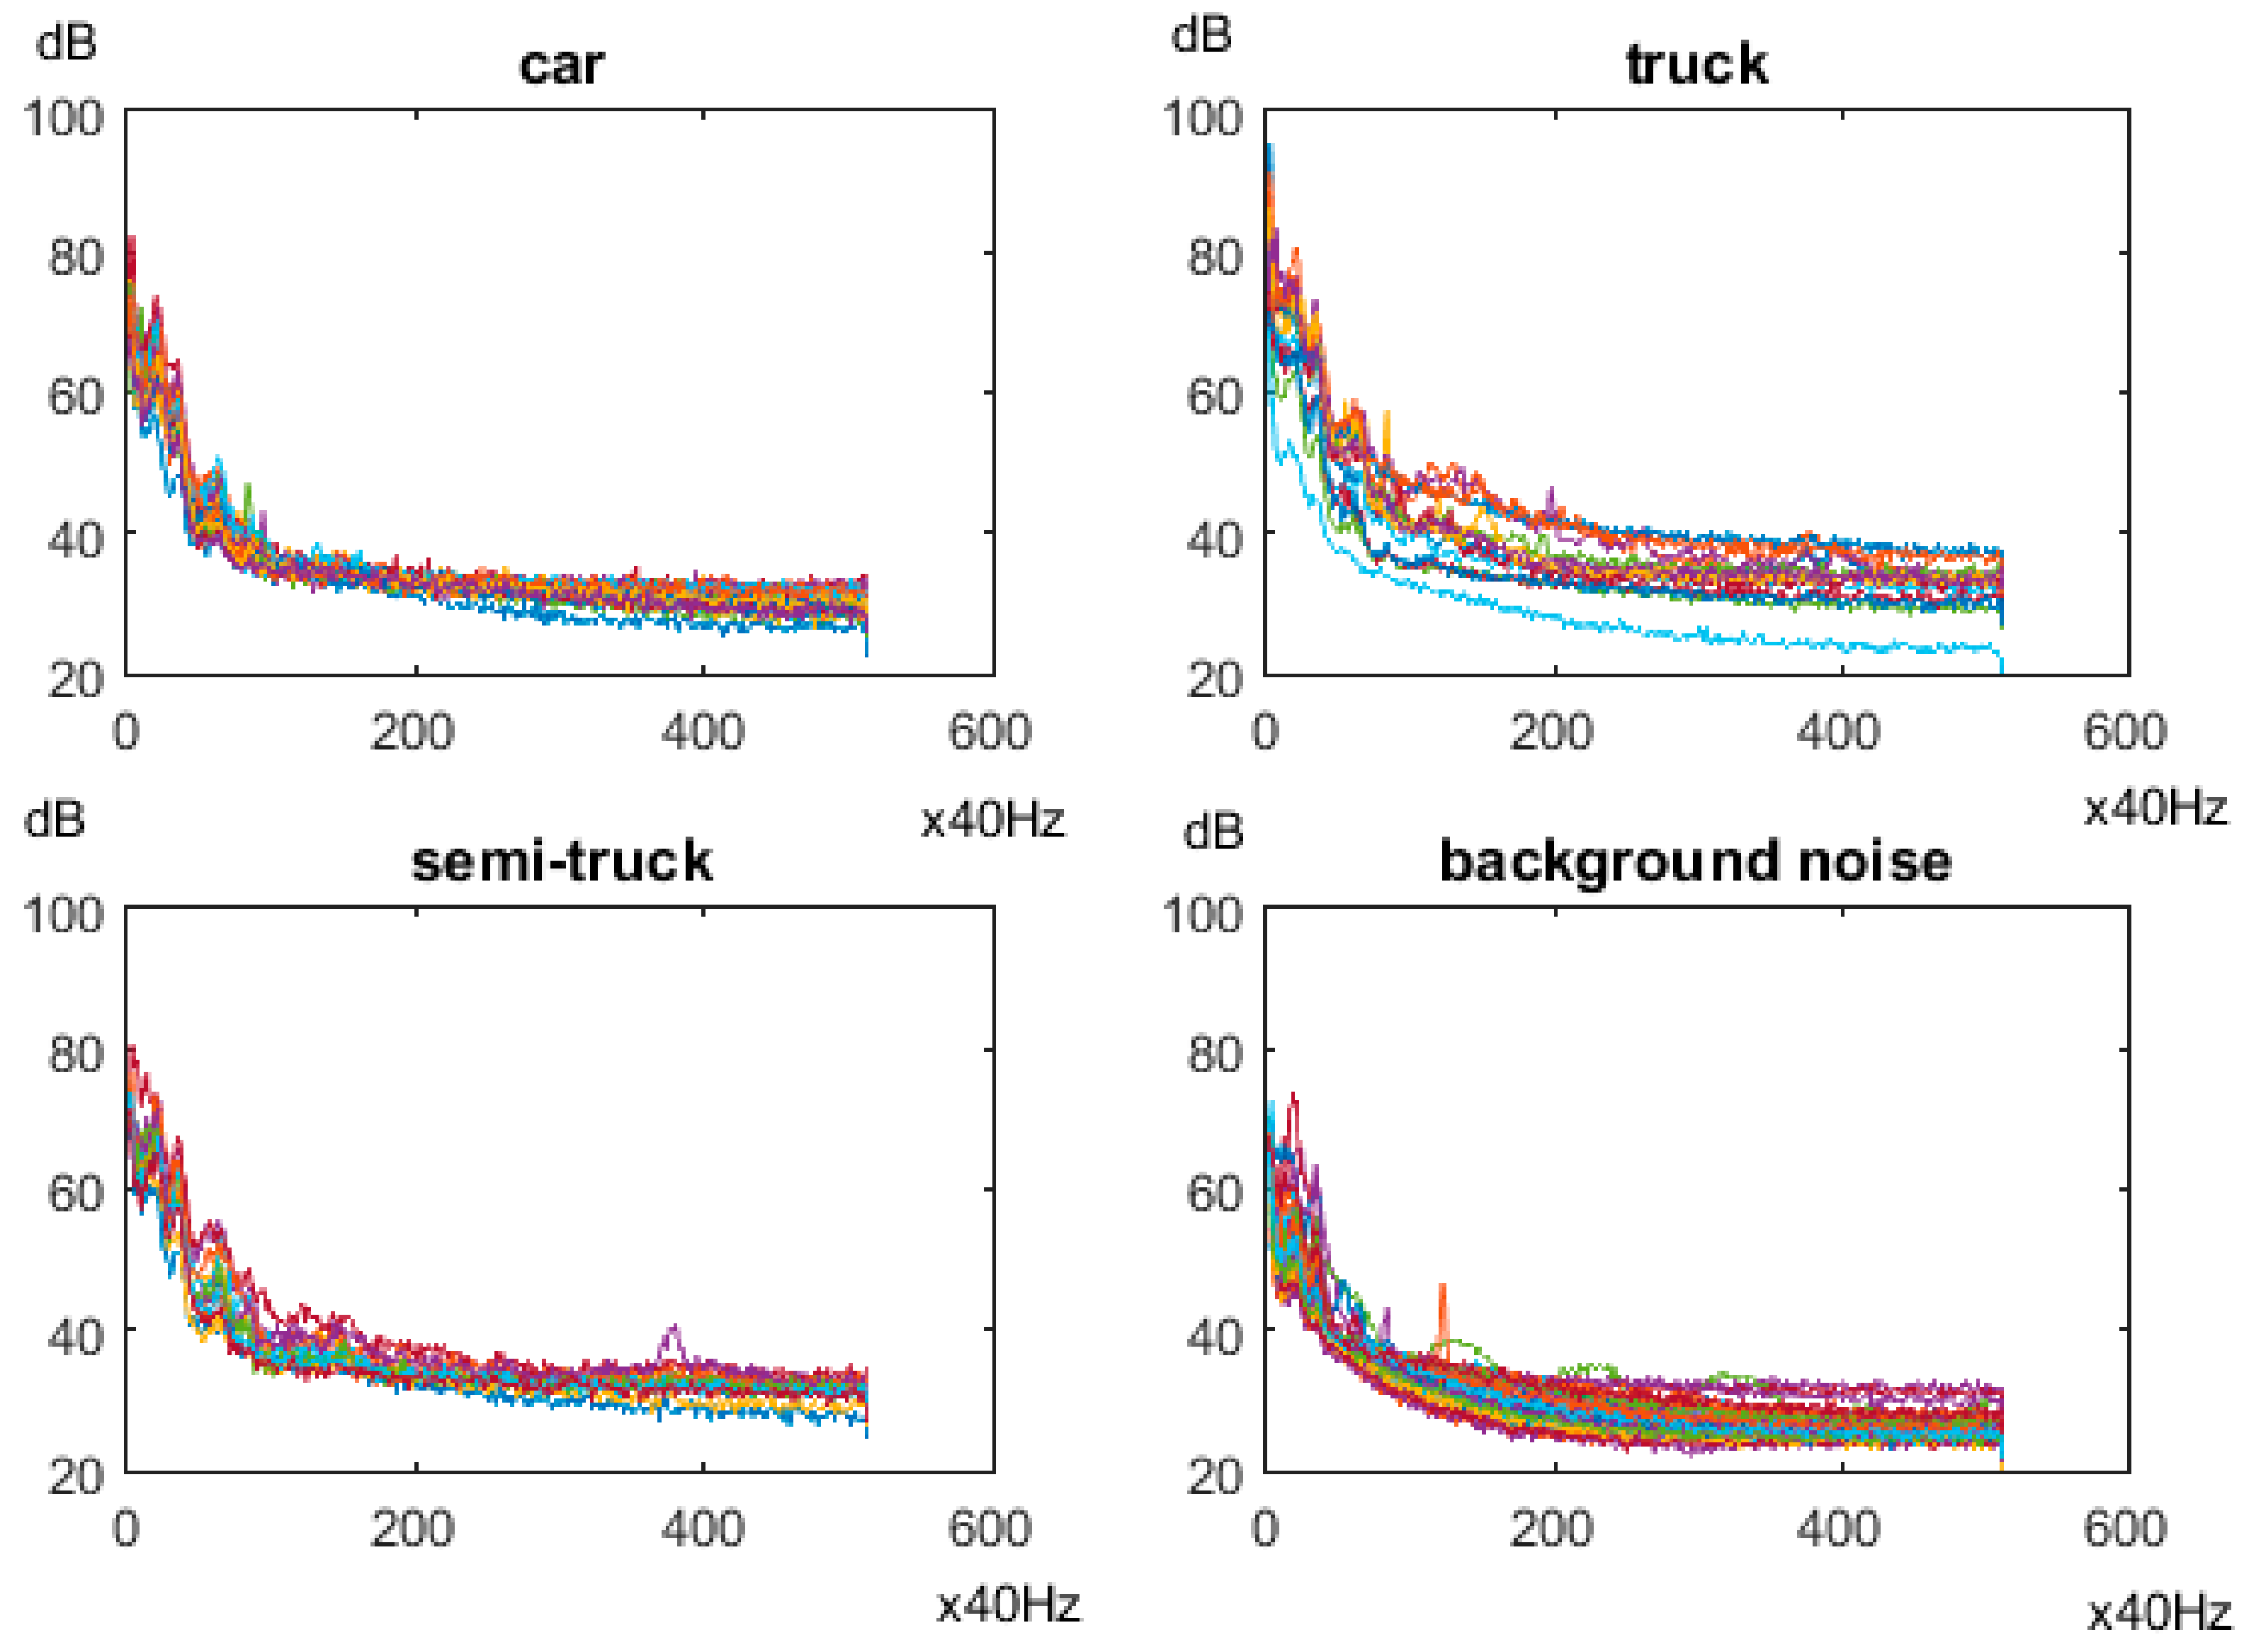
SN1 was also used to measure sound level in a four-lane road with high traffic intensity. In this case a significant background noise was caused by the vehicles in neighboring traffic lanes. The measurements were analyzed in frequency domain to verify the possibility of detecting vehicles. The objective was to recognize the vehicles passing in the right-most traffic lane (SN1 was placed on the right side of the road). Sound spectra for three vehicle classes and for background noise are presented in
Figure 8. Each chart in
Figure 8 shows the spectra for 20 samples registered in real traffic conditions. The sound spectra for vehicles of the same class as well as for the background vary significantly. Thus, it is impossible to distinguish between vehicle and background for a large part of the analyzed samples. These results show that the accurate vehicle detection with use of microphones requires more complex data, e.g., sound levels measured by microphones placed in different lanes.
As mentioned above, the experiments with SN1 nodes were also performed in urban road during periods of high traffic intensity, when time headways between vehicles were small and other vehicles were passing in adjacent traffic lane. It was observed that for such conditions higher detection accuracy can be achieved by decreasing the size of the aggregation window. Further improvement would be also possible after implementation of the methods from the literature that deals with the problem of multiple vehicles present in the detection area. Different methods are available for particular sensor types, e.g., for microphones [
44] and magnetometers [
33]. In this study such methods were not applied as the objective was to compare the effectiveness of different sensors in similar settings, using algorithms that have low computational complexity and can be implemented in cheap, energy-efficient hardware platforms.
Further tests were performed to check the possibility of improving the vehicle detection accuracy by combining the data collected from different sensors available in SN1. Two datasets were taken into account, selected based on the results presented in
Table 6. The first (full) dataset consists of data readings from magnetometer (for three axes), microphone, and RSSI values. The second dataset contains magnetometer data (for axes axes) and RSSI values. The microphone readings were not considered in this dataset as they can be affected by presence of other strong sound sources, as explained above.
The vehicle detection accuracy for the two datasets is compared in
Table 7. The results in
Table 7 are presented for two different sets of the aggregates and three classification algorithms. It should be noted that the sets of aggregates considered in this case include less elements than the set, which was used to collect the result presented in
Table 6. The set of aggregates was selected as giving the highest accuracy values. In majority of cases, with exception of MLP algorithm and reduced dataset, the average and standard deviation aggregates provided better or the same results as median, minimum and maximum aggregates. An important observation is that 100% accuracy of the detection can be achieved by taking into account the three sensors (magnetometer, microphone, and wireless module measuring RSSI). Thus, the sensor fusion has enabled improvement of the detection accuracy in comparison with the results achieved for individual sensors. The improvement was possible despite the fact that the set of aggregates was reduced. The worse result of MLP algorithm could be caused by the fixed neural network size, selected during initial research, as well as by limitations of the training procedure, which was used to adjust the weights of inter-neuron connections. In case of MLP algorithm both the network structure parameters as well as the weights have to be tuned. The large number of parameters and low number of iterations can give semi-optimal result. Therefore, 10 training sessions were conducted and average results are presented in this Section. The DT and KNN algorithms have achieved 100% accuracy. It should be noted that those two algorithms do not have to use all input data for decision making, thus they are less affected by outliers. In practice the DT algorithm can make the decision based on single attribute, if the selected attribute is sufficient. Additional advantage of DT over KNN is lower memory utilization. The DT in contrast to KNN does not have to store the training database in the memory.
A decrease of detection accuracy was experienced when taking into account the second dataset without microphone readings. In this case the accuracy was only slightly better than that achieved for individual sensor (magnetometer). When comparing the considered machine learning algorithms, it can be observed that MLP gives worse results than DT and KNN. The reduction of input dataset has influenced the results of DT algorithm. Nevertheless, the DT algorithm managed to retain the high detection accuracy (88%).
Another observation is that two aggregates, i.e., average and standard deviation, were sufficient to accurately detect vehicles. The accuracy achieved for the experiments without sound varies in range of 3% for the considered sets of aggregates. All three compared algorithms have their advantages. The decision-making procedures of MLP and DT algorithms can be implemented in sensor node, due to low computational complexity and memory requirements. In contrast, the KNN algorithm has significantly higher requirements related to computations and memory resources. Therefore, for further tests the DT algorithm was used as giving the most stable results (unaffected by parameters tuning).
Similar research and analysis were conducted using the SN2 node. Results of vehicle and pedestrian detection based on data delivered by individual sensors in SN2 are presented in
Table 8. The detection and localization tasks were performed with use of DT algorithm. Input datasets of the DT algorithm have consisted of minimum, maximum, average, and standard deviation values determined for sensor readings within sliding window. Results of these experiments show that vehicles were accurately detected with use of magnetometer and light sensor. For magnetometer the high accuracy is achieved provided that the vehicles pass close to the sensor location. The detection accuracy drops significantly if the distance between magnetometer and vehicle is above 2 m. Examples of magnetometer readings are presented in
Figure 9. The time intervals, during which a car was close to the sensor, are marked as red circles. Minimum distances between the car and the sensor are presented above the charts.
In case of magnetometer, the detection accuracy decreases with increasing distance between the sensor and vehicles (see
Figure 9). A similar effect was observed for the majority of the passive sensors, including the light sensor and accelerometer. Thus, the placement of passive sensors is a key factor. Light sensors achieve a high detection accuracy during sunny days, under stable ambient lighting conditions. It should be noted that the results were improved in comparison with those of SN1 by using the housing presented in
Figure 4, which allows the light sensor to be appropriately oriented. For such conditions vehicles and pedestrians can be detected in distance of 4 m. In such settings, the detection accuracy for light sensor was increased to 95%. However, in case of dynamic lighting changes, e.g., during cloudy weather, the detection accuracy is significantly lower (equals 60%). Nevertheless, the analysis of light sensor readings can help in detecting the changes generated by environment and those related to moving object close to the sensor.
An example of the signal registered by light sensor is presented in
Figure 10. The changes of light value in case of passing vehicle are more rapid than in background. The color of a vehicle also influences the light sensor readings: the registered value can decrease or increase when vehicle is present in front of the sensor.
During experiments, the accelerometers enabled accurate detection of heavy vehicles (trucks). However, personal cars were not correctly detected using this type of sensor. The results achieved with use of the LSM9DS1 accelerometer are better than those obtained for the remaining accelerometers installed in SN2. The accuracy of accelerometer-based detection strongly depends on sensor sensitivity, type of the road, and type of the sensor mounting. In comparison to the results presented in [
25], the sensitivity of the analyzed sensors was lower. Thus, a more precise accelerometer can be used to improve the detection accuracy. Based on the literature [
23], it was expected that the piezoelectric sensor will provide useful data for vehicle/pedestrian detection. However, the experiments did not confirm that assumption. The low detection accuracy observed for the piezoelectric sensor could be caused by the type of its installation. The results can be also improved for this sensor by using a pre-amplifier.
The LIDAR proved to be useful sensor for vehicle detection, provided that a shield is used, as shown in
Figure 5. LIDAR could be also installed over the traffic lanes at some height. However, without an object (or shield) present in sensing range it losses stability and becomes ineffective. During research in real-traffic conditions it was noticed that narrow LIDAR detection beam could be avoided by vehicles if the traffic lane is wide.
The research has also covered the test of barometer, which proved to be effective if distance to the target object is short—up to 0.5 m. However, the barometer loses its applicability in case of strong wind or when closed in a cover. Finally, the microwave radars are able to detect moving object, however without a dedicated design of housing they collect the noise from surroundings. Therefore, a special housing was proposed to improve the accuracy of microwave radar (
Figure 3). The results obtained with use of the proposed housing show improvement, in case of both vehicles and pedestrians detection.
Comments related to each type of the sensors are summarized in
Table 8. A general observation is that high detection accuracy cannot be achieved with use of individual sensors for all considered situations.
Before selecting subsets of sensors for further tests, the relation between their data readings was examined with use of Pearson’s correlation coefficient. The readings for X and Z axis of the magnetometer showed strong correlation (−0.98), thus in applications only one axis can be considered. Similar relation was observed for R, G, B values registered by the light sensor (0.97). The high correlation was also observed for accelerometer and light sensor (0.8). Finally, weak correlation was noticed between light sensor, accelerometer and LIDAR readings, where the correlation coefficient equals 0.85 and 0.91, respectively.
Despite the aforementioned dependencies, the full set of sensor readings was initially used for detection of objects.
Table 9 presents the accuracy of vehicle detection and localization, which was obtained by using different subsets of the sensors available in SN2. The results of pedestrian detection and localization are shown in
Table 10. In
Table 9 and
Table 10 three categories of sensor sets are distinguished: sets containing only passive sensors, sets of active sensors, and sets that comprise both passive and active sensors. For the passive and active sensor categories full set of the considered sensors is presented in the first row. The detection accuracy was tested using all possible subsets of the sensors. The subsets that have provided high detection and localization accuracy are included in
Table 9 and
Table 10. In case of the last category, which combines passive sensors with active sensors, the results are presented for the subset that contains the lowest number of sensors and achieves the highest accuracy.
The results in
Table 9 and
Table 10 clearly show that high detection accuracy can be achieved by using the active sensors as well as the passive sensors. Vehicles were correctly detected (98% accuracy) based on data from three sensors: magnetometer, accelerometer, and light sensor. The same result was obtained in case of magnetometer and light sensor. However, the localization accuracy was decreased in that case. Addition of the other sensors did not improve the accuracy of vehicle detection. The best results regarding vehicle localization (in the passive sensors category) were observed for the sensor set consisting of magnetometer, accelerometer and vibration sensor. However, these results are not satisfactory, since the localization accuracy did not exceed 72%. The combination of passive and active sensors has improved these results only by 1%. This value shows that the range of passive sensors is limited as mentioned above.
In case of pedestrian detection (
Table 10) the active sensors performed better than the passive sensors. The best result (95% accuracy) was obtained by using microwave radar and LIDAR. For passive sensor set (accelerometer, light sensor, and PIR) the detection accuracy reached 89%. The results show that correct localization of pedestrians cannot be obtained when using only one sensor node. Therefore, for localization purposes of pedestrians and vehicles a sensor network with multiple sensor nodes installed along the road would be recommended. It should be also kept in mind that dedicated localization methods, which can provide better accuracy, were not considered in this study, as it is focused on the portable, easy to install, low-cost solutions.
The experimental results show that type of the housing as well as position of sensor influences the readings and detection accuracy. Data readings of LIDAR, light sensor or PIR are influenced by the housing and its orientation. The barometer was useful, while installed without any cover.
The RSSI value depends strongly on sensor position: it increases when sensors are installed over 50 cm above pavement and decreases when sensors are situated on the ground. It was also observed that the magnetometer readings were useful if a distance to the detected object was lower than 2 m. Finally, the accelerometer has to be firmly glued with the surface to provide useful measurements.
