Article

Low-Frequency Noise of Magnetic Sensors Based on the Anomalous Hall Effect in Fe–Pt Alloys

Department of Physics, Brown University, Providence, RI 02912, USA
*
Author to whom correspondence should be addressed.
Sensors 2019, 19(16), 3537; https://doi.org/10.3390/s19163537
Submission received: 22 July 2019 / Revised: 9 August 2019 / Accepted: 11 August 2019 / Published: 13 August 2019
(This article belongs to the Special Issue Magnetic Sensing Technology, Materials and Applications)

Abstract

:
We took advantage of the large anomalous Hall effect (AHE) in Fe–Pt ferromagnetic alloys and fabricated magnetic sensors for low-frequency applications. We characterized the low-frequency electronic noise and the field detectability of the FexPt100-x system with various thin film thicknesses and Fe concentrations. The noise source consisted of 1/f and Johnson noise. A large current density increased the 1/f noise but not the Johnson noise. We found that the field detectability of the optimized Fe–Pt thin film offers much better low-frequency performance than a highly sensitive commercial semiconductor Hall sensor. Anomalous Hall effect sensors are, therefore, good candidates for magnetic sensing applications.

1. Introduction

The anomalous Hall effect (AHE) in ferromagnetic metals and alloys has drawn a great deal of attention as a potential candidate for magnetic field sensing applications [1,2,3,4,5,6,7,8,9]. Due to its strong spin–orbit interaction (SOI), Fe–Pt alloys exhibit some of the largest AHE among all ferromagnetic metals [3,10,11,12,13]. Compared with widely used semiconductor Hall effect sensors [14,15,16], Fe–Pt alloys are stable and easy to fabricate using a typical thin-film fabrication process. The metallic nature of AHE sensors also allows broader frequency response up to multiple GHz [6]. While sensitivity of an AHE sensor may not be as high as a semiconductor Hall sensor, characterization and comparison of noise properties are essential for a fair comparison. Nevertheless, there have been little if any studies on the intrinsic electronic noise behavior of the AHE sensors and its comparison with the traditional semiconductor Hall sensors. In order to comprehensively characterize the performance and capability of the AHE sensor, we conducted a systematic measurement of its noise spectra and sensitivity to reveal its intrinsic sensing capability. In particular, we focused on FexPt100-x thin-film alloys with various thicknesses and Fe atomic concentrations.

2. Materials and Methods

We prepared the FexPt100-x thin films using the high vacuum magnetron sputtering technique which is detailed in [10]. We patterned the films into Hall bars with a single step lift-off photo-lithography process. All measurements were performed at room temperature. We used the standard four-probe method to measure AHE resistivity under an out-of-plane magnetic field [11]. We measured the noise spectra from the Hall leads using the two-channel time cross-correlation method [17]. All noise measurement was performed over a broad frequency range from 1 Hz to 5 kHz. From the measured field sensitivity and noise spectrum, we calculated the field detectability ( S T , in unit of T 2 / H z ), defined as the noise spectral density ( S V , in unit of V 2 / H z ) divided by sensitivity, under a specific input (or measuring) current into the AHE sensor.

3. Results and Discussion

The AHE resistivities of all our FexPt100-x thin-film samples were found to be linear in the magnetic field up to the saturation fields (4πMs, where Ms is the saturation magnetization). The results were presented in our previous work [3,10,11]. We also found that both intrinsic (Berry phase) mechanism and extrinsic side-jump mechanism contribute to the AHE, regardless of Fe concentration [10]. We first investigated the effect of Fe concentration x in the FexPt100-x thin film. As shown in Figure 1a, x = 29 gives a much higher Hall slope than other Fe concentrations. As for thickness dependence, we obtained the highest Hall slope of 16.6   µ Ω · cm / T in the 20 nm thick Fe29Pt71 sample at room temperature. Correspondingly, the best field sensitivity reaches 23.6   V / A   T , which is smaller than the field sensitivity of traditional semiconductor Hall sensors [14,16]. Another important parameter is the output resistance of our Hall sensor, which is the resistance between the two Hall leads. As discussed later, the output resistance defines the noise floor at high frequency. Additionally, low output resistance is required for radio-frequency application. Figure 1b shows output resistance for the Fe29Pt71 samples with various thicknesses. The output resistance follows a power-law relationship as R ~ t 1.1 (the exponent is close to 1, as would be expected).
Figure 2a shows some noise spectra of a representative 4 nm thick Fe29Pt71 thin-film sample under various input currents from 0 to 1.5 mA. At high frequency, the white Johnson noise dominates and shows no dependence on the input current. On the other hand, the low-frequency 1/f noise tends to increase as the input current rises above 0.1 mA. The knee frequency f k n e e can be defined as the crossover point between 1/f noise and white noise, where 1/f noise equals Johnson noise. Spectra of the field detectability are shown in Figure 2b. At high frequency, a larger input current leads to better detectability. The effect of input current becomes complicated at low frequency. At relatively small input current, a larger input current improves field detectability. At a large input current, low-frequency field detectability becomes almost independent of input current.
To understand such behavior, we measured noise spectra of a 20 nm thick Fe29Pt71 sample under a broad range of input currents (0.01 to 8.9 mA). As shown in Figure 3a, high-frequency noise is independent of input current, and its value can be well explained by Johnson noise. As long as the input current is not large enough to significantly heat up the thin film, high-frequency white noise is unchanged. Since high-frequency white noise is unchanged, we can use knee frequency to characterize low-frequency noise. Figure 3b shows f k n e e at different input currents for the 5 nm thick Fe29Pt71 sample. When the input current is less than 1 mA, f k n e e is nearly constant. However, beyond 1 mA, f k n e e increases quadratically with input current. The transition point between low and high input current is defined as the critical current. Figure 3c shows the low-frequency noise at 10 Hz of the Fe29Pt71 samples with different thicknesses below each sample’s critical current. 1/f noise is commonly believed to be the thermal fluctuation of discrete fluctuators. The noise power of 1/f noise is inversely proportional to the number of fluctuators. Therefore, the power-law relationship ( S v 1 / 2 ~ t 0.5 ) is expected, assuming that the density of fluctuators has no dependence on film thickness. Figure 3d shows the relationship between critical current and sample cross-section area. As expected, a linear relationship is observed, and the slope gives a critical current density (Jc) of 1.7 × 10 6   A / cm 3 . This number is an intrinsic value of the AHE sensor at a particular Fe concentration x. Deviation of the data from the fitting line is mainly due to uncertainty in determining the critical current. In addition, a small offset on the x-axis can be observed, which can be attributed to the surface dead layer effect [18]. The desired input current is slightly higher than the critical current. Thus, low-frequency detectability is optimized and power consumption of the AHE sensor is not too large.
Figure 4a,b shows the field detectability of the FexPt100-x samples at high and low frequencies. For the fixed sample thickness, the Fe29Pt71 alloy has the largest Hall slope and the best detectability value. At both high and low frequencies, field detectability follows a power-law relationship with film thickness, with the exponent close to −0.5. The best detectability is achieved in the 30 nm thick Fe29Pt71 sample ( 50   n T / H z at 1 kHz and 7 μ T / H z at 1 Hz).
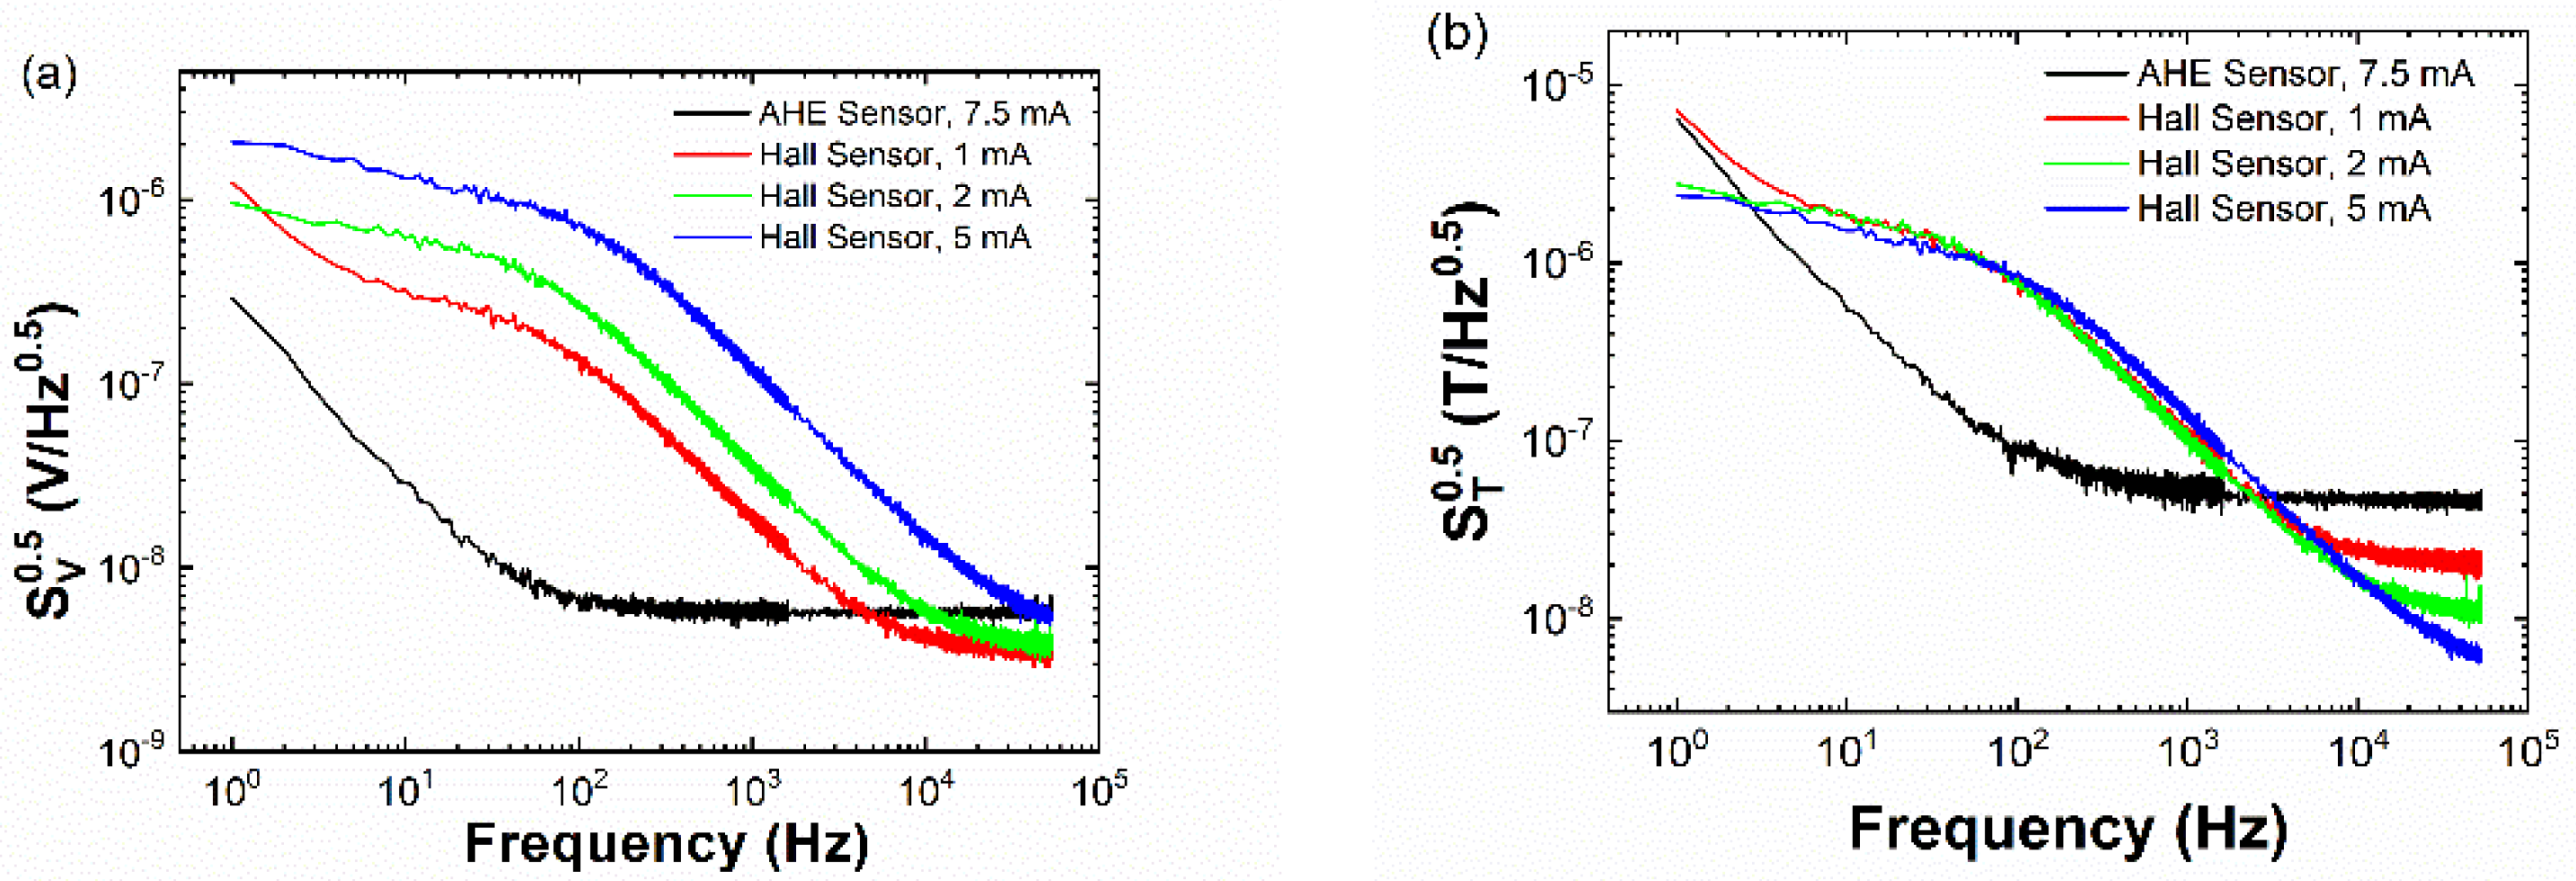
For comparison in performance, we measured the voltage noise and field detectability spectra of a highly sensitive commercial semiconductor Hall sensor acquired from LakeShore (Model HGT-2101, Westerville, OH, USA). Commercial Hall sensors typically suffer from random telegraph noise (RTN) [19]. Figure 5a,b shows the comparison in noise behavior between the commercial Hall sensor and the AHE sensor. As can be seen, the low-frequency noise of the AHE sensors is one to two orders of magnitude smaller than that of the semiconductor Hall sensor. Even though the sensitivity of our AHE thin-film sensor ( 8.2   V / A   T ) is one order of magnitude lower than that of the semiconductor Hall sensor ( 173   V / A   T ), the AHE sensor outperforms the semiconductor Hall sensor in terms of field detectability in the frequency range of 3 to 1500 Hz. Similar to 1/f noise, the noise power of RTN is inversely proportional to the number of fluctuators. Roughly speaking, the number of fluctuators is related to the number of charge carriers. Therefore, the low carrier density of semiconductor Hall sensors leads to larger noise at low frequency, which compensates for the high sensitivity. On the other hand, AHE sensors have a much higher carrier density and thus reduced low-frequency noise. Since low-frequency noise of both sensors scales with input current, an increase in input current does not improve their low-frequency performance. On the other hand, both sensors should have better field detectability at high frequency if input current is further increased.

4. Conclusions

In conclusion, we characterized the noise behavior and the magnetic sensing capability of anomalous Hall effect sensors based on FexPt100-x thin-film alloys with variable thicknesses and Fe concentration x. In the FexPt100-x system, the field detectability depends on sample thickness, Fe concentration x, Hall slope, and input (measuring) current density. Fe29Pt71 thin films offer the best field detectability, that is, 50   n T / H z at 1 kHz and 7   μ T / H z at 1 Hz. The Fe29Pt71 AHE sensor outperforms a highly sensitive commercial Hall sensor in the frequency range of 31–500 Hz. The AHE sensor is metal based and can be easily fabricated. Its low-frequency magnetic sensing performance makes it a promising magnetic sensor candidate. Further optimization in AHE sensors may make AHE sensors rival the best semiconductor Hall sensors.

Author Contributions

Conceptualization, Q.H. and G.X.; Data curation, Q.H.; Formal analysis, Y.Z. and Q.H.; Funding acquisition, G.X.; Investigation, Q.H.; Methodology, Y.Z. and Q.H.; Project administration, G.X.; Resources, Q.H.; Software, Q.H.; Supervision, G.X.; Validation, Q.H. and G.X.; Visualization, Y.Z. and Q.H.; Writing—original draft, Y.Z. and Q.H.; Writing—review and editing, G.X.

Funding

This work was supported by the King Abdullah University of Science and Technology (KAUST) through the Sensor Initiative.

Conflicts of Interest

The authors declare no conflict of interest.

References

  1. Nagaosa, N.; Sinova, J.; Onoda, S.; MacDonald, A.H.; Ong, N.P. Anomalous Hall effect. Rev. Mod. Phys. 2010, 82, 1539–1592. [Google Scholar] [CrossRef] [Green Version]
  2. Moritz, J.; Rodmacq, B.; Auffret, S.; Dieny, B. Extraordinary Hall effect in thin magnetic films and its potential for sensors, memories and magnetic logic applications. J. Phys. D Appl. Phys. 2008, 41, 135001. [Google Scholar] [CrossRef]
  3. Canedy, C.; Gong, G.; Wang, J.; Xiao, G. Large magnetic Hall effect in ferromagnetic Fex Pt100− x thin films. J. Appl. Phys. 1996, 79, 6126–6128. [Google Scholar] [CrossRef]
  4. Canedy, C.L.; Li, X.W.; Xiao, G. Large magnetic moment enhancement and extraordinary Hall effect in Co/Pt superlattices. Phys. Rev. B 2000, 62, 508–519. [Google Scholar] [CrossRef] [Green Version]
  5. Cheng, Y.; Zheng, R.; Liu, H.; Tian, Y.; Li, Z. Large extraordinary Hall effect and anomalous scaling relations between the Hall and longitudinal conductivities in ε-Fe3N nanocrystalline films. Phys. Rev. B 2009, 80, 174412. [Google Scholar] [CrossRef]
  6. Fergen, I.; Seemann, K.; von der Weth, A.; Schuppen, A. Soft ferromagnetic thin films for high frequency applications. J. Magn. Magn. Mater. 2002, 242, 146–151. [Google Scholar] [CrossRef]
  7. Ni, Y.; Zhang, Z.; Nlebedim, I.; Jiles, D.C. Ultrahigh Sensitivity of Anomalous Hall Effect Sensor Based on Cr-Doped Bi2Te3 Topological Insulator Thin Films. IEEE Trans. Magn. 2016, 52, 1–4. [Google Scholar] [CrossRef]
  8. Satake, Y.; Fujiwara, K.; Shiogai, J.; Seki, T.; Tsukazaki, A. Fe-Sn nanocrystalline films for flexible magnetic sensors with high thermal stability. Sci. Rep. 2019, 9, 3282. [Google Scholar] [CrossRef] [PubMed] [Green Version]
  9. Vilanova Vidal, E.; Stryganyuk, G.; Schneider, H.; Felser, C.; Jakob, G. Exploring Co2MnAl Heusler compound for anomalous Hall effect sensors. Appl. Phys. Lett. 2011, 99, 132509. [Google Scholar] [CrossRef]
  10. Hao, Q.; Chen, W.Z.; Wang, S.T.; Xiao, G. Anomalous Hall effect and magnetic properties of FexPt100-x alloys with strong spin-orbit interaction. J. Appl. Phys. 2017, 122, 033901. [Google Scholar] [CrossRef]
  11. Miao, G.X.; Xiao, G. Giant Hall resistance in Pt-based ferromagnetic alloys. Appl. Phys. Lett. 2004, 85, 73–75. [Google Scholar] [CrossRef]
  12. Zhu, Y.; Cai, J.W. Ultrahigh sensitivity Hall effect in magnetic multilayers. Appl. Phys. Lett. 2007, 90, 012104. [Google Scholar] [CrossRef]
  13. Watanabe, M.; Masumoto, T. Extraordinary Hall effect in Fe–Pt alloy thin films and fabrication of micro Hall devices. Thin Solid Films 2002, 405, 92–97. [Google Scholar] [CrossRef]
  14. Haned, N.; Missous, M. Nano-tesla magnetic field magnetometry using an InGaAs–AlGaAs–GaAs 2DEG Hall sensor. Sens. Actuators A Phys. 2003, 102, 216–222. [Google Scholar] [CrossRef]
  15. Heremans, J.; Partin, D.L.; Thrush, C.M.; Green, L. Narrow-Gap Semiconductor Magnetic-Field Sensors and Applications. Semicond. Sci. Technol. 1993, 8, S424–S430. [Google Scholar] [CrossRef]
  16. Lee, J.-S.; Ahn, K.-H.; Jeong, Y.-H.; Kim, D.M. Quantum-well Hall devices in Si-delta-doped Al/sub 0.25/Ga/sub 0.75/As/GaAs and pseudomorphic Al/sub 0.25/Ga/sub 0.75/As/In/sub 0.25/Ga/sub 0.75/As/GaAs heterostructures grown by LP-MOCVD: Performance comparisons. IEEE Trans. Electron Devices 1996, 43, 1665–1670. [Google Scholar]
  17. Sampietro, M.; Fasoli, L.; Ferrari, G. Spectrum analyzer with noise reduction by cross-correlation technique on two channels. Rev. Sci. Instrum. 1999, 70, 2520–2525. [Google Scholar] [CrossRef]
  18. Wu, X.W.; Liu, C.; Li, L.; Jones, P.; Chantrell, R.W.; Weller, D. Nonmagnetic shell in surfactant-coated FePt nanoparticles. J. Appl. Phys. 2004, 95, 6810–6812. [Google Scholar] [CrossRef]
  19. Hicks, C.; Luan, L.; Moler, K.; Zeldov, E.; Shtrikman, H. Noise characteristics of 100 nm scale Ga As/Alx Ga1−x As scanning Hall probes. Appl. Phys. Lett. 2007, 90, 133512. [Google Scholar] [CrossRef]
Figure 1. (a) Hall slopes versus film thickness and Fe concentration x. (b) Output resistance of Fe29Pt71 Hall-bar samples with various film thicknesses. The red dashed line is the linear fitting line in the log–log plot, which gives R ~ t 1.1 .
Sensors 19 03537 g001
Figure 2. (a) Noise spectra and (b) field detectability spectra of the 4 nm thick Fe29Pt71 thin-film sample under various input currents.
Sensors 19 03537 g002
Figure 3. (a) High-frequency noise of the 20 nm thick Fe29Pt71 sample under various input currents. The red dashed line shows the theoretical prediction of Johnson noise 4 k B R T . (b) Knee frequency of the Fe29Pt71 sample under various input currents. Above critical current (~1 mA), knee frequency increases quadratically with input current. (c) Low-frequency noise of the Fe29Pt71 sample with different thicknesses. Input current is kept below critical current. The red dashed line shows the linear fitting in the log–log plot, which gives S v 1 / 2 ~ t 0.5 . (d) Critical current of the Fe29Pt71 sample with different cross-section areas (width of the Hall bar is 20 μm). The slope of the red dashed line gives the critical current density of 1.7 × 10 6   A / cm 2 .
Sensors 19 03537 g003
Figure 4. Field detectability of different FexPt100-x sensors at (a) 1 Hz and (b) 1 kHz. Both low-frequency and high-frequency detectabilities show the power-law relationship with film thickness, with the exponent close to −0.5.
Sensors 19 03537 g004
Figure 5. Comparison of the (a) voltage noise spectra and (b) field detectability spectra between the 30 nm thick Fe29Pt71 anomalous Hall effect (AHE) sensor and a commercial semiconductor Hall sensor.
Sensors 19 03537 g005