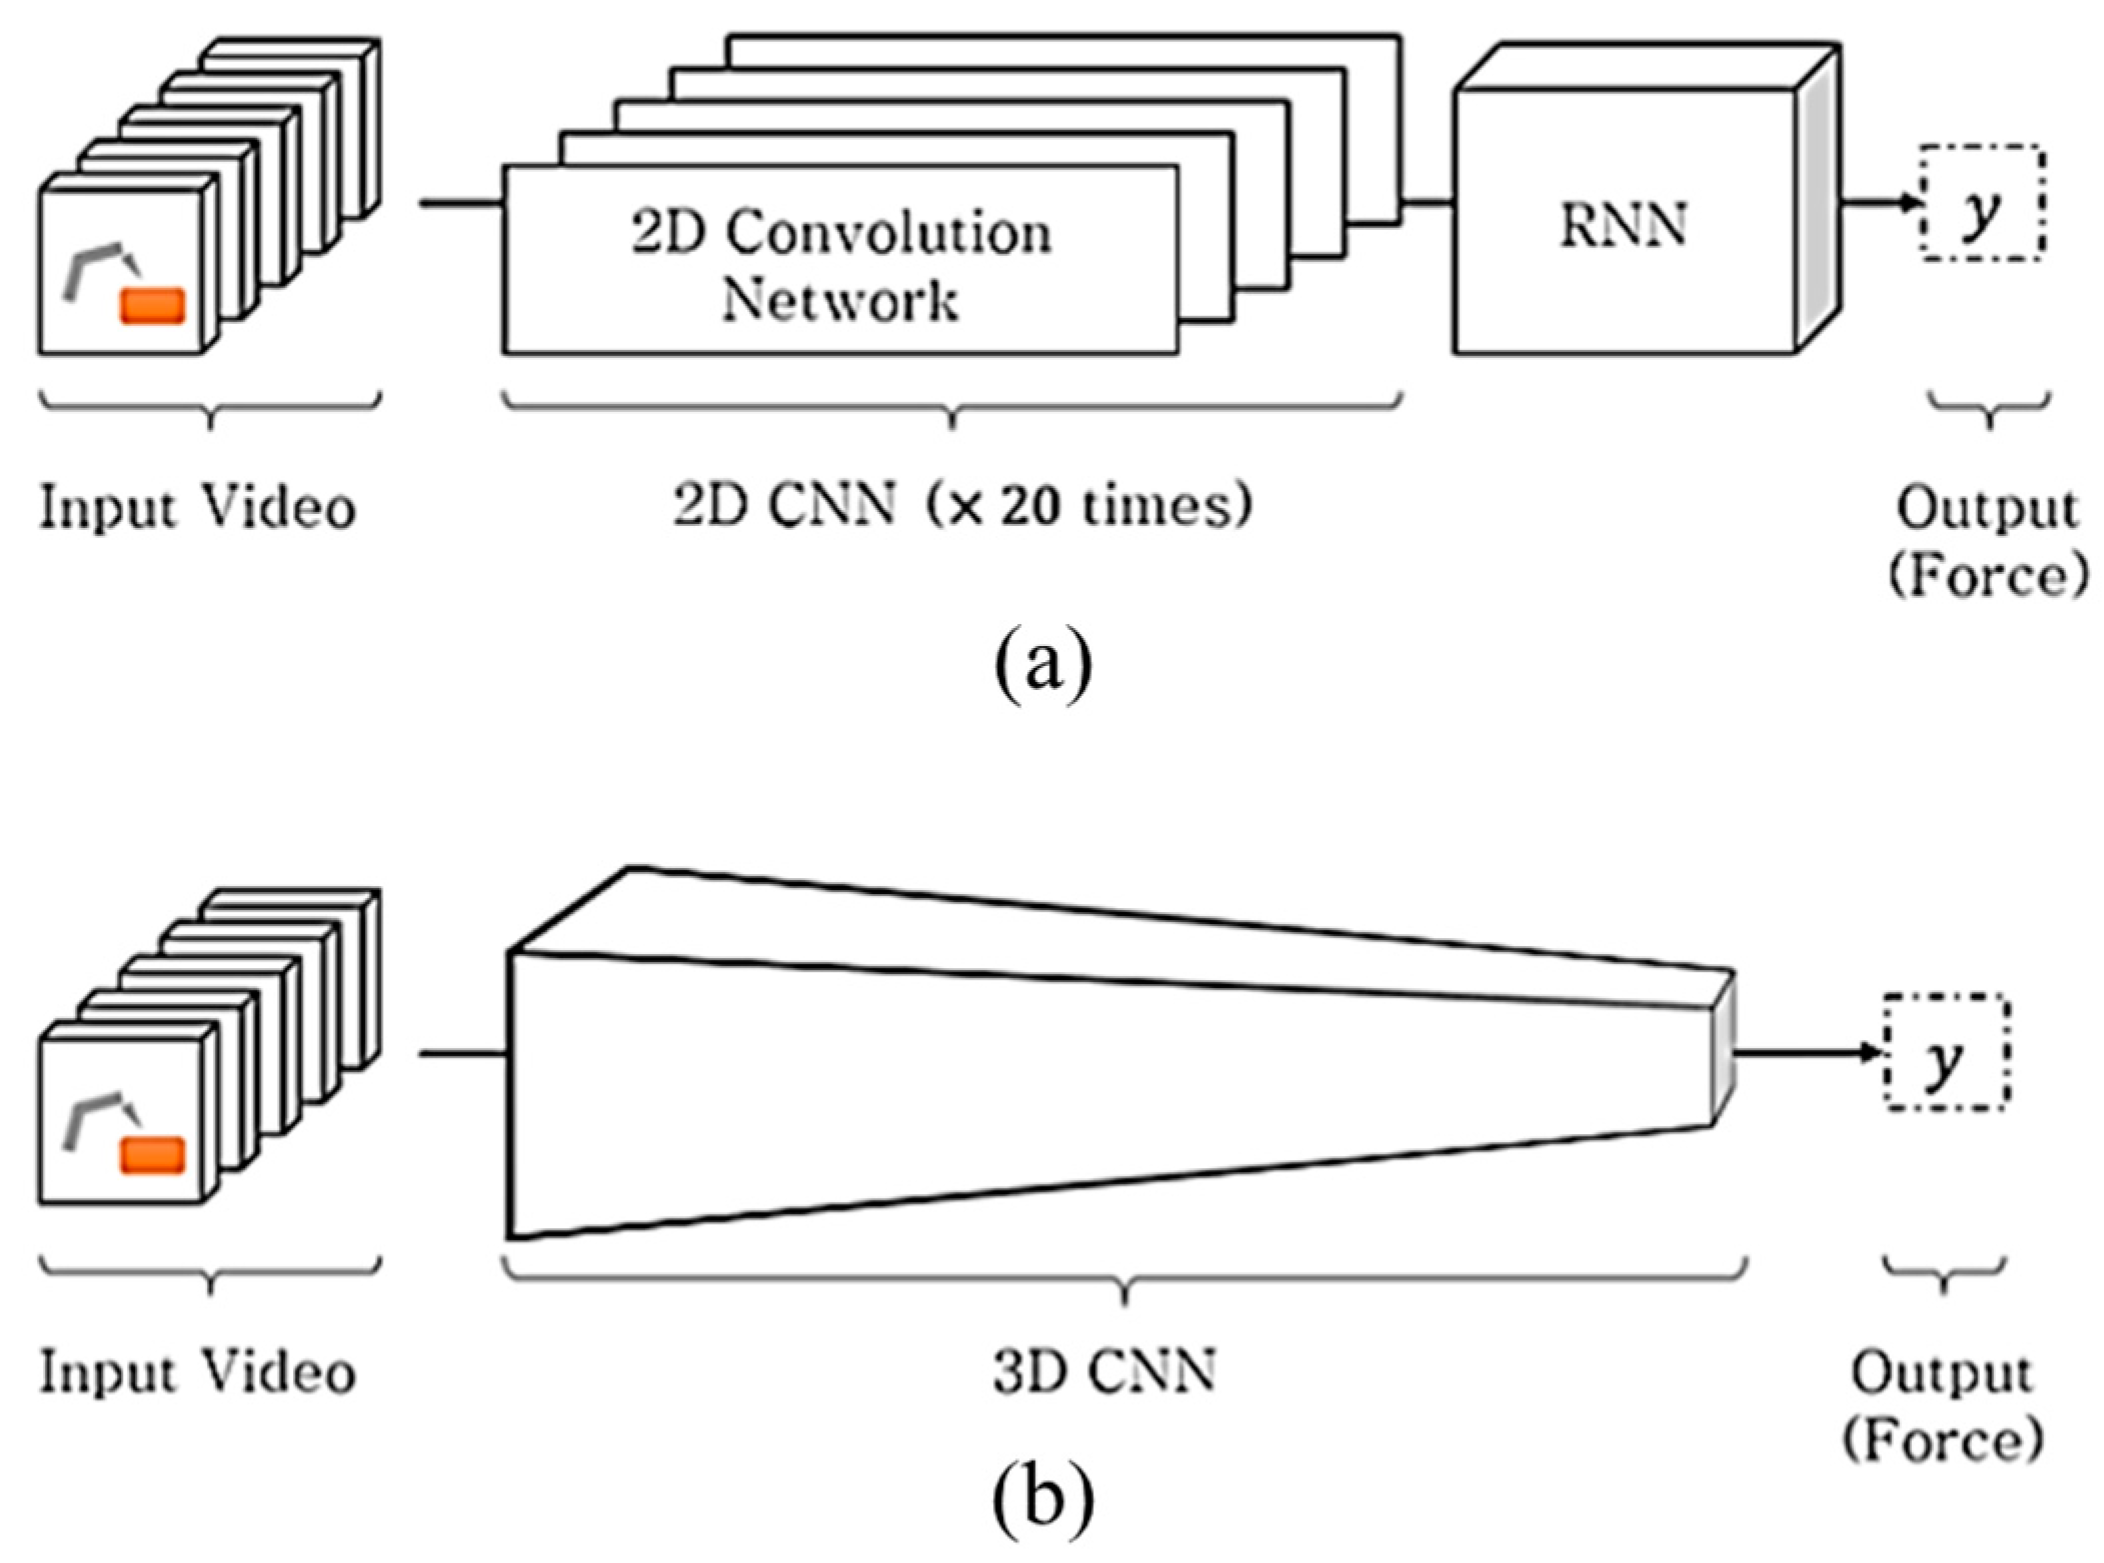
Figure 1.
(a) Heterogenous network structure in the Convolutional Neural Network (CNN) + Long Short-Term Memory (LSTM) method and (b) homogeneous network structure in 3D CNN method. Both methods are proposed for predicting the interaction force from the input video.
Figure 1.
(a) Heterogenous network structure in the Convolutional Neural Network (CNN) + Long Short-Term Memory (LSTM) method and (b) homogeneous network structure in 3D CNN method. Both methods are proposed for predicting the interaction force from the input video.
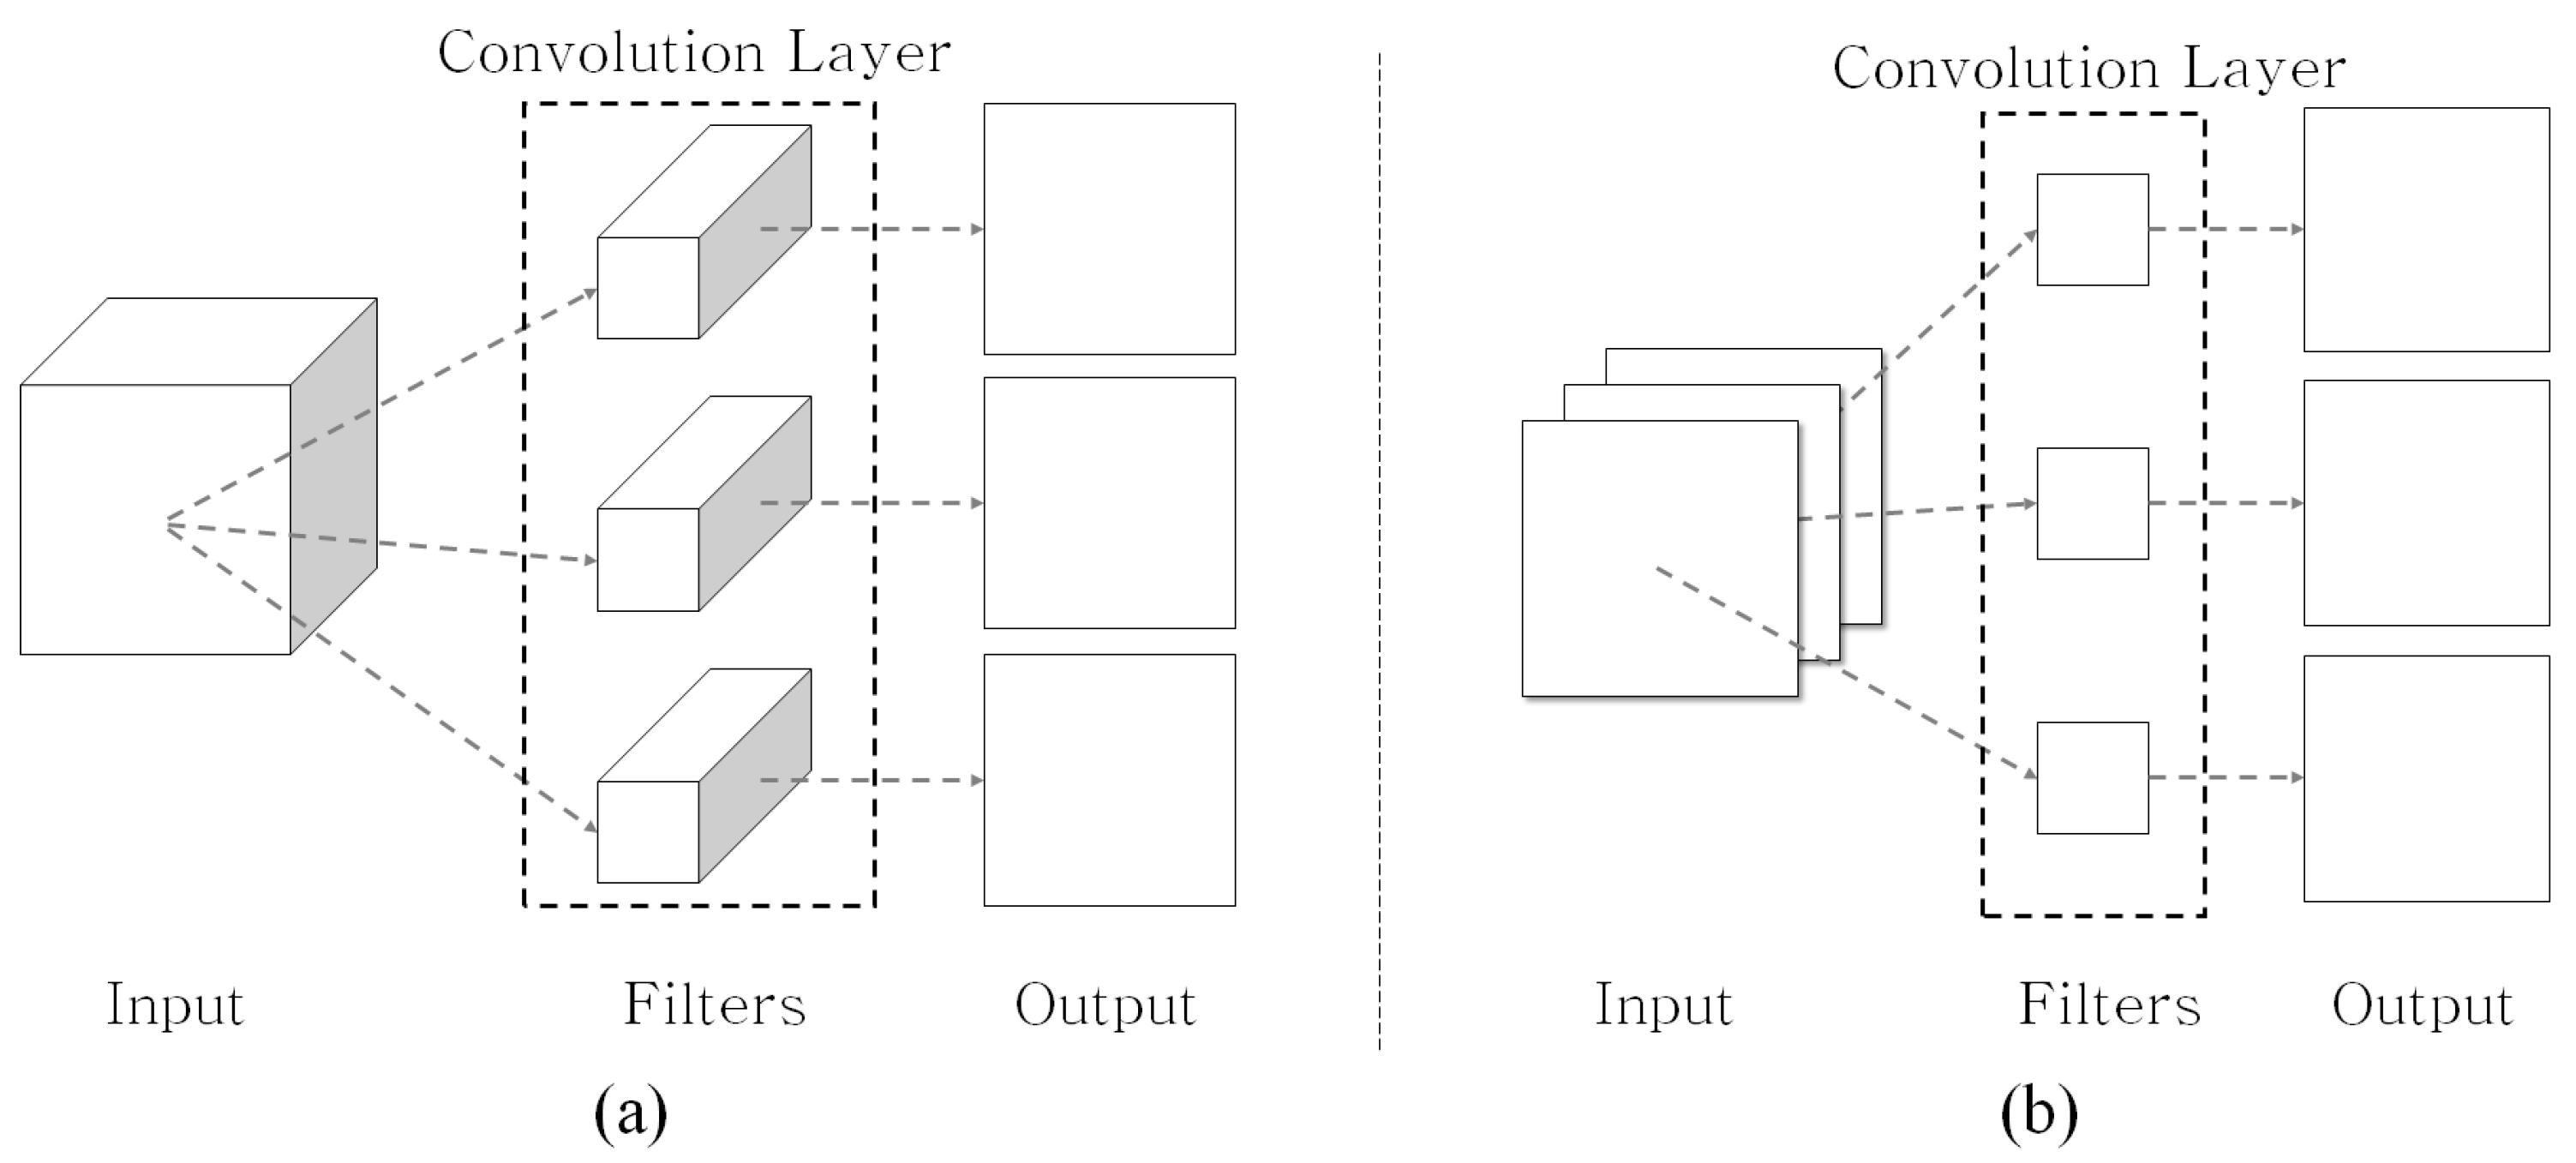
Figure 2.
(a) Traditional 2D CNN and (b) 2D depthwise CNN concepts.
Figure 2.
(a) Traditional 2D CNN and (b) 2D depthwise CNN concepts.
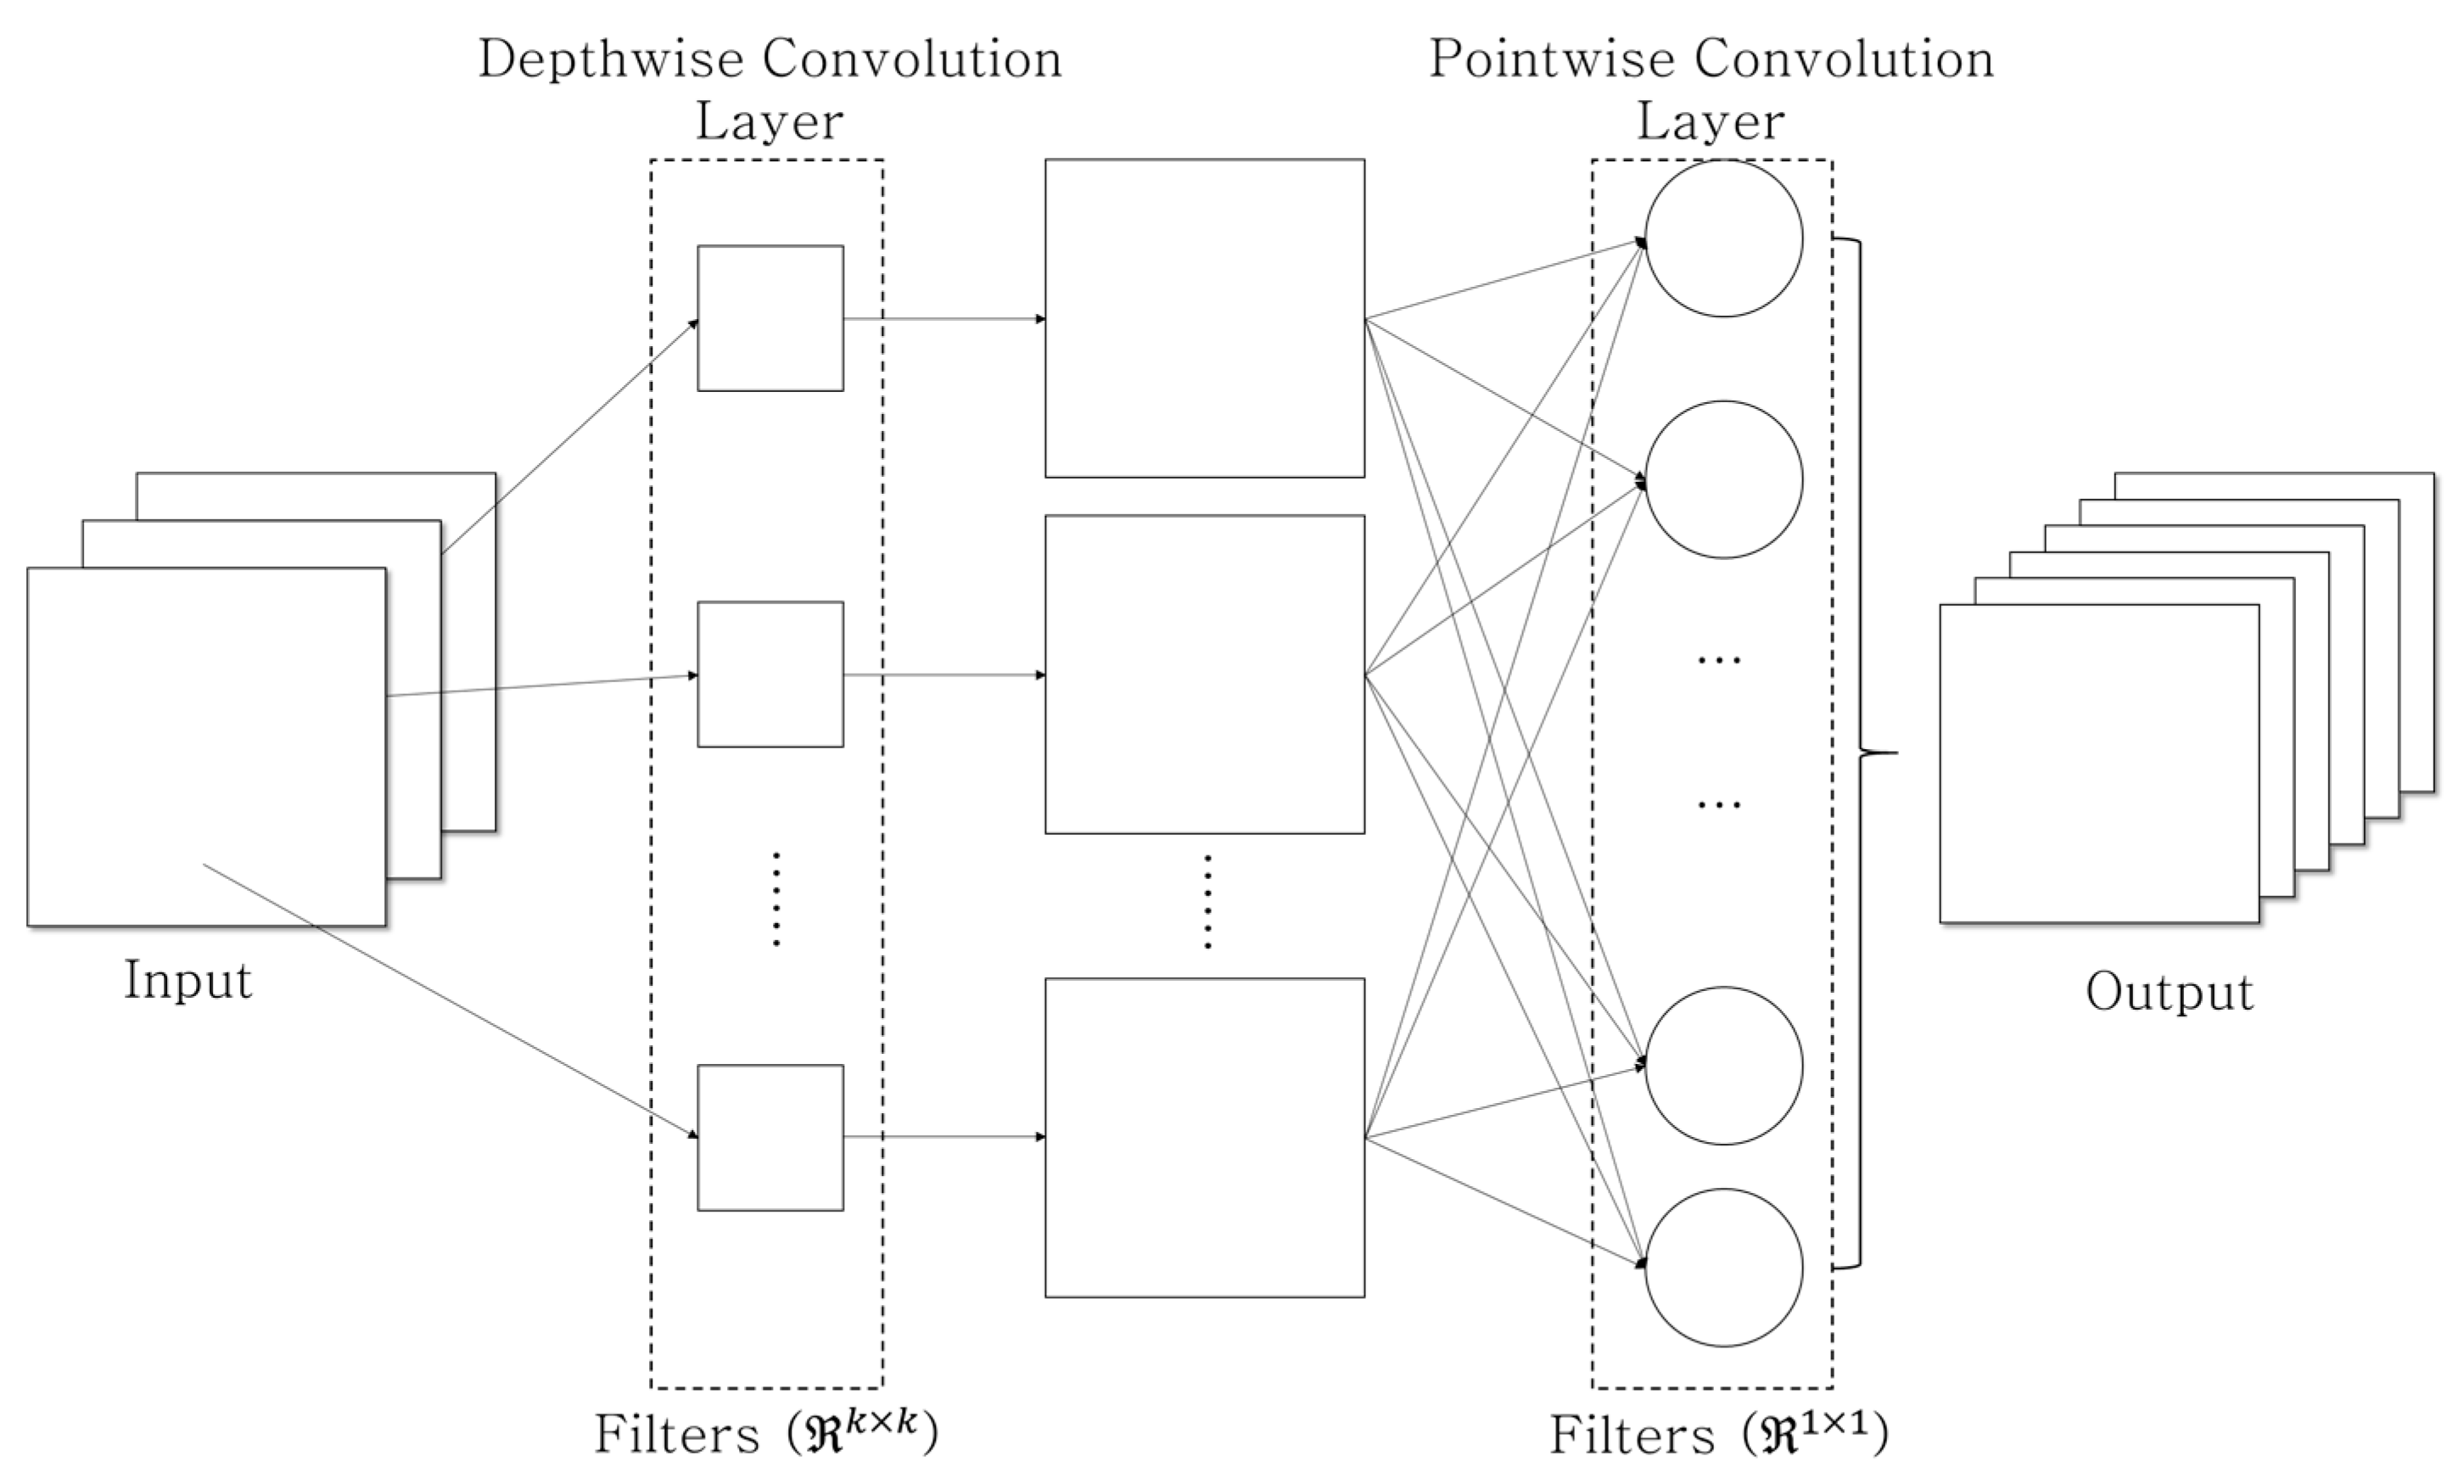
Figure 3.
Depthwise separable convolution concept consists of the depthwise convolution (e.g., ) and the pointwise convolution.
Figure 3.
Depthwise separable convolution concept consists of the depthwise convolution (e.g., ) and the pointwise convolution.
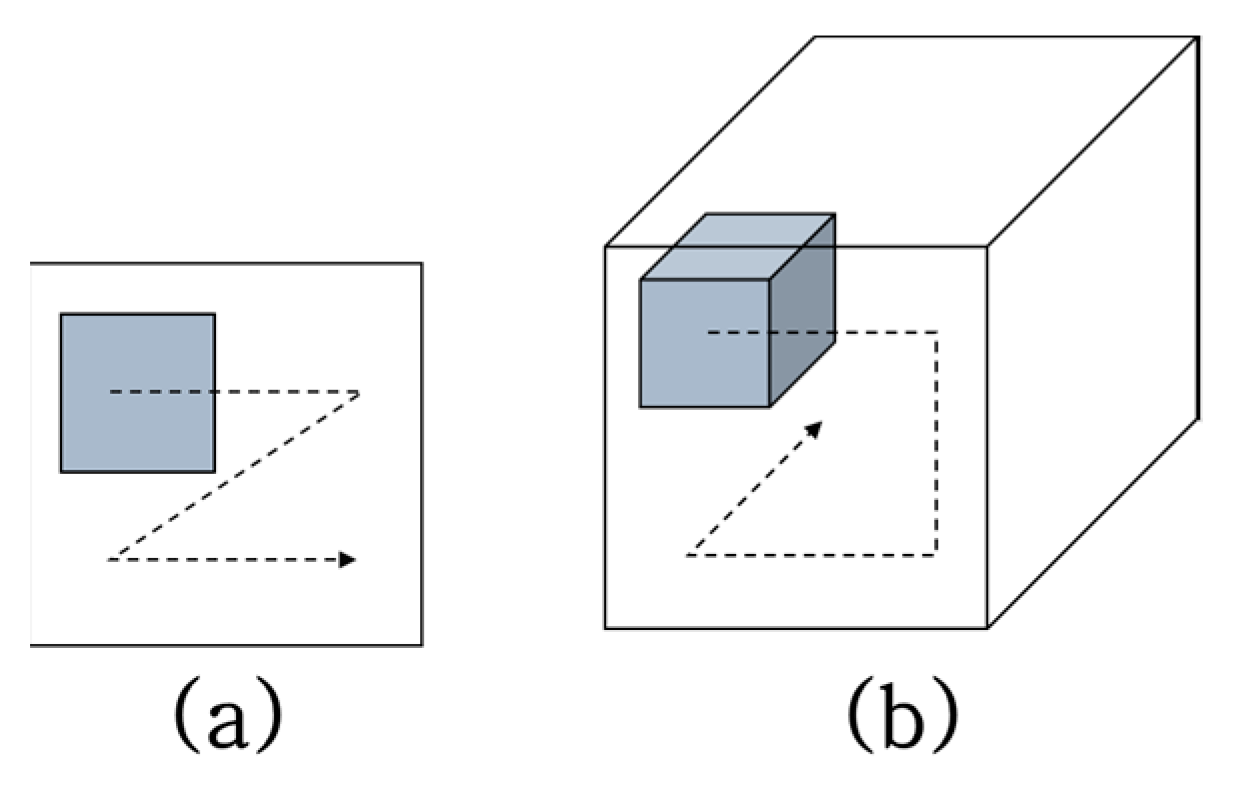
Figure 4.
Concepts of (a) 2D convolution and (b) 3D convolution.
Figure 4.
Concepts of (a) 2D convolution and (b) 3D convolution.
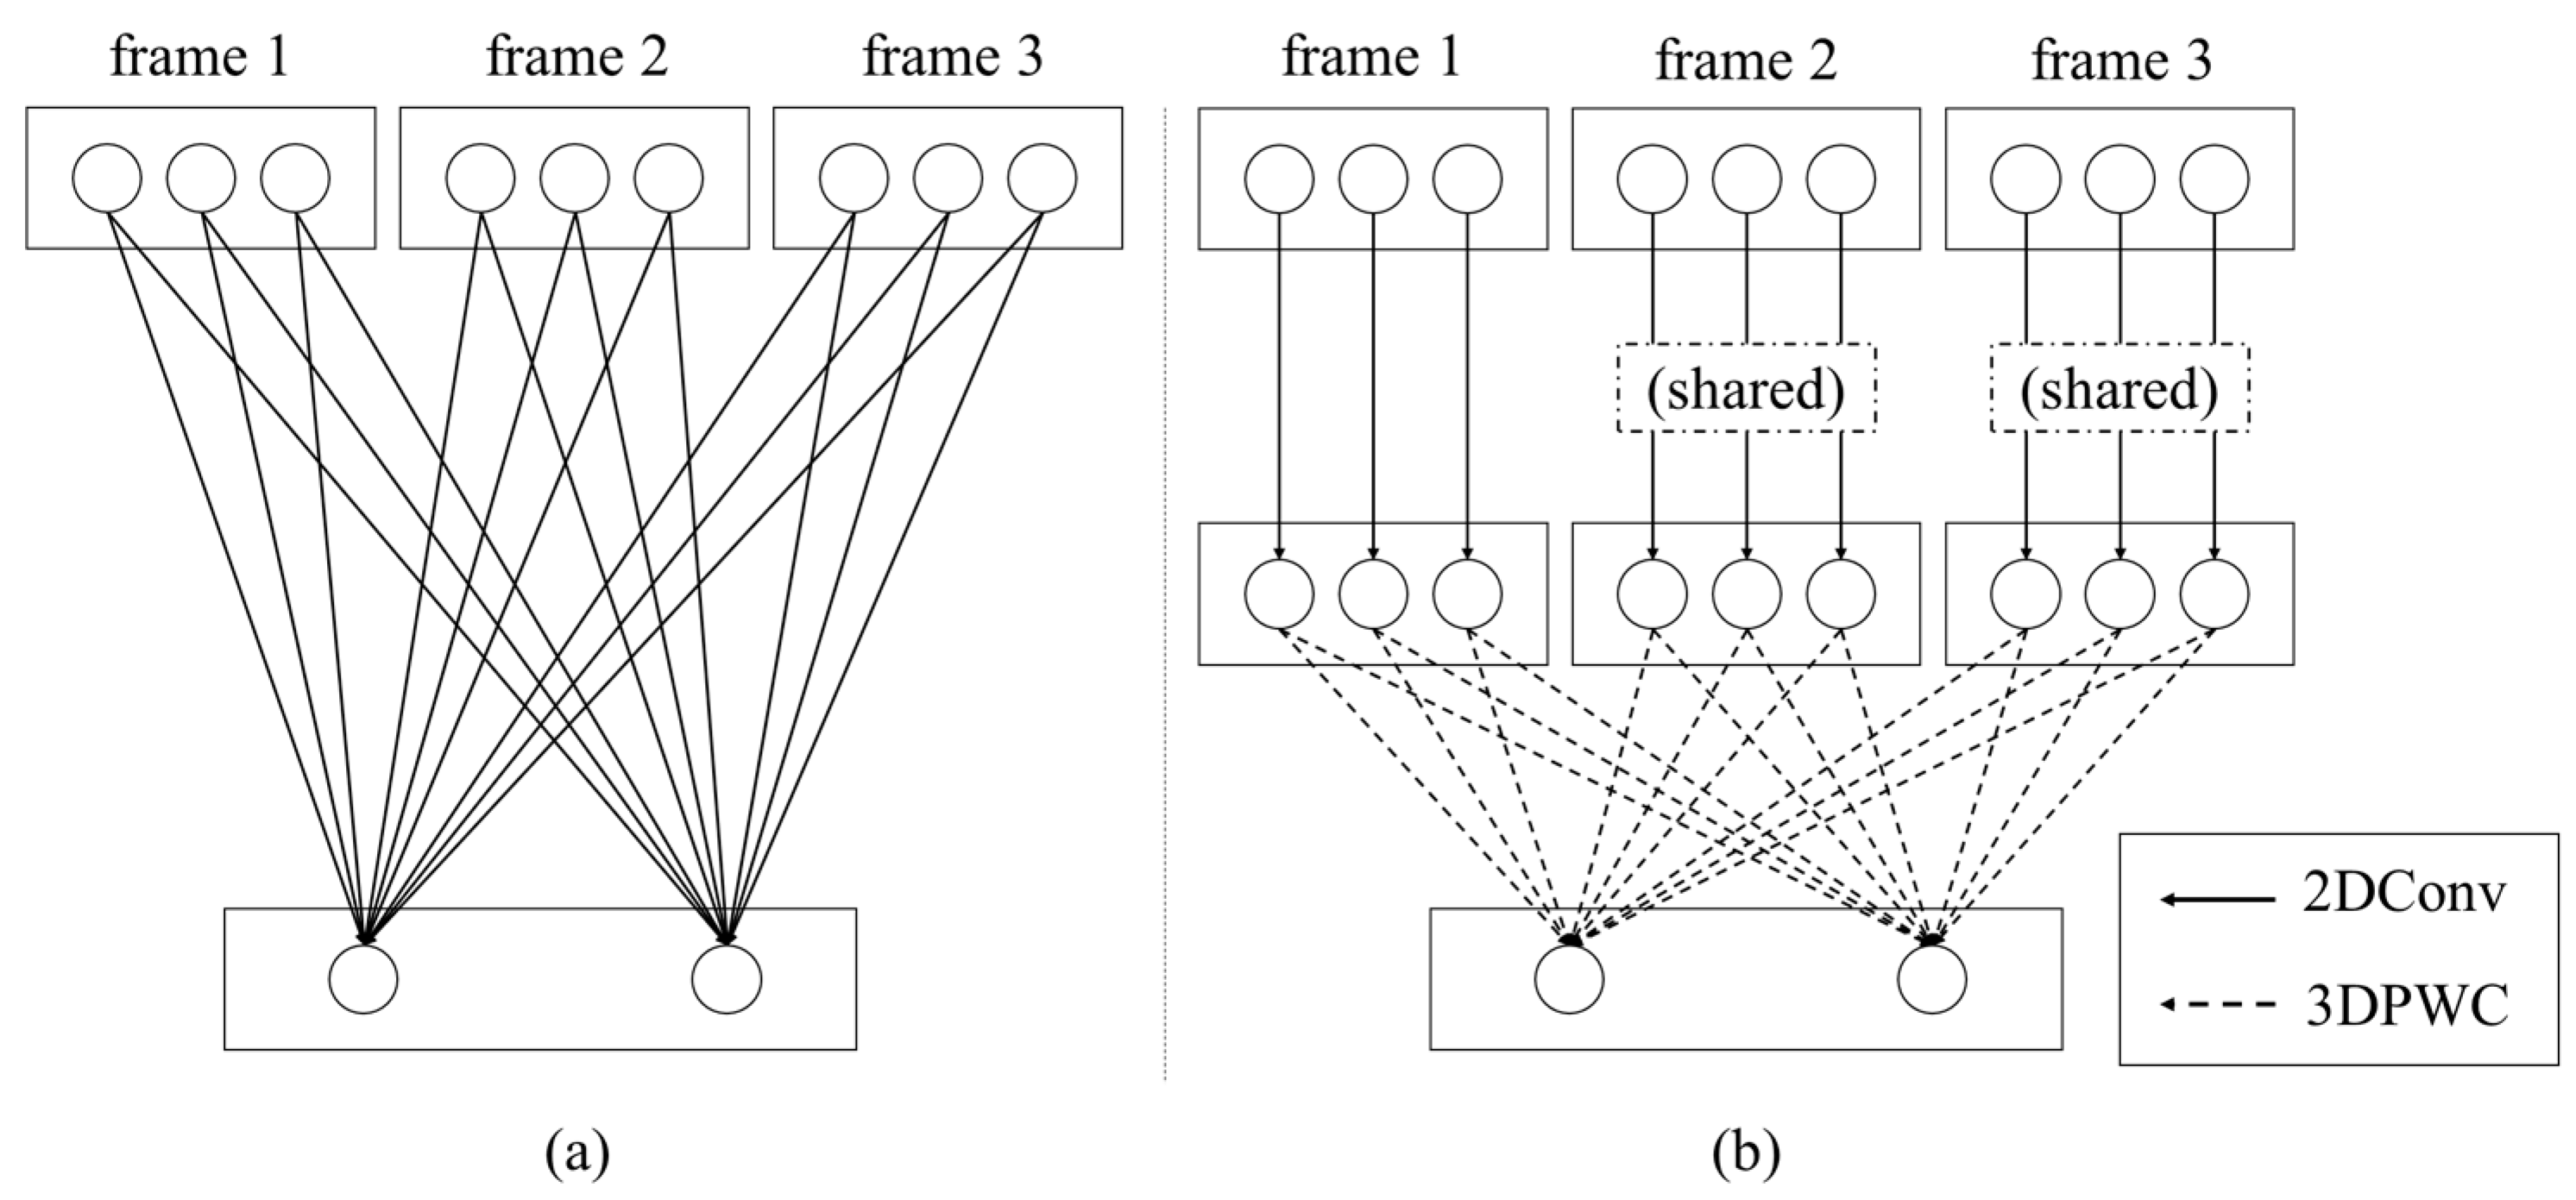
Figure 5.
Concepts of (a) 3D CNN and (b) proposed 3D depthwise separable CNN. The rectangles and circles represent the video frames and their corresponding channels, respectively. For example, (a) is a video with three frames as the input with each frame consisting of three channels. The output of 3D CNN is an output with two channels because the 3D CNN has two filters. (b) In the proposed method, three channels of a frame are independently applied with three corresponding 2D convolution filters, then the final output with two channels is made by two 3D PWC filters.
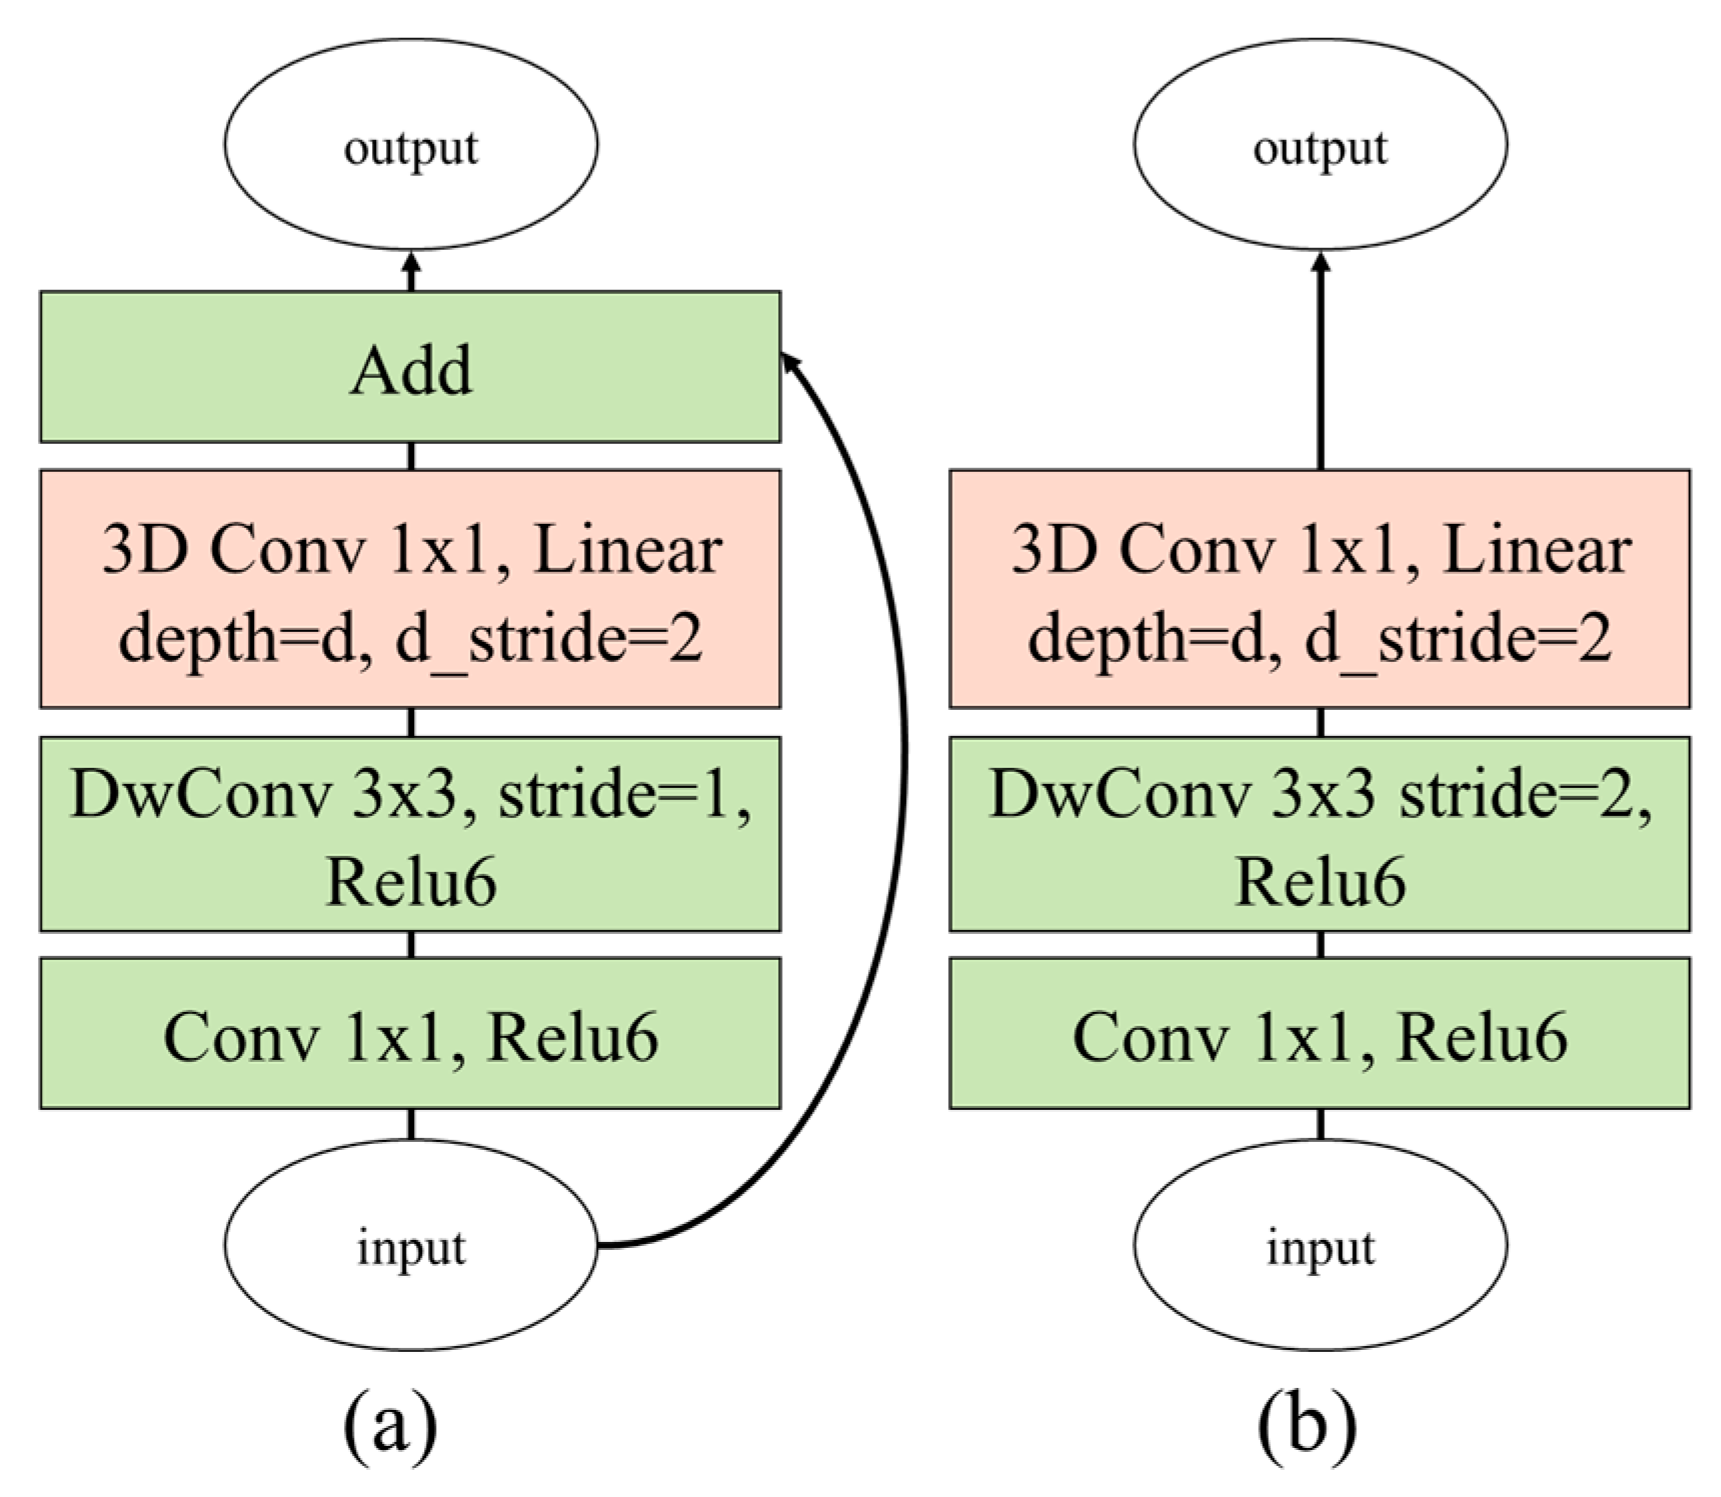
Figure 6.
Proposed bottleneck 3D modules based on (a) inverted residual block and (b) linear block (DwConv: depthwise convolutional filter).
Figure 6.
Proposed bottleneck 3D modules based on (a) inverted residual block and (b) linear block (DwConv: depthwise convolutional filter).
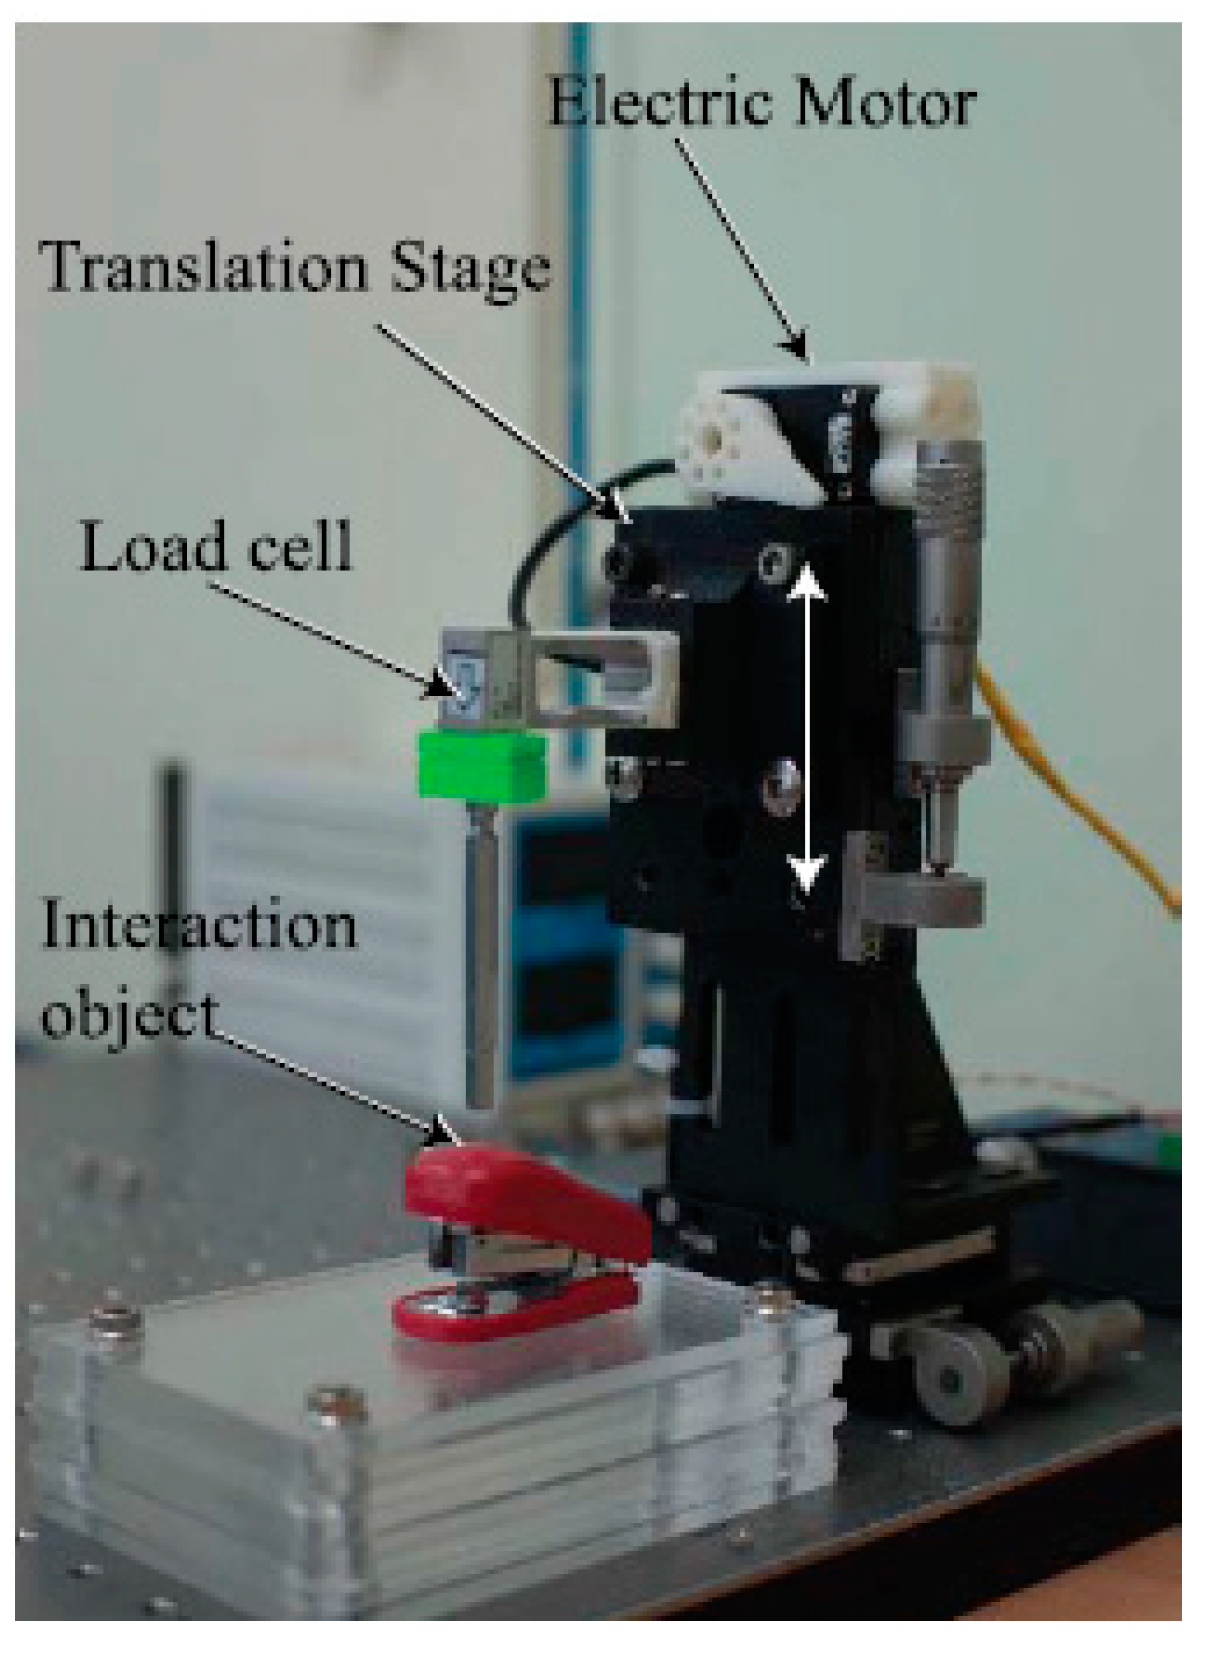
Figure 7.
Interaction force measurement system with load cell and translation stage with electric motor.
Figure 7.
Interaction force measurement system with load cell and translation stage with electric motor.
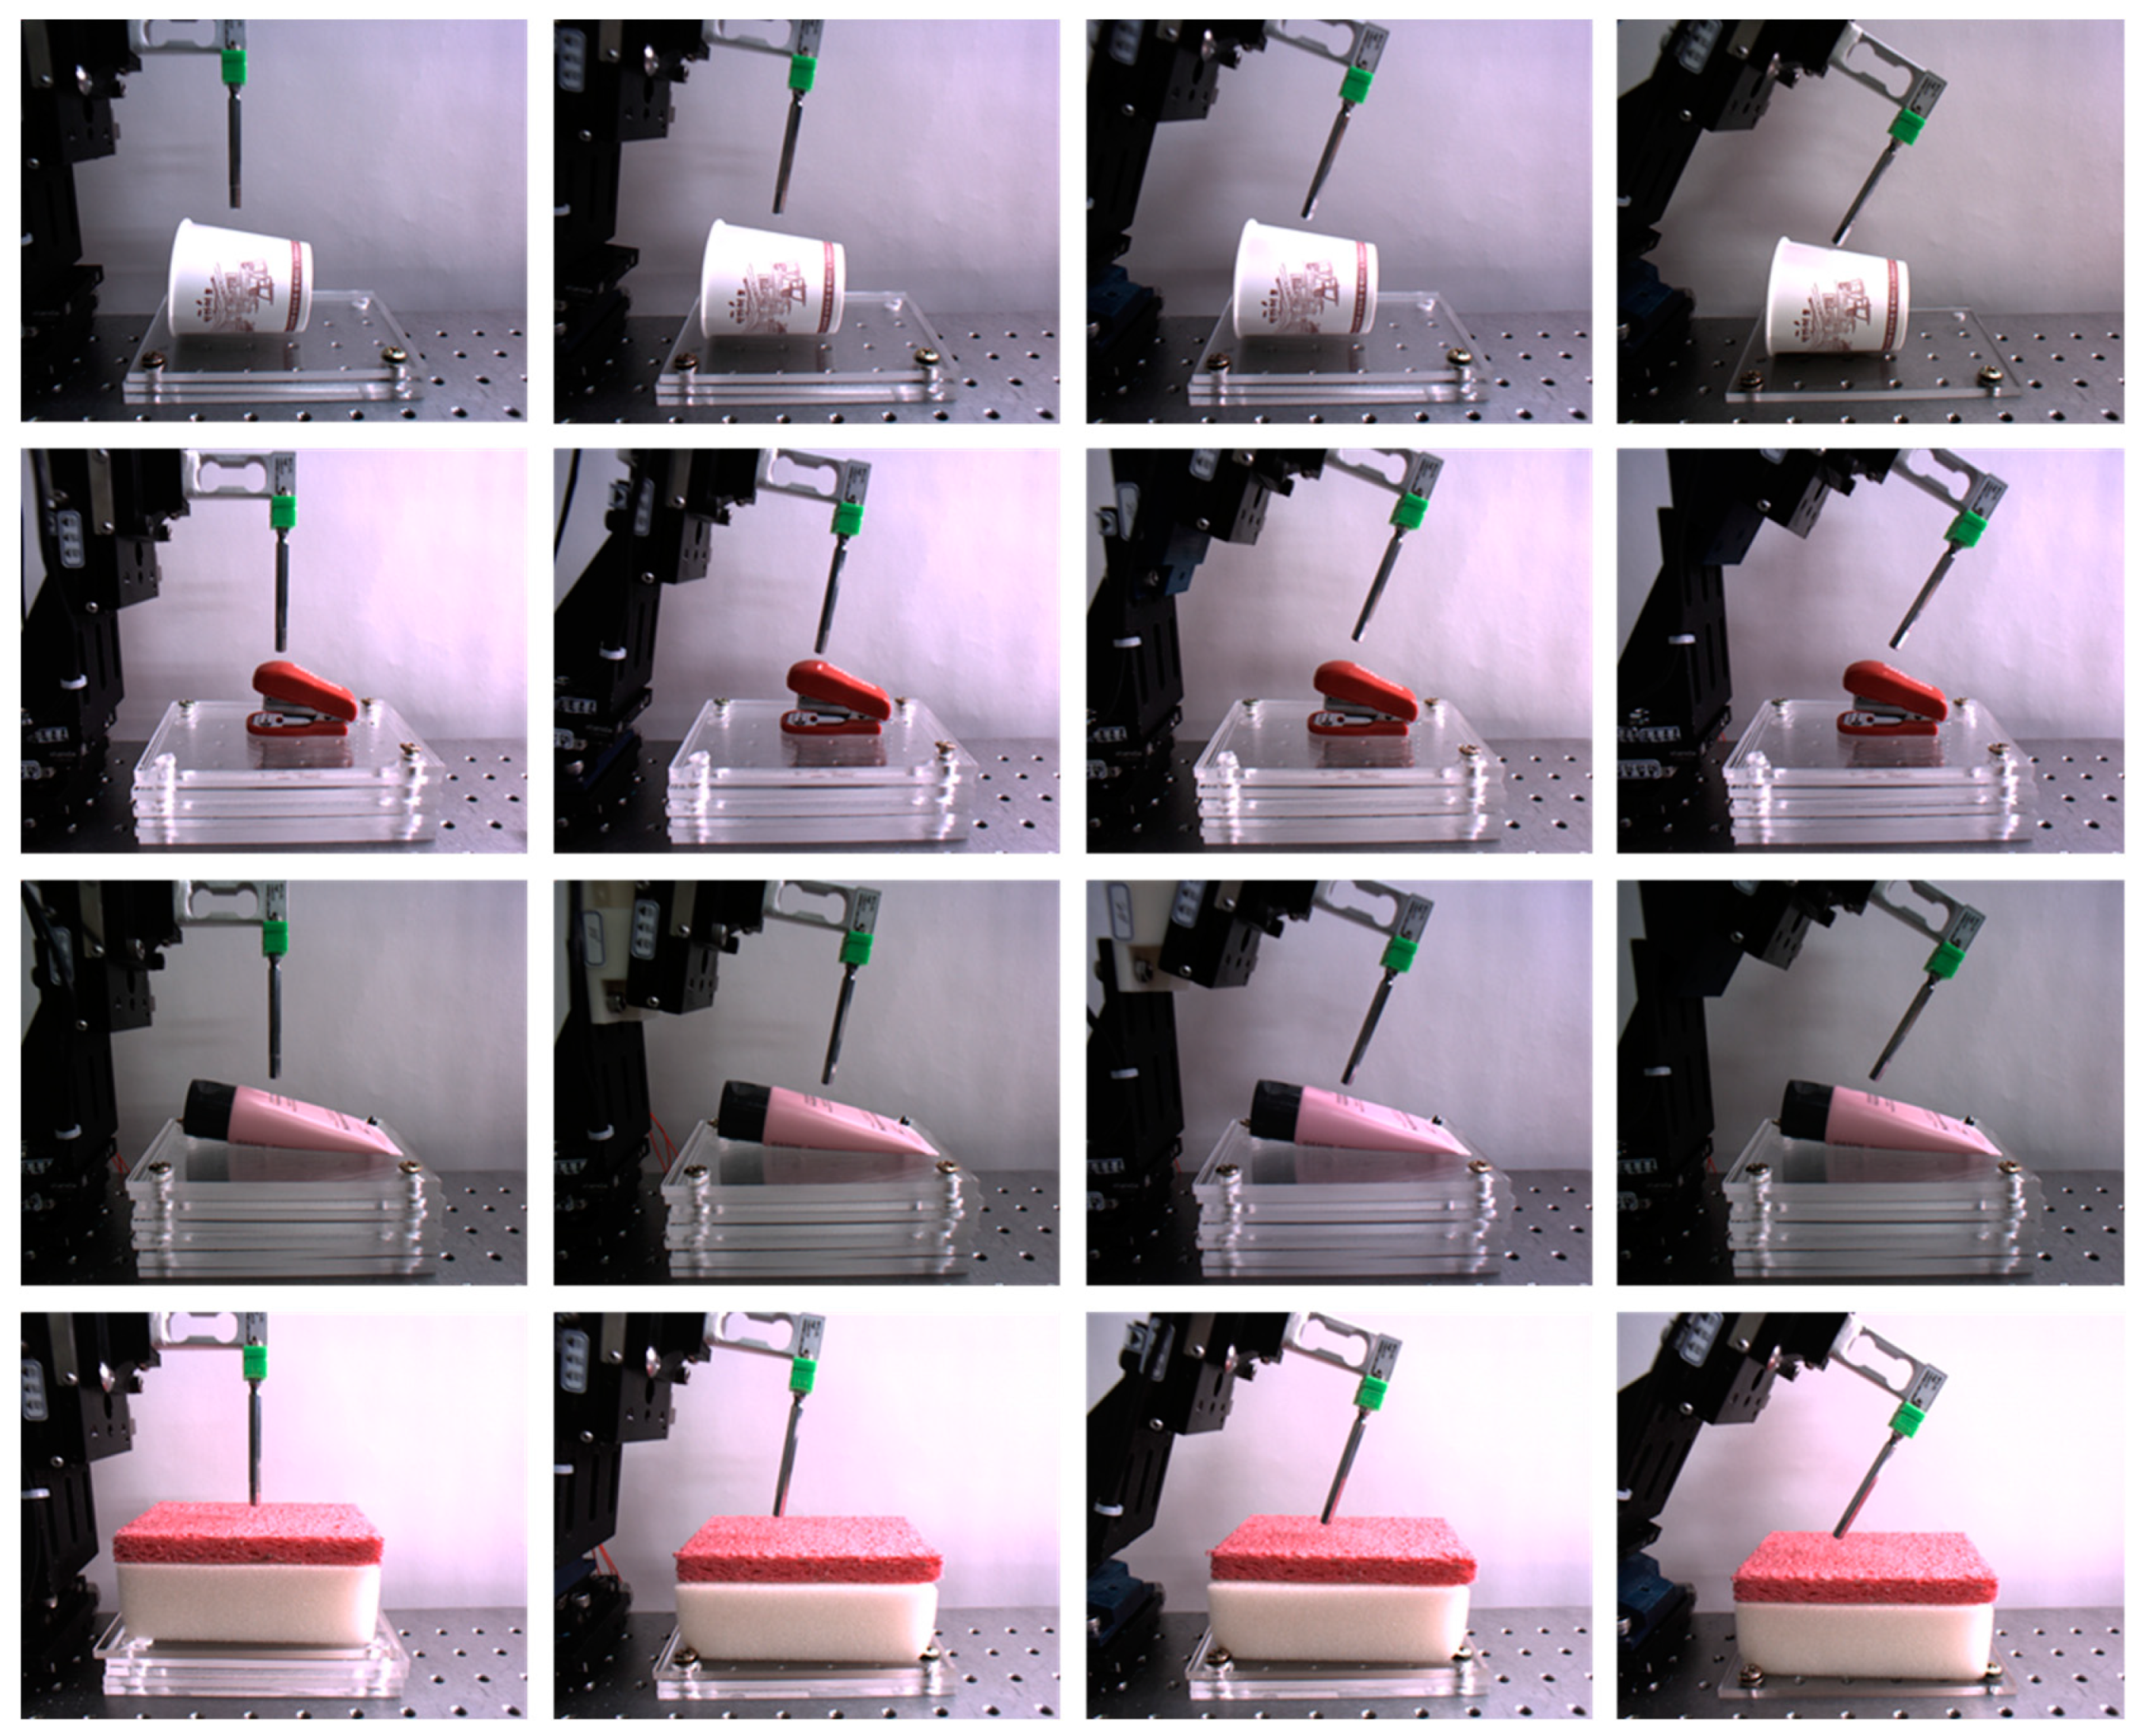
Figure 8.
Collected sample images. From the top to bottom rows, paper cup, stapler, tube, and sponge are shown; angle variations are from the left to right columns. The first and third-row images were captured with 350-lux illumination, whereas the second and fourth-row images were taken with 550 and 750-lux illuminations, respectively.
Figure 9.
Cropped and normalized sample images. (a) Sponge, (b) paper cup, (c) stapler, and (d) tube.
Figure 9.
Cropped and normalized sample images. (a) Sponge, (b) paper cup, (c) stapler, and (d) tube.
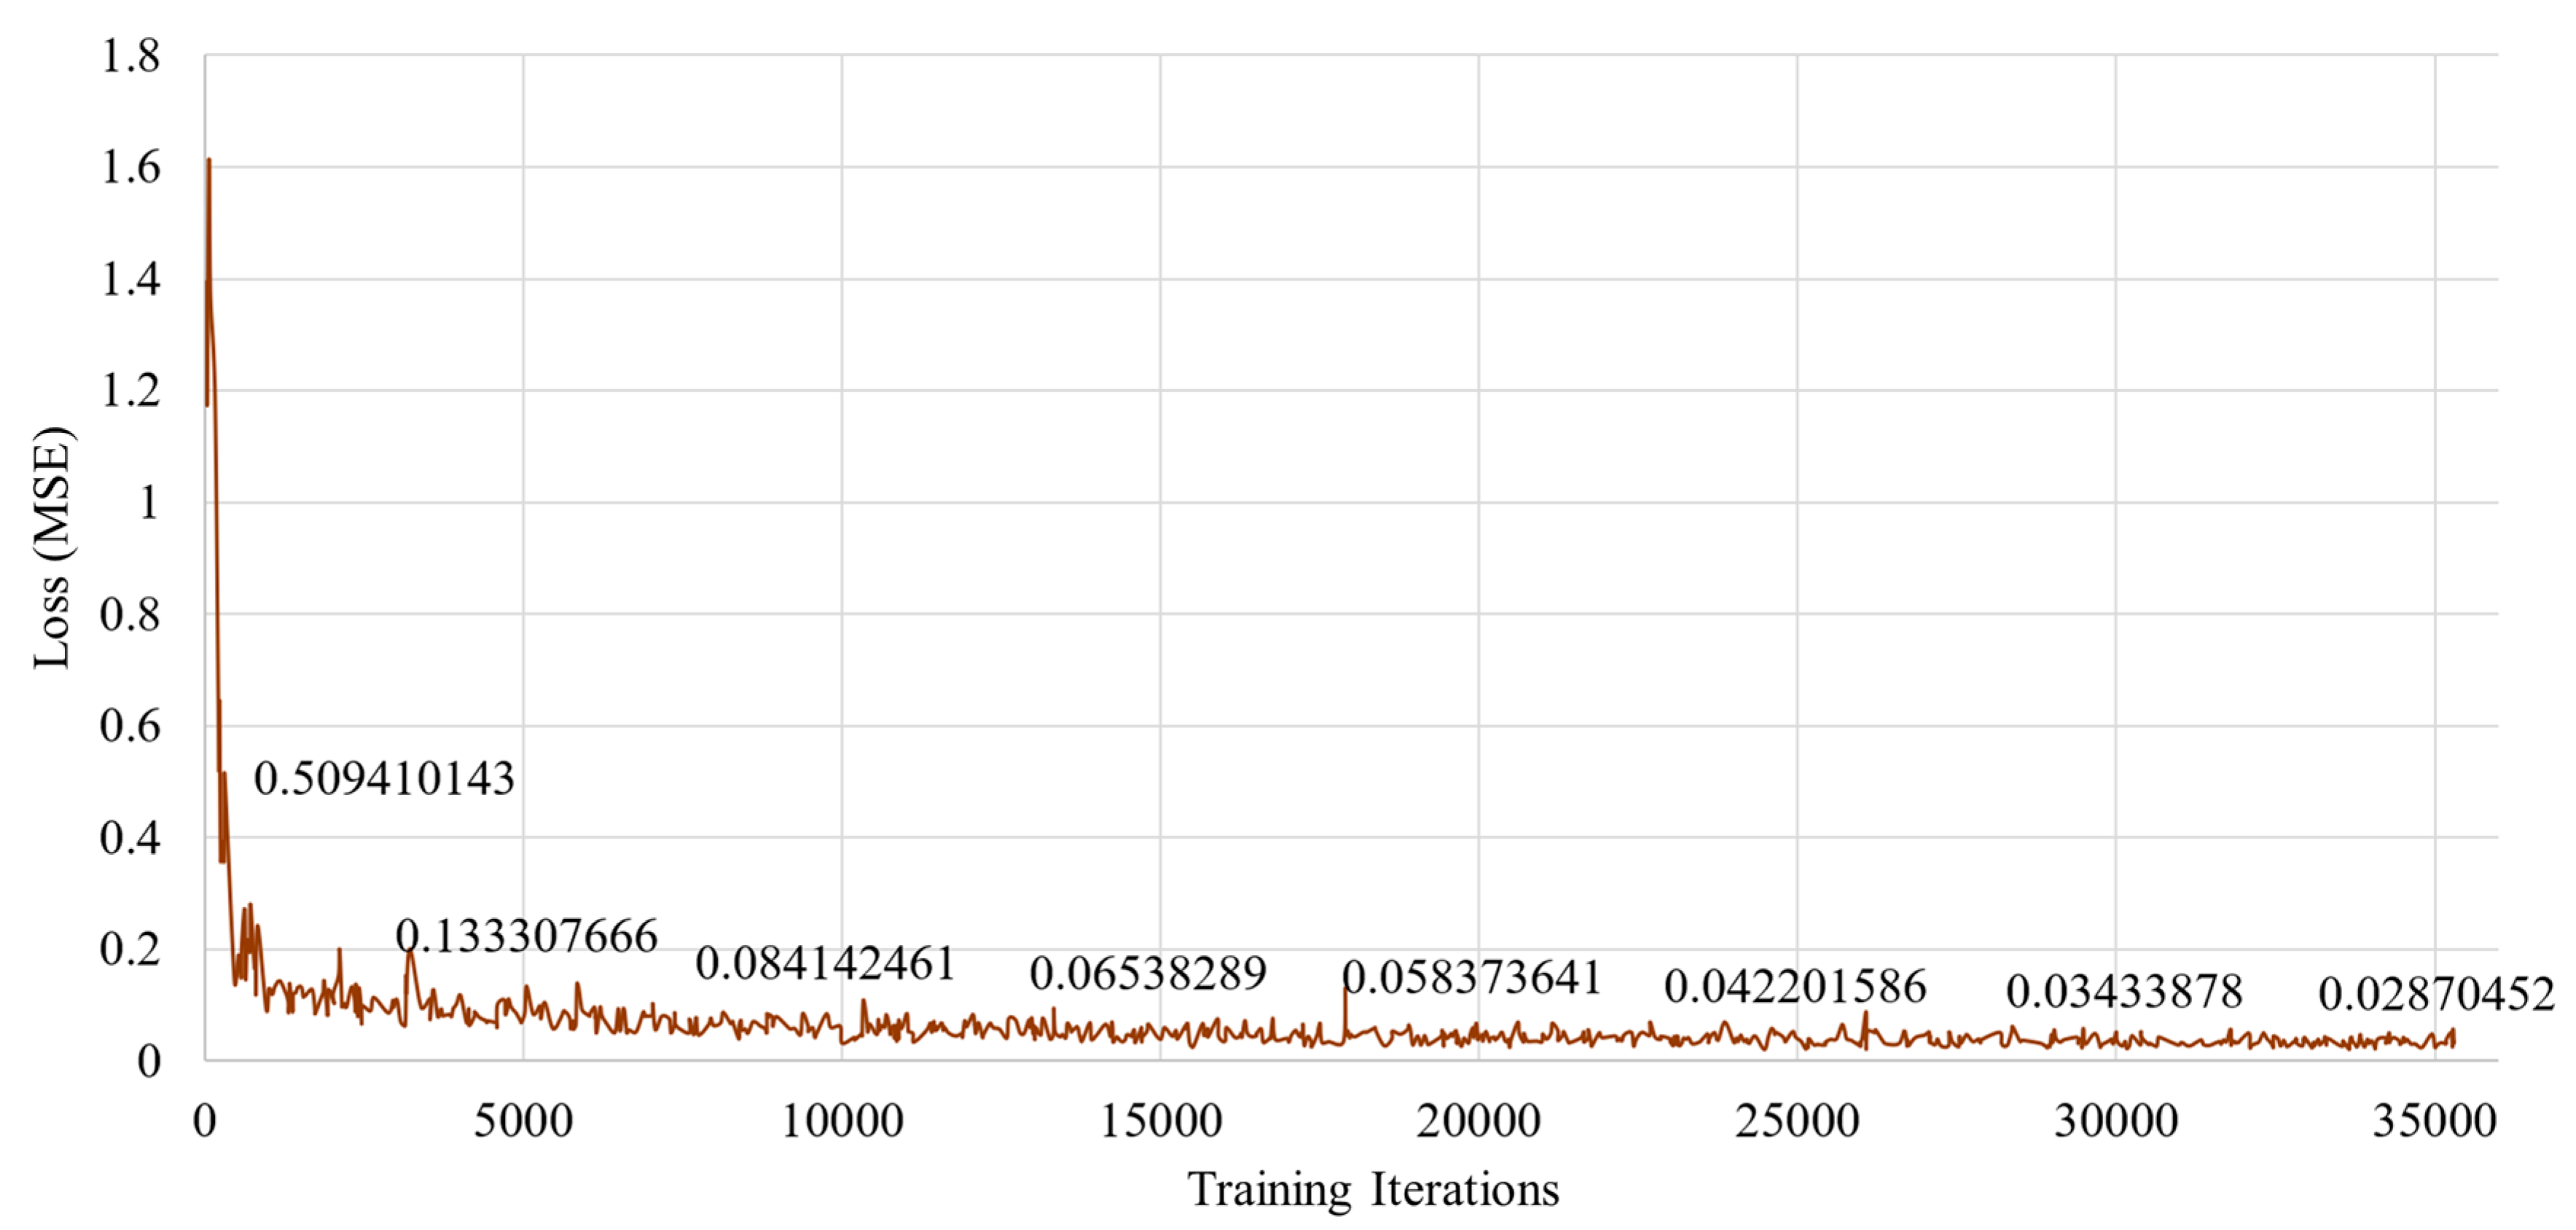
Figure 10.
Training loss in the proposed method for predicting interaction forces from images only.
Figure 10.
Training loss in the proposed method for predicting interaction forces from images only.
Figure 11.
Overall performances of the 2D CNN-based ResNet with 18 layers, the CNN + LSTM, the traditional 3D CNN-based methods (i.e., 18 layer-based VGG style method and 19 layer-based ResNet style method), and the proposed method.
Figure 11.
Overall performances of the 2D CNN-based ResNet with 18 layers, the CNN + LSTM, the traditional 3D CNN-based methods (i.e., 18 layer-based VGG style method and 19 layer-based ResNet style method), and the proposed method.
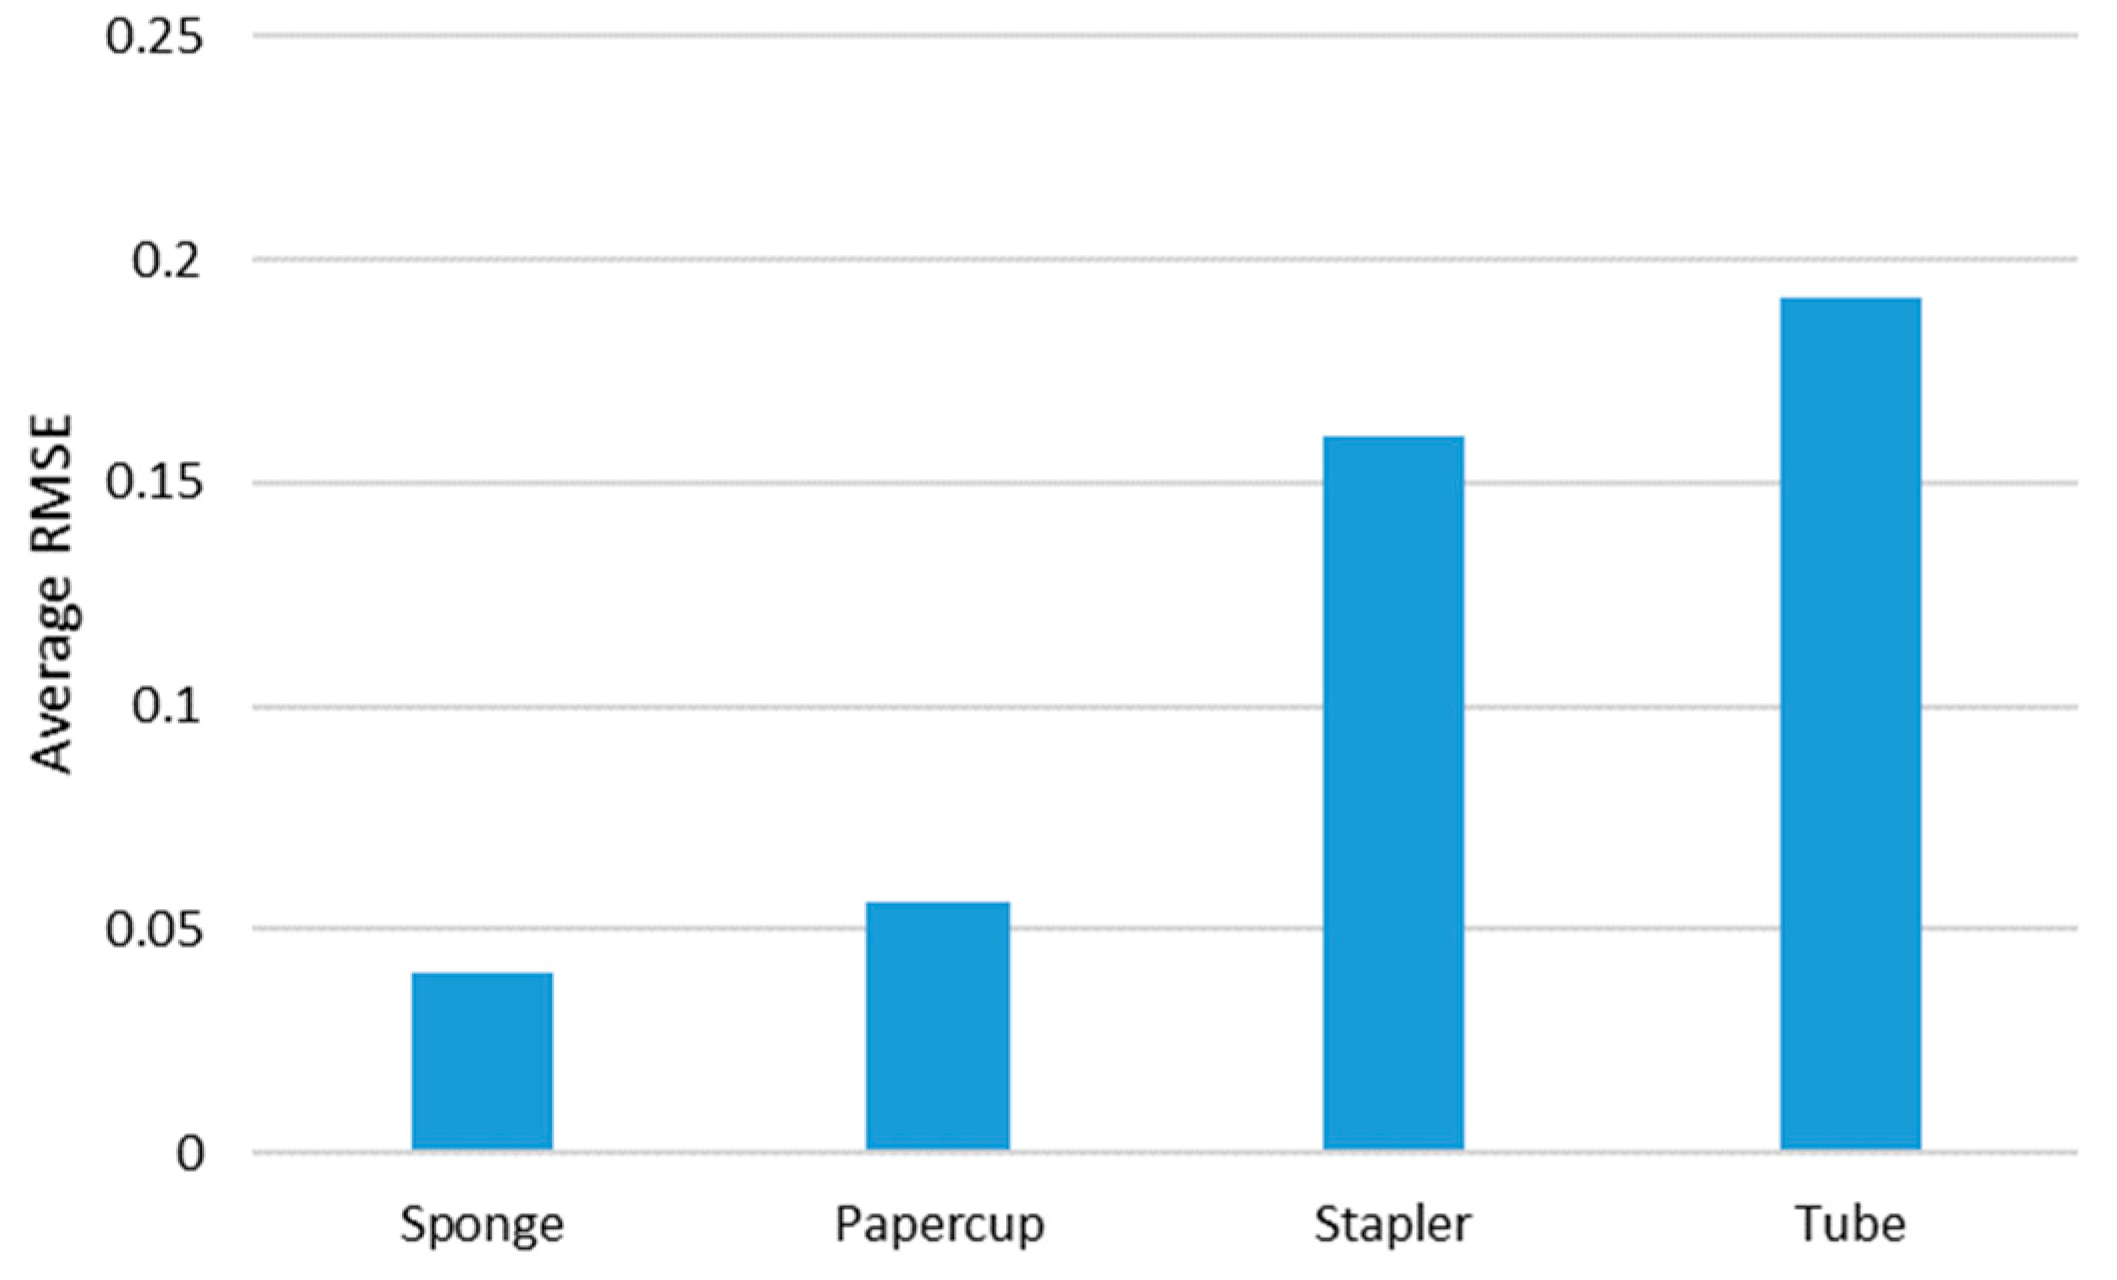
Figure 12.
Average RMSE of the proposed method with each tested object.
Figure 12.
Average RMSE of the proposed method with each tested object.
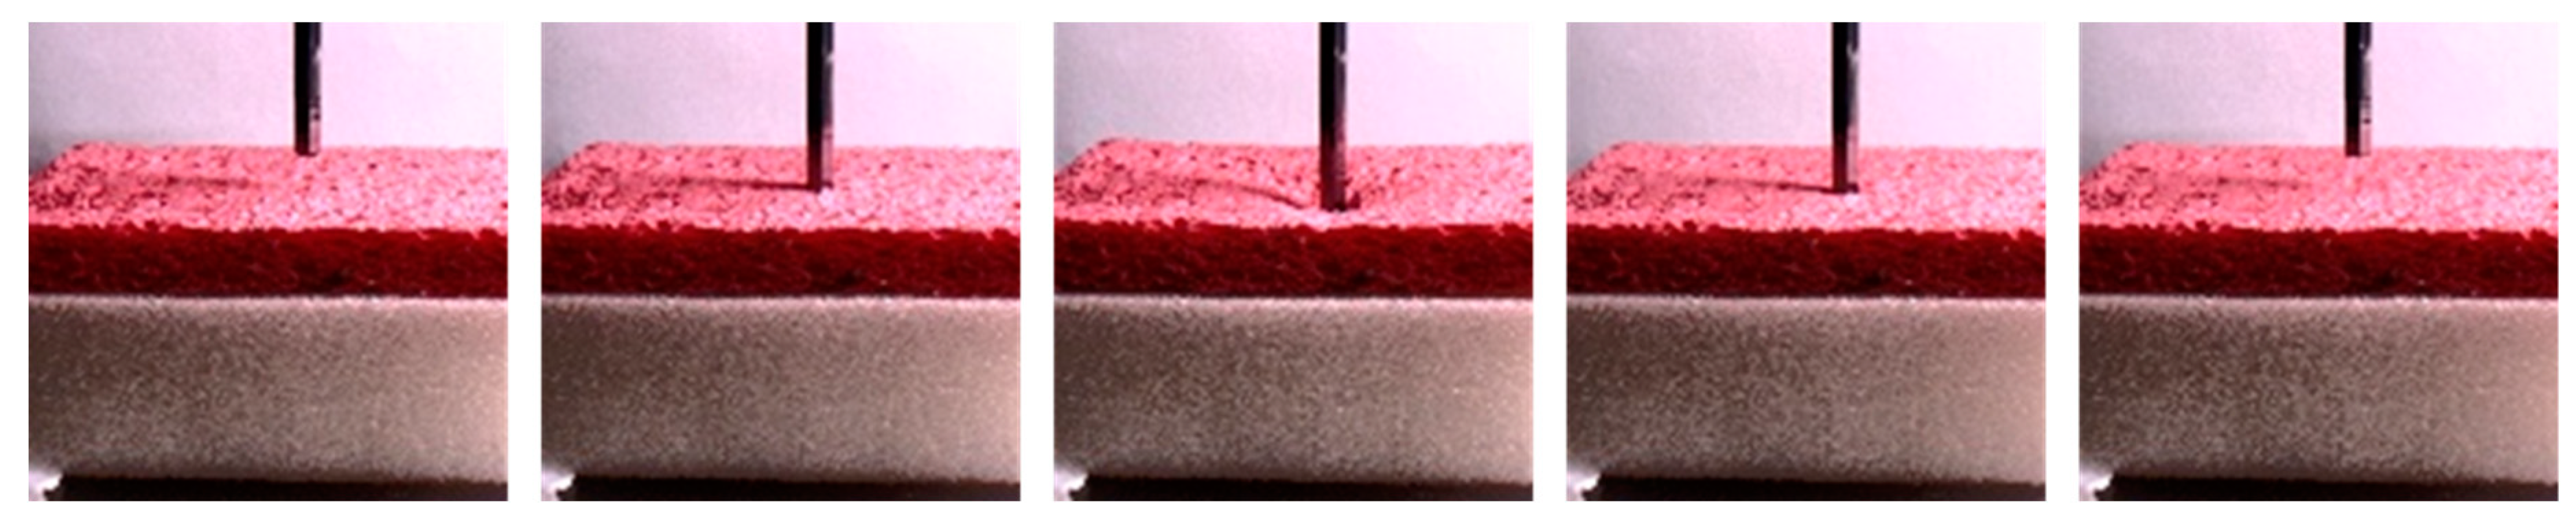
Figure 13.
Sample images of sponge.
Figure 13.
Sample images of sponge.
Figure 14.
Inferred interaction forces of the sponge with the GT. The blue and red dotted lines represent the results of the proposed method and the GT measured by the load cell, respectively. Maximum external forces are randomly generated.
Figure 14.
Inferred interaction forces of the sponge with the GT. The blue and red dotted lines represent the results of the proposed method and the GT measured by the load cell, respectively. Maximum external forces are randomly generated.
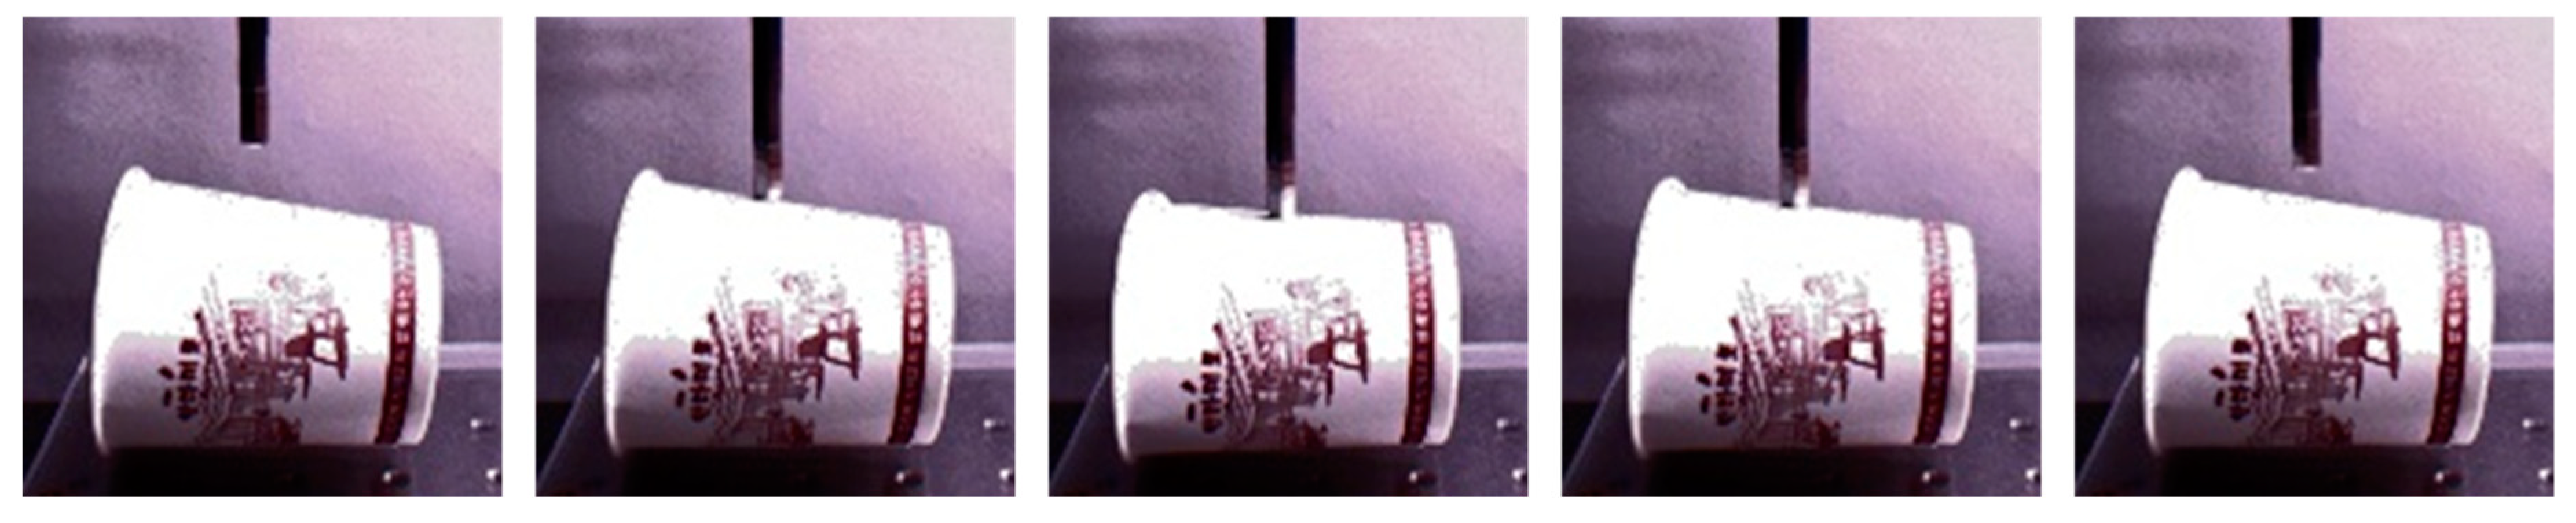
Figure 15.
Sample images of the paper cup.
Figure 15.
Sample images of the paper cup.
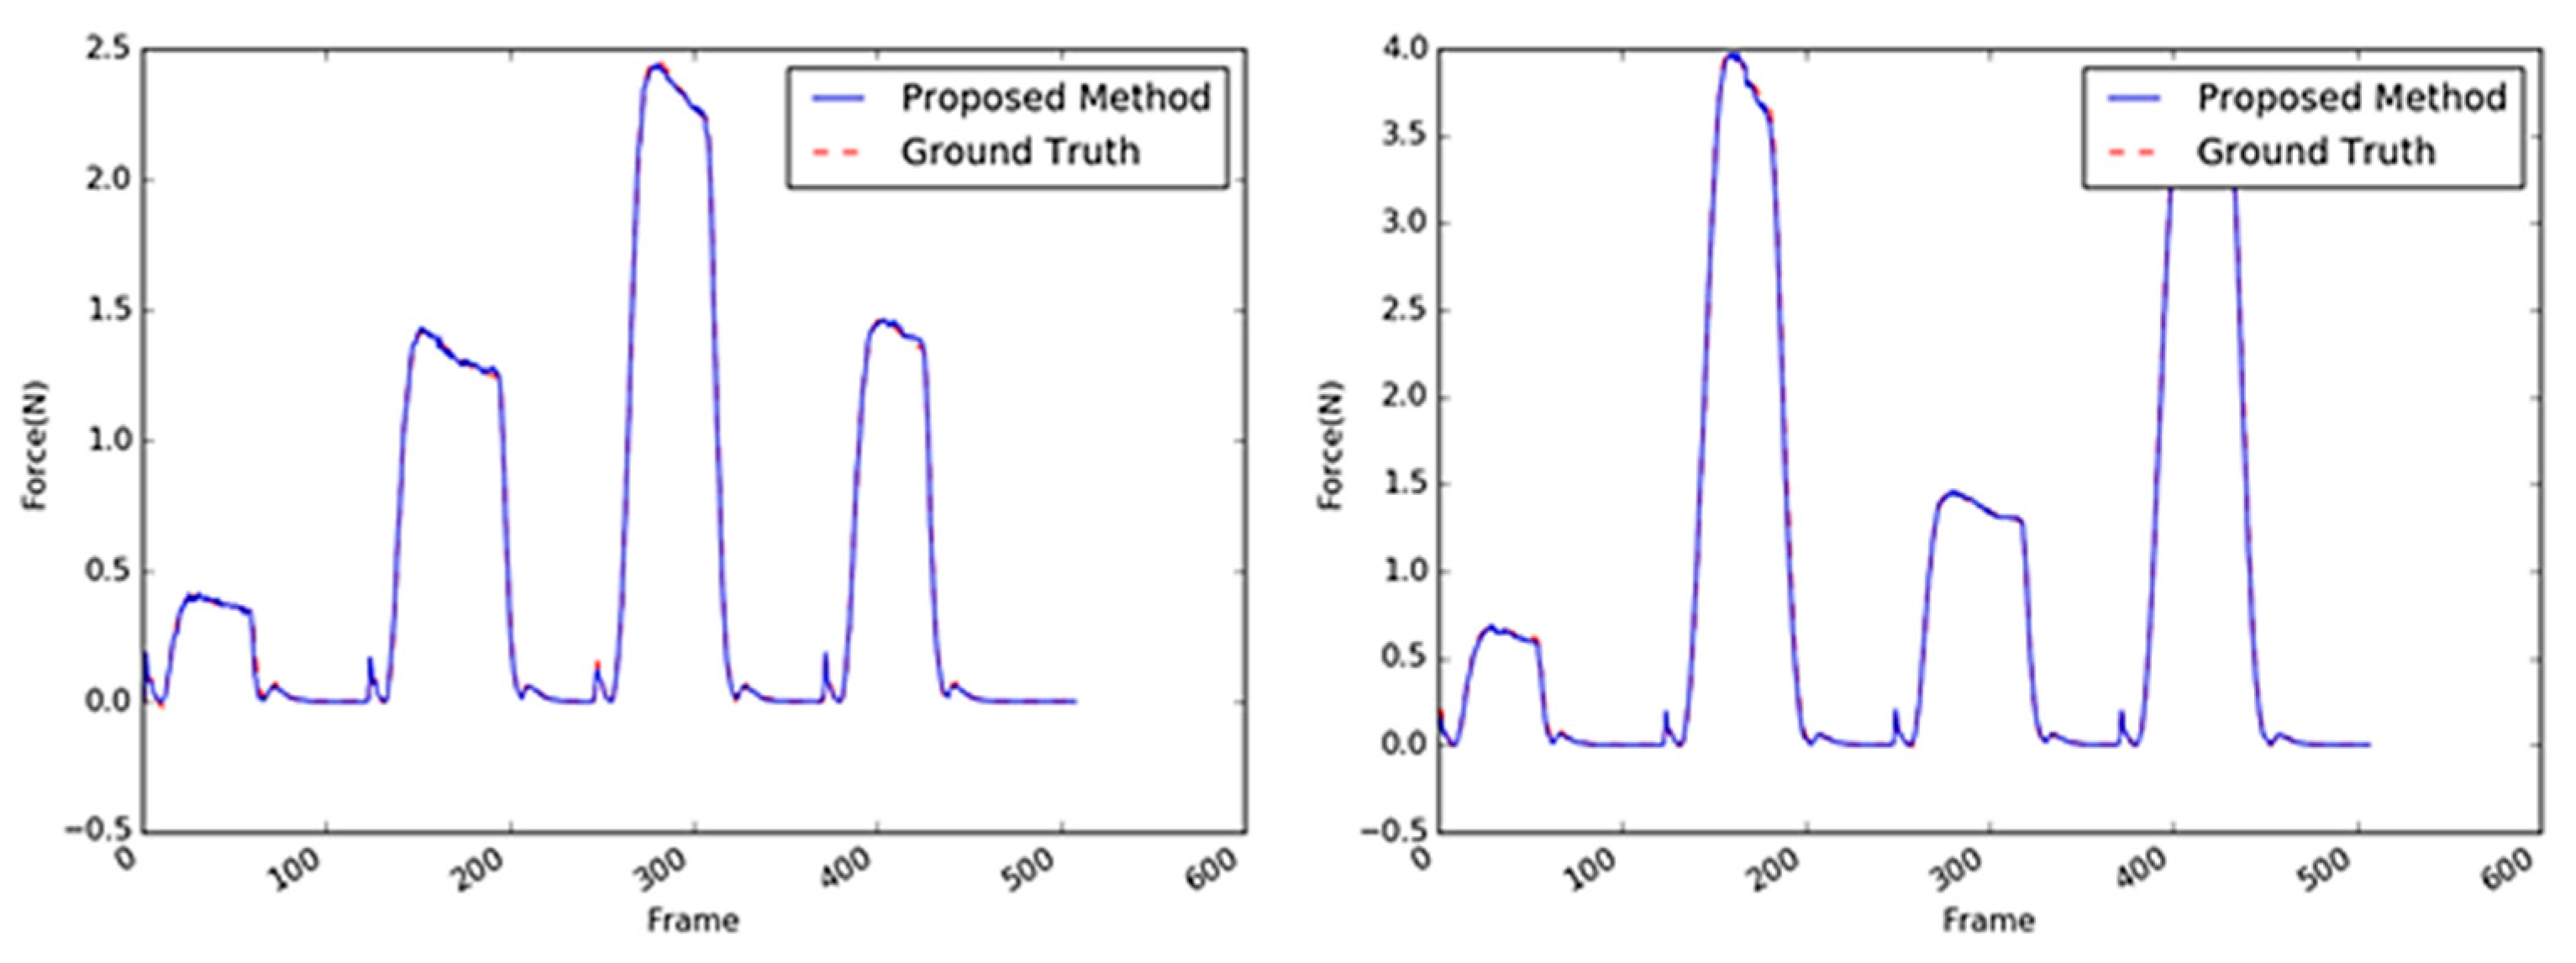
Figure 16.
Inferred interaction forces for the paper cup with the GT. The blue and red dotted lines represent the results of the proposed method and the GT measured by the load cell, respectively. Note that the durations of the maximum force applied were randomly generated.
Figure 16.
Inferred interaction forces for the paper cup with the GT. The blue and red dotted lines represent the results of the proposed method and the GT measured by the load cell, respectively. Note that the durations of the maximum force applied were randomly generated.
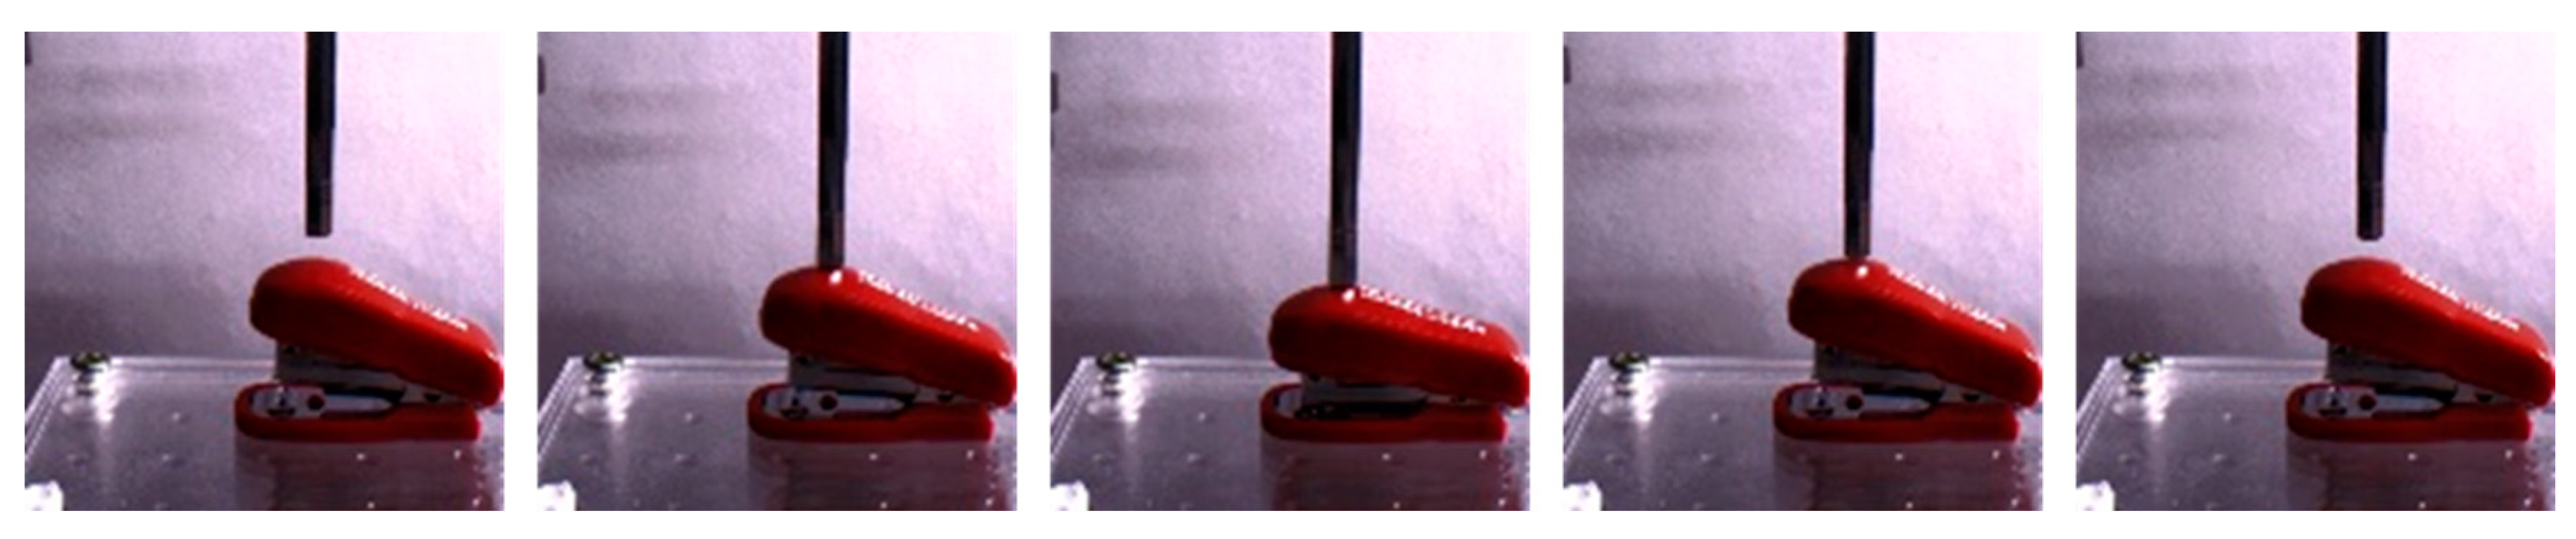
Figure 17.
Sample images of the stapler.
Figure 17.
Sample images of the stapler.
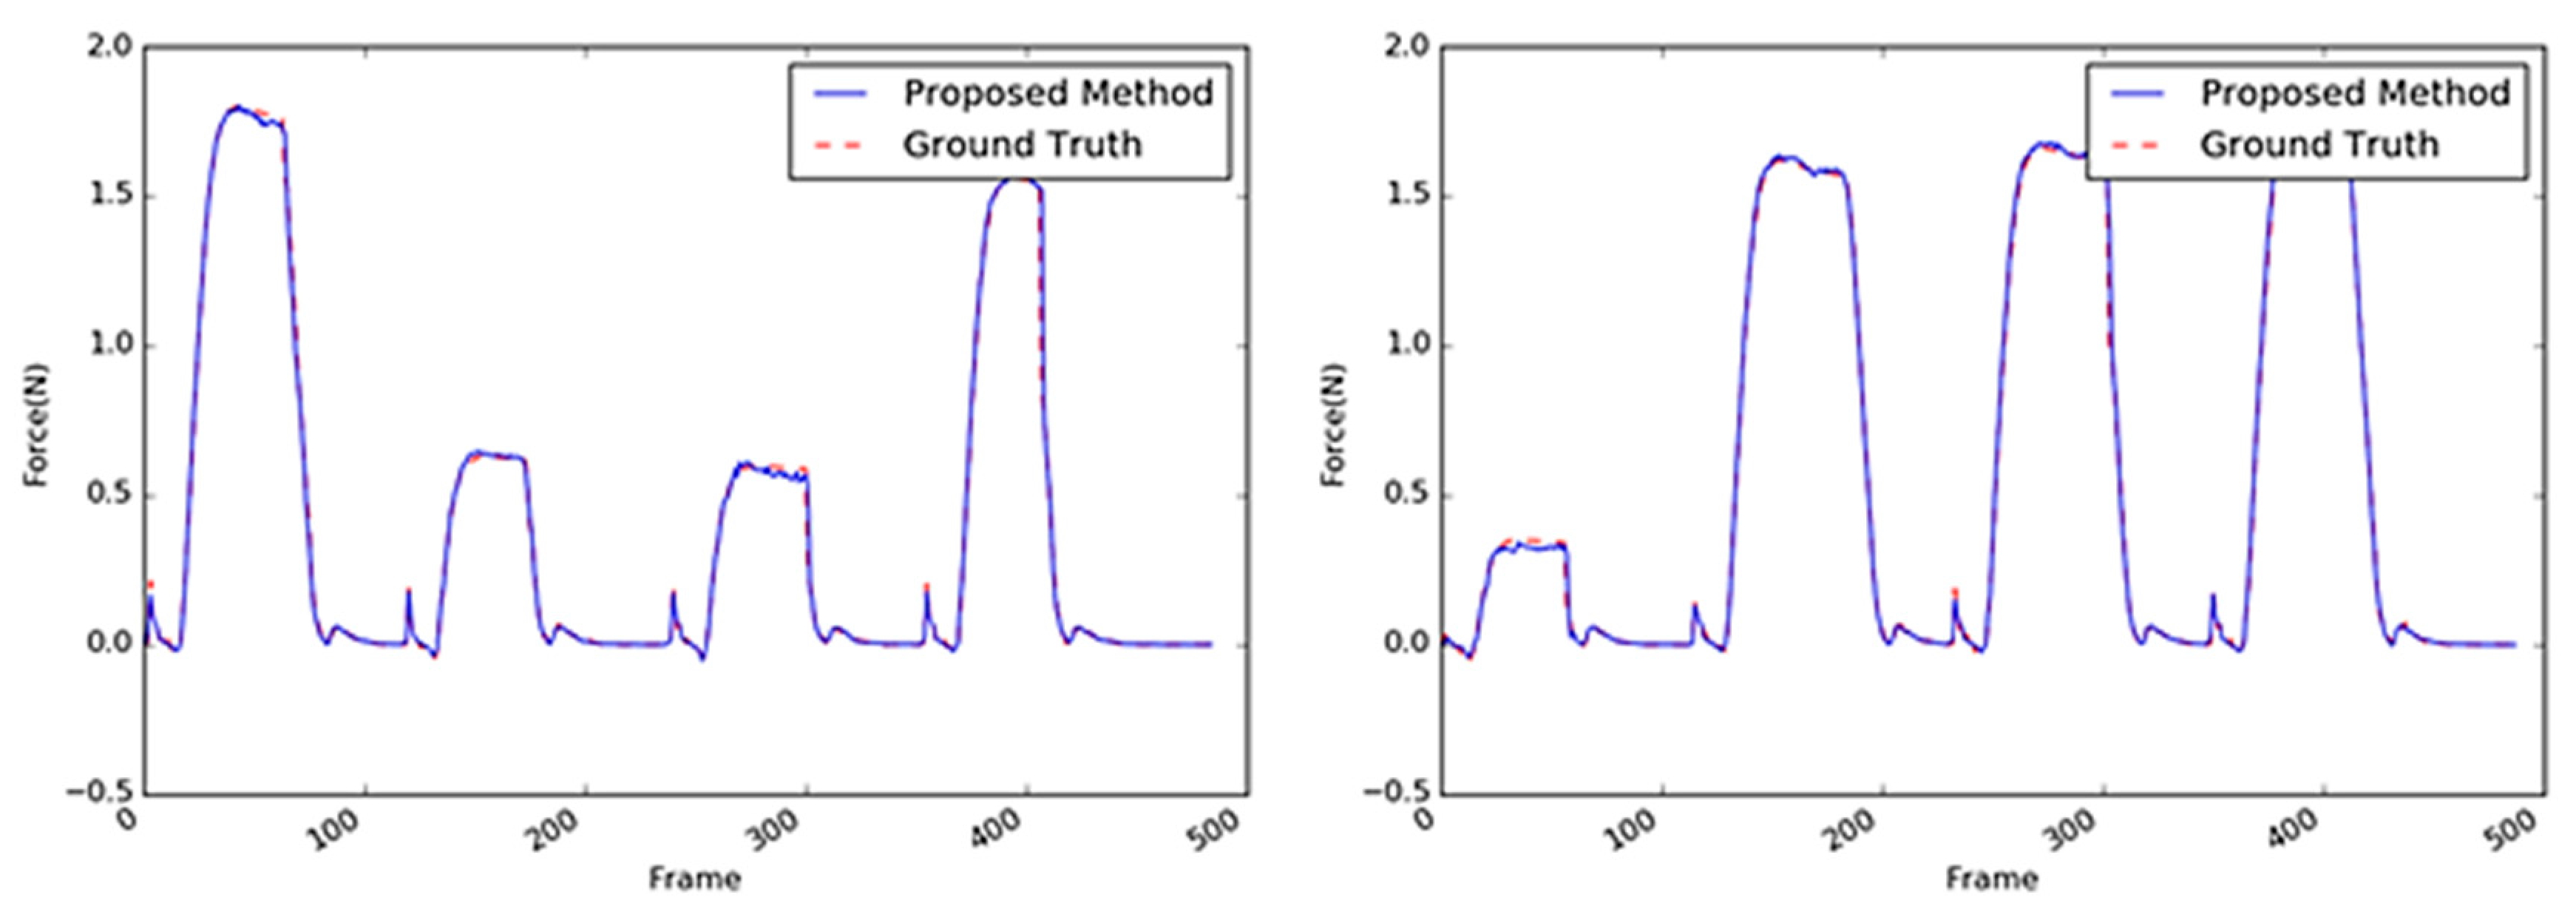
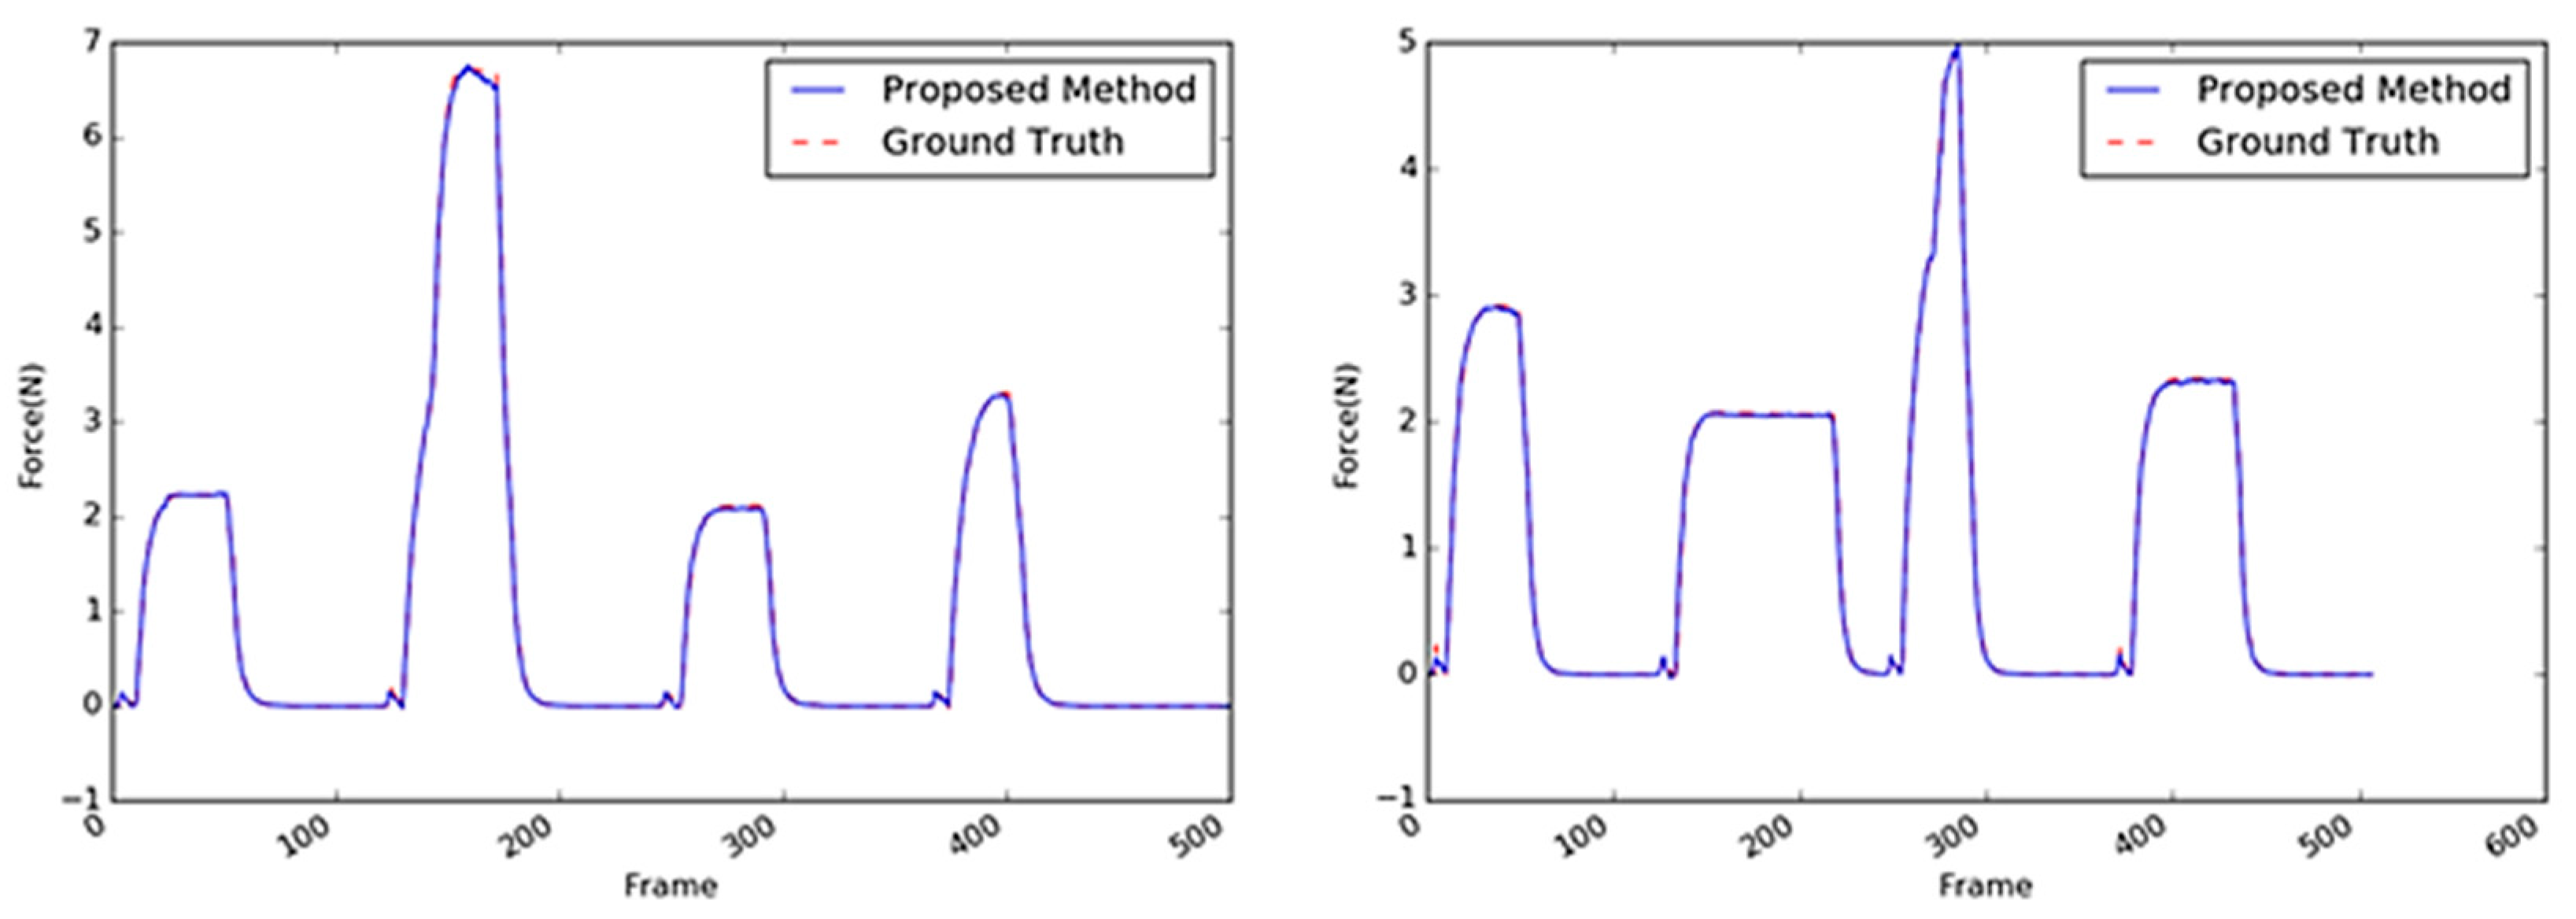
Figure 18.
Inferred interaction forces of the stapler with the GT. The blue and red dotted lines represent the results of the proposed method and the GT measured by the load cell, respectively.
Figure 18.
Inferred interaction forces of the stapler with the GT. The blue and red dotted lines represent the results of the proposed method and the GT measured by the load cell, respectively.
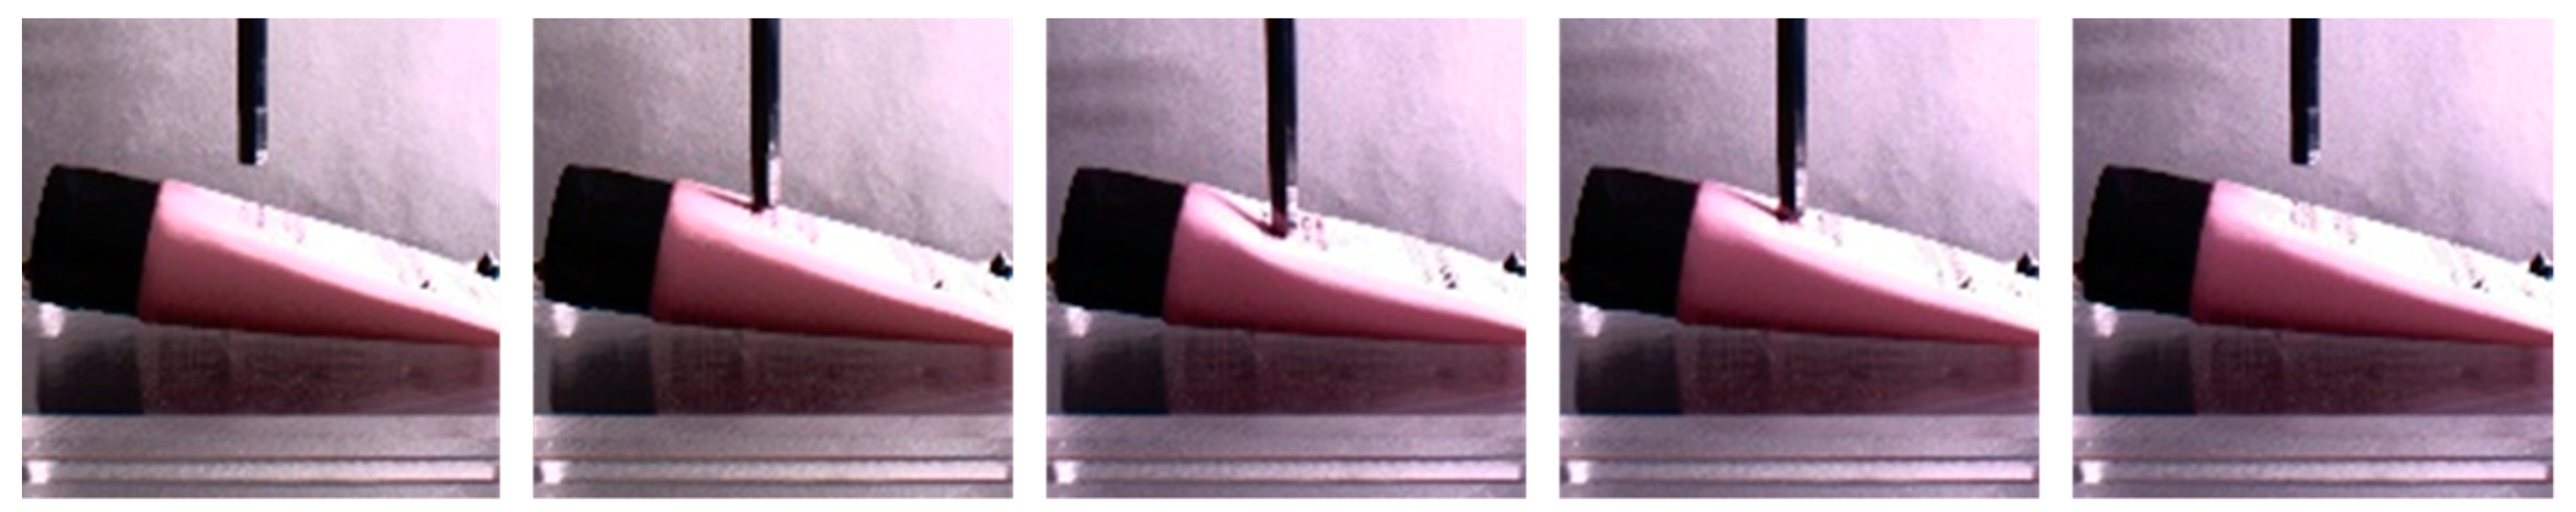
Figure 19.
Sample images of the tube.
Figure 19.
Sample images of the tube.
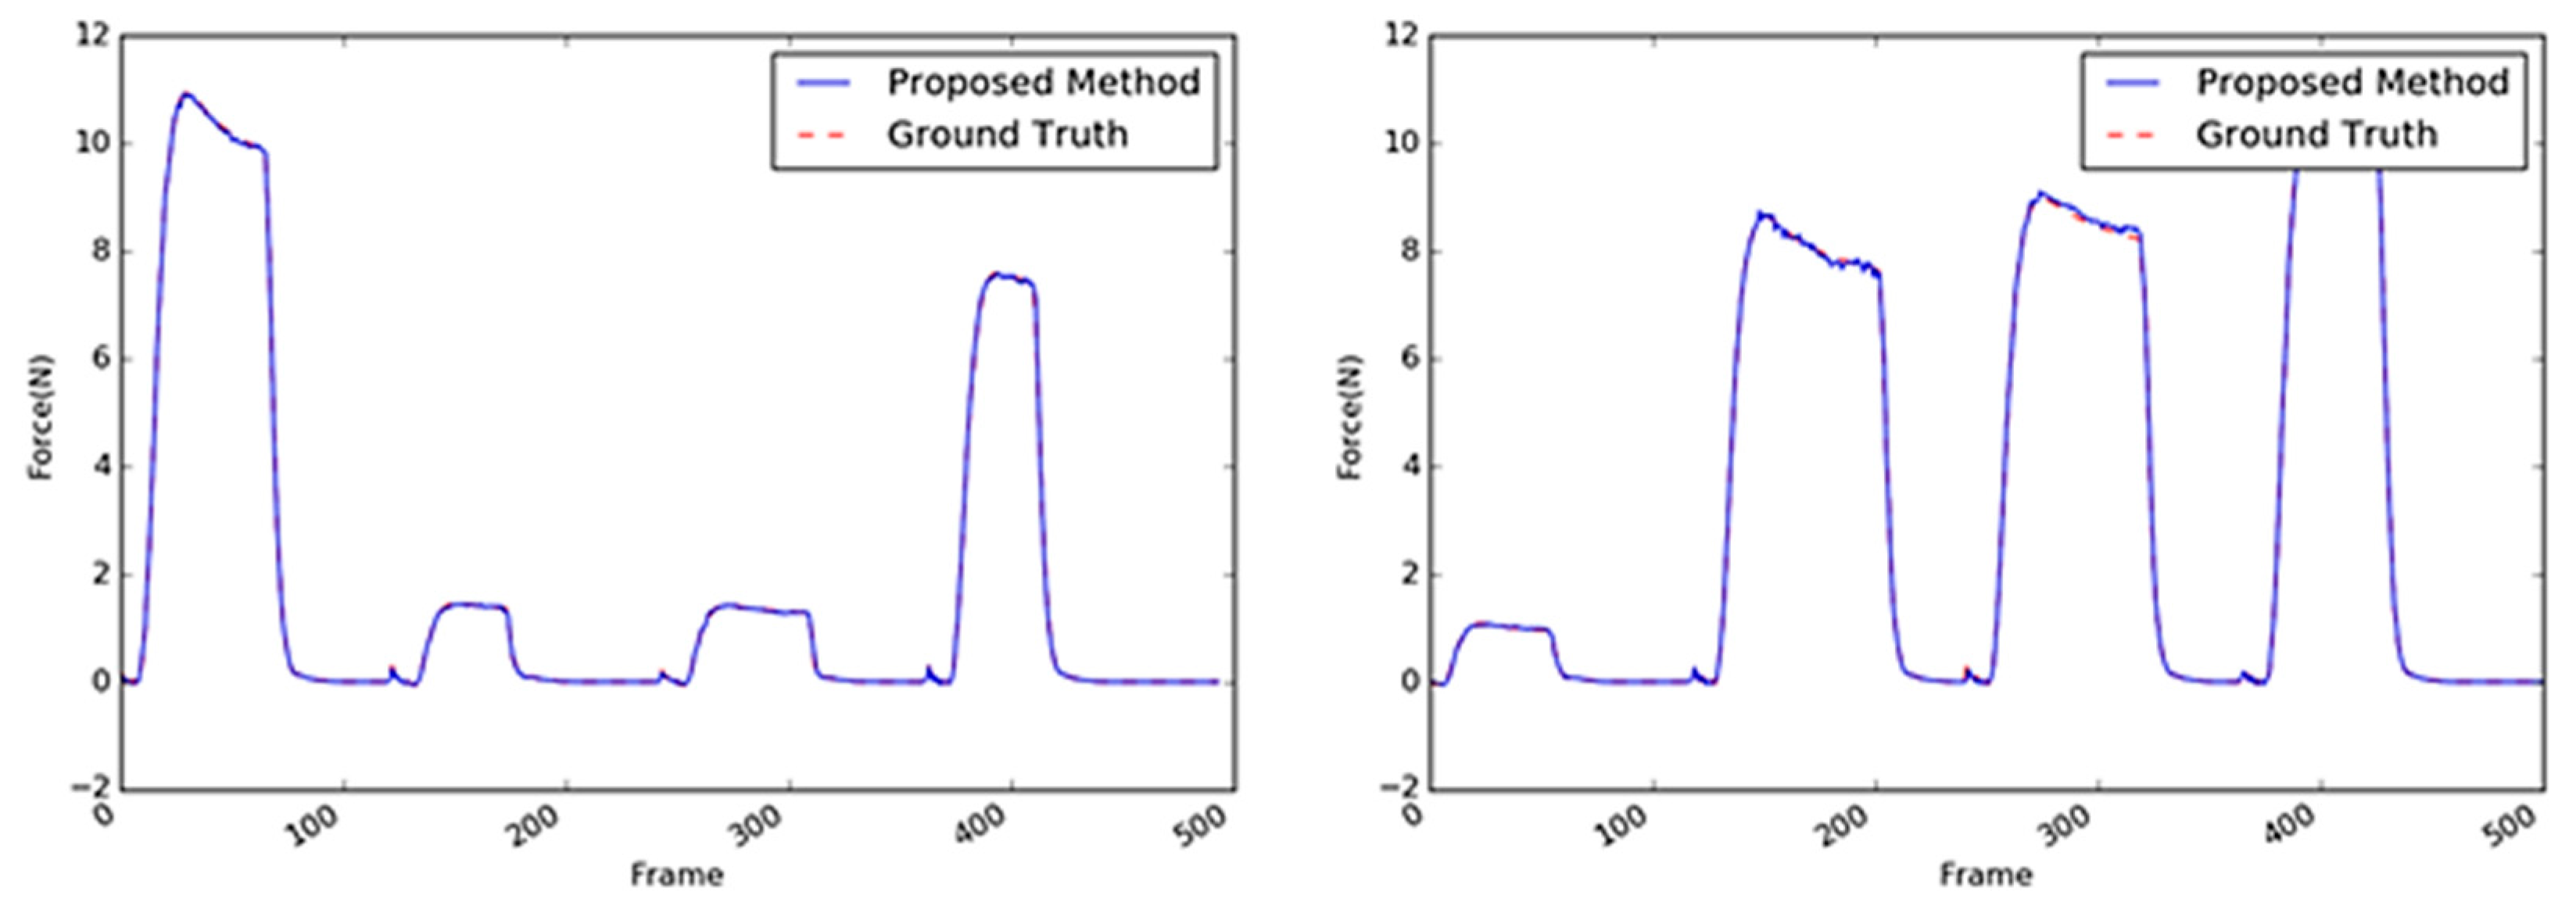
Figure 20.
Inferred interaction forces of the tube with the GT. The blue and red dotted lines represent the results of the proposed method and the GT measured by the load cell, respectively.
Figure 20.
Inferred interaction forces of the tube with the GT. The blue and red dotted lines represent the results of the proposed method and the GT measured by the load cell, respectively.
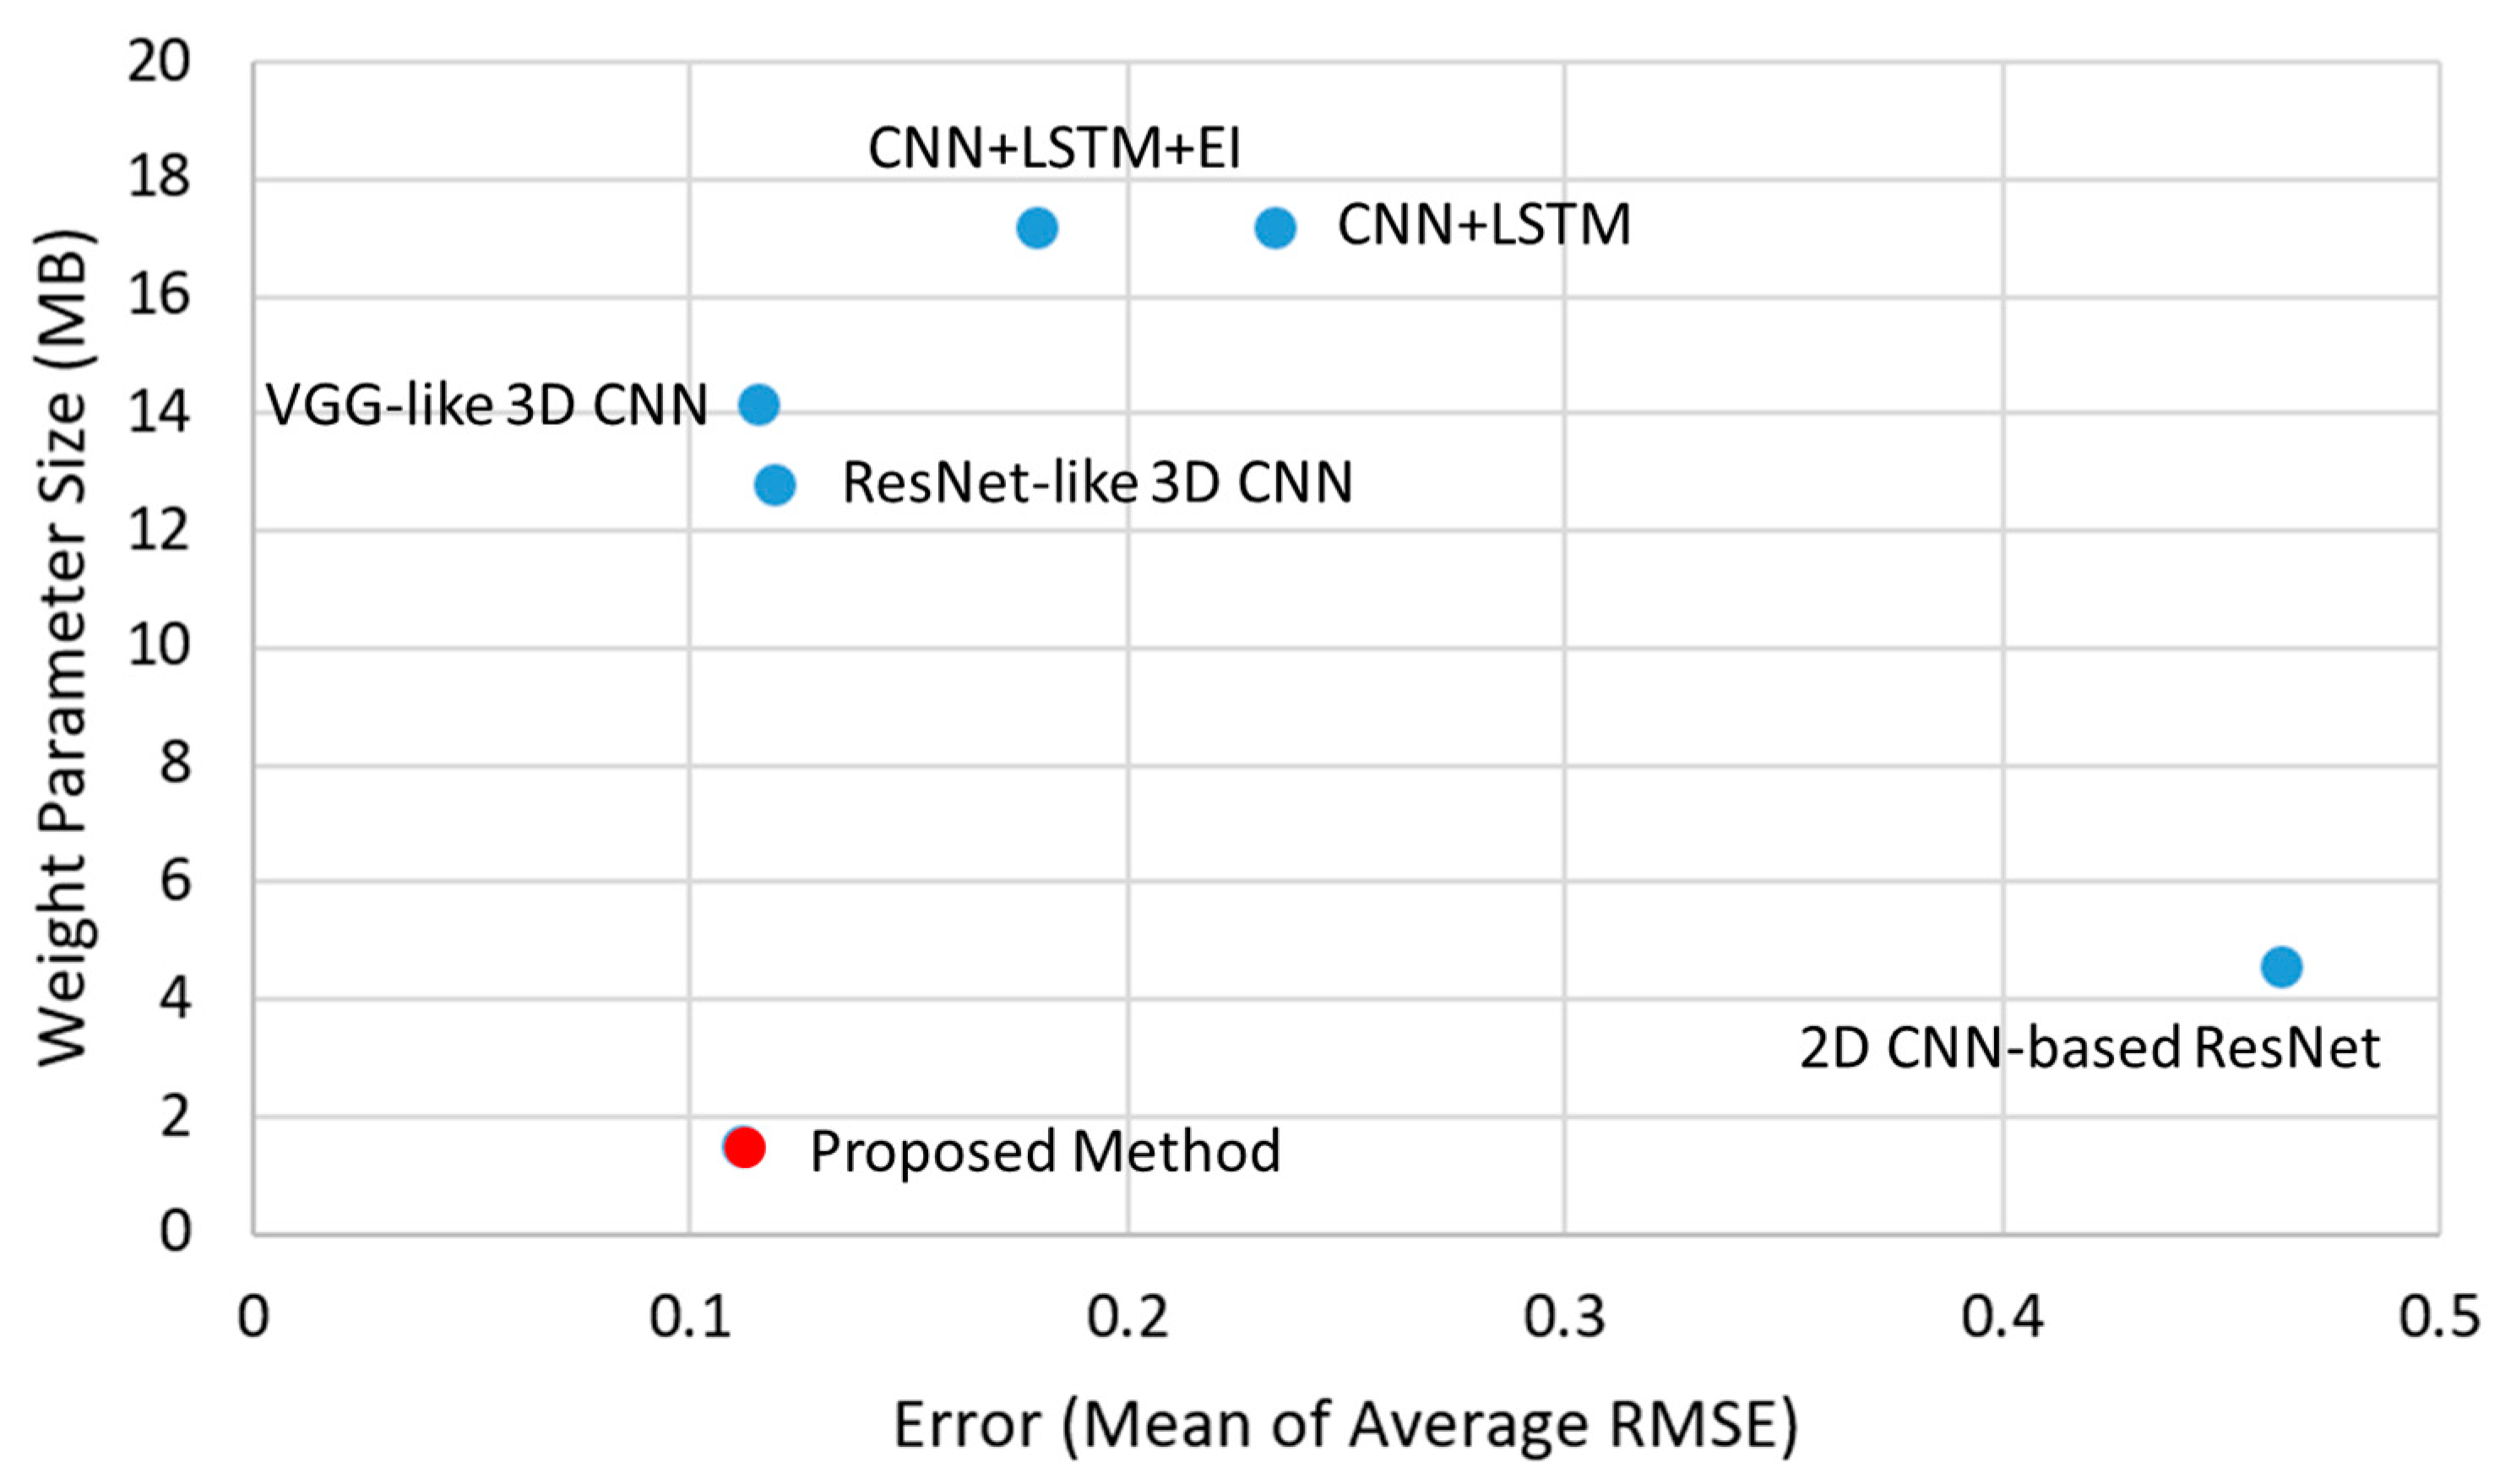
Figure 21.
The proposed method achieved the best accuracy in inferring the interaction force only from the video; its weight parameter size was also the smallest among the previous works.
Figure 21.
The proposed method achieved the best accuracy in inferring the interaction force only from the video; its weight parameter size was also the smallest among the previous works.
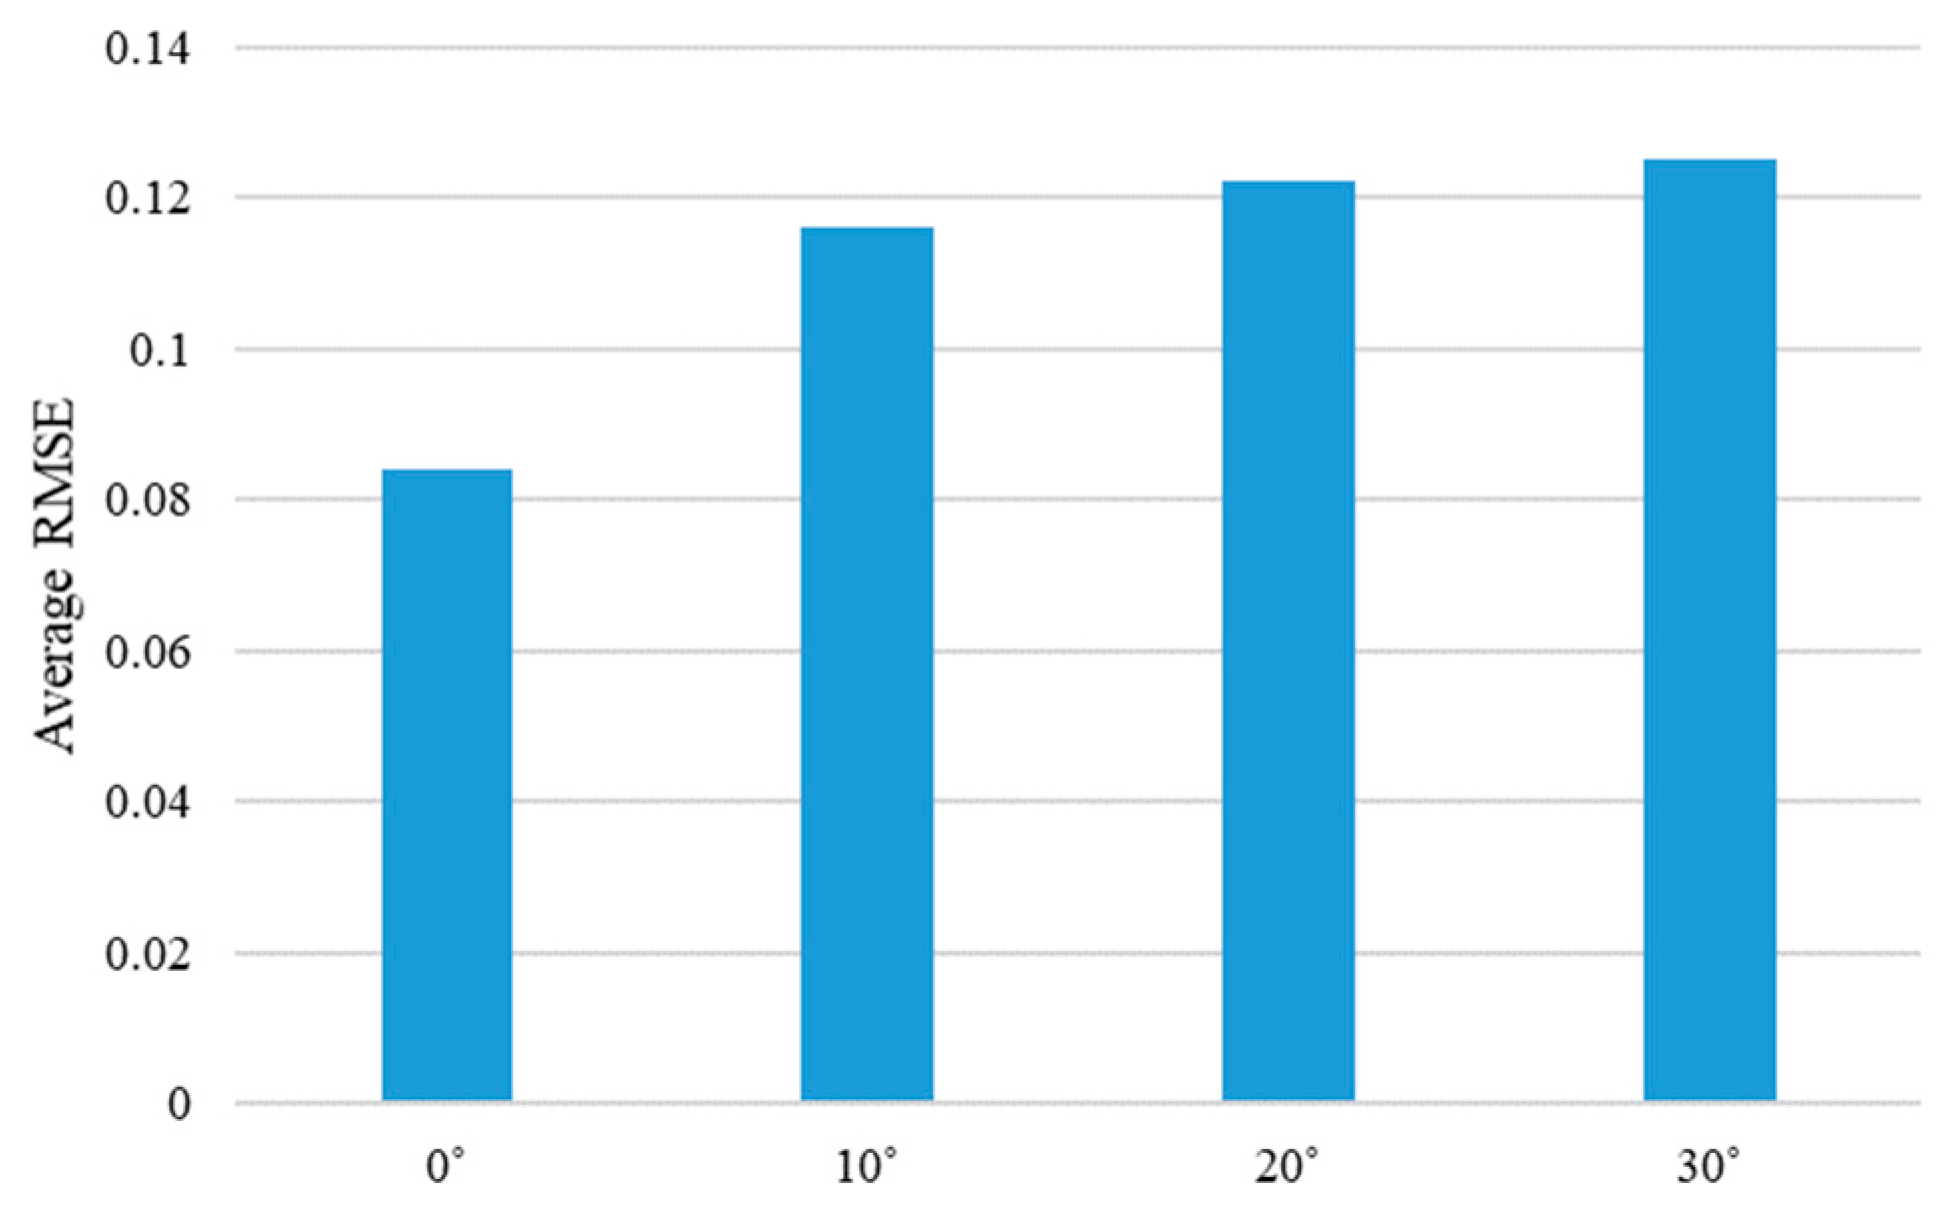
Figure 22.
Average RMSE of the proposed method are shown according to the different moving directions of the steel rod. Average RMSE is calculated by averaging the RMSE values for each angle of the four objects.
Figure 22.
Average RMSE of the proposed method are shown according to the different moving directions of the steel rod. Average RMSE is calculated by averaging the RMSE values for each angle of the four objects.
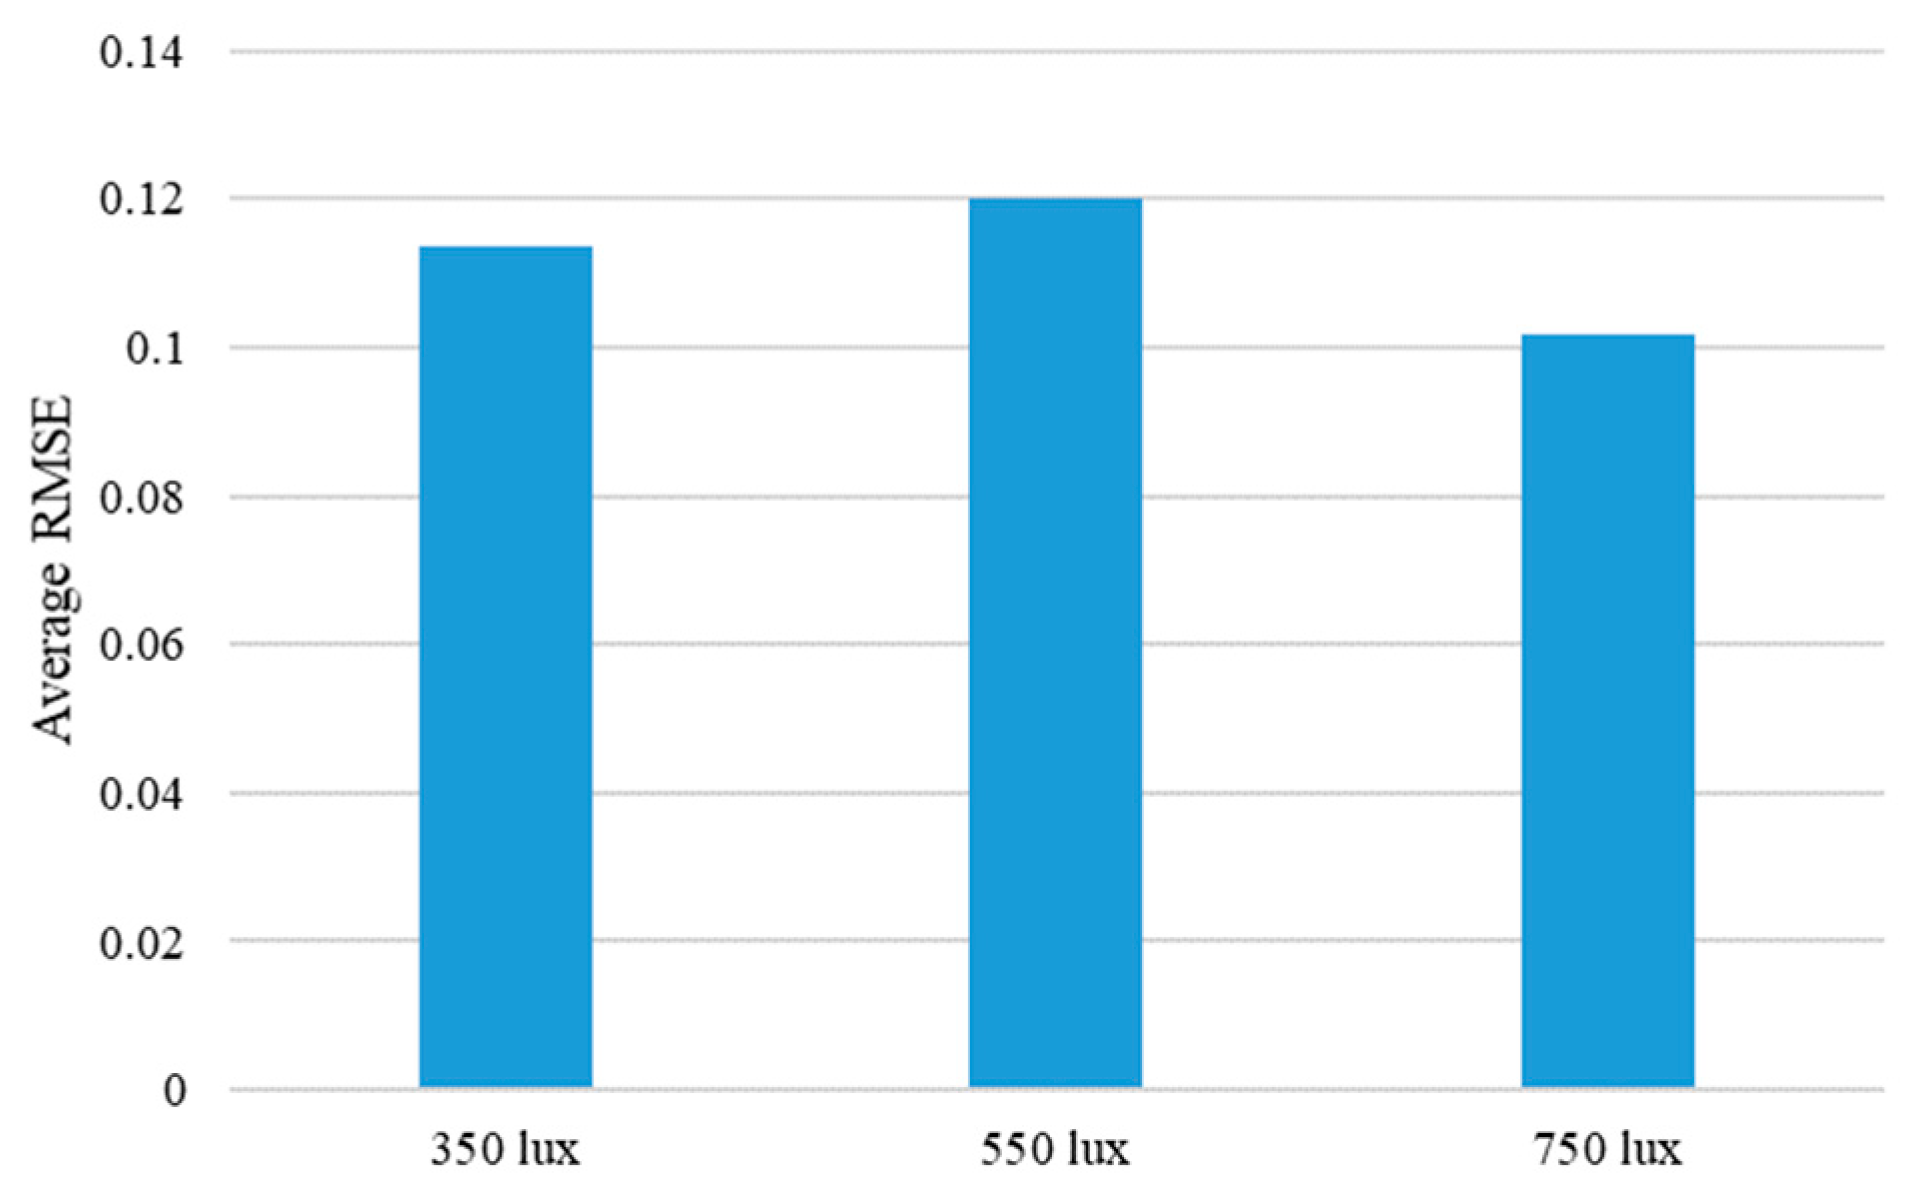
Figure 23.
Average RMSE of the proposed method are shown according to the different illumination conditions. Average RMSE is calculated by averaging the RMSE values for each illumination condition of the four objects.
Figure 23.
Average RMSE of the proposed method are shown according to the different illumination conditions. Average RMSE is calculated by averaging the RMSE values for each illumination condition of the four objects.
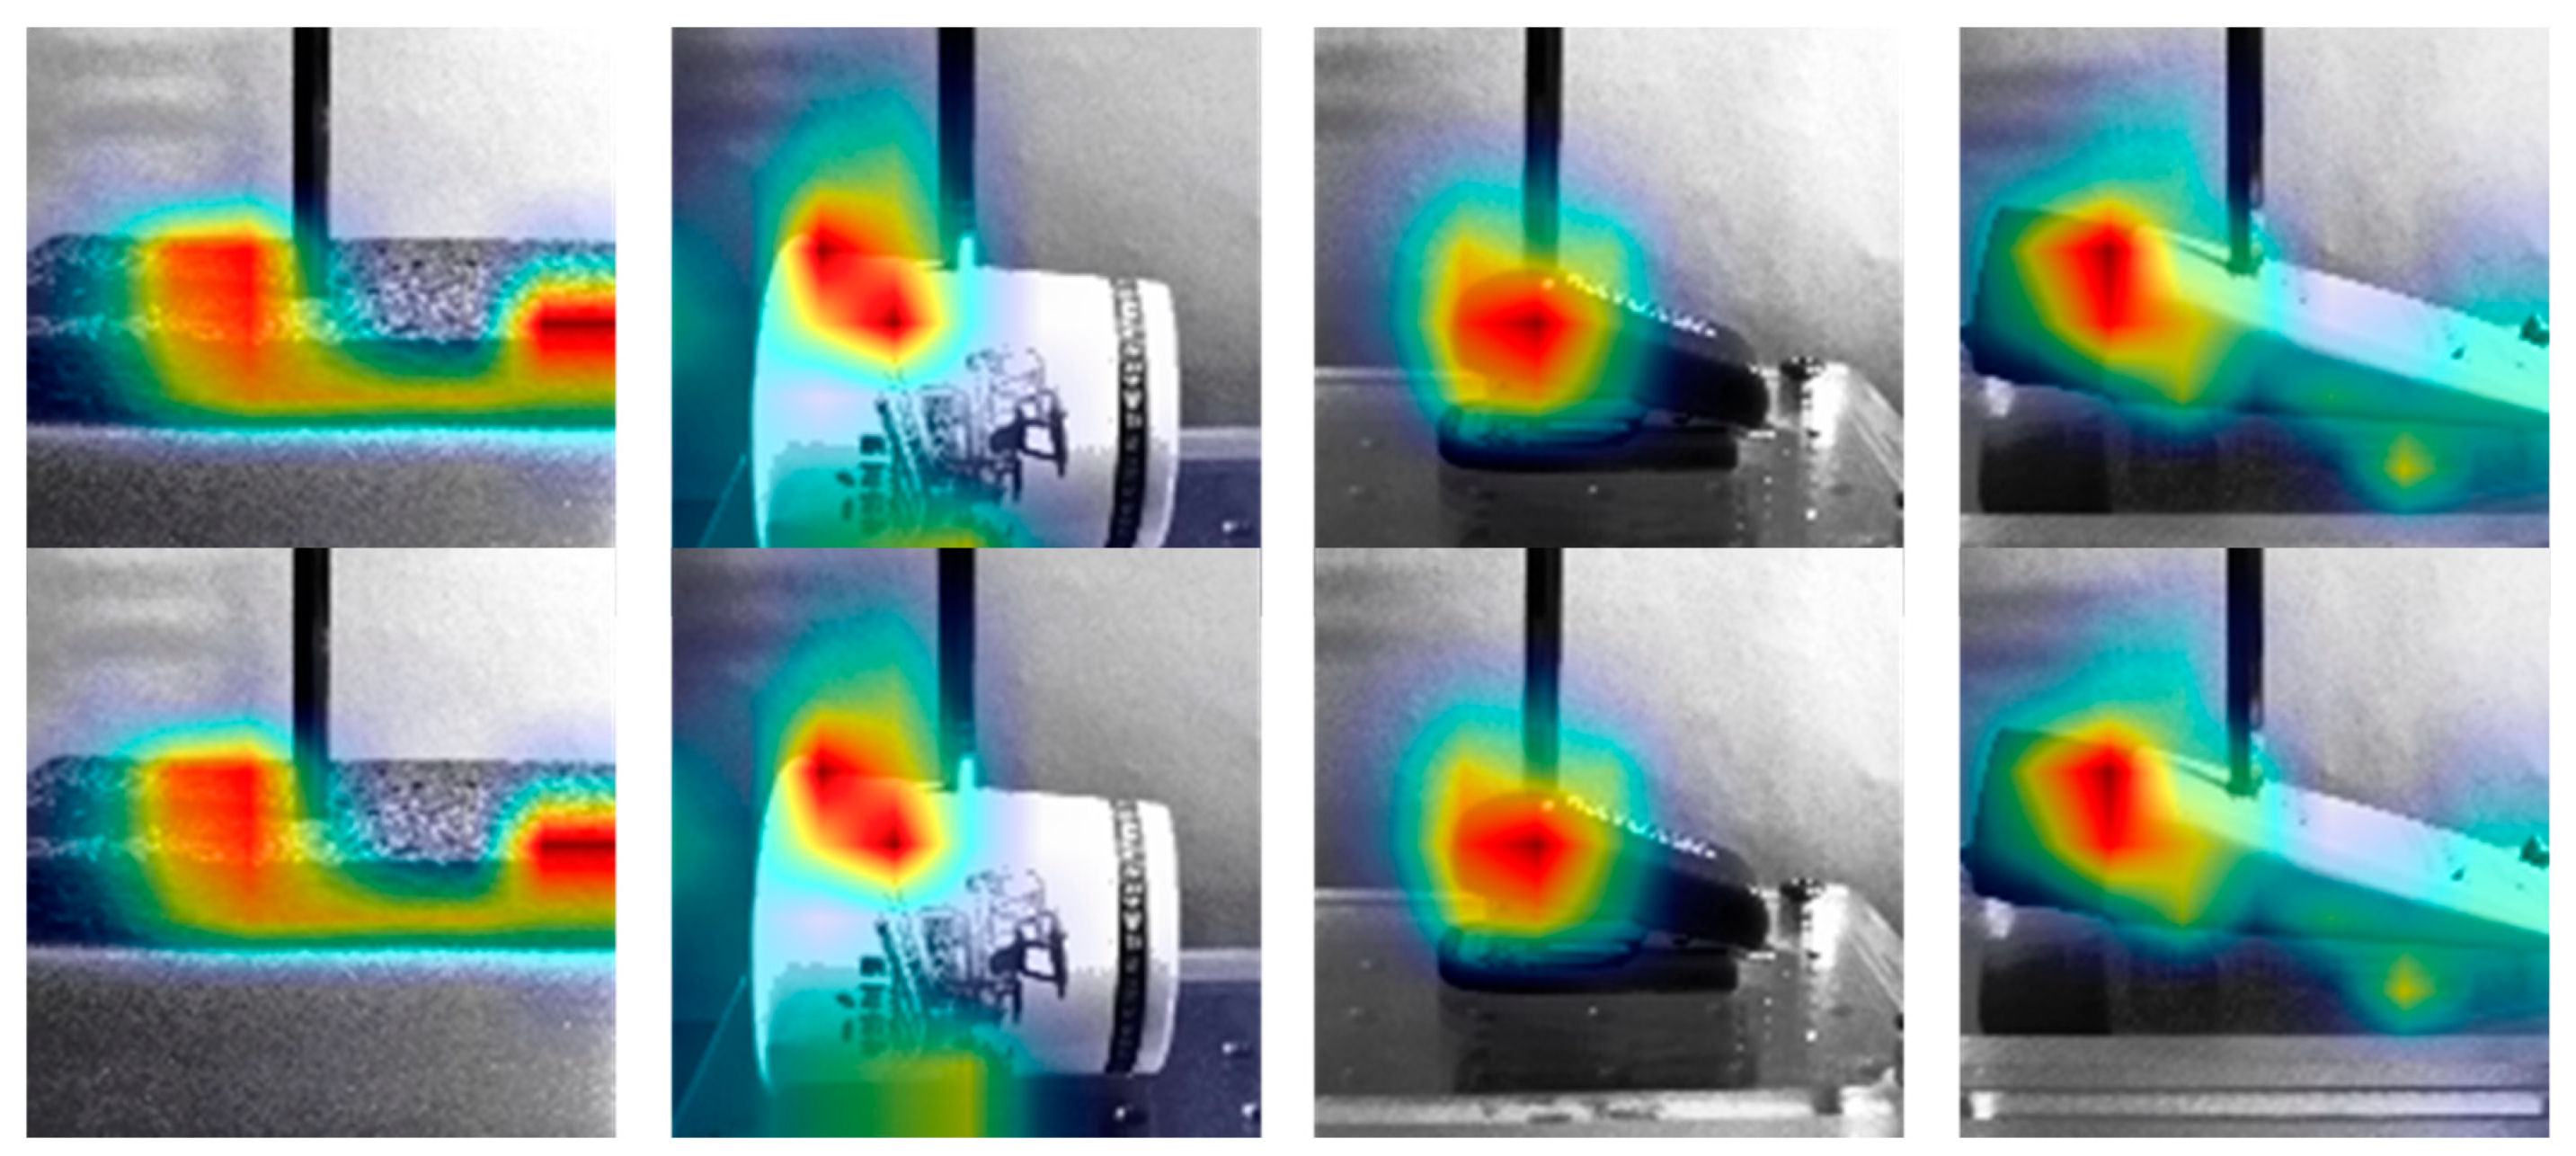
Figure 24.
The attention maps of the proposed method are shown according to the different materials.
Figure 24.
The attention maps of the proposed method are shown according to the different materials.
Table 1.
Comparison of weight parameters between 3D CNN and proposed method.
Table 1.
Comparison of weight parameters between 3D CNN and proposed method.
| | 3D CNN | Proposed Method |
|---|
| No. of Parameters | | |
Table 2.
Network architecture details of the proposed method.
Table 2.
Network architecture details of the proposed method.
| Layer (Type) | Expand Channels | Output Channels | Spatial Stride | Kernel Depth | Depth Stride |
|---|
| <20, 128, 128, 3> | Conv2D 3 × 3 | - | 32 | 1 | 1 | 1 |
| <20, 64, 64, 32> | Bottleneck 3D 3 × 3 (a) | 32 | 16 | 1 | 1 | 1 |
| <20, 64, 64, 16> | Bottleneck 3D 3 × 3 (a) | 64 | 24 | 1 | 1 | 1 |
| <20, 32, 32, 24> | Bottleneck 3D 3 × 3 (a) | 96 | 32 | 1 | 1 | 1 |
| <20, 16, 16, 32> | Bottleneck 3D 3 × 3 (b) | 128 | 64 | 2 | 3 | 2 |
| <10, 8, 8, 64> | Bottleneck 3D 3 × 3 (b) | 192 | 92 | 2 | 3 | 2 |
| <5, 8, 8, 92> | Bottleneck 3D 3 × 3 (b) | 384 | 128 | 2 | 3 | 2 |
| <3, 4, 4, 128> | Bottleneck 3D 3 × 3 (b) | 448 | 192 | 2 | 3 | 2 |
| <2, 4, 4, 192> | Conv2D 1 × 1 | - | 1280 | 2 | 2 | 2 |
| <1, 4, 4, 1280> | Avg. Pool. 4 × 4 | - | - | 1 | 1 | - |
| <1280> | FC 1 | - | 1 | - | - | - |
Table 3.
Details of training and test protocols. One set consists of four touches with approximately 520 sequential images. The number in parentheses is the total number of sequential images. The total number of images is 387,473.
Table 3.
Details of training and test protocols. One set consists of four touches with approximately 520 sequential images. The number in parentheses is the total number of sequential images. The total number of images is 387,473.
| Object | Training Set | Test Set |
|---|
| Sponge | 144 sets (77,097) | 36 sets (19,474) |
| Paper cup | 144 sets (76,966) | 36 sets (19,133) |
| Stapler | 144 sets (77,941) | 36 sets (19,533) |
| Tube | 144 sets (77,849) | 36 sets (19,480) |
Table 4.
Quantitative comparison of various methods with the sponge as the target object.
Table 4.
Quantitative comparison of various methods with the sponge as the target object.
| Method | Average RMSE |
|---|
| 2D CNN-based methods | 2D CNN-based ResNet [25] | 0.1844 |
| CNN + LSTM | 0.0925 |
| CNN + LSTM + EI [21] | 0.0882 |
| 3D CNN-based methods | VGG-like 3D CNN | 0.0422 |
| ResNet-like 3D CNN | 0.0757 |
| Proposed Method | 0.0405 |
Table 5.
Quantitative comparison of various methods with the paper cup as the target object.
Table 5.
Quantitative comparison of various methods with the paper cup as the target object.
| Method | Average RMSE |
|---|
| 2D CNN-based methods | 2D CNN-based ResNet [25] | 0.2049 |
| CNN + LSTM | 0.1007 |
| CNN + LSTM + EI [21] | - |
| 3D CNN-based methods | VGG-like 3D CNN | 0.0580 |
| ResNet-like 3D CNN | 0.0737 |
| Proposed Method | 0.0560 |
Table 6.
Quantitative comparison of various methods with the stapler as the target object.
Table 6.
Quantitative comparison of various methods with the stapler as the target object.
| Method | Average RMSE |
|---|
| 2D CNN-based methods | 2D CNN-based ResNet [25] | 0.7526 |
| CNN + LSTM | 0.3385 |
| CNN + LSTM + EI [21] | 0.2702 |
| 3D CNN-based methods | VGG-like 3D CNN | 0.1554 |
| ResNet-like 3D CNN | 0.1933 |
| Proposed Method | 0.1602 |
Table 7.
Quantitative comparison of performances of various methods with the tube as the target object.
Table 7.
Quantitative comparison of performances of various methods with the tube as the target object.
| Method | Average RMSE |
|---|
| 2D CNN-based methods | 2D CNN-based ResNet [25] | 0.7149 |
| CNN + LSTM | 0.4046 |
| CNN + LSTM + EI [21] | - |
| 3D CNN-based methods | VGG-like 3D CNN | 0.2075 |
| ResNet-like 3D CNN | 0.1345 |
| Proposed Method | 0.1914 |


