Assessing Older Adults’ Daily Mobility: A Comparison of GPS-Derived and Self-Reported Mobility Indicators

 , , , and
Abstract
1. Introduction
- We investigate in a sensitivity analysis how the choice of thresholds (Tmin, Dmax, Tmax) affects the indicator agreement between self-reported and GPS-based indicators.
- We explore the convergent validity for both mobility indicators by comparing the self-reported and GPS-derived daily mobility indicators.
- We explore whether self-reported activity characteristics (i.e., the duration or type of an activity) affect a self-reported event, finds a corresponding, temporally overlapping (i.e., matching) GPS event.
2. Self-Reports and GPS Sensors for Assessing Daily Mobility
2.1. Self-Reports
2.2. GPS as a Location Sensor
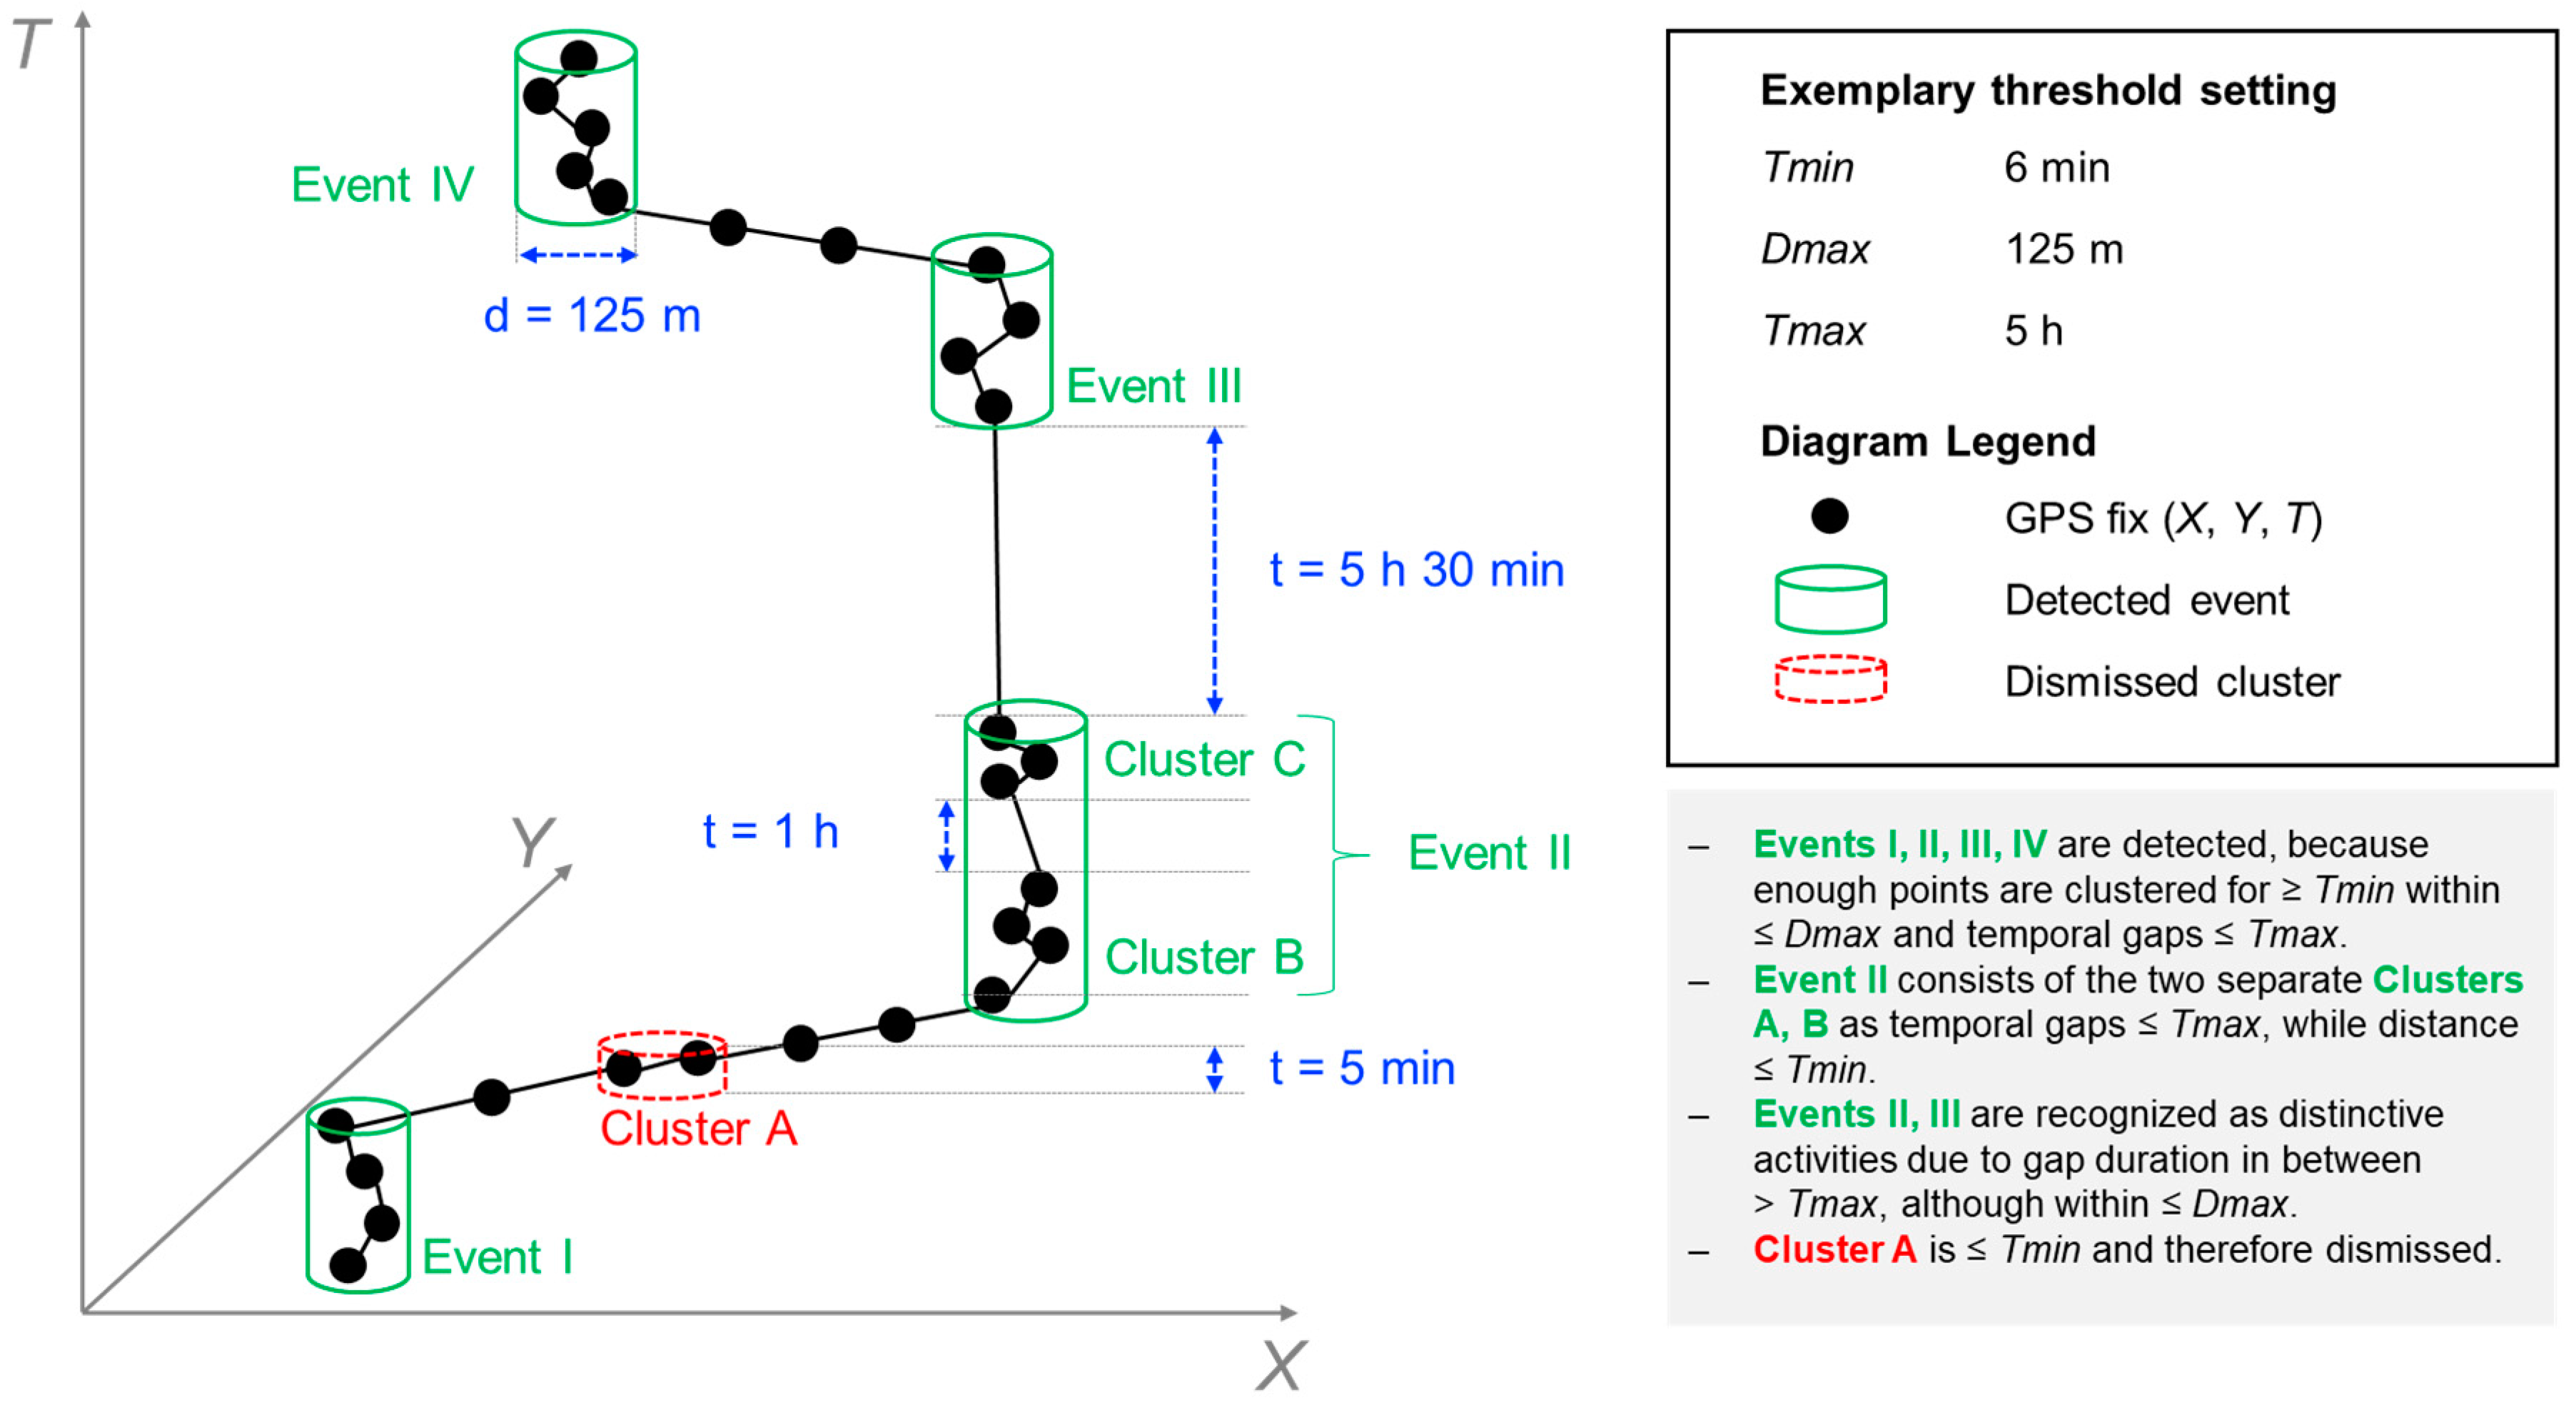
2.3. GPS Data Processing and Threshold Setting
- Minimum time duration (Tmin): Tmin defines the minimum time spent out of home or in an activity location in order to count as valid TOH or AL event, respectively.
- Maximum distance (Dmax): For TOH, Dmax is a radius defining a buffer around home. All fixes within the buffer count as home, all fixes outside of the buffer count as out of home (OH). For #ALs, Dmax defines the maximum spatial region within which the individual can move (respectively the GPS signal is allowed to wander) in order to be defined as an AL.
- Maximum gap duration (Tmax): For both indicators, Tmax defines the maximum duration of a gap in GPS data over which interpolation is invoked if the remaining conditions are met (i.e., Tmin, Dmax).
2.4. Self-Reported versus GPS-Derived Mobility Indicators
3. Methods
3.1. Study Design and Participant Recruitment
3.2. Data Collection
3.3. Self-Reported Mobility Indicators
3.4. GPS-Based Mobility Indicators
3.5. Sensitivity Analysis for Dmax, Tmin, Tmax
3.6. Inclusion Criteria
3.7. Statistical Analyses
4. Results
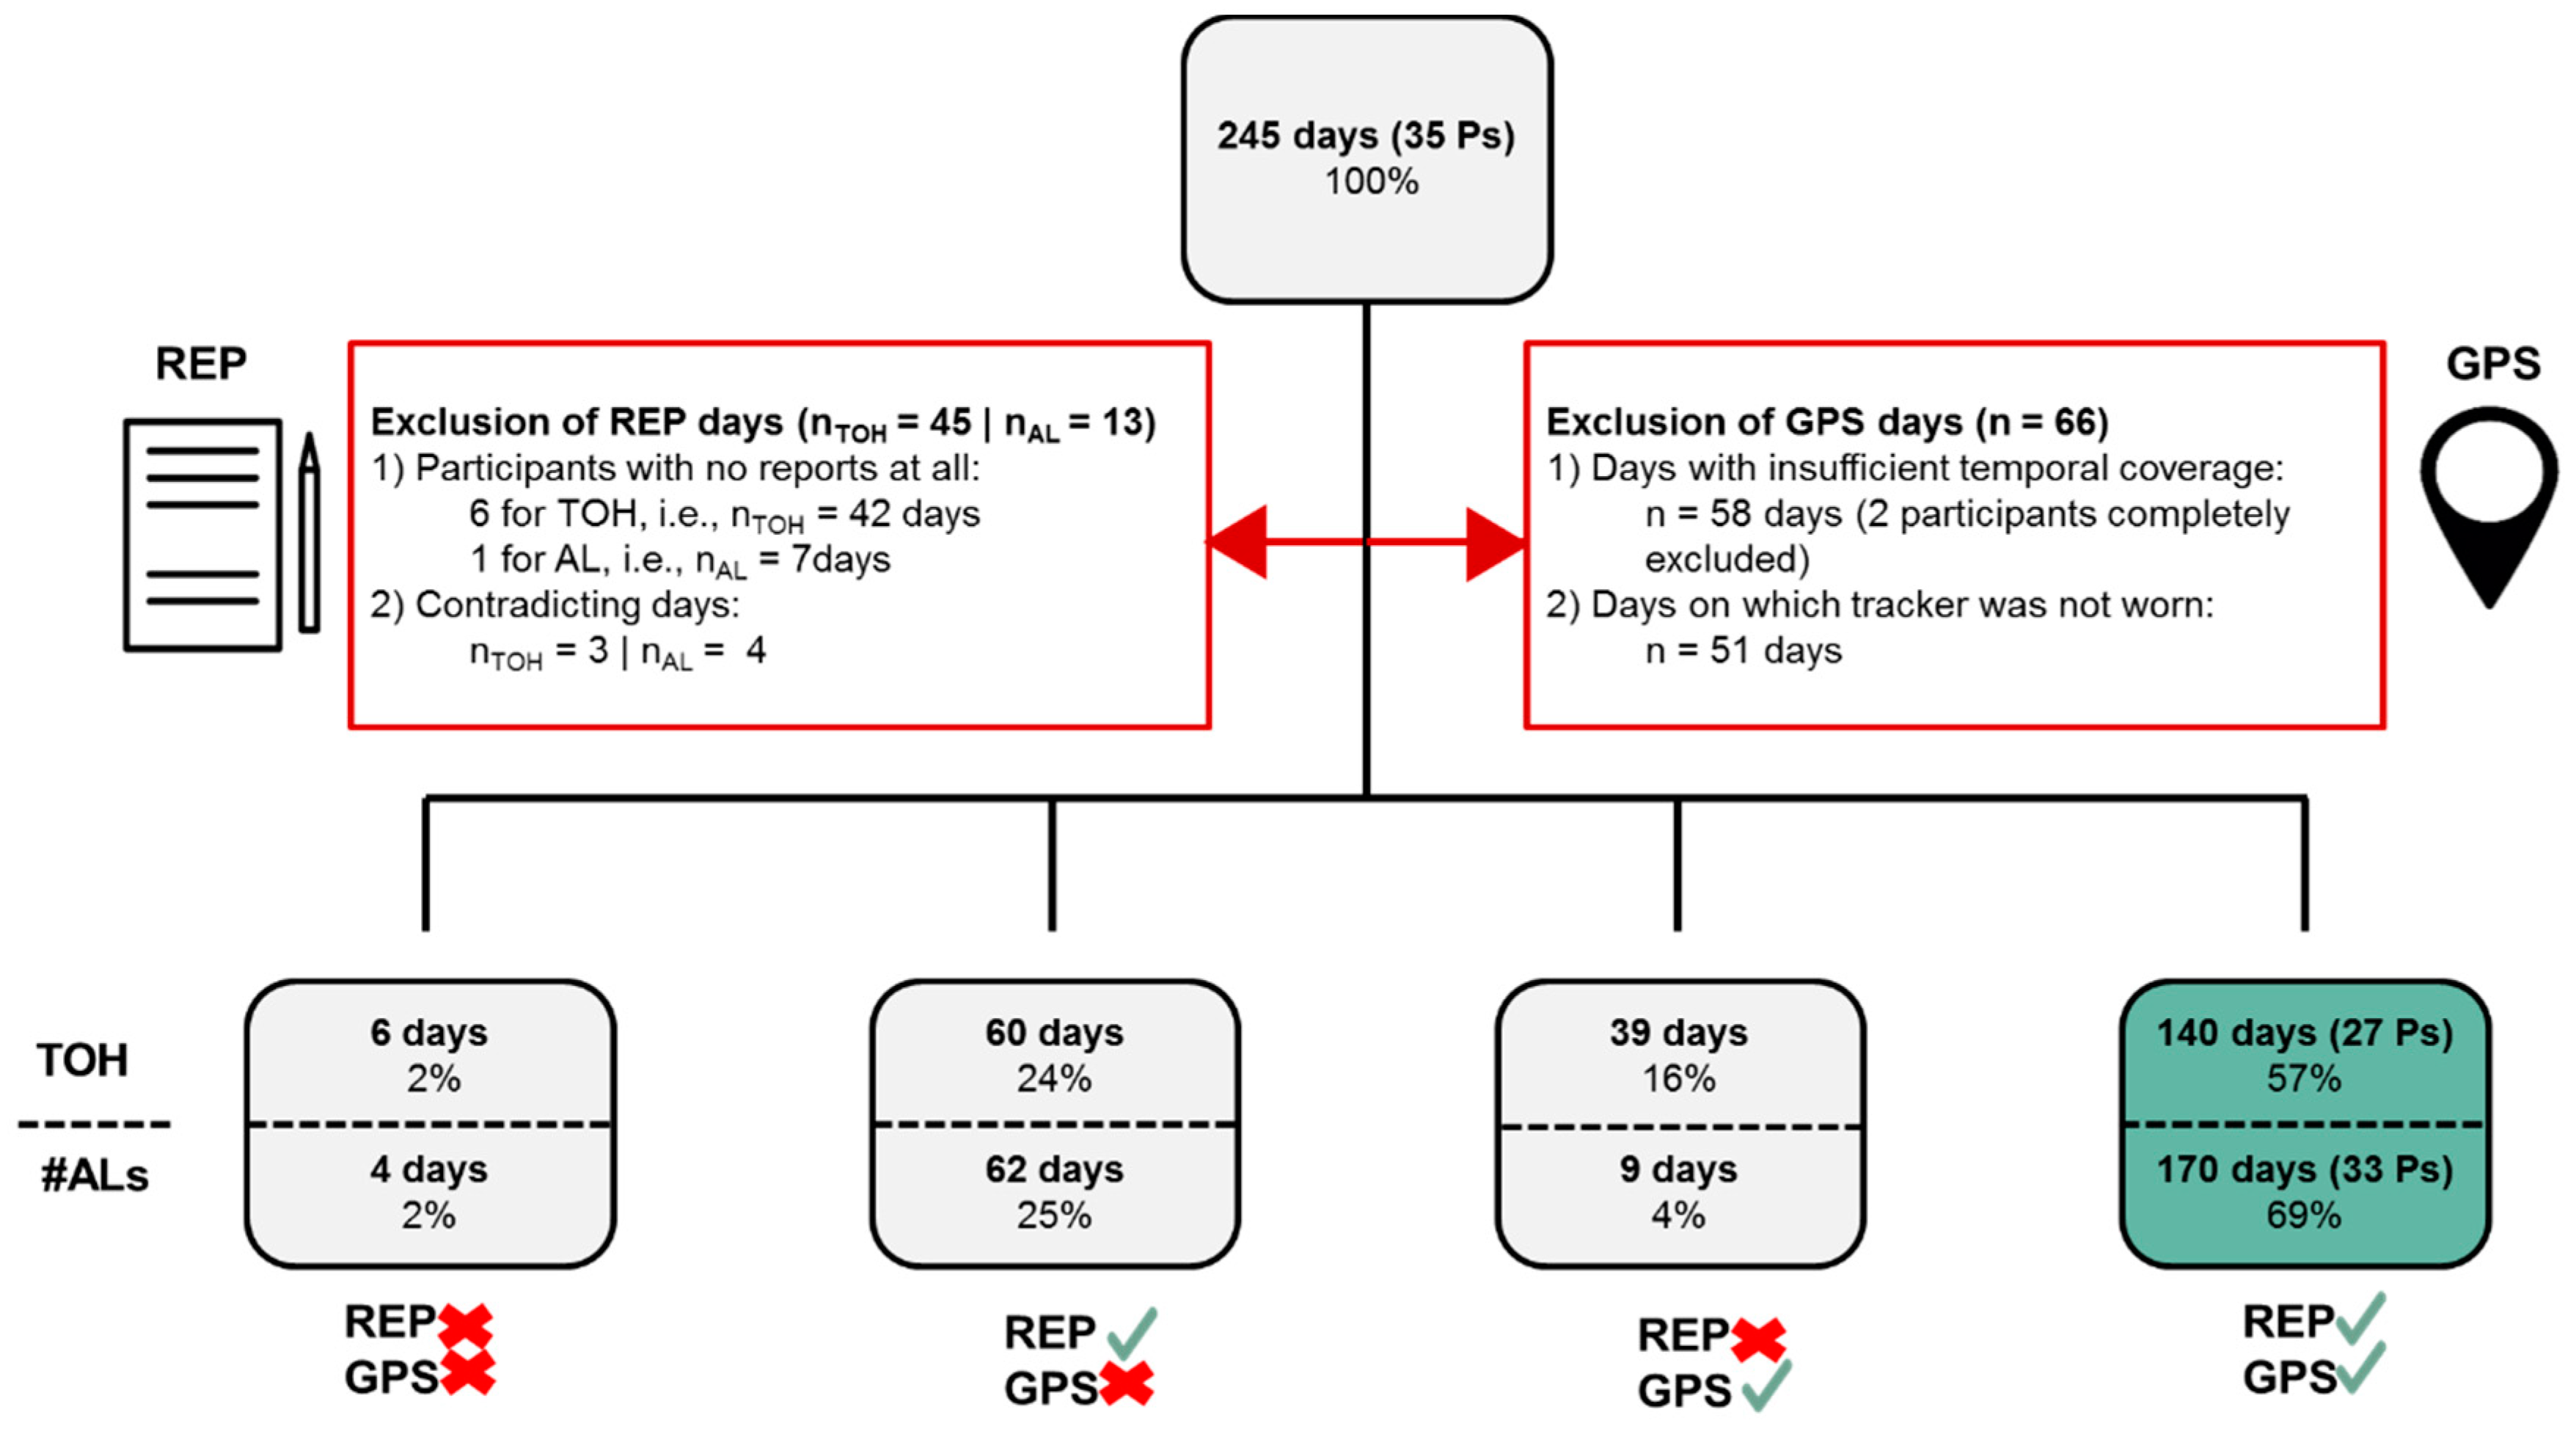
4.1. Included Data
4.2. Sensitivity Analysis
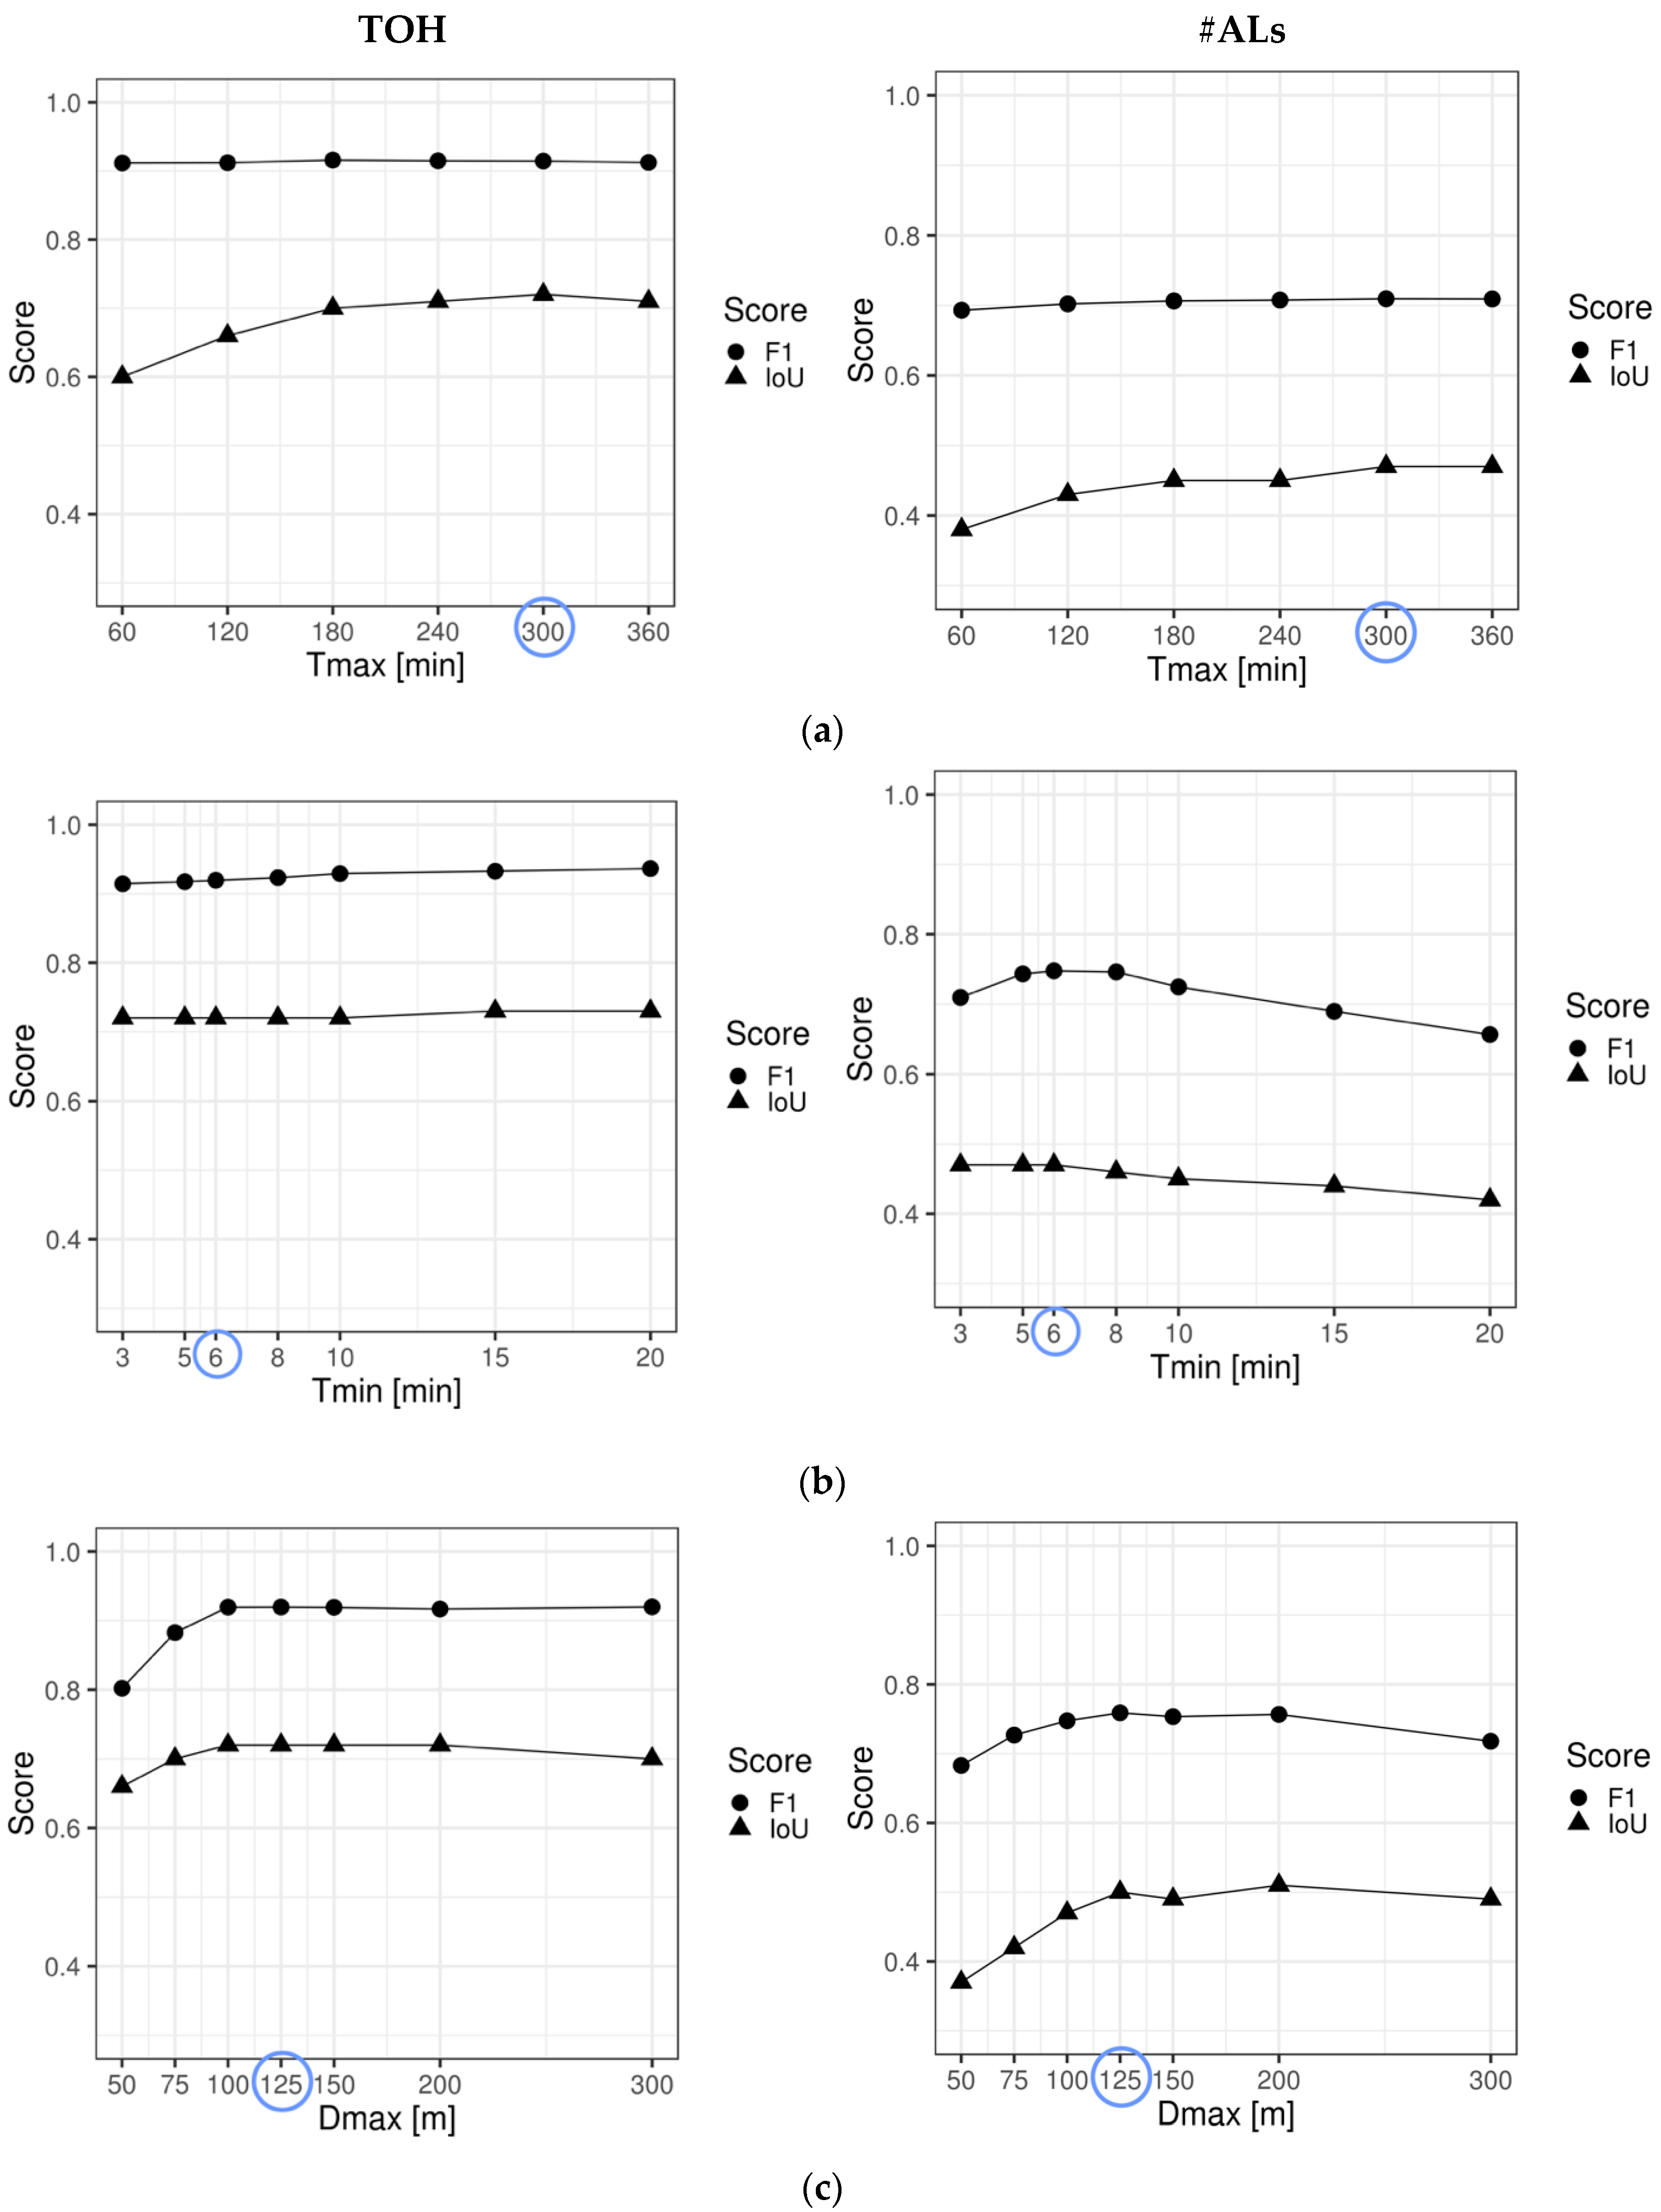
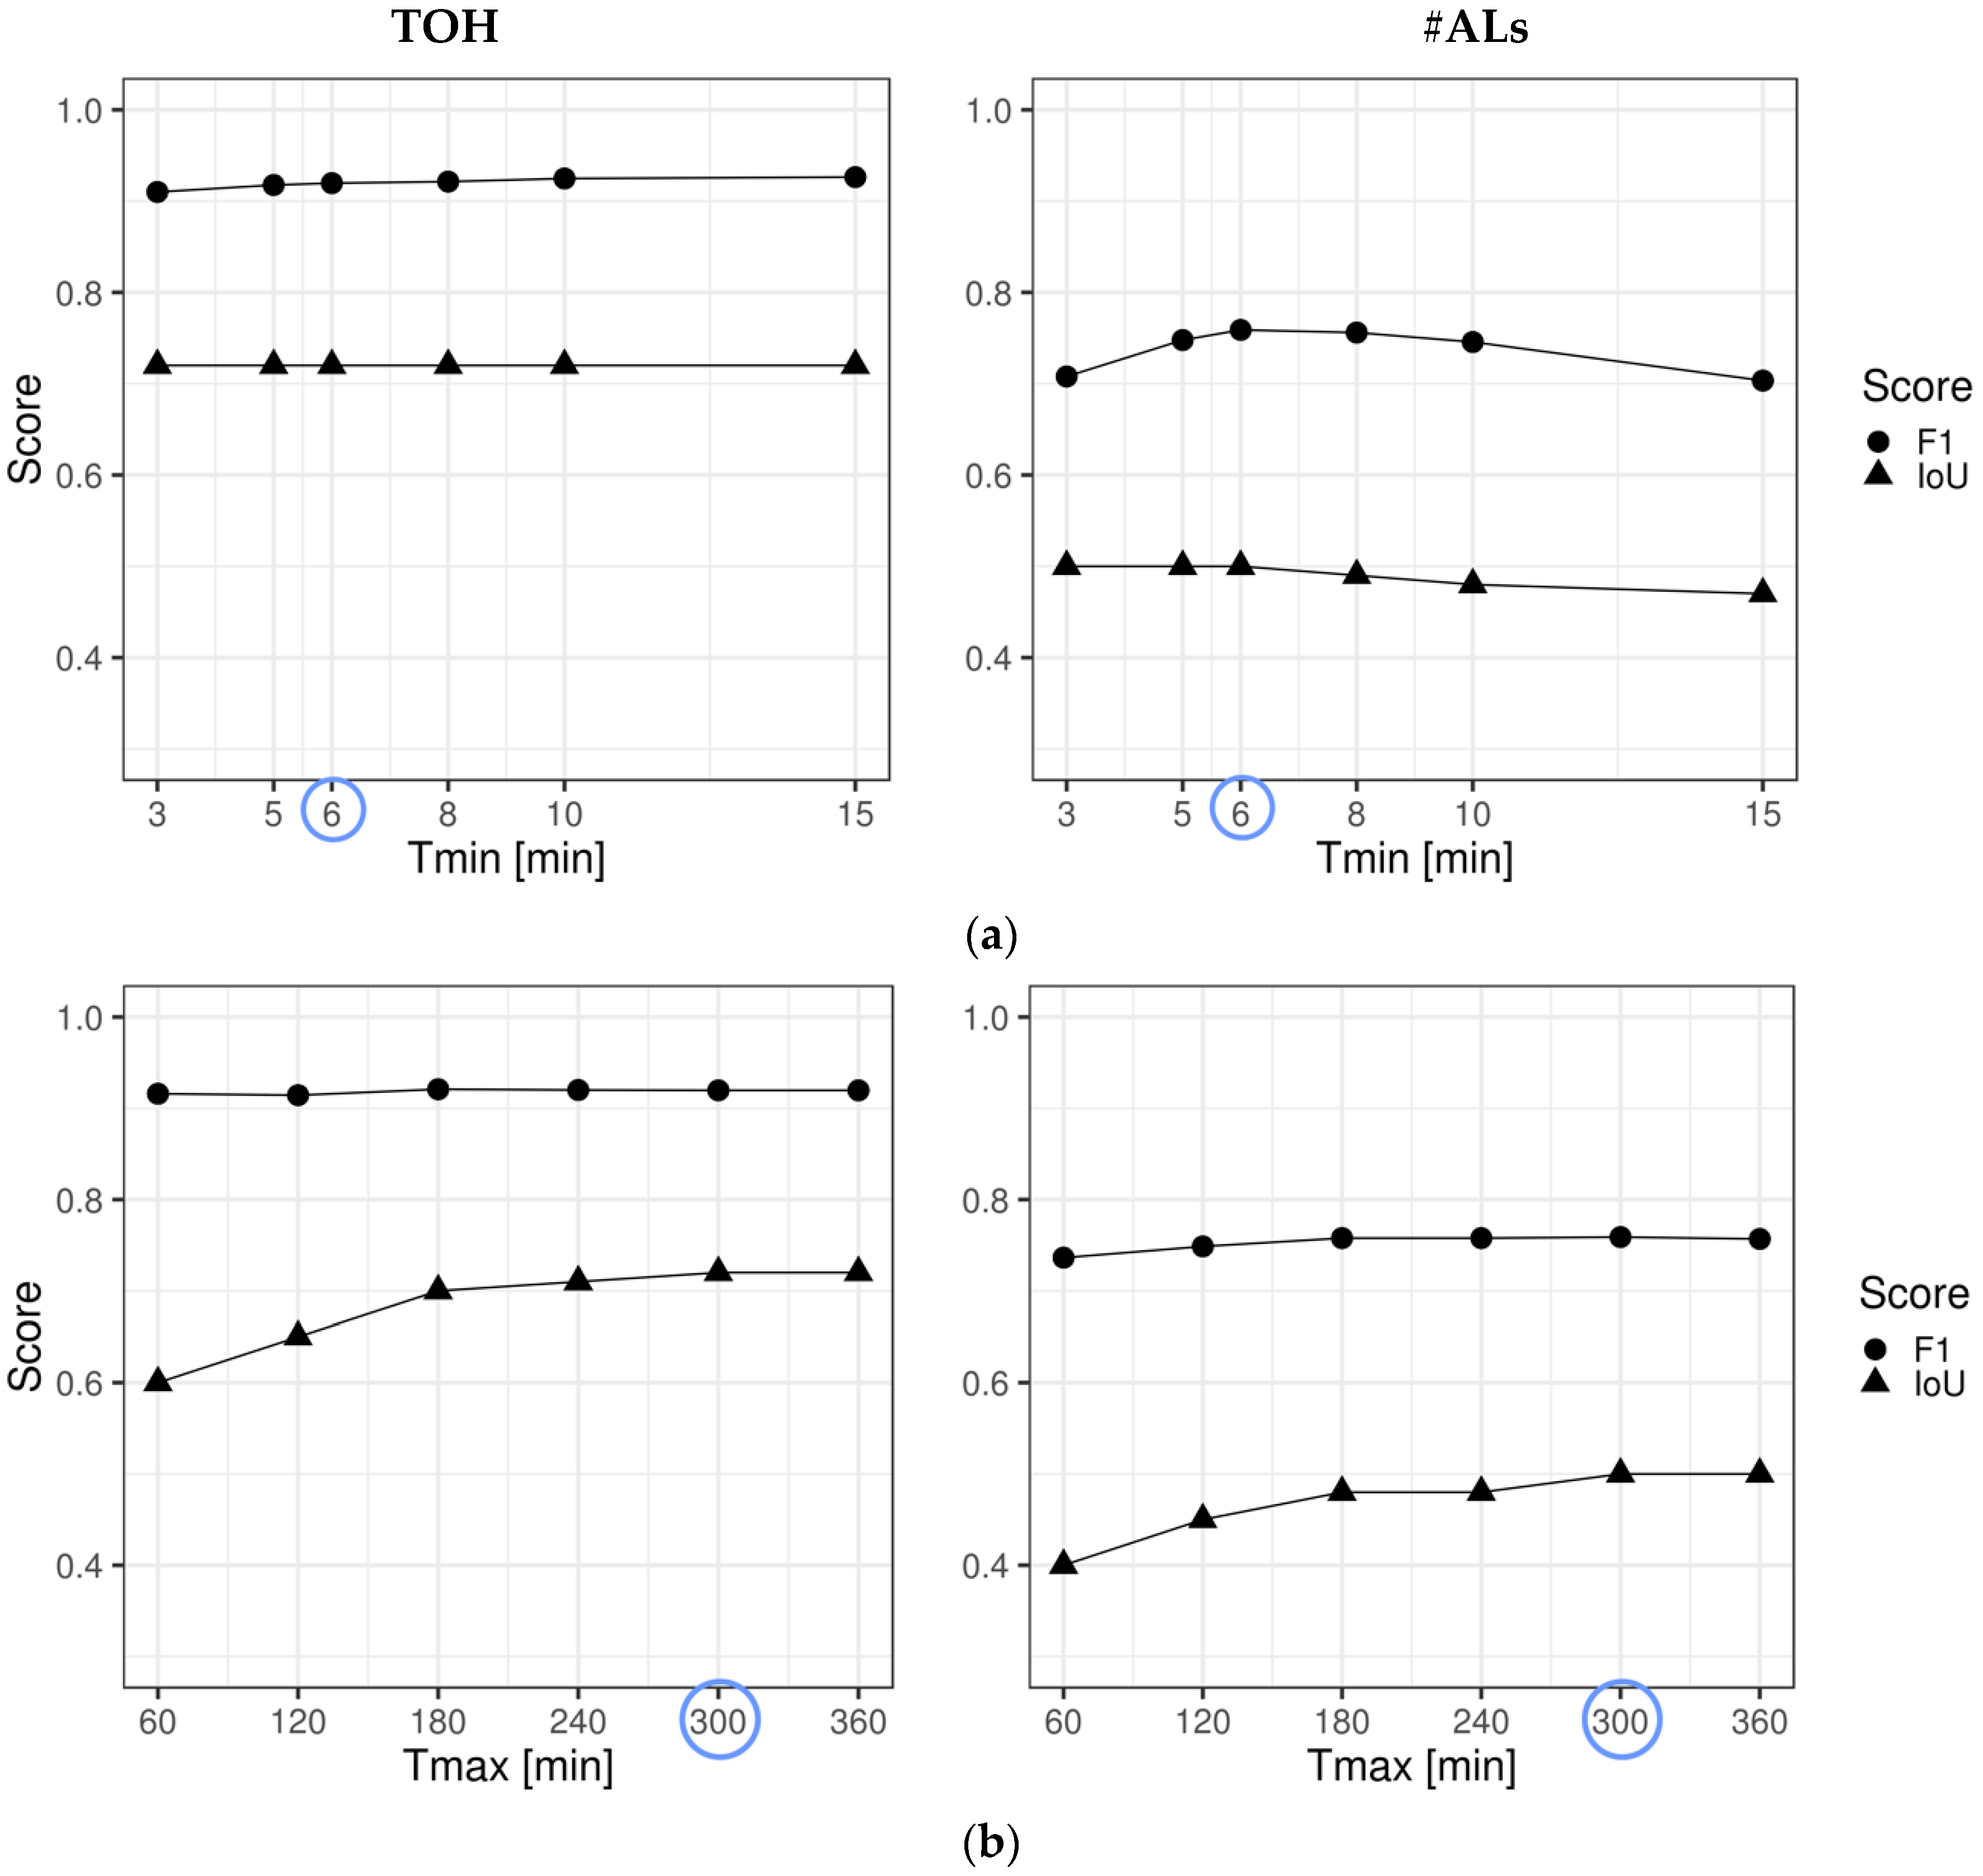
- While the count-oriented agreement measure F1 barely reacts to varying Tmax, the duration-oriented IoU steadily increases, with an optimum at 300 min (i.e., 5 h) for both TOH and #ALs. For Tmax between 180 and 360 min (i.e., 3 and 6 h) indicator agreement appears to be stable.
- While Tmin has no major impact on agreement between REP and GPS indicators, it does affect the indicator agreement for #ALs. F1 (the count-based measure more relevant for #ALs) seems to peak between 5 and 8 min (maximum at 6 min) while IoU starts dropping at 8 min.
- For TOH, indicator agreement is increasing until Dmax = 100 m and then remains stable, only starting to slowly drop at 300 m. For #AL, the best indicator agreement is obtained for Dmax = 125 m. After 200 m, both measures of agreement start dropping.
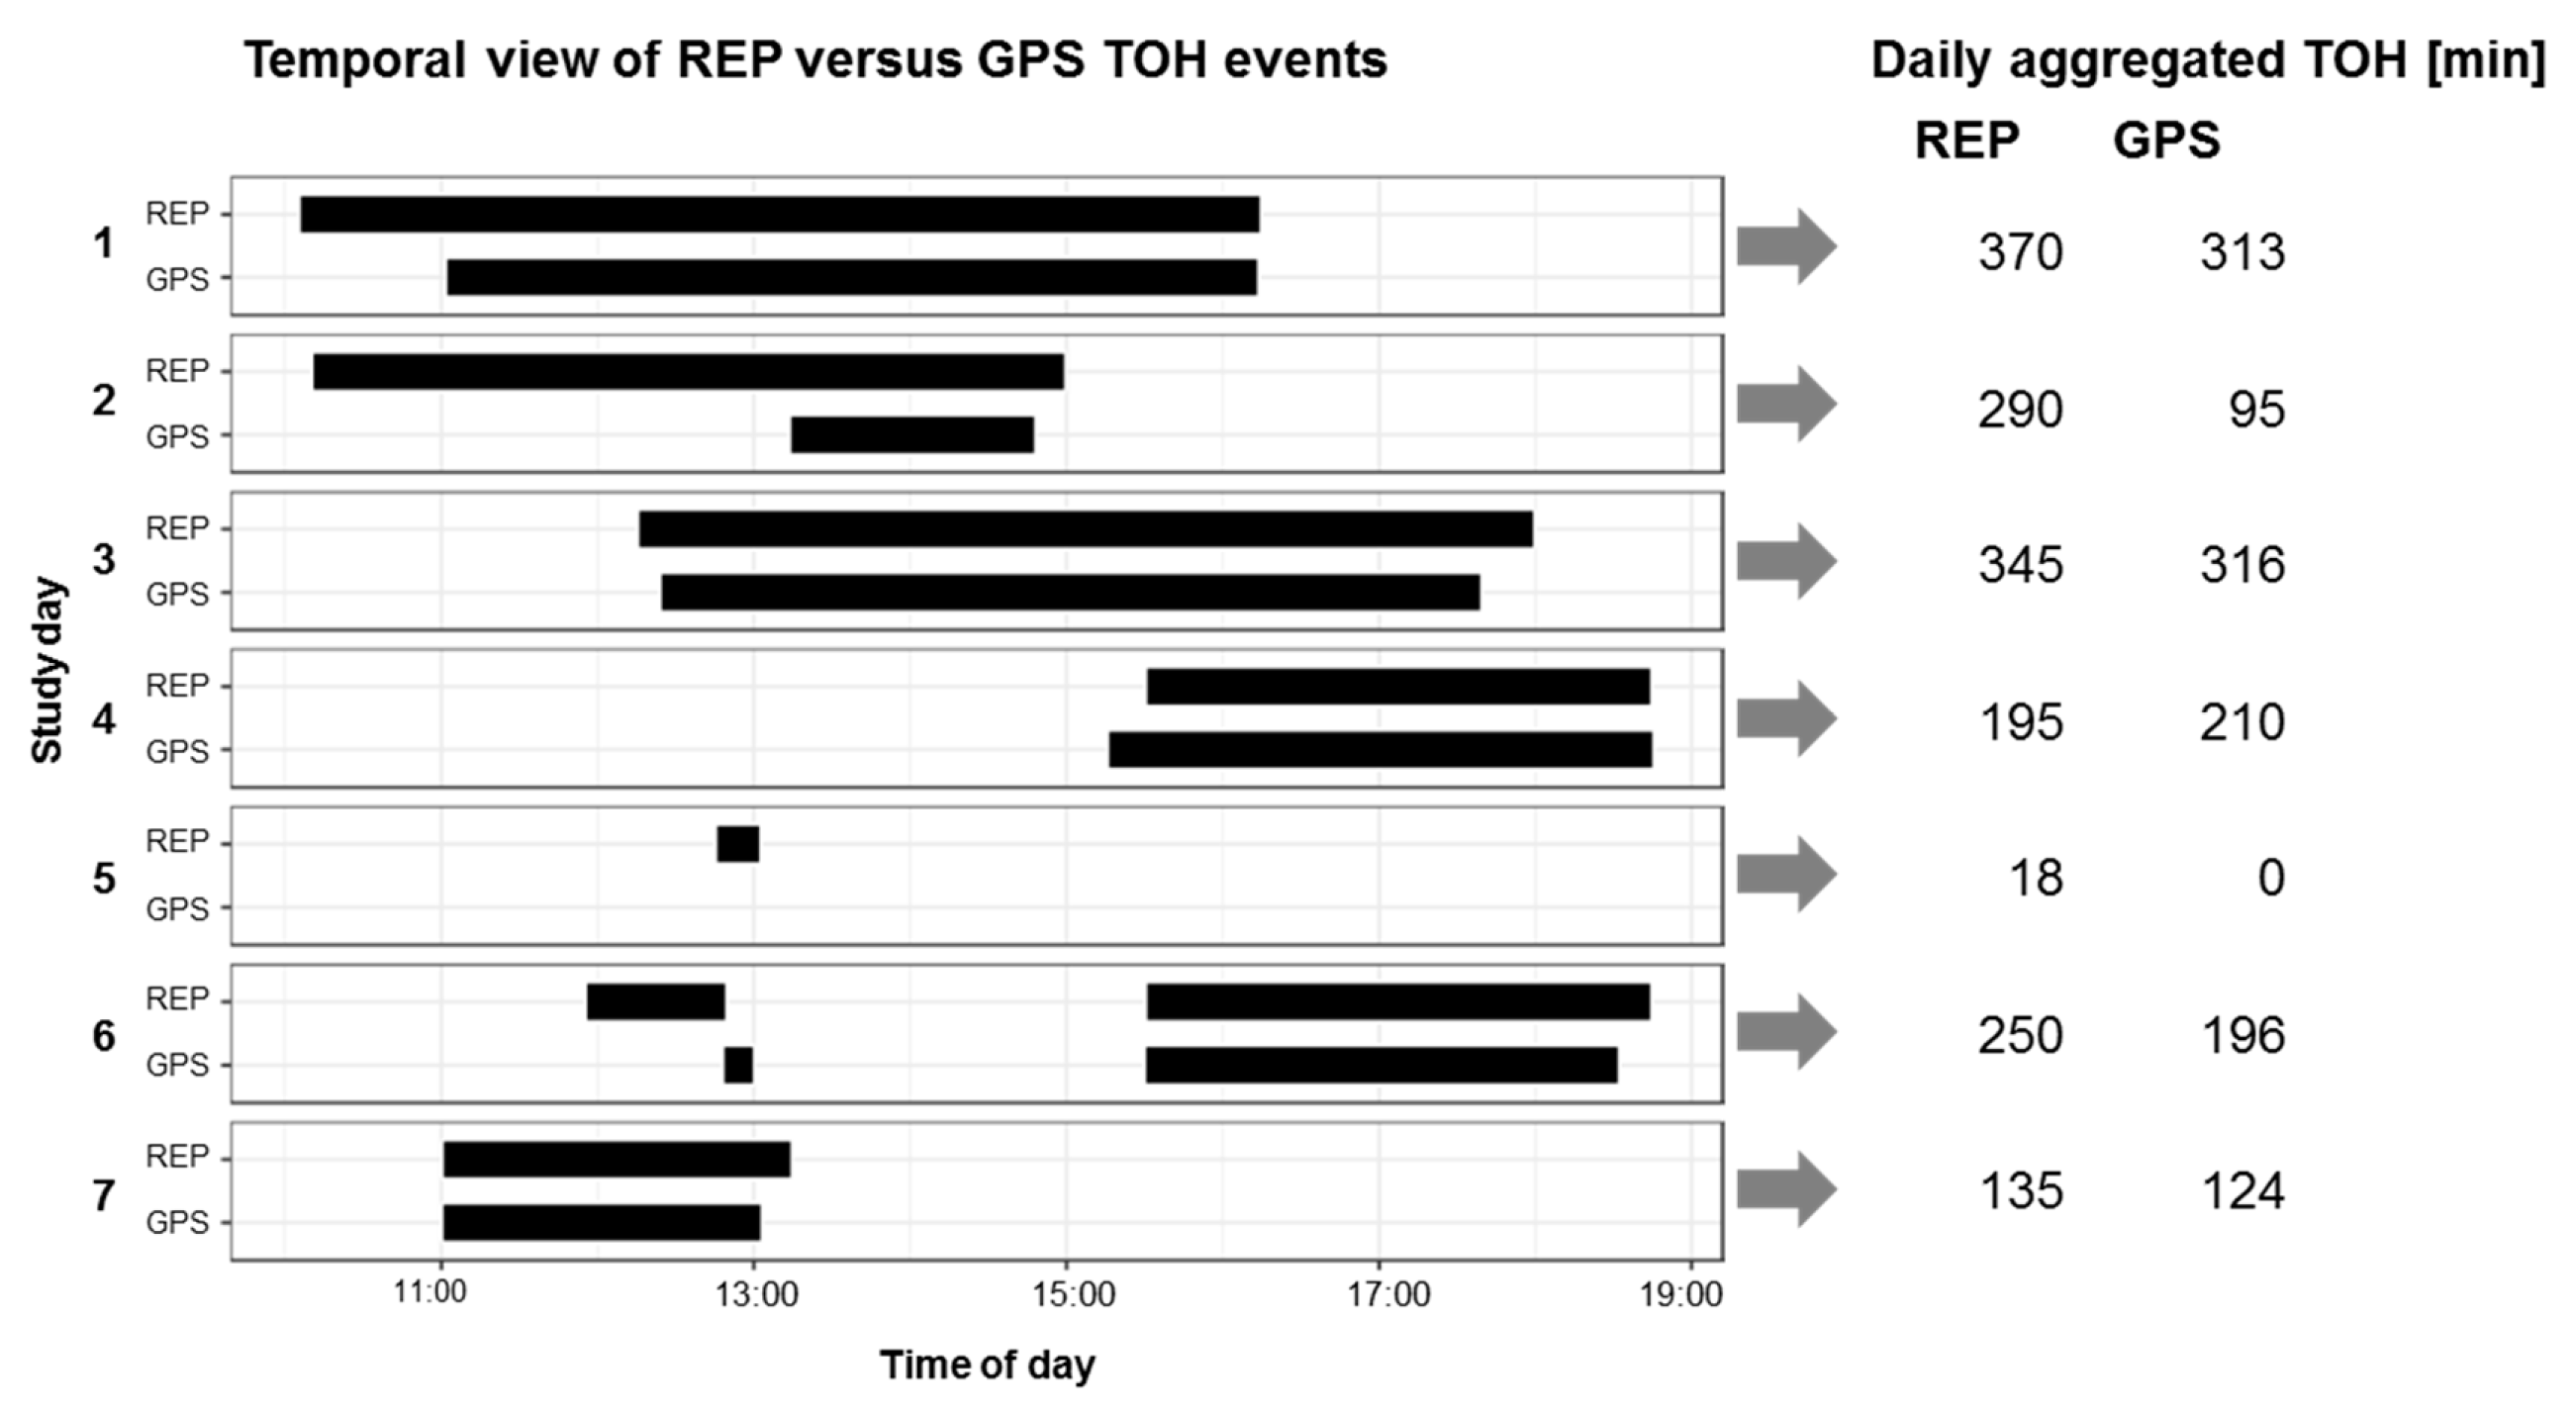
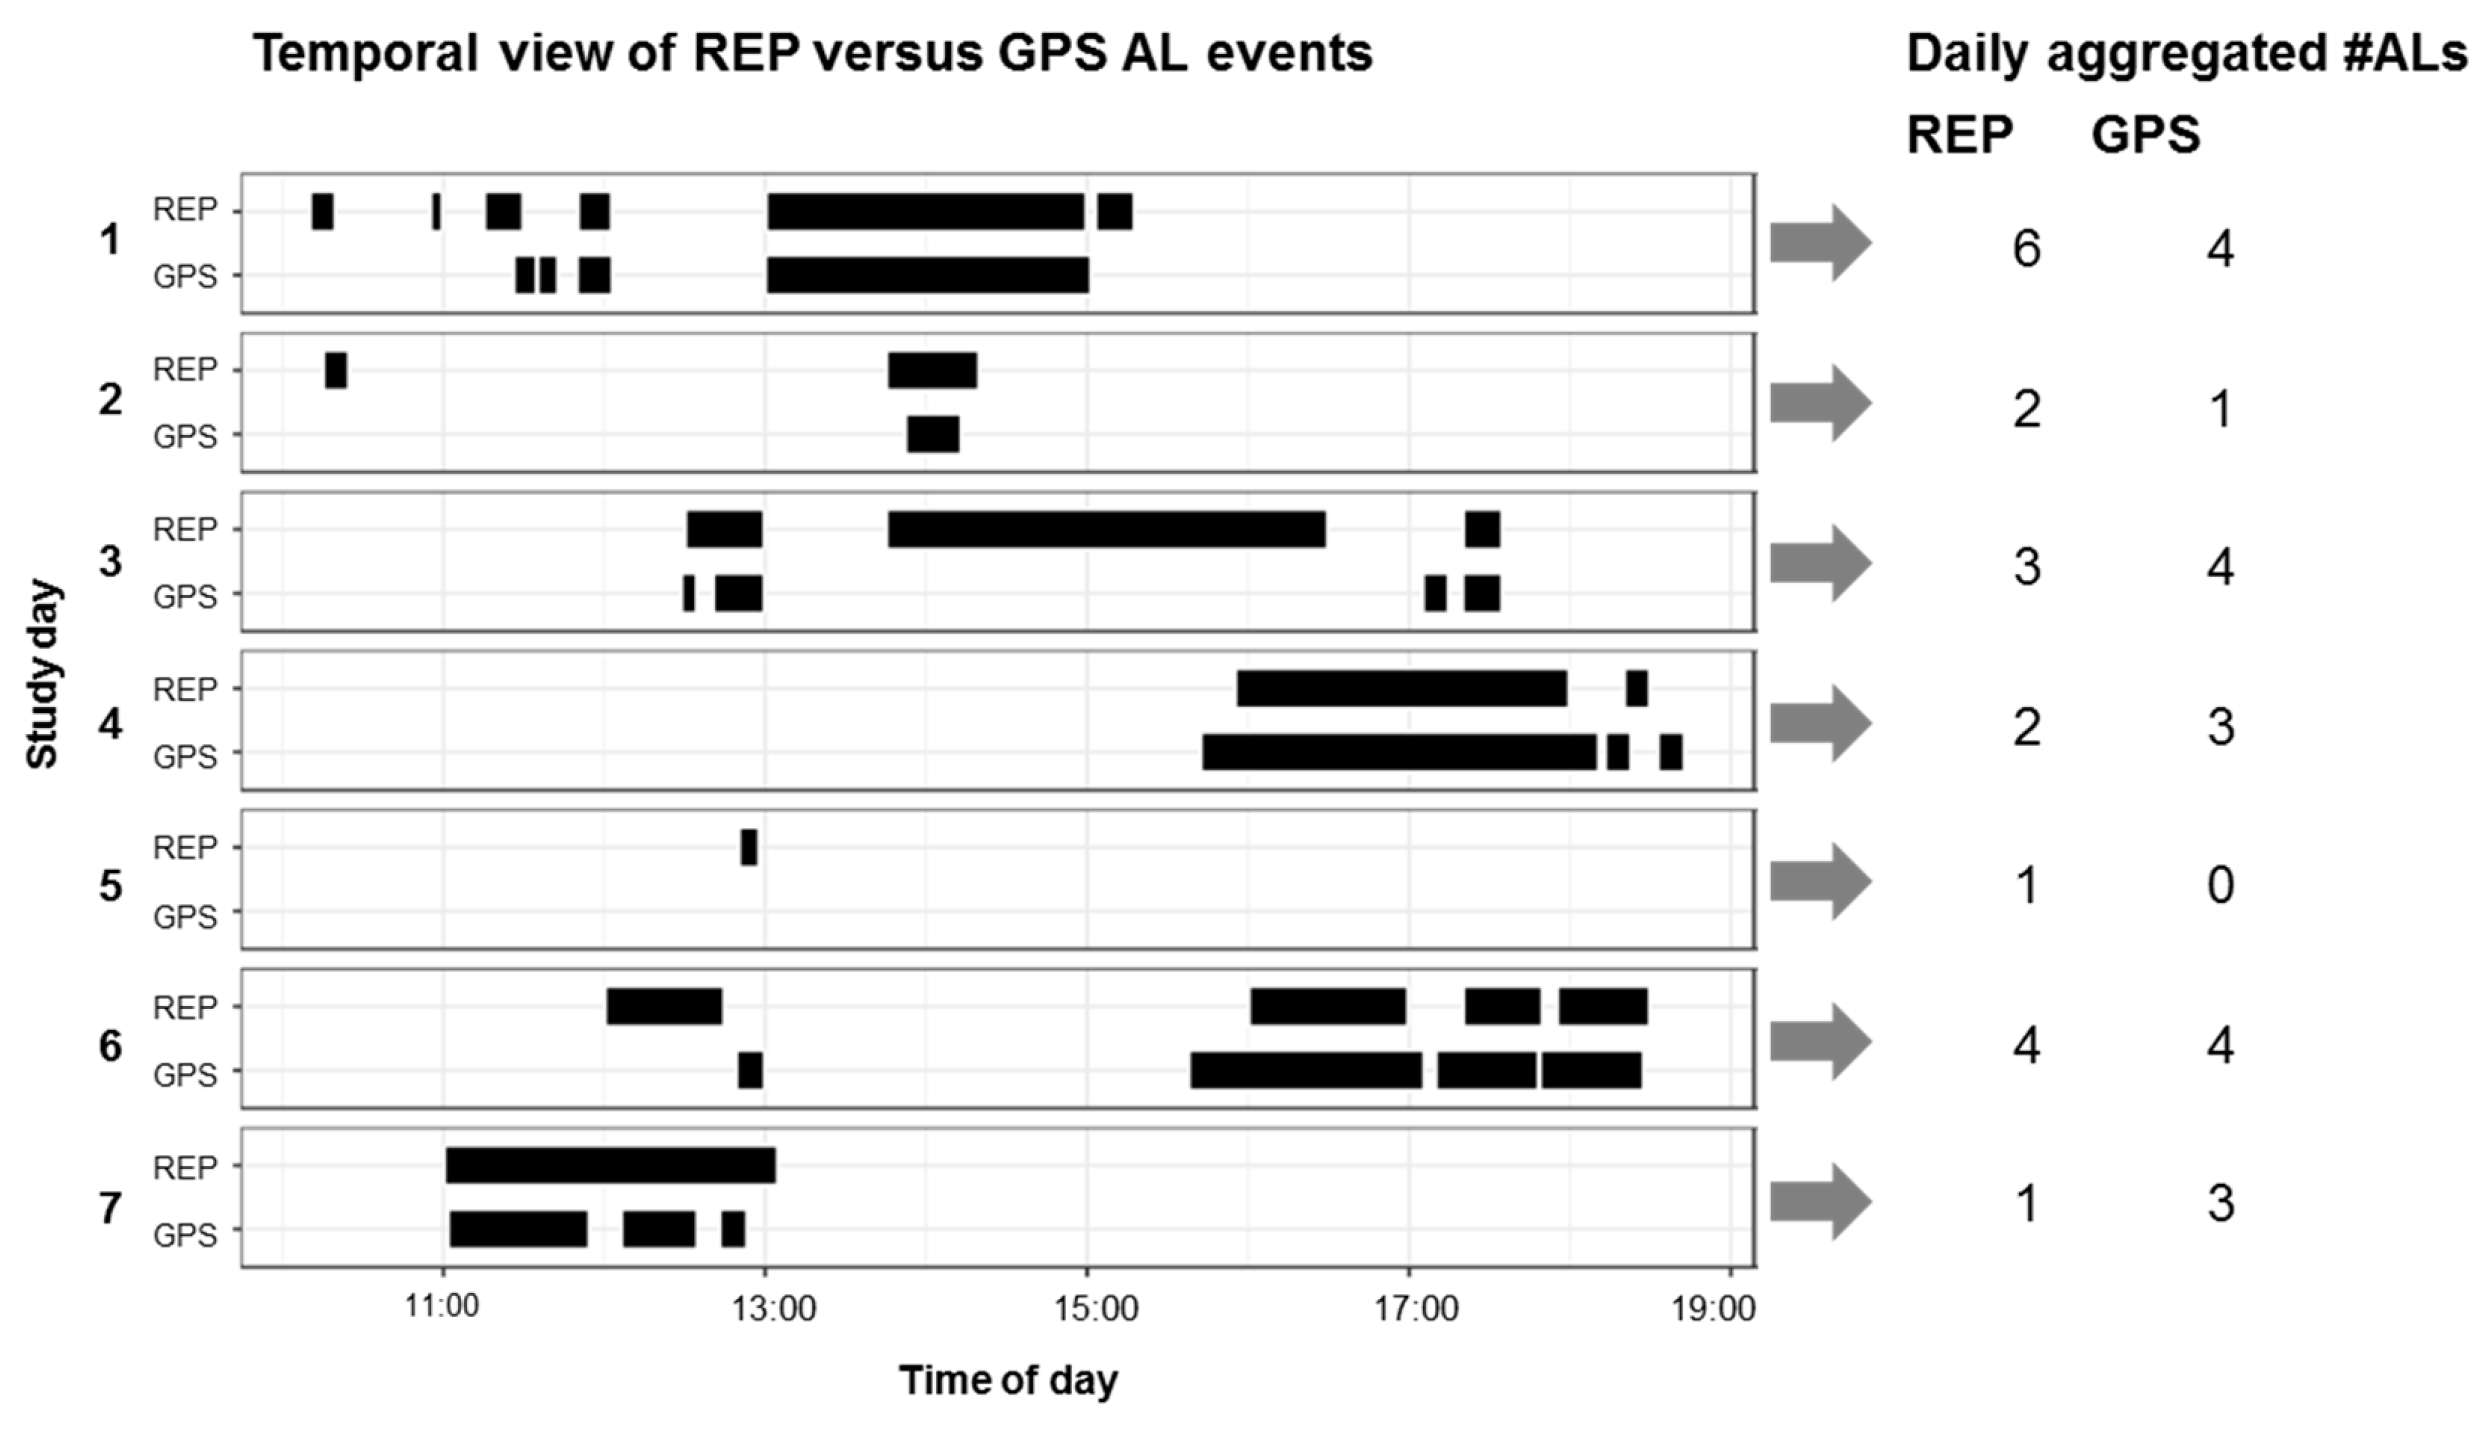
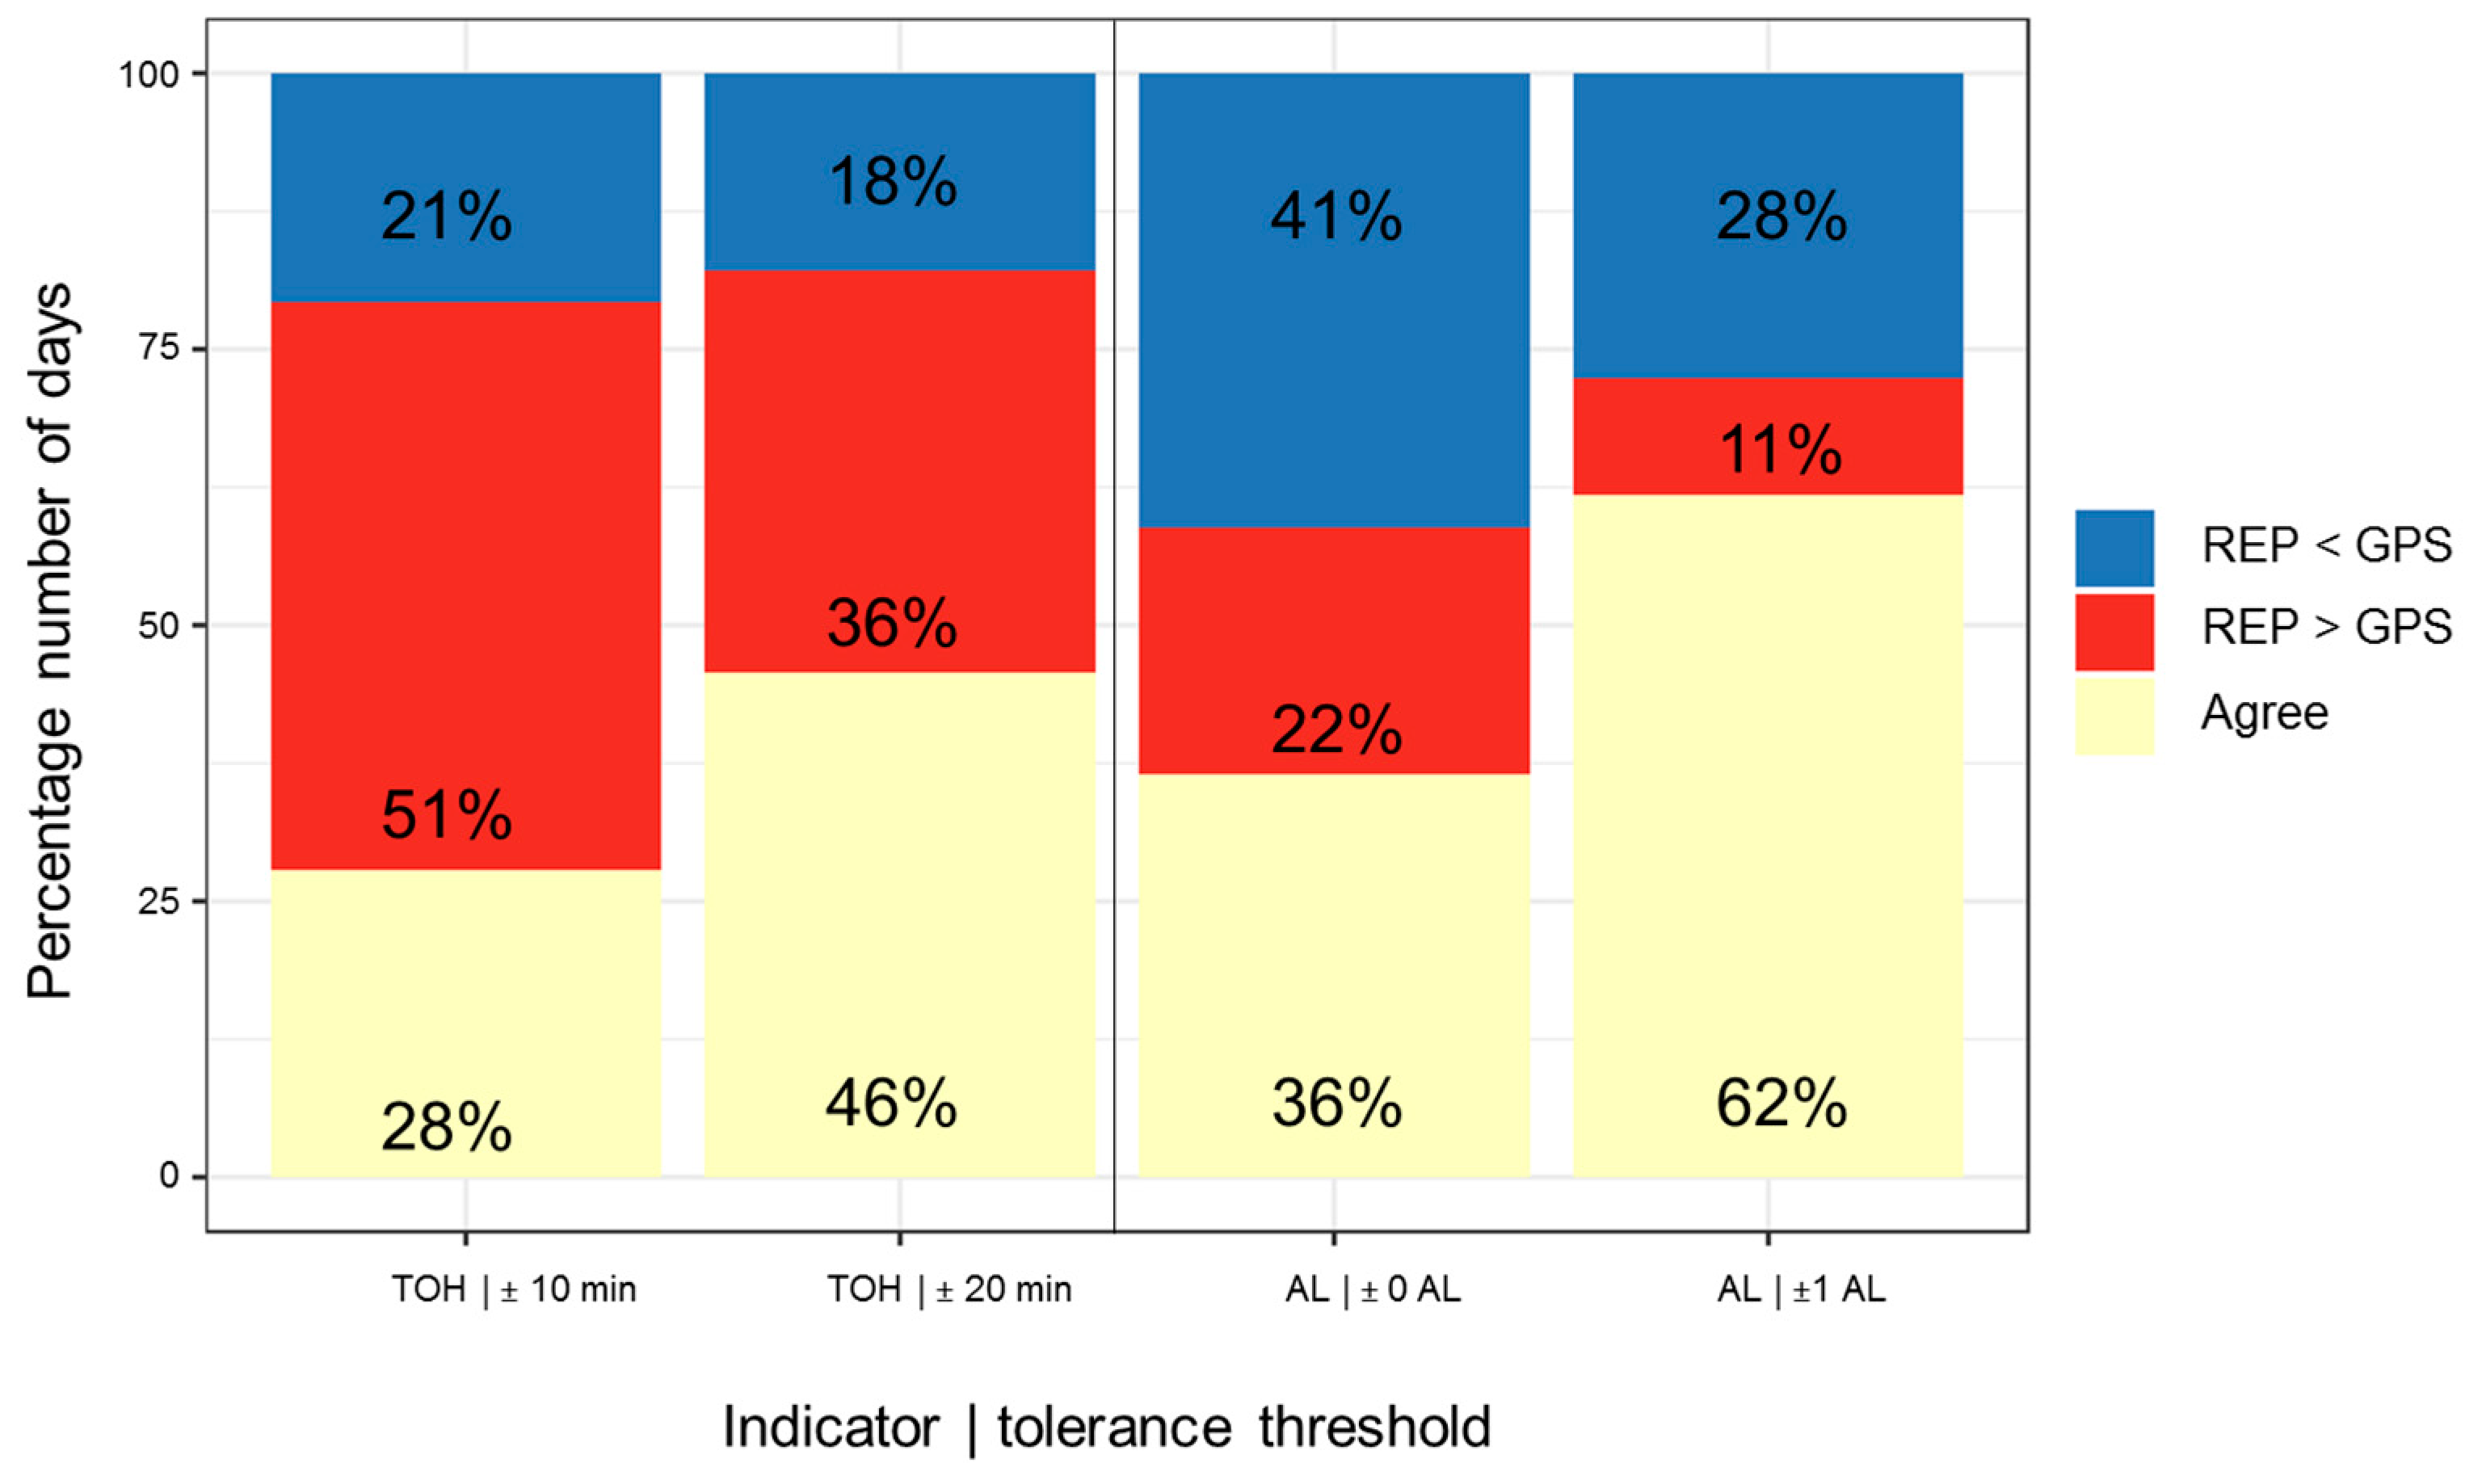
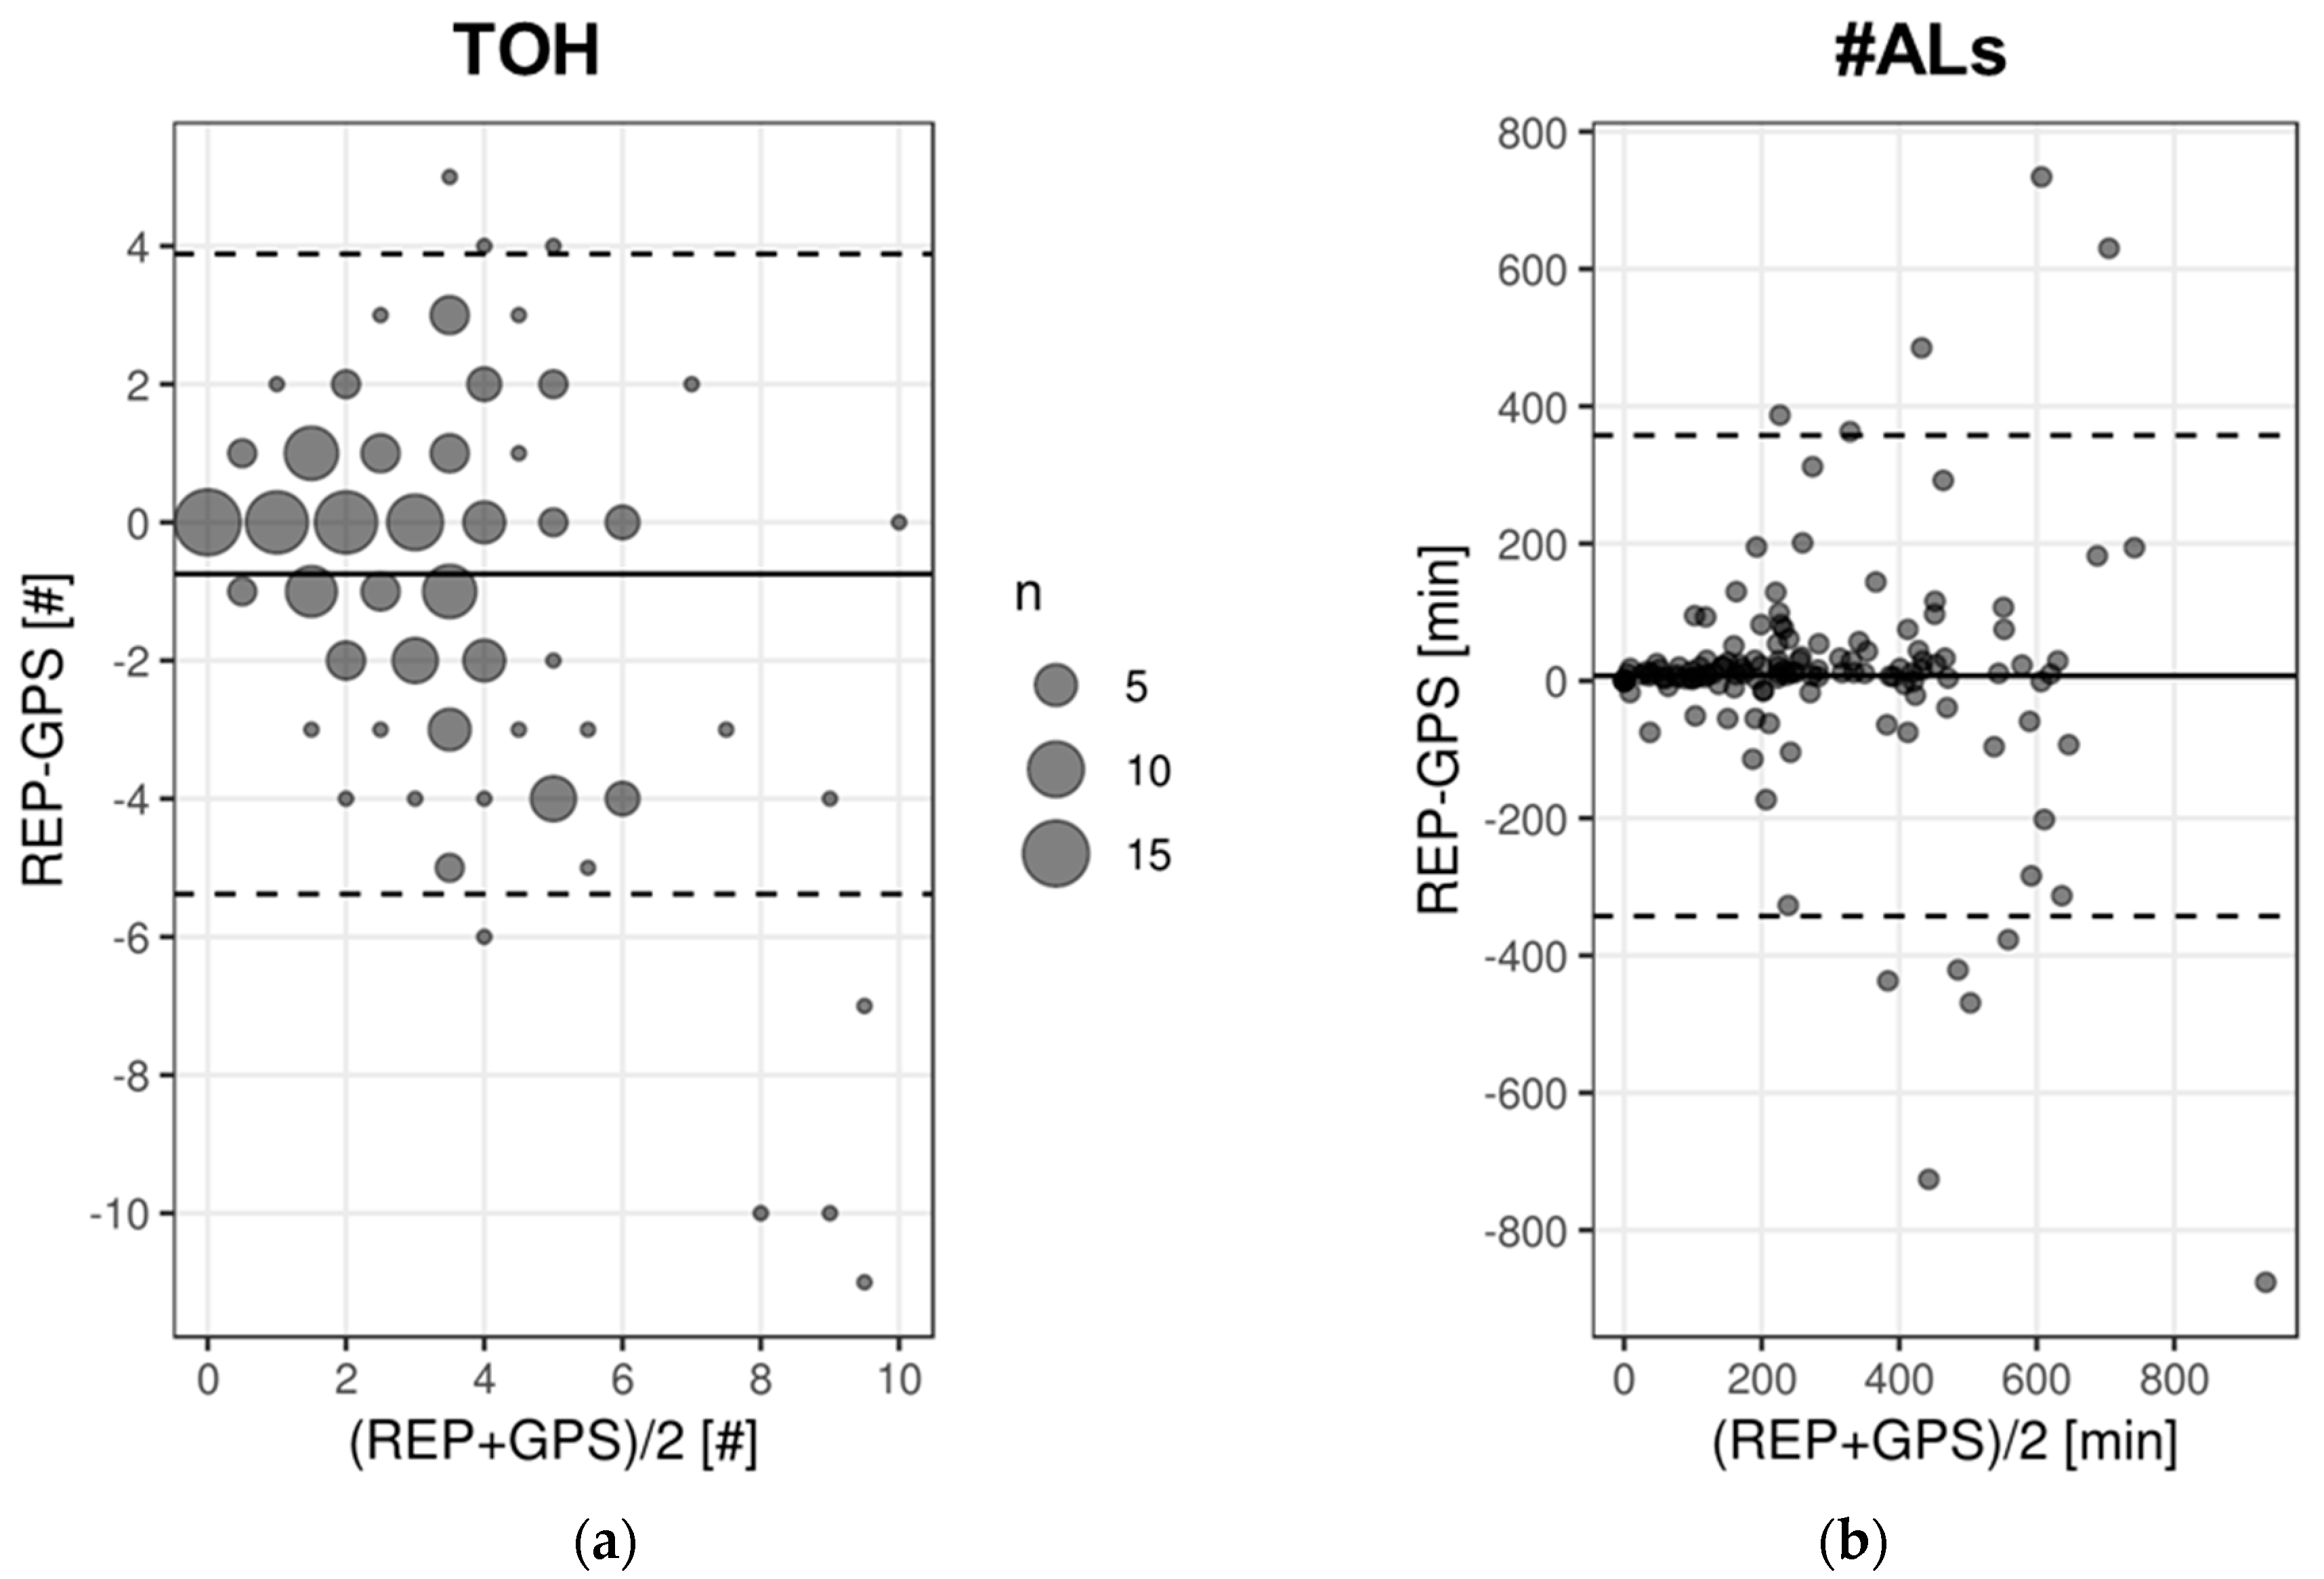
4.3. Agreement between Daily REP and GPS-Based Mobility Indicators
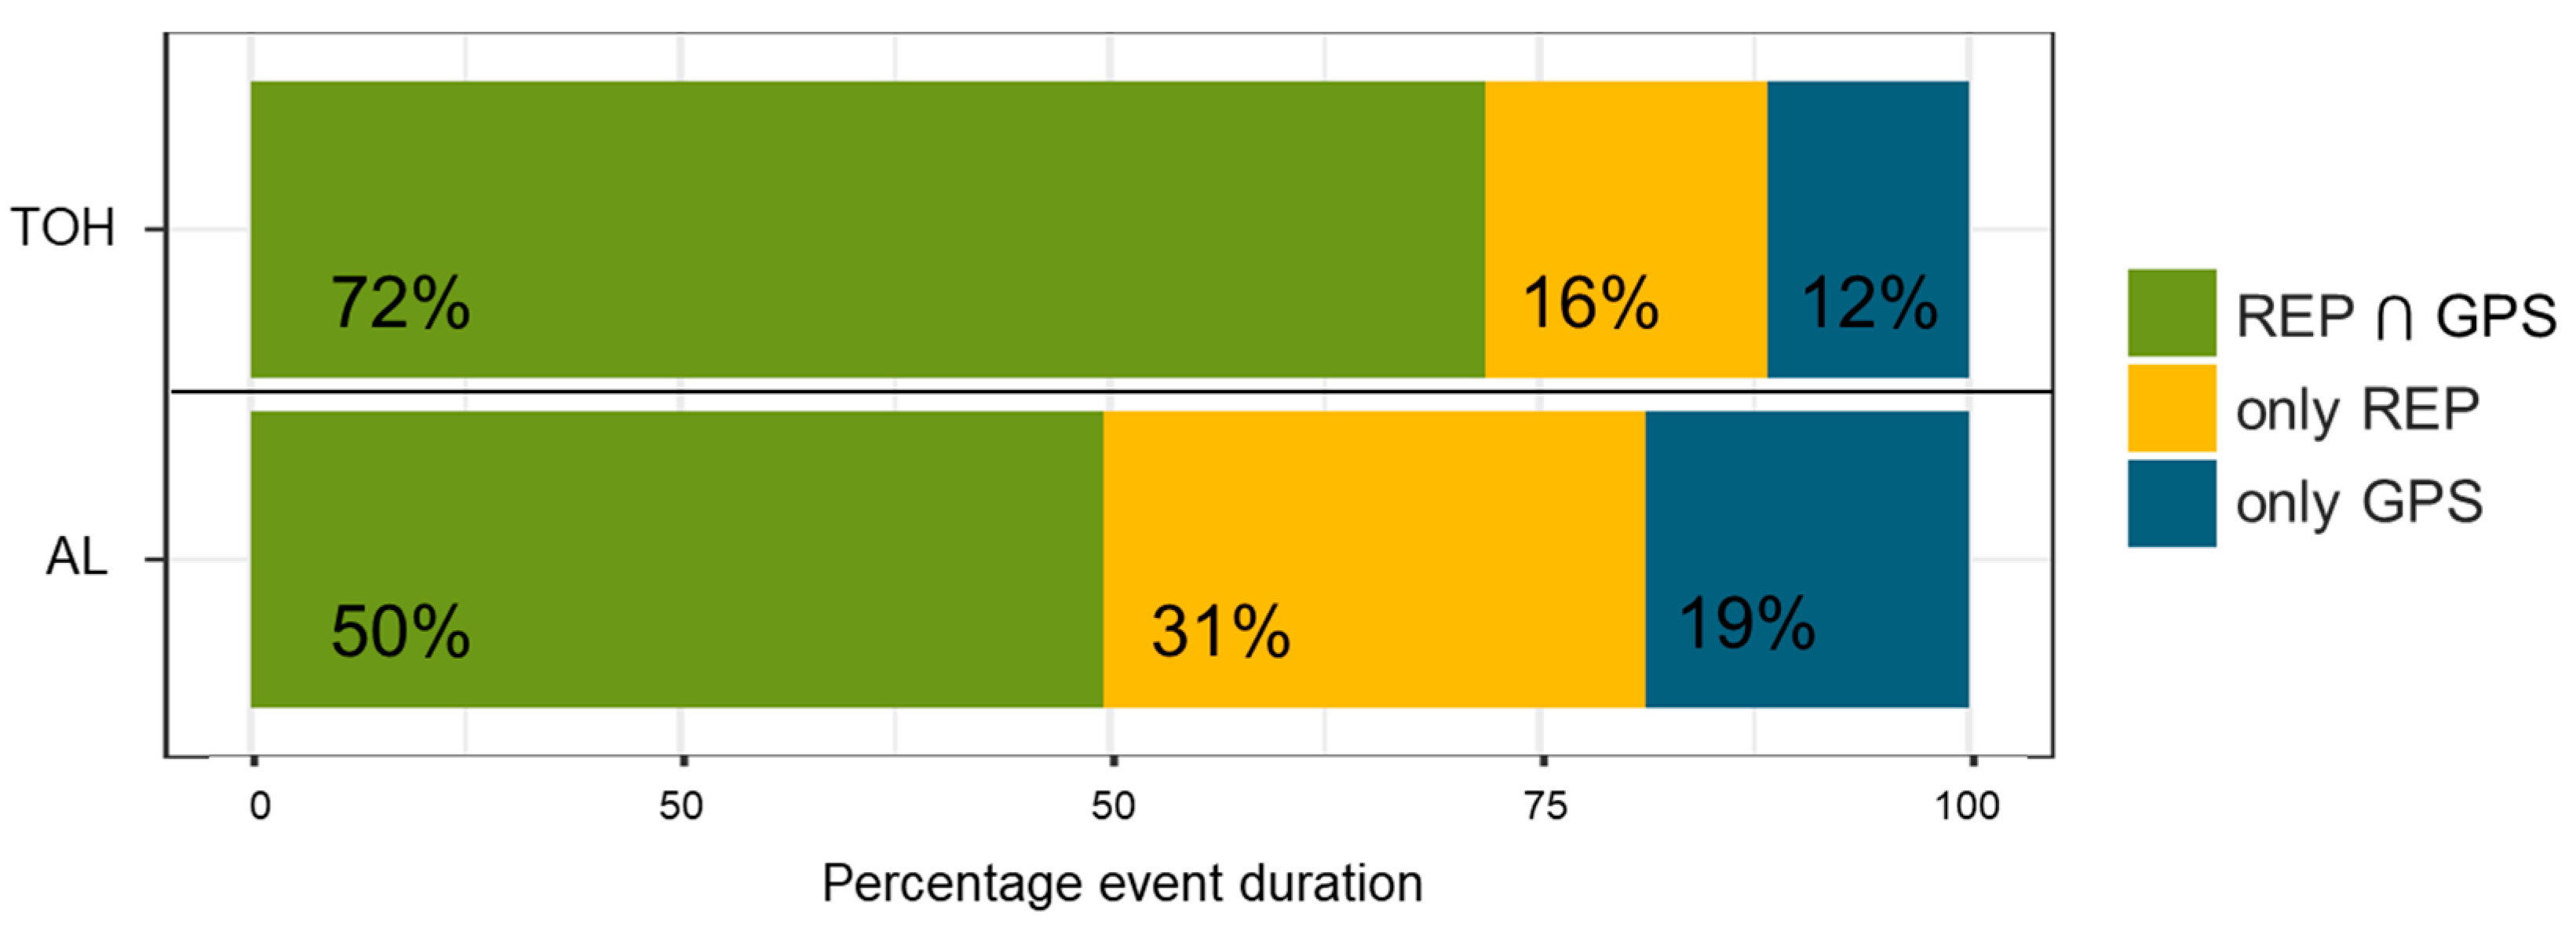
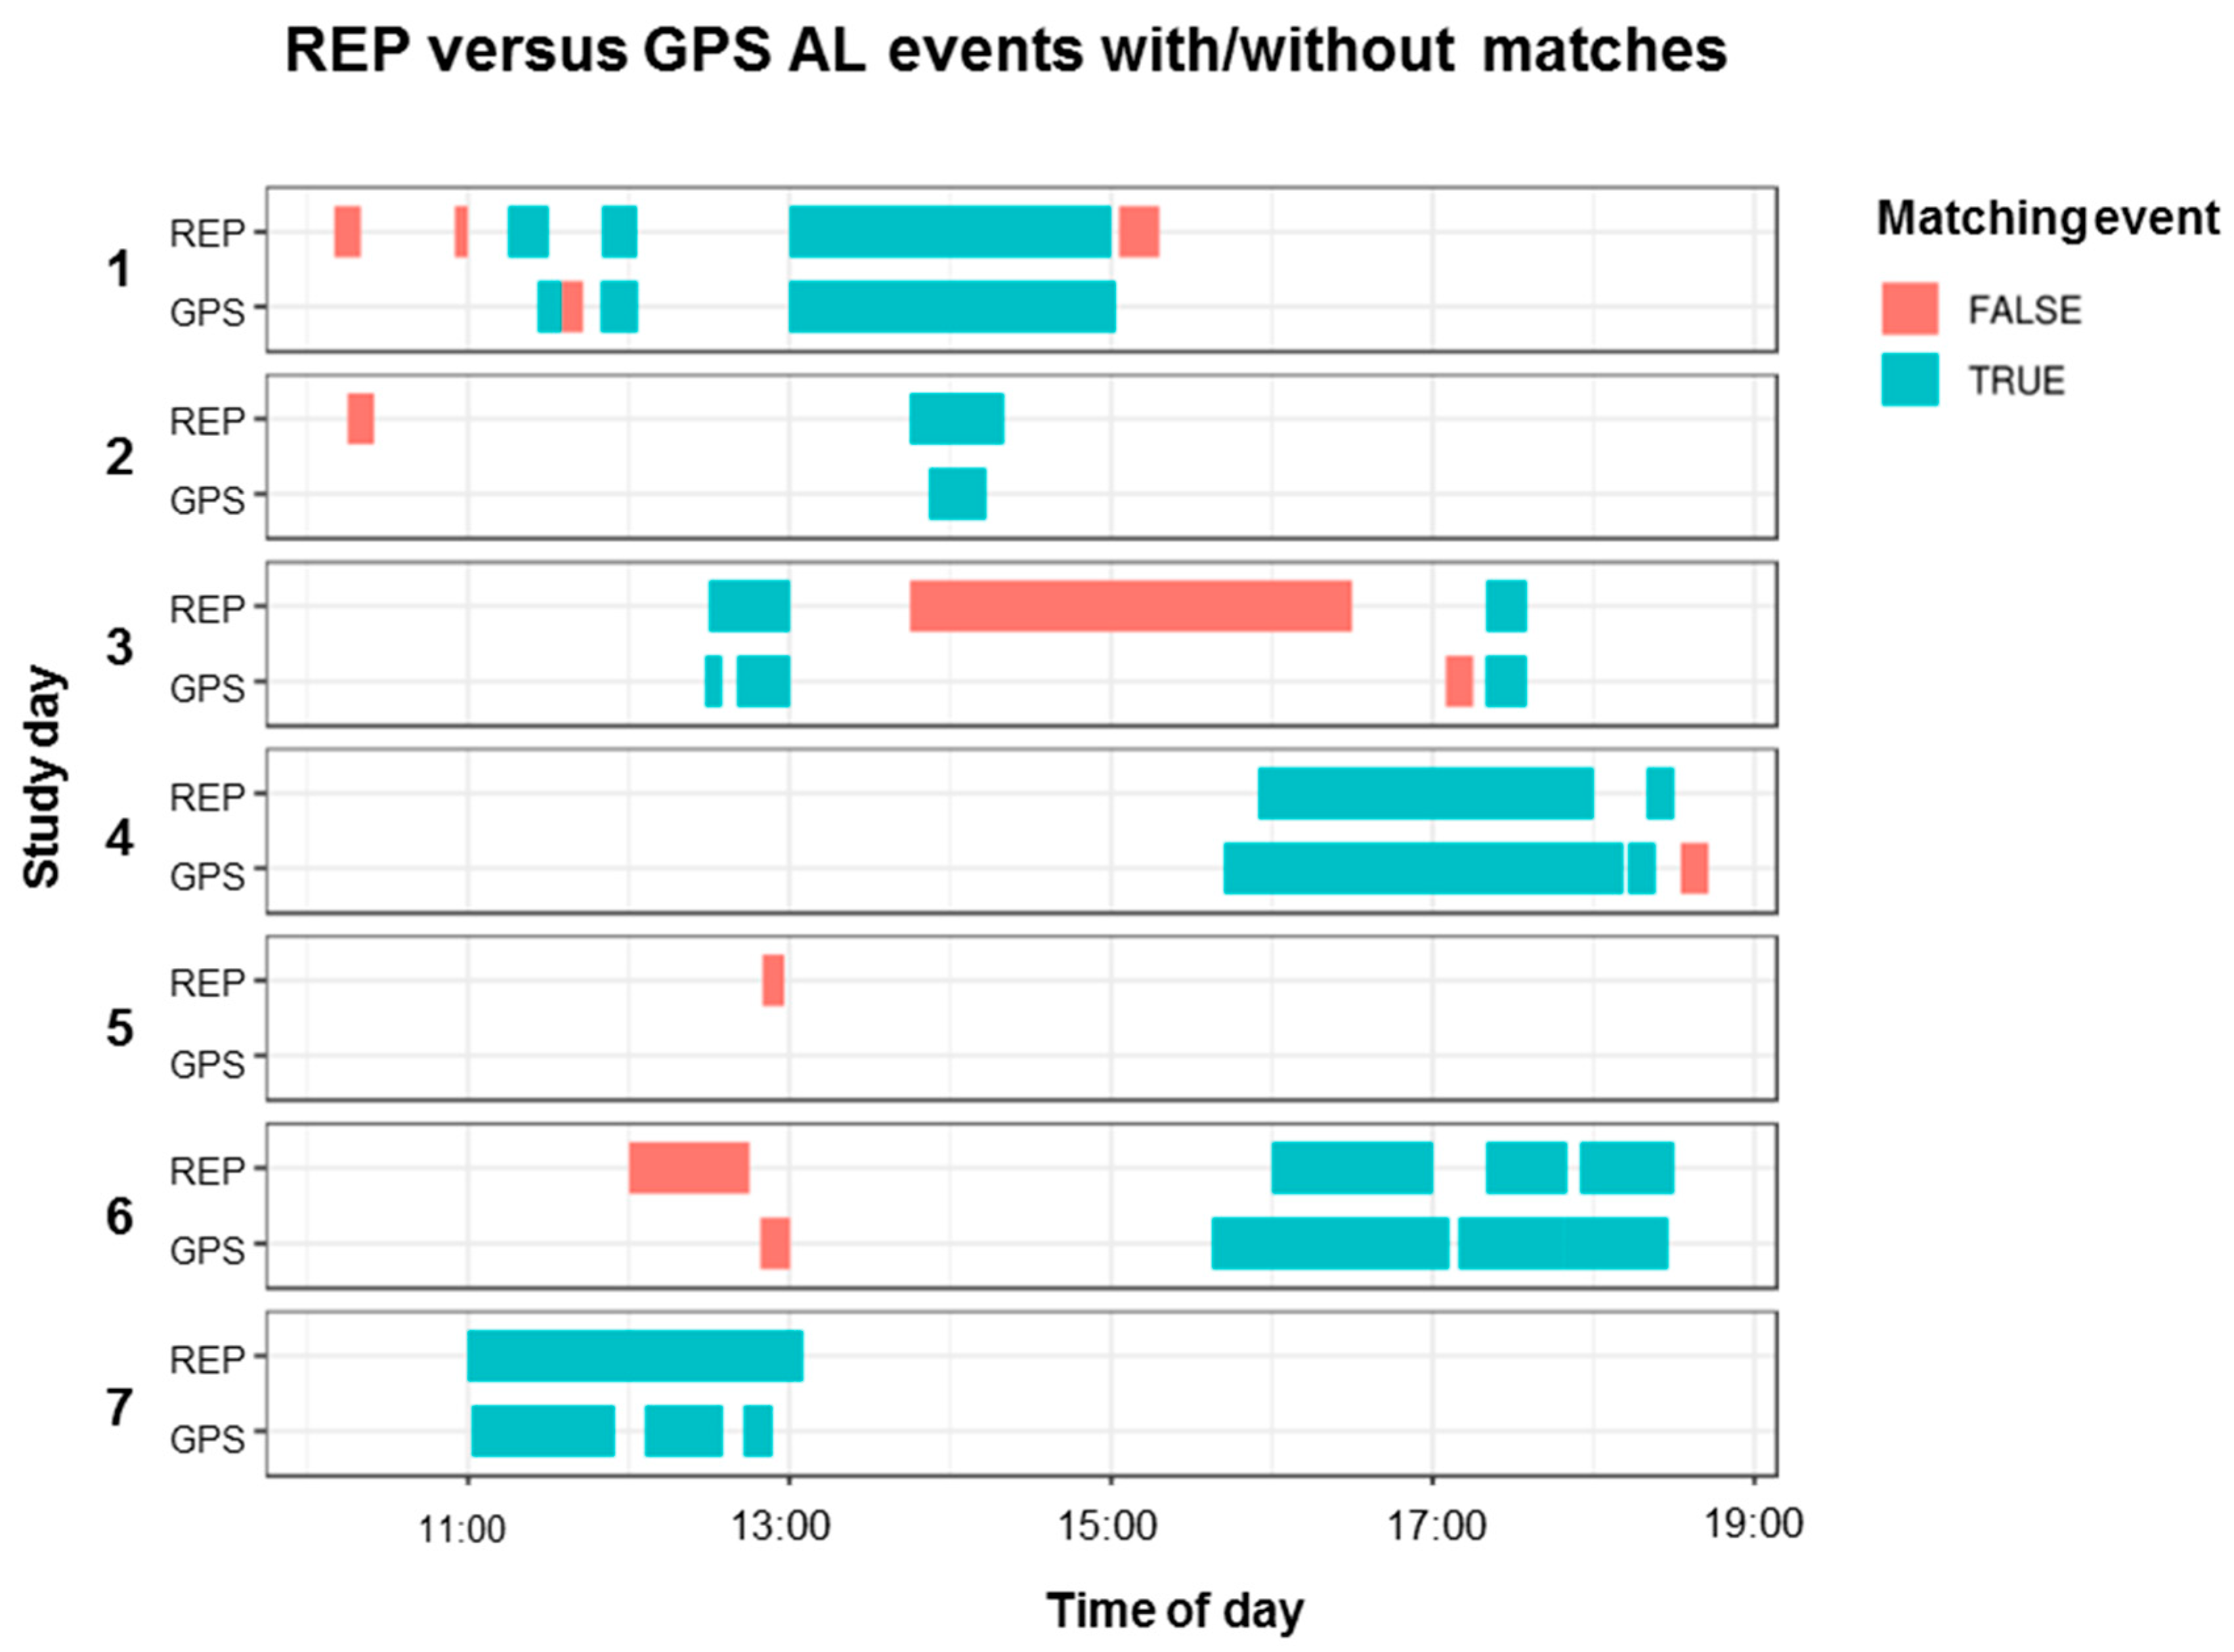
4.4. Event-Centered Agreement between REP and GPS Mobility
4.5. Association between Reported Event Characteristics and Event Detection
5. Discussion
5.1. Sensitivity Analysis: Which Thresholds Maximize Indicator Agreement?
5.2. Agreement between Self-Reported and GPS-Derived Time Out of Home
5.3. Underestimation of Daily Number of Activity Locations in Self-Reports
5.4. Similar Detection Rates for Indoor and Outdoor Activity Locations
5.5. Incomplete Self-Reported and GPS Data
5.6. Limitations and Future Directions
6. Conclusions
Author Contributions
Funding
Acknowledgments
Conflicts of Interest
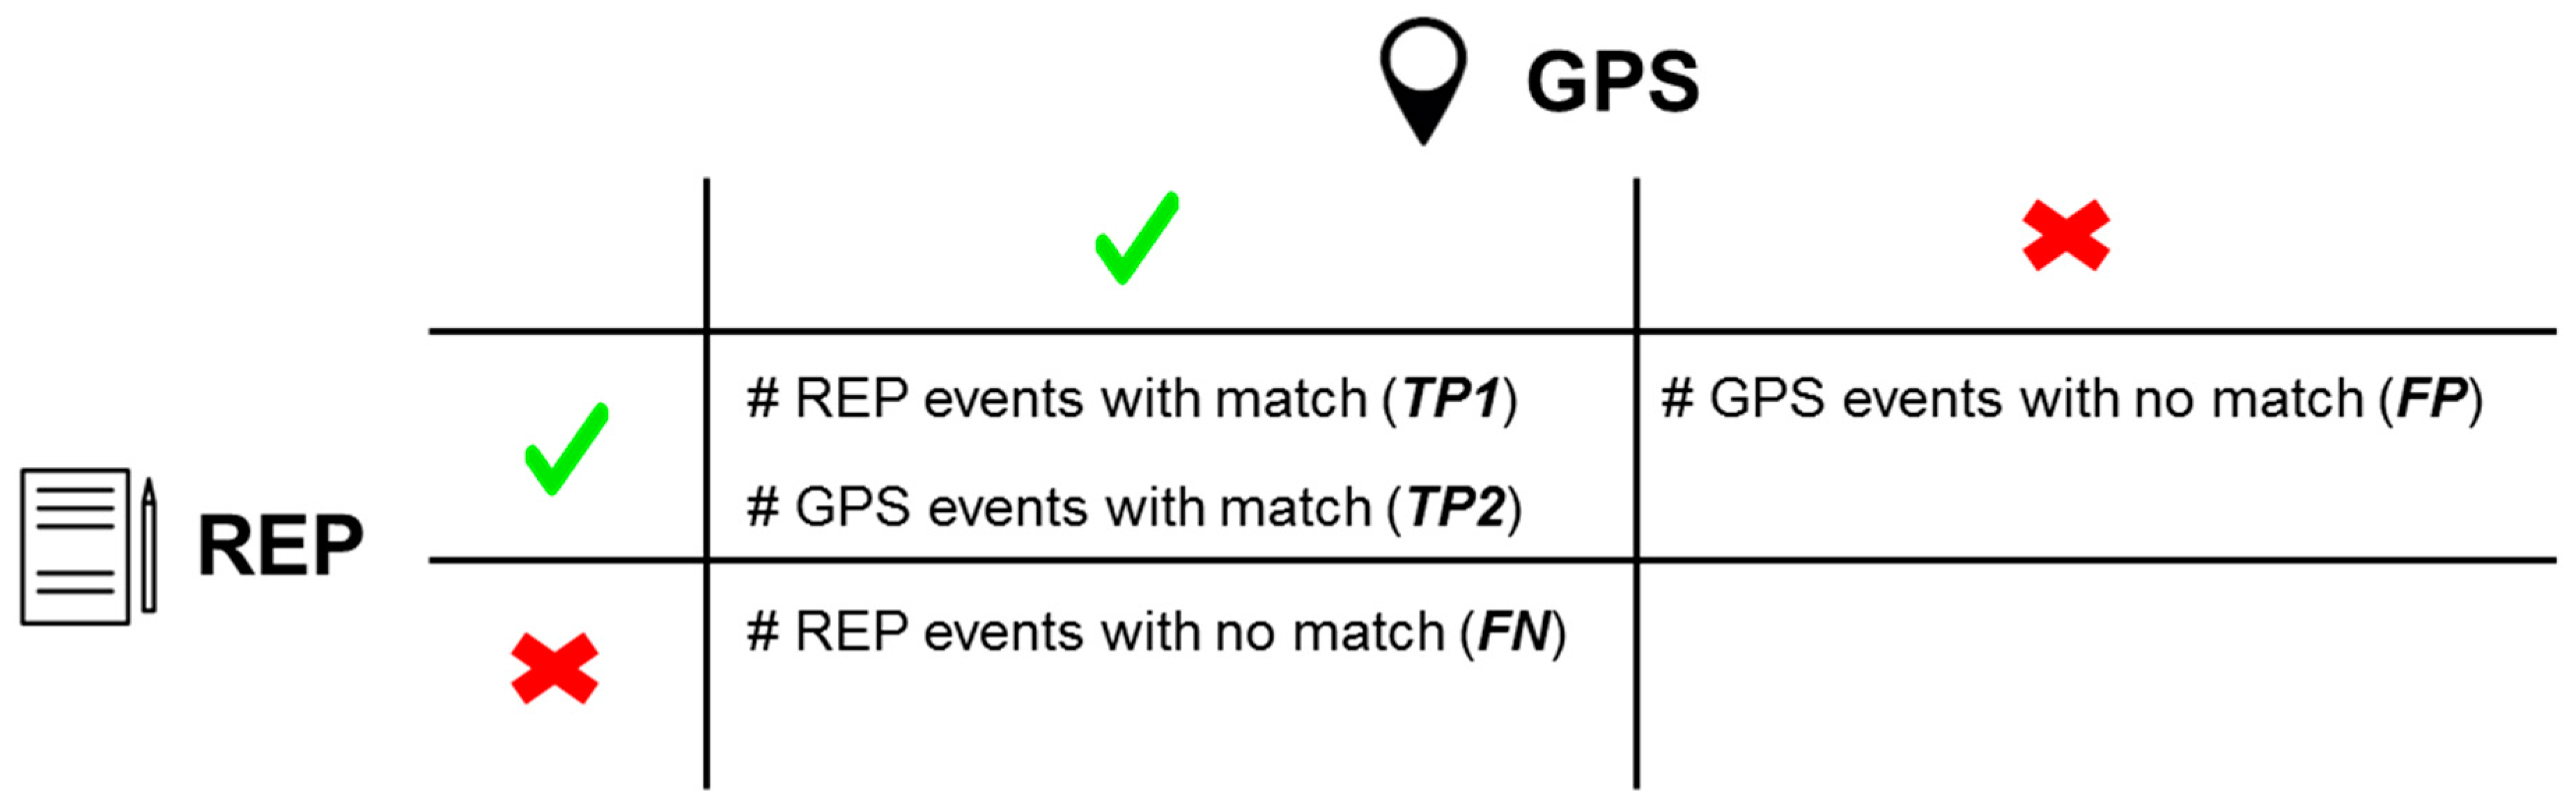
Appendix A. F1 Adapted to Data with No Ground Truth [0,1]
- Precision = (TP1)/(FP + TP1) → how many of the self-reported events were identified by GPS-based events.
- Recall = (TP2)/(TP2 + FN) → how many of the detected GPS-based events were actually self-reported.
- F1 = 2 × (Recall × Precision)/(Recall + Precision).


Appendix B. Intersection Over Union (IoU) [0,1]
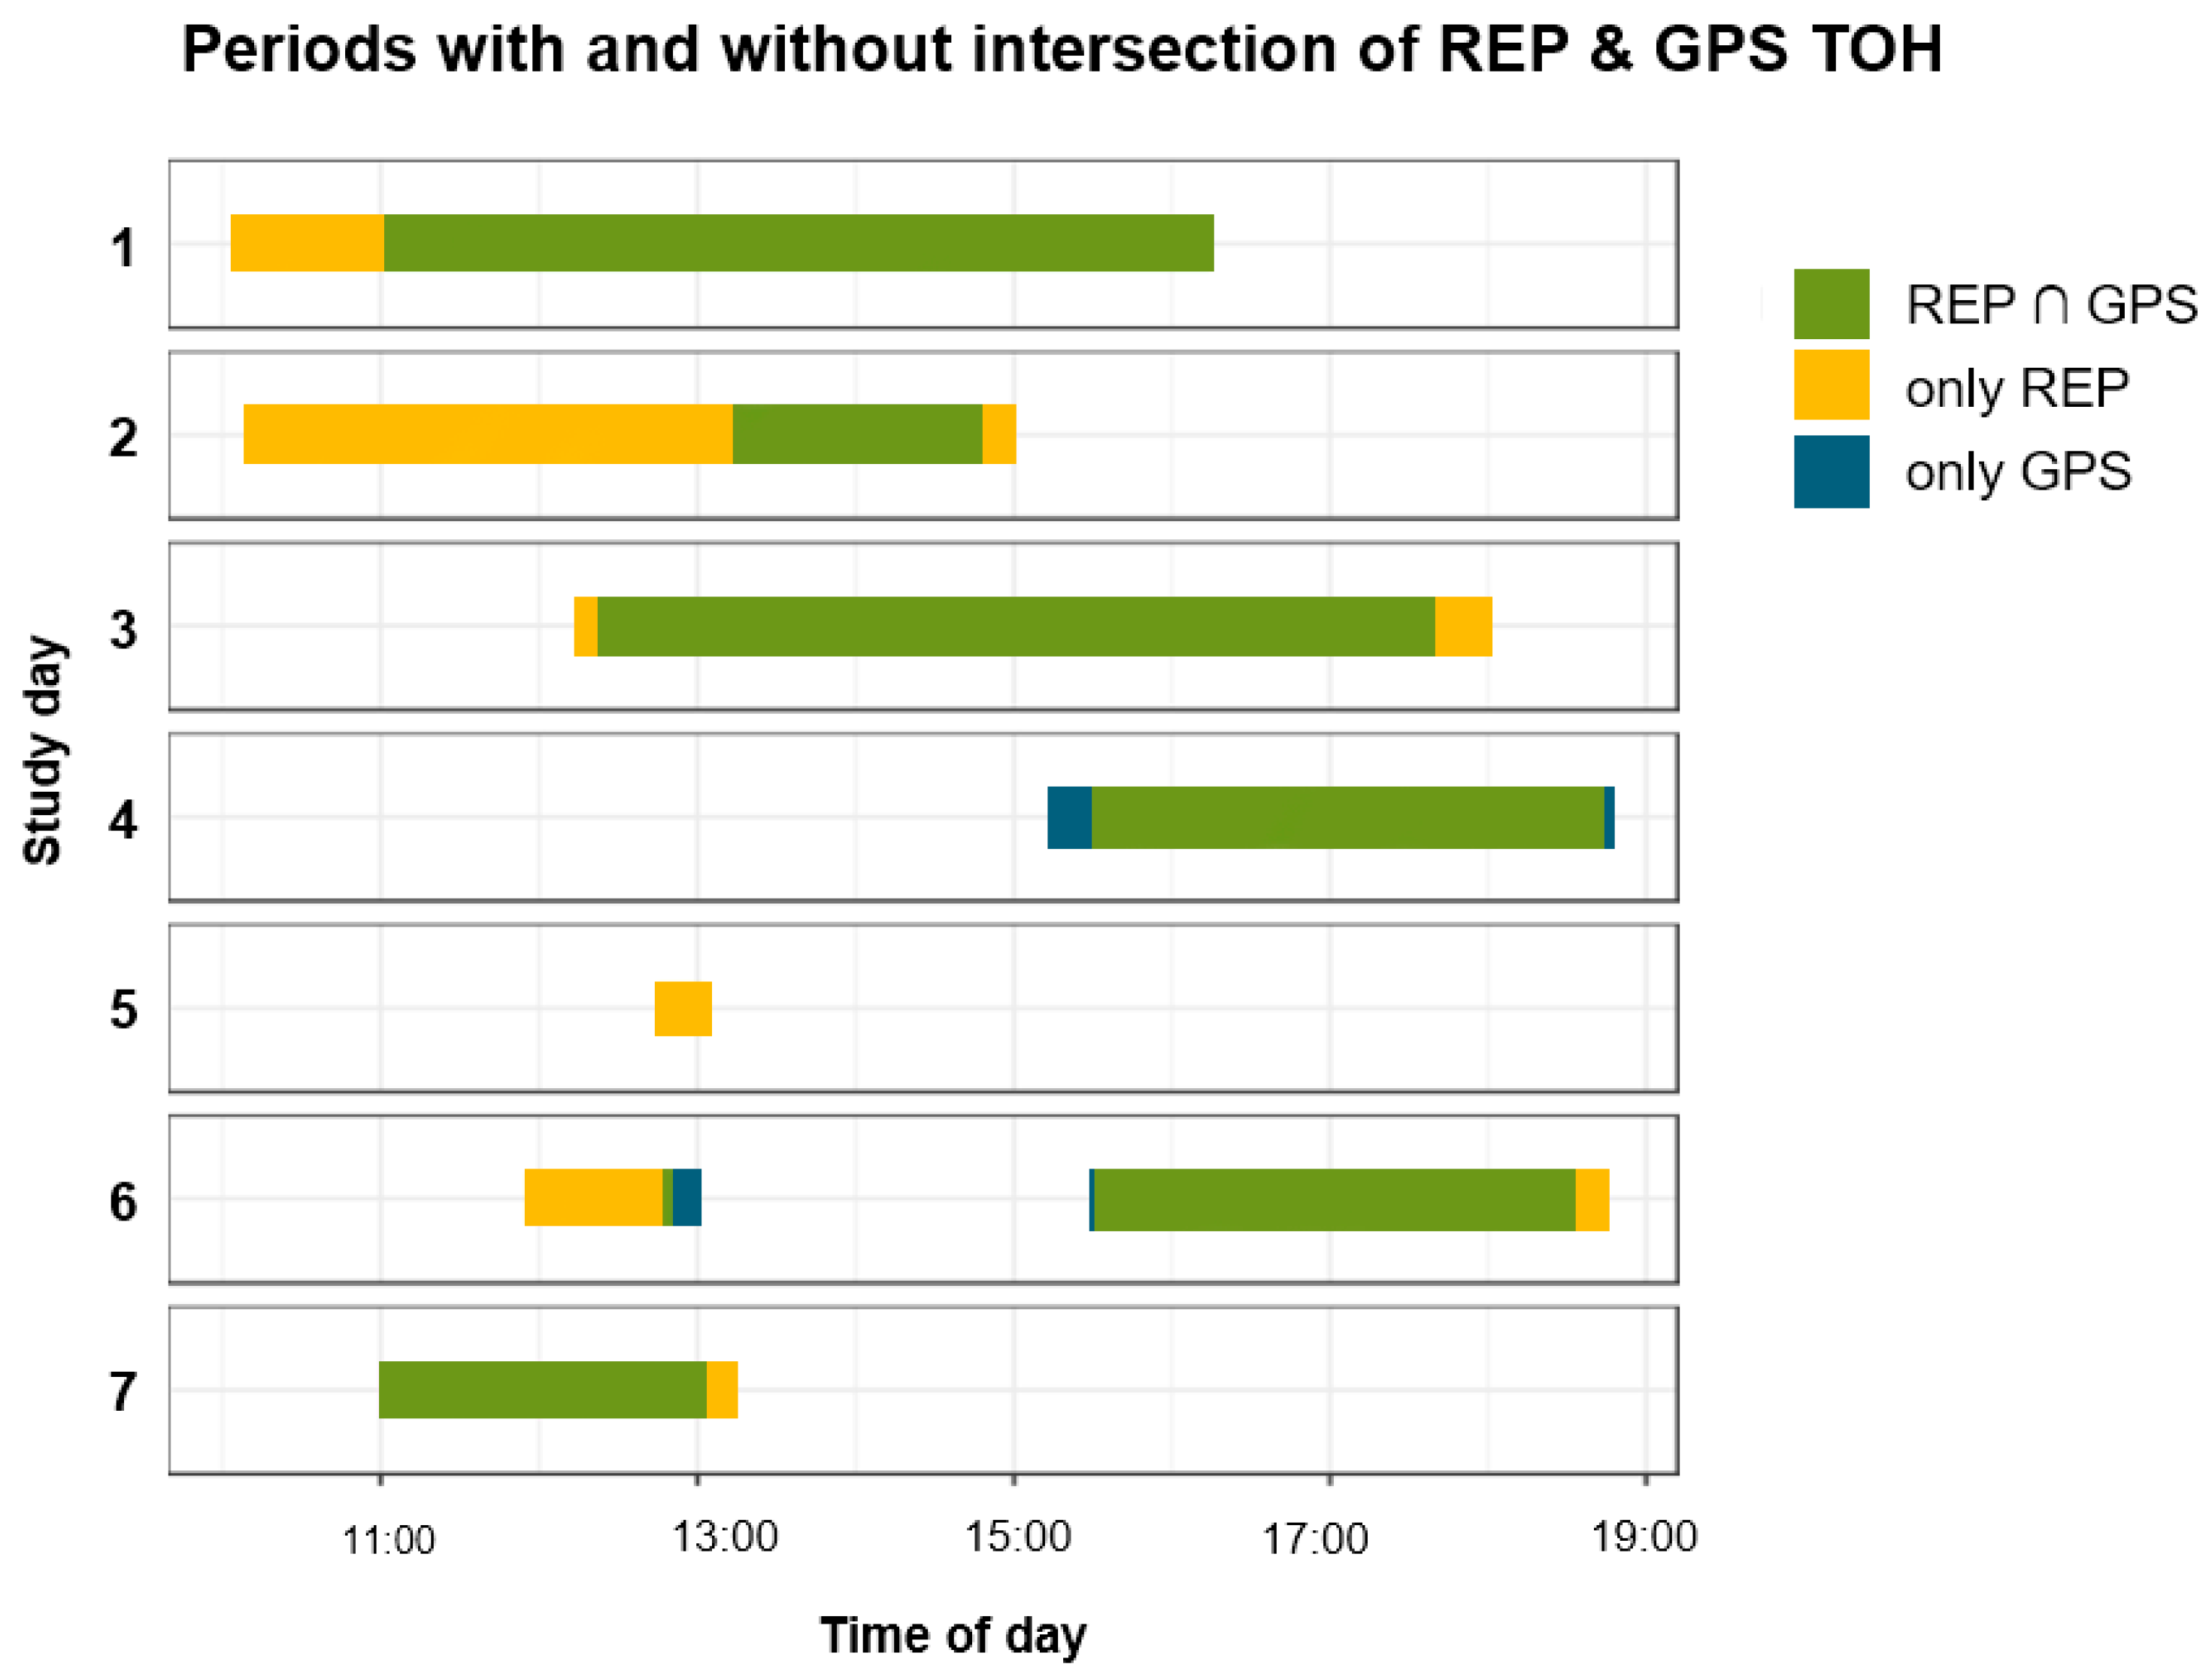
- Intersection = duration of periods with temporal overlap between REP and GPS events (green periods in Figure A3)
- Union = duration of periods in which we have REP and/or GPS events (green, yellow, blue periods in Figure A3)
- IoU = Intersection/Union

Appendix C. Measures of Agreement between Self-Reported and GPS-Based Mobility Indicators

| Measures of Agreement | Description | |
|---|---|---|
| Acronym | Full Name | |
| BA | Bland Altman difference | Bland–Altman statistic to compare methods with multiple observations per individual [72]. It plots the mean of daily self-reported (REP) and GPS-based mobility indicator against the difference between the two and computes the average difference as well as the 95% limits of agreement (LOA). |
| ICC | Interrater intraclass-correlation coefficient | We used the R package lme4 [79] to compute ICC in order to account for having multiple observations per participant. ICC divides true variance because of participants by total variance. Bootstrapping based on 1000 iterations was used to compute the 95% confidence intervals (CI) of the ICC.We used the following categories to interpret ICC values [80]:
|
| Corr | Spearman correlation | Spearman correlation across all study daysWe used the following convention to interpret the strength of association [81]:
|
| iCorr | Spearman individual correlation | Mean/SD of individual correlations [52] We used the same convention as for Spearman correlation to interpret association strength. |
Appendix D. Confirmation of Optimized Thresholds of GPS-Based Event Detection Algorithm

Appendix E. Spearman Correlation Plots

References
- WHO. World Report on Ageing and Health; World Health Organization: Geneva, Switzerland, 2015; Available online: http://www.who.int/ageing/events/world-report-2015-launch/en/ (accessed on 16 October 2019).
- Kestens, Y.; Chaix, B.; Gerber, P.; Desprès, M.; Gauvin, L.; Klein, O.; Klein, S.; Köppen, B.; Lord, S.; Naud, A.; et al. Understanding the role of contrasting urban contexts in healthy aging: An international cohort study using wearable sensor devices (the CURHA study protocol). BMC Geriatr. 2016, 16, 1–12. [Google Scholar]
- Webber, S.C.; Porter, M.M.; Menec, V.H. Mobility in older adults: A comprehensive framework. Gerontologist 2010, 50, 443–450. [Google Scholar] [CrossRef] [PubMed]
- Fillekes, M.P.; Perchoux, C.; Weibel, R.; Allemand, M. Exploring the role of personality and mobility for healthy aging. In Personality and Healthy Aging in Adulthood—New Directions and Techniques; Hill, P.L., Allemand, M., Eds.; Springer International Publishing: Cham, Switzerland, 2019; in press. [Google Scholar]
- Brondeel, R.; Wasfi, R.; Perchoux, C.; Chaix, B.; Gerber, P.; Gauvin, L.; Richard, L.; Gaudreau, P.; Thierry, B.; Chevrier, M.; et al. Is older adults’ physical activity during transport compensated during other activities? Comparing 4 study cohorts using GPS and accelerometer data. J. Transp. Health 2019, 12, 229–236. [Google Scholar] [CrossRef]
- Aird, R.L.; Buys, L. Active aging: Exploration into self-ratings of “being active,” out-of-home physical activity, and participation among older Australian adults living in four different settings. J. Aging Res. 2015, 2015, 1–12. [Google Scholar] [CrossRef]
- Mollenkopf, H.; Marcellini, F.; Ruoppila, I.; Széman, Z.; Tacken, M.; Wahl, H.-W. Social and behavioural science perspectives on out-of-home mobility in later life: Findings from the European project MOBILATE. Eur. J. Ageing 2004, 1, 45–53. [Google Scholar] [CrossRef]
- Rantanen, T. Promoting mobility in older people. J. Prev. Med. Public Health 2013, 46, 50–54. [Google Scholar] [CrossRef]
- Fillekes, M.P.; Giannouli, E.; Kim, E.-K.; Zijlstra, W.; Giannouli, E.; Weibel, R. Towards a comprehensive set of GPS-based indicators reflecting the multidimensional nature of daily mobility for applications in health and aging research. Int. J. Health Geogr. 2019, 18, 17. [Google Scholar] [CrossRef]
- Wettstein, M.; Wahl, H.W.; Shoval, N.; Auslander, G.; Oswald, F.; Heinik, J. Identifying mobility types in cognitively heterogeneous older adults based on GPS-tracking: What discriminates best? J. Appl. Gerontol. 2015, 34, 1001–1027. [Google Scholar] [CrossRef]
- Harada, K.; Lee, S.; Lee, S.; Bae, S.; Harada, K.; Suzuki, T.; Shimada, H. Objectively-measured outdoor time and physical and psychological function among older adults. Geriatr. Gerontol. Int. 2017, 17, 1455–1462. [Google Scholar] [CrossRef]
- Isaacson, M.; Wahl, H.; Shoval, N.; Oswald, F.; Auslander, G. The relationship between spatial activity and wellbeing-related data among healthy older adults: An exploratory geographic and psychological analysis. In Cross-Cultural and Cross-Disciplinary Perspectives in Social Gerontology; Samanta, T., Ed.; Springer: Singapore, 2017; pp. 203–219. [Google Scholar]
- Petersen, J.; Austin, D.; Mattek, N.; Kaye, J. Time out-of-home and cognitive, physical, and emotional wellbeing of older adults: A longitudinal mixed effects model. PLoS ONE 2015, 10, e0139643. [Google Scholar] [CrossRef]
- Rapp, K.; Mikolaizak, S.; Rothenbacher, D.; Denkinger, M.D.; Klenk, J. Prospective analysis of time out-of-home and objectively measured walking duration during a week in a large cohort of older adults. Eur. Rev. Aging Phys. Act. 2018, 15, 8. [Google Scholar] [CrossRef] [PubMed]
- Wahl, H.-W.; Wettstein, M.; Shoval, N.; Oswald, F.; Kaspar, R.; Issacson, M.; Voss, E.; Auslander, G.; Heinik, J. Interplay of cognitive and motivational resources for out-of-home behavior in a sample of cognitively heterogeneous older adults: Findings of the SenTra project. J. Gerontol. Ser. B Psychol. Sci. Soc. Sci. 2013, 68, 691–702. [Google Scholar] [CrossRef] [PubMed]
- Wolf, P.S.A.; Figueredo, A.J.; Jacobs, W.J. Global positioning system technology (GPS) for psychological research: A test of convergent and nomological validity. Front. Psychol. 2013, 4, 315. [Google Scholar] [CrossRef] [PubMed]
- Cich, G.; Knapen, L.; Bellemans, T.; Janssens, D.; Wets, G. Threshold settings for TRIP/STOP detection in GPS traces. J. Ambient Intell Humaniz Comput. 2016, 7, 395–413. [Google Scholar] [CrossRef]
- Shareck, M.; Kestens, Y.; Gauvin, L. Examining the spatial congruence between data obtained with a novel activity location questionnaire, continuous GPS tracking, and prompted recall surveys. Int. J. Health Geogr. 2013, 12, 40. [Google Scholar] [CrossRef]
- Kestens, Y.; Thierry, B.; Shareck, M.; Steinmetz-Wood, M.; Chaix, B. Integrating activity spaces in health research: Comparing the VERITAS activity space questionnaire with 7-day GPS tracking and prompted recall. Spat. Spatiotemporal. Epidemiol. 2018, 25, 1–9. [Google Scholar] [CrossRef]
- Boissy, P.; Blamoutier, M.; Brière, S.; Duval, C. Quantification of free-living community mobility in healthy older adults using wearable sensors. Front. Public Health 2018, 6, 216. [Google Scholar] [CrossRef]
- Panter, J.; Costa, S.; Dalton, A.; Jones, A.; Ogilvie, D. Development of methods to objectively identify time spent using active and motorised modes of travel to work: How do self-reported measures compare? Int. J. Behav. Nutr. Phys. Act. 2014, 11, 116. [Google Scholar] [CrossRef]
- Kaspar, R.; Oswald, F.; Wahl, H.-W.; Voss, E.; Wettstein, M. Daily mood and out-of-home mobility in older adults: Does cognitive impairment matter? J. Appl. Gerontol. 2015, 34, 26–47. [Google Scholar] [CrossRef]
- Schmidt, T.; Kerr, J.; Kestens, Y.; Schipperijn, J. Challenges in using wearable GPS devices in low-income older adults: Can map-based interviews help with assessments of mobility? Transl. Behav. Med. 2018, 9, 99–109. [Google Scholar] [CrossRef]
- Peel, C.; Sawyer Baker, P.; Roth, D.L.; Brown, C.J.; Brodner, E.V.; Allman, R.M. Assessing mobility in older adults: The UAB study of aging life-space assessment. Phys. Ther. 2005, 85, 1008–1119. [Google Scholar] [PubMed]
- Chaix, B.; Kestens, Y.; Perchoux, C.; Karusisi, N.; Merlo, J.; Labadi, K. An interactive mapping tool to assess individual mobility patterns in neighborhood studies. Am. J. Prev. Med. 2012, 43, 440–450. [Google Scholar] [CrossRef] [PubMed]
- Trull, T.J.; Ebner-Priemer, U. Ambulatory assessment. Ann. Rev. Clin. Psychol. 2013, 9, 151–176. [Google Scholar] [CrossRef] [PubMed]
- Törnros, T.; Dorn, H.; Reichert, M.; Ebner-Priemer, U.; Salize, H.J.; Tost, H.; Meyer-Lindenberg, A.; Zipf, A. A comparison of temporal and location-based sampling strategies for global positioning system-triggered electronic diaries. Geospat. Health 2016, 11, 335–341. [Google Scholar] [CrossRef] [PubMed]
- Harvey, A.S. Time-Space diaries: Merging traditions. In Transport Survey Quality and Innovation; Jones, P., Stopher, P., Eds.; Emerald Group Publishing Limited: Bingley, UK, 2003; pp. 151–180. ISBN 978-0-08-044096-5. [Google Scholar]
- Shih, D.-H.; Shih, M.-H.; Yen, D.C.; Hsu, J.-H. Personal mobility pattern mining and anomaly detection in the GPS era. Cartogr. Geogr. Inf. Sci. 2015, 406, 55–67. [Google Scholar] [CrossRef]
- Brög, W.; Erl, E.; Meyburg, A.H.; Weymuth, M.J. Problems of non-reported trips in survey of nonhome activity patterns. In Transportation Research Record; TRB, National Research Council: Washington, DC, USA, 1982; pp. 1–5. [Google Scholar]
- Wolf, J.; Oliveira, M.; Thompson, M. Impact of underreporting on mileage and travel time estimates: Results from Global Positioning System-enhanced household travel survey. Transp. Res. Rec. J. Transp. Res. Board. 2003, 1854, 189–198. [Google Scholar] [CrossRef]
- Neven, A.; Schutter IDe Wets, G.; Feys, P.; Janssens, D. Data quality of travel behavior studies: Factors influencing the reporting rate of self-reported and GPS-recorded trips in persons with disabilities. Transp. Res. Rec. J. Transp. Res. Board 2018, 22, 036119811877295. [Google Scholar] [CrossRef]
- Blamoutier, M.; Boissy, P.; Brière, S.; Faucher, G.; Lauzé, M.; Duval, C. Is a decrease of grip strength associated with community mobility restriction in dynapenic older women? JCSM Clin. Rep. 2018, 3, 1–9. [Google Scholar] [CrossRef]
- Giannouli, E.; Bock, O.; Zijlstra, W. Cognitive functioning is more closely related to real-life mobility than to laboratory-based mobility parameters. Eur. J. Ageing 2018, 15, 57–65. [Google Scholar] [CrossRef]
- Shareck, M.; Frohlich, K.L.; Kestens, Y. Considering daily mobility for a more comprehensive understanding of contextual effects on social inequalities in health: A conceptual proposal. Health Place 2014, 29, 154–160. [Google Scholar] [CrossRef]
- Taylor, J.K.; Buchan, I.E.; van der Veer, S.N. Assessing life-space mobility for a more holistic view on wellbeing in geriatric research and clinical practice. Aging Clin. Exp. Res. 2018, 31, 439–445. [Google Scholar] [CrossRef] [PubMed]
- Thierry, B.; Chaix, B.; Kestens, Y. Detecting activity locations from raw GPS data: A novel kernel-based algorithm. Int. J. Health Geogr. 2013, 12, 14. [Google Scholar] [CrossRef] [PubMed]
- Montoliu, R.; Blom, J.; Gatica-Perez, D. Discovering places of interest in everyday life from smartphone data. Multimed. Tools Appl. 2013, 62, 179–207. [Google Scholar] [CrossRef]
- Ashbrook, D.; Starner, T. Using GPS to learn significant locations and predict movement across multiple users. Pers. Ubiquitous Comput. 2003, 7, 275–286. [Google Scholar] [CrossRef]
- Hariharan, R.; Toyama, K. Project Lachesis: Parsing and modeling location histories. In GIScience; Egenhofer, M.J., Freska, C., Miller, H.J., Eds.; LNCS3234; 2004; pp. 106–124. Available online: http://link.springer.com/10.1007/978-3-540-30231-5_8 (accessed on 17 October 2019).
- Difrancesco, S.; Fraccaro, P.; van der Veer, S.N.; Alshoumr, B.; Ainsworth, J.; Bellazzi, R.; Peek, N. Out-of-home activity recognition from GPS data in schizophrenic patients. In Proceedings of the 2016 IEEE 29th International Symposium on Computer-Based Medical Systems (CBMS), Dublin, Ireland, 20–24 June 2016; pp. 324–328. [Google Scholar]
- Zheng, Y.; Zhang, L.; Xie, X.; Ma, W. Mining interesting locations and travel sequences from GPS trajectories. In Proceedings of the 18th International Conference on World Wide Web, Madrid, Spain, 20–24 April 2009; pp. 791–800. [Google Scholar]
- Hwang, S.; Evans, C.; Hanke, T. Detecting stop episodes from GPS trajectories with gaps. In Seeing Cities Through Big Data; Thakuriah, P., Ed.; Springer: Cham, Switzerland, 2017; pp. 427–439. [Google Scholar]
- Do, T.M.T.; Gatica-Perez, D. The places of our lives: Visiting patterns and automatic labeling from longitudinal smartphone data. IEEE Trans. Mob. Comput. 2014, 13, 638–648. [Google Scholar] [CrossRef]
- Vhaduri, S.; Poellabauer, C.; Striegel, A.; Lizardo, O.; Hachen, D. Discovering places of interest using sensor data from smartphones and wearables. In Proceedings of the 2017 IEEE SmartWorld, Ubiquitous Intelligence & Computing, Advanced & Trusted Computed, Scalable Computing & Communications, Cloud & Big Data Computing, Internet of People and Smart City Innovation (SmartWorld/SCALCOM/UIC/ATC/CBDCom/IOP/SCI), San Francisco, CA, USA, 4–8 August 2017; IEEE: Piscataway, NJ, USA, 2017; pp. 1–8. [Google Scholar]
- Boonstra, T.W.; Nicholas, J.; Wong, Q.J.; Shaw, F.; Townsend, S.; Christensen, H. Using mobile phone sensor technology for mental health research: Integrated analysis to identify hidden challenges and potential solutions. J. Med. Internet Res. 2018, 20, e10131. [Google Scholar] [CrossRef]
- Tung, J.Y.; Rose, R.V.; Gammada, E.; Lam, I.; Roy, E.A.; Black, S.E.; Poupart, P. Measuring life space in older adults with mild-to-moderate Alzheimer’s disease using mobile phone GPS. Gerontology 2014, 60, 154–162. [Google Scholar] [CrossRef]
- Liddle, J.; Ireland, D.; McBride, S.J.; Brauer, S.G.; Hall, L.M.; Ding, H.; Karunanithi, M.; Hodges, P.W.; Theodoros, D.; Silburn, P.A.; et al. Measuring the lifespace of people with Parkinson’s disease using smartphones: Proof of principle. JMIR mHealth uHealth 2014, 2, e13. [Google Scholar] [CrossRef]
- Campbell, D.T.; Fiske, D.W. Convergent and discriminant validation by the multitrait-multimethod matrix. Psychol. Bull. 1959, 56, 81–105. [Google Scholar] [CrossRef]
- Cronbach, L.J.; Meehl, P.E. Construct validity in psychological tests. Psychol. Bull. 1955, 52, 281–302. [Google Scholar] [CrossRef]
- Kelly, P.; Krenn, P.; Titze, S.; Stopher, P.; Foster, C. Quantifying the difference between self-reported and Global Positioning Systems-measured journey durations: A systematic review. Transp. Rev. A Transnatl. Transdiscipl. J. 2013, 33, 443–459. [Google Scholar] [CrossRef]
- Fillekes, M.P.; Röcke, C.; Katana, M.; Weibel, R. Self-reported versus GPS-derived indicators of daily mobility in a sample of healthy older adults. Soc. Sci. Med. 2019, 220, 193–202. [Google Scholar] [CrossRef] [PubMed]
- Klous, G.; Smit, L.A.M.; Borlée, F.; Coutinho, R.A.; Kretzschmar, M.E.E.; Heederik, D.J.J.; Huss, A. Mobility assessment of a rural population in the Netherlands using GPS measurements. Int. J. Health Geogr. 2017, 16, 30. [Google Scholar] [CrossRef] [PubMed]
- Folstein, M.; Folstein, S.; McHugh, P. “Mini-mental state”: A practical method for grading the cognitive state of patients for the clinician. J. Psychiatr. Res. 1975, 12, 189–198. [Google Scholar] [CrossRef]
- Creavin, S.T.; Wisniewski, S.; Noel-Storr, A.H.; Trevelyan, C.M.; Hampton, T.; Rayment, D.; Thom, V.M.; Nash, K.J.E.; Elhamoui, H.; Milligan, R.; et al. Mini-Mental State Examination (MMSE) for the detection of dementia in clinically unevaluated people aged 65 and over in communtiy and primary care populations. Cochrane Database Syst. Rev. 2016, 1, 1–182. [Google Scholar]
- Mendhak. GPSLogger for Android. GitHub Repository. 2019. Available online: https://github.com/mendhak/gpslogger/ (accessed on 17 October 2019).
- Demant Klinker, C.; Schipperijn, J.; Toftager, M.; Kerr, J.; Troelsen, J. When cities move children: Development of a new methodology to assess context-specific physical activity behaviour among children and adolescents using accelerometers and GPS. Health Place 2015, 31, 90–99. [Google Scholar] [CrossRef]
- Vanwolleghem, G.; Schipperijn, J.; Gheysen, F.; Cardon, G.; De Bourdeaudhuij, I.; Van Dyck, D. Children’s GPS-determined versus self-reported transport in leisure time and associations with parental perceptions of the neighborhood environment. Int. J. Health Geogr. 2016, 15, 16. [Google Scholar] [CrossRef]
- Carlson, J.A.; Jankowska, M.M.; Meseck, K.; Godbole, S.; Natarajan, L.; Raab, F.; Demchak, B.; Patrick, K.; Kerr, J. Validity of PALMS GPS scoring of active and passive travel compared with SenseCam. Med. Sci. Sport Exerc. 2015, 47, 662–667. [Google Scholar] [CrossRef]
- Hahsler, M.; Piekenbrock, M.; Arya, S.; Mount, D. dbscan: Density Based Clustering of Applications with Noise (DBSCAN) and Related Algorithms. 2019. Available online: https://cran.r-project.org/web/packages/dbscan/ (accessed on 17 October 2019).
- Ester, M.; Kriegel, H.-P.; Sander, J.; Xu, X. A density-based algorithm for discovering clusters in large spatial databases with noise. KDD 1996, 96, 34. [Google Scholar]
- Sanchez, M.; Ambros, A.; Salmon, M.; Bhogadi, S.; Wilson, R.T.; Kinra, S.; Marshall, J.; Tonne, C. Predictors of daily mobility of adults in peri-urban south India. Int. J. Environ. Res. Public Health 2017, 14, 783. [Google Scholar] [CrossRef]
- Donaire-Gonzalez, D.; Valentín, A.; de Nazelle, A.; Ambros, A.; Carrasco-Turigas, G.; Seto, E.; Jerrett, M.; Nieuwenhuijsen, M.J. Benefits of mobile phone technology for personal environmental monitoring. JMIR mHealth uHealth 2016, 4, e126. [Google Scholar] [CrossRef] [PubMed]
- Carlson, J.A.; Saelens, B.E.; Kerr, J.; Schipperijn, J.; Conway, T.L.; Frank, L.D.; Chapman, J.E.; Glanz, K.; Cain, K.L.; Sallis, J.F. Association between neighborhood walkability and GPS-measured walking, bicycling and vehicle time in adolescents. Health Place 2015, 32, 1–7. [Google Scholar] [CrossRef] [PubMed]
- Toader, B.; Sprumont, F.; Faye, S.; Popescu, M.; Viti, F. Usage of smartphone data to derive an indicator for collaborative mobility between individuals. ISPRS Int. J. GeoInf. 2017, 6, 62. [Google Scholar] [CrossRef]
- Hwang, S.; VanDeMark, C.; Dhatt, N.; Yalla, S.V.; Crews, R.T. Segmenting human trajectory data by movement states while addressing signal loss and signal noise. Int. J. Geogr. Inf. Sci. 2018, 32, 1391–1412. [Google Scholar] [CrossRef]
- Xiang, L.; Gao, M.; Wu, T. Extracting stops from noisy trajectories: A sequence oriented clustering approach. ISPRS Int. J. GeoInf. 2016, 5, 29. [Google Scholar] [CrossRef]
- Hwang, S.; Hanke, T.; Evans, C. Automated Extraction of Community Mobility Measures from GPS Stream Data Using Temporal DBSCAN. In Computational Science and Its Applications--ICCSA 2013: 13th International Conference, ICCSA 2013, Ho Chi Minh City, Vietnam, June 24-27, 2013, Proceedings, Part II; Murgante, B., Misra, S., Carlini, M., Torre, C.M., Nguyen, H.-Q., Taniar, D., Apduhan, B.O., Gervasi, O., Eds.; Springer: Berlin/Heidelberg, Germany, 2013; Volume 7972, pp. 86–98. [Google Scholar]
- Zhao, F.; Ghorpade, A.; Pereira, F.C.; Zegras, C.; Ben-Akiva, M. Stop detection in smartphone-based travel surveys. Transp. Res. Procedia 2015, 11, 218–226. [Google Scholar] [CrossRef]
- Bohte, W.; Maat, K. Deriving and validating trip purposes and travel modes for multi-day GPS-based travel surveys: A large-scale application in the Netherlands. Transp. Res. Part C Emerg. Technol. 2009, 17, 285–297. [Google Scholar] [CrossRef]
- Harada, K.; Lee, S.; Lee, S.; Bae, S.; Harada, K.; Shimada, H. Changes in objectively measured outdoor time and physical, psychological, and cognitive function among older adults with cognitive impairments. Arch. Gerontol. Geriatr. 2018, 8, 190–195. [Google Scholar] [CrossRef]
- Bland, M.J.; Altman, D.G. Agreement between methods of measurement with multiple observations per individual. J. Biopharm. Stat. 2007, 17, 571–582. [Google Scholar] [CrossRef]
- R Core Team. R: A Language and Environment for Statistical Computing; R Foundation for Statistical Computing: Vienna, Austria, 2019. [Google Scholar]
- Wettstein, M.; Wahl, H.-W.; Shoval, N.; Oswald, F.; Voss, E.; Seidl, U.; Frölich, L.; Auslander, G.; Heinik, J.; Landau, R. Out-of-home behavior and cognitive impairment in older adults: Findings of the SenTra project. J. Appl. Gerontol. 2015, 34, 3–25. [Google Scholar] [CrossRef]
- Krenn, P.J.; Titze, S.; Oja, P.; Jones, A.; Ogilvie, D. Use of global positioning systems to study physical activity and the environment: A systematic review. Am. J. Prev. Med. 2011, 41, 508–515. [Google Scholar] [CrossRef] [PubMed]
- Jansen, C.-P.; Diegelmann, M.; Schnabel, E.-L.; Wahl, H.-W.; Hauer, K. Life-space and movement behavior in nursing home residents: Results of a new sensor-based assessment and associated factors. BMC Geriatr. 2017, 17, 36. [Google Scholar] [CrossRef] [PubMed]
- Leask, C.F.; Harvey, J.A.; Skelton, D.A.; Chastin, S.F.M. Exploring the context of sedentary behaviour in older adults (what, where, why, when and with whom). Eur. Rev. Aging Phys. Act. 2015, 1, 12. [Google Scholar] [CrossRef] [PubMed]
- Houston, D.; Luong, T.T.; Boarnet, M.G. Tracking daily travel; assessing discrepancies between GPS-derived and self-reported travel patterns. Transp. Res. Part C Emerg. Technol. 2014, 48, 97–108. [Google Scholar] [CrossRef]
- Bates, D.; Mächler, M.; Bolker, B.; Walker, S. Fitting linear mixed-effects models using lme4. J. Stat. Softw. 2015, 67, 1–48. [Google Scholar] [CrossRef]
- Landis, R.J.; Koch, G.G. The measurement of observer agreement for categorical data. Bometrics 1977, 33, 159–174. [Google Scholar] [CrossRef]
- Hinkle, W.J. Applied Statistics for the Behavioral Sciences, 5th ed.; Houghton Mifflin: Boston, MA, USA, 2003. [Google Scholar]


| Advantages | Disadvantages | |
|---|---|---|
 |
|
|
| Self-report (space-time diary) | ||
 |
|
|
| Location sensor (GPS) |
| TOH events | AL events | |
|---|---|---|
| Initial number of events | 324 | 817 |
| Outside study period | 18 | 50 |
| Duration ≤3 min | 1 | 16 |
| Missing start/end time | – | 14 |
| Non-stationary/movement | – | 189 |
| At home | – | 36 |
| False reports | – | 4 |
| Number of valid reported events | 305 | 543 |
| Invalid study day | 82 | 106 |
| Number of valid events of valid days | 223 | 437 |
| Variable | Method | Days | Mean | Median | SD | Min. | Max. |
|---|---|---|---|---|---|---|---|
| Time out of home (TOH) (min) | REP | 140 | 277.6 | 245 | 207.1 | 0 | 1020 |
| GPS | 140 | 270.1 | 216 | 224.6 | 0 | 1371 | |
| Number of activity locations (#ALs) | REP | 170 | 2.6 | 2 | 1.8 | 0 | 10 |
| GPS | 170 | 3.3 | 3 | 2.8 | 0 | 15 |
| Days | Mean | SD | Median | Min. | Max. | SD btw * | Mean SD within ** | |
|---|---|---|---|---|---|---|---|---|
| TOH [min] | 140 | 7.5 | 178.3 | 11 | −876 | 734 | 85.5 | 118.4 |
| #ALs [#] | 170 | −0.7 | 2.4 | 0 | −11 | 5 | 1.5 | 1.8 |
| Measures of Agreement | TOH | #ALs | ||
|---|---|---|---|---|
| Bland-Altman mean differences [95% LOA] | 7.50 | [−342.6; 357.6] (min) | −0.70 | [−5.4; 3.9] (#) |
| ICC [95% CI] | 0.66 | [0.54; 0.76] | 0.47 | [0.34; 0.60] |
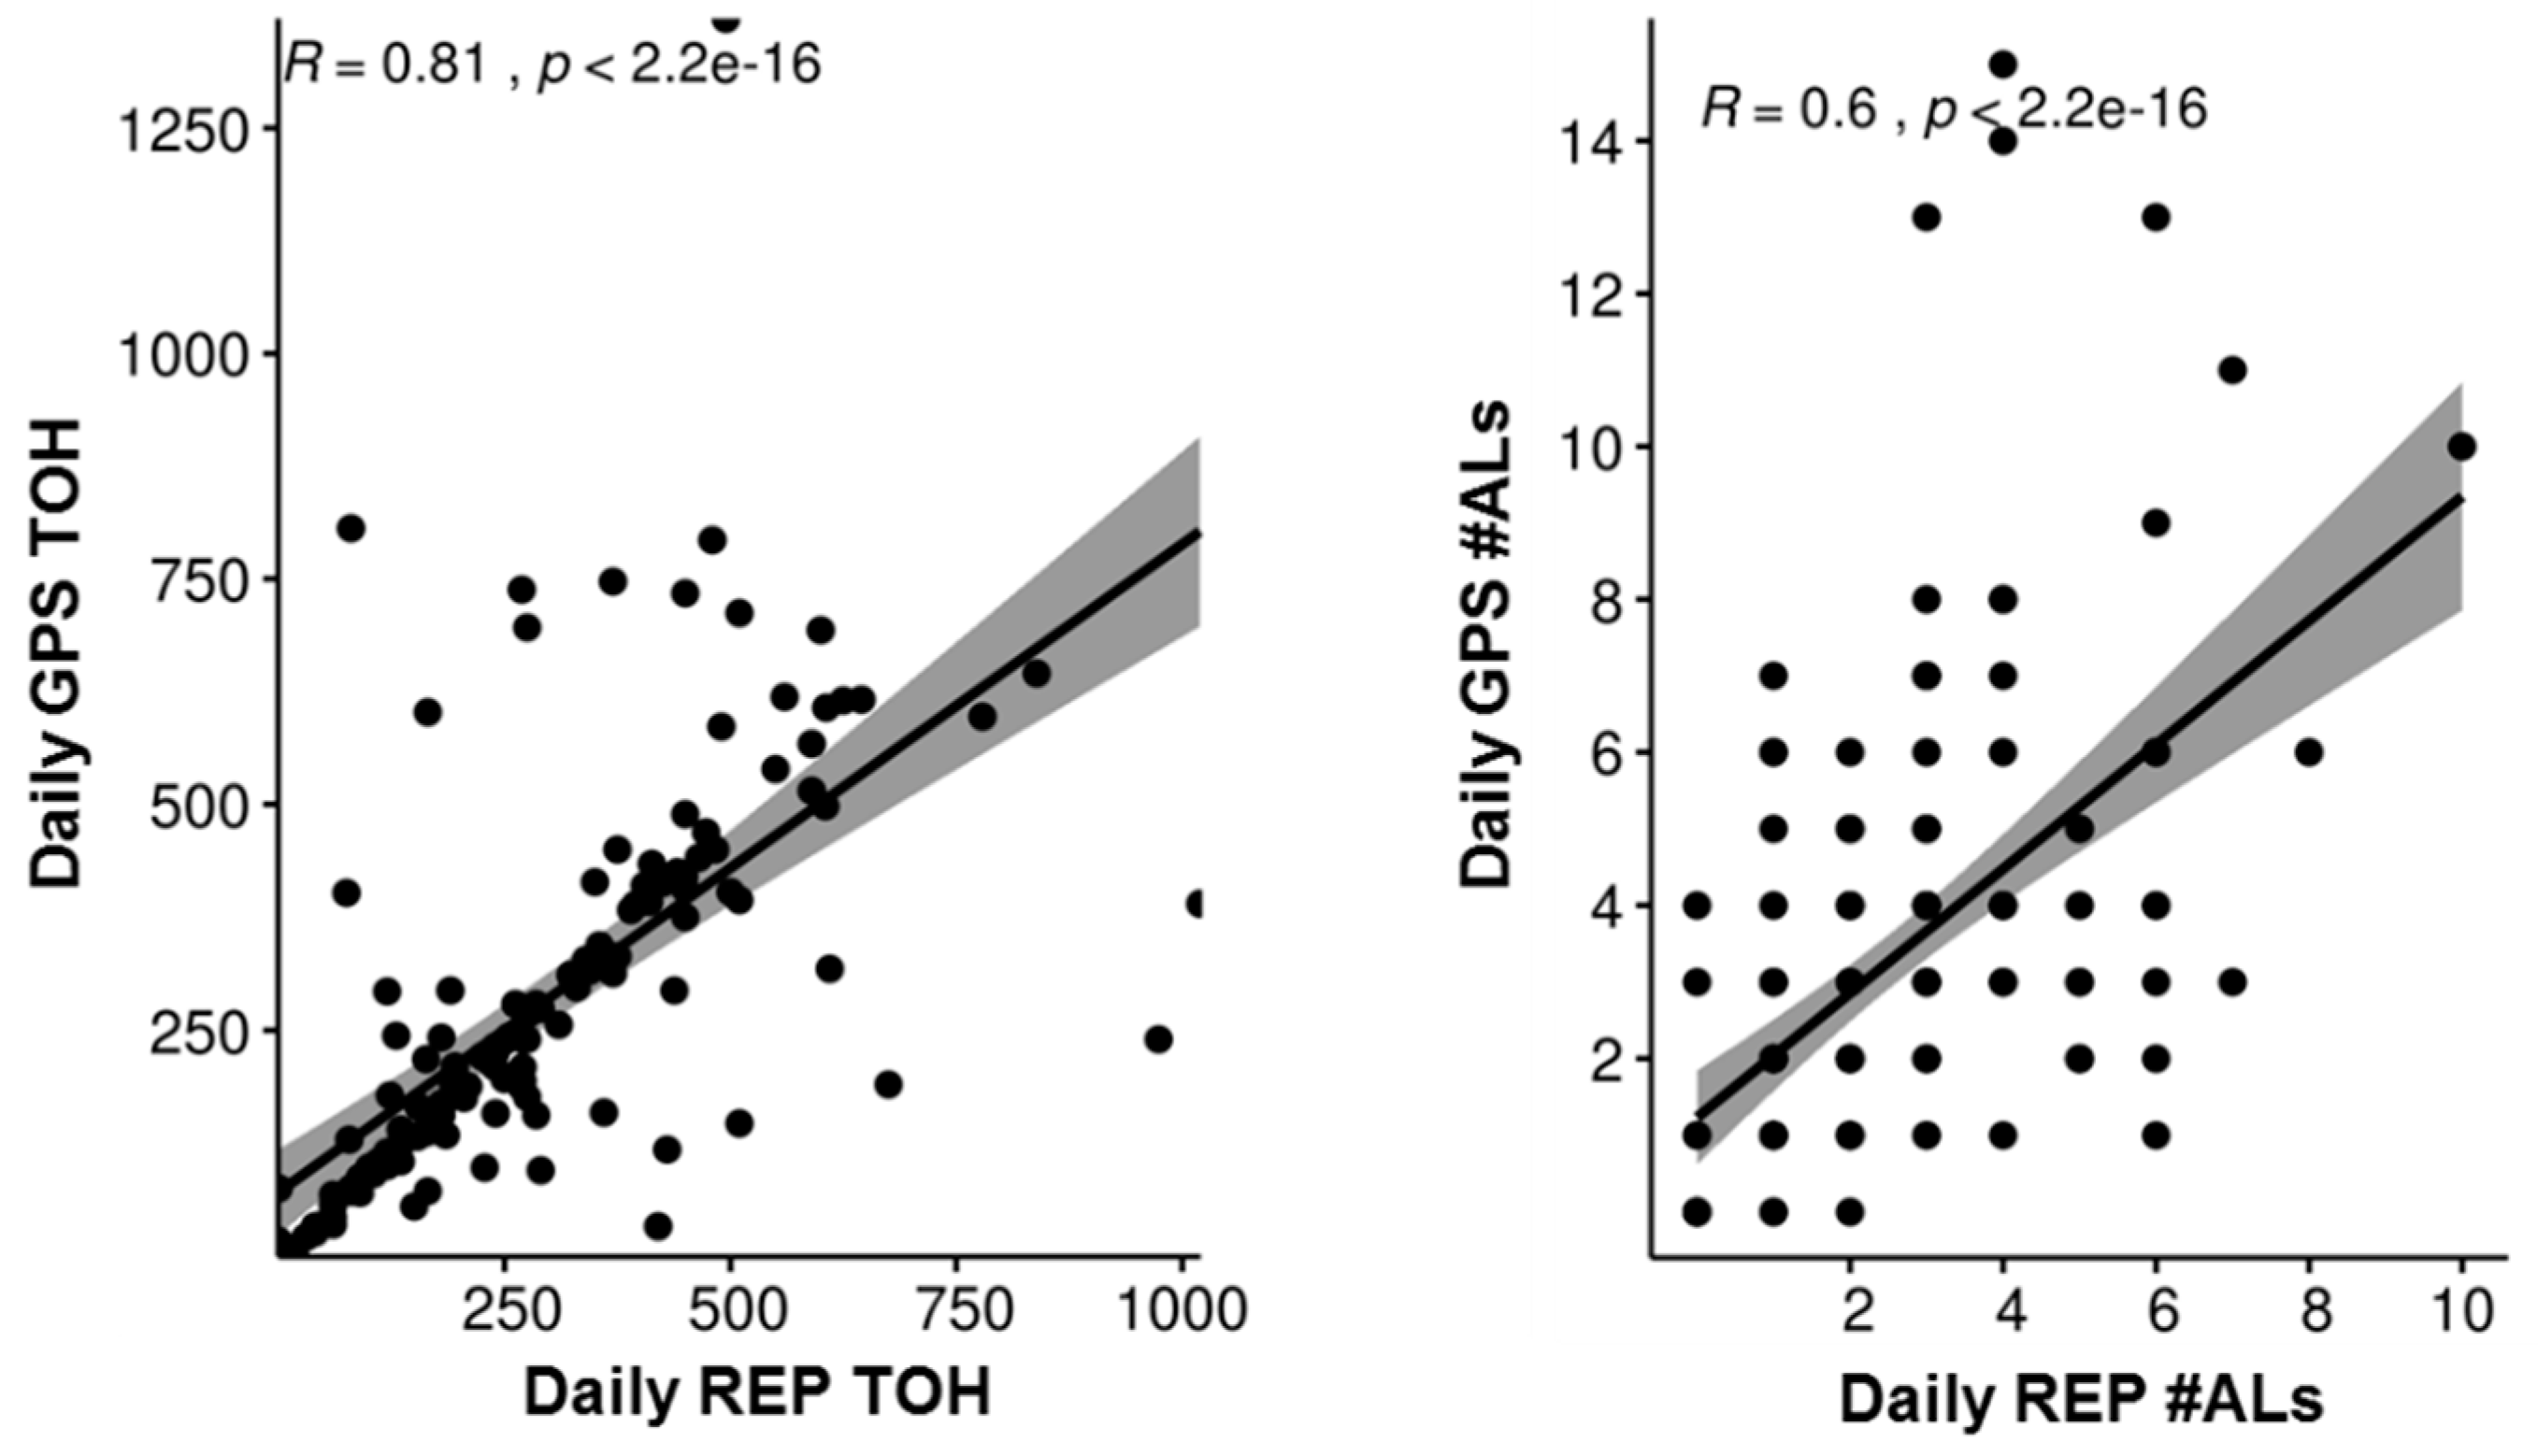
| Correlation Spearman | 0.81 | * | 0.60 | * |
| Mean (SD) iCorr Spearman | 0.69 | (0.41) | 0.53 | (0.50) |
| Relation | REP TOH | GPS TOH | REP AL | GPS AL | ||||
|---|---|---|---|---|---|---|---|---|
| 1:1 | 193 | 87% | 196 | 87% | 260 | 59% | 383 | 68% |
| 1:n | 12 | 5% | 11 | 5% | 74 | 17% | 42 | 7% |
| 1:0 | 18 | 8% | 18 | 8% | 103 | 24% | 139 | 25% |
| Total no. of events | 223 | 100% | 225 | 100% | 437 | 100% | 564 | 100% |
| Event-Centered Measures of Agreement | TOH | #ALs |
|---|---|---|
| Count-based | ||
| Precision | 0.92 | 0.76 |
| Recall | 0.92 | 0.75 |
| F1 | 0.92 | 0.76 |
| Duration-based | ||
| IoU | 0.72 | 0.50 |
| Activity Type | No. Events | No. Events with Match | Median Event Duration (min) | Mean Duration Overlap |
|---|---|---|---|---|
| Work | 5 | 100% | 360.0 | 52% |
| Recreation | 55 | 93% | 80.0 | 73% |
| Personal care | 28 | 82% | 45.0 | 64% |
| Social | 32 | 81% | 150.5 | 68% |
| Cultural/Religious/Education | 41 | 78% | 124.0 | 63% |
| Commercial | 211 | 74% | 30.0 | 54% |
| Transportation | 41 | 56% | 10.0 | 40% |
| Unassignable | 24 | – | – | – |
| Type | No. Events | No. Events With Match | Median Event Duration (min) | Mean Duration Overlap |
|---|---|---|---|---|
| Outdoor | 108 | 77% | 32.5 | 49% |
| Indoor | 320 | 76% | 45.0 | 61% |
| Unassignable | 9 | – | – | – |
© 2019 by the authors. Licensee MDPI, Basel, Switzerland. This article is an open access article distributed under the terms and conditions of the Creative Commons Attribution (CC BY) license (http://creativecommons.org/licenses/by/4.0/).
Share and Cite
Fillekes, M.P.; Kim, E.-K.; Trumpf, R.; Zijlstra, W.; Giannouli, E.; Weibel, R. Assessing Older Adults’ Daily Mobility: A Comparison of GPS-Derived and Self-Reported Mobility Indicators. Sensors 2019, 19, 4551. https://doi.org/10.3390/s19204551
Fillekes MP, Kim E-K, Trumpf R, Zijlstra W, Giannouli E, Weibel R. Assessing Older Adults’ Daily Mobility: A Comparison of GPS-Derived and Self-Reported Mobility Indicators. Sensors. 2019; 19(20):4551. https://doi.org/10.3390/s19204551
Chicago/Turabian StyleFillekes, Michelle Pasquale, Eun-Kyeong Kim, Rieke Trumpf, Wiebren Zijlstra, Eleftheria Giannouli, and Robert Weibel. 2019. "Assessing Older Adults’ Daily Mobility: A Comparison of GPS-Derived and Self-Reported Mobility Indicators" Sensors 19, no. 20: 4551. https://doi.org/10.3390/s19204551
APA StyleFillekes, M. P., Kim, E.-K., Trumpf, R., Zijlstra, W., Giannouli, E., & Weibel, R. (2019). Assessing Older Adults’ Daily Mobility: A Comparison of GPS-Derived and Self-Reported Mobility Indicators. Sensors, 19(20), 4551. https://doi.org/10.3390/s19204551