Article

A Graphene-Based Glycan Biosensor for Electrochemical Label-Free Detection of a Tumor-Associated Antibody

1
Department of Glycobiotechnology, Institute of Chemistry, Slovak Academy of Sciences, Dubravska cesta 9, 845 38 Bratislava, Slovakia
2
Department of Physical Chemistry, Faculty of Natural Sciences, Comenius University, Mlynska Dolina, 842 15 Bratislava, Slovakia
3
International Laser Centre, Ilkovicova 3, 841 04 Bratislava, Slovakia
4
Department of Chemistry, University of Copenhagen, 1871 Copenhagen, Denmark
5
Division of Oncology and Pathology, Department of Clinical Sciences, Lund, Lund University, Lund, SE 221 85, Sweden
6
Center for Advanced Materials, Qatar University, P.O. Box 2713, Doha, Qatar
*
Authors to whom correspondence should be addressed.
Sensors 2019, 19(24), 5409; https://doi.org/10.3390/s19245409
Submission received: 10 October 2019 / Revised: 29 November 2019 / Accepted: 2 December 2019 / Published: 9 December 2019
(This article belongs to the Special Issue Applications of Graphene-Based Materials in Sensors)

Abstract

:
The study describes development of a glycan biosensor for detection of a tumor-associated antibody. The glycan biosensor is built on an electrochemically activated/oxidized graphene screen-printed electrode (GSPE). Oxygen functionalities were subsequently applied for covalent immobilization of human serum albumin (HSA) as a natural nanoscaffold for covalent immobilization of Thomsen-nouvelle (Tn) antigen (GalNAc-O-Ser/Thr) to be fully available for affinity interaction with its analyte—a tumor-associated antibody. The step by step building process of glycan biosensor development was comprehensively characterized using a battery of techniques (scanning electron microscopy, atomic force microscopy, contact angle measurements, secondary ion mass spectrometry, surface plasmon resonance, Raman and energy-dispersive X-ray spectroscopy). Results suggest that electrochemical oxidation of graphene SPE preferentially oxidizes only the surface of graphene flakes within the graphene SPE. Optimization studies revealed the following optimal parameters: activation potential of +1.5 V vs. Ag/AgCl/3 M KCl, activation time of 60 s and concentration of HSA of 0.1 g L−1. Finally, the glycan biosensor was built up able to selectively and sensitively detect its analyte down to low aM concentration. The binding preference of the glycan biosensor was in an agreement with independent surface plasmon resonance analysis.

1. Introduction

The surface of every living cell is decorated with a compact layer of complex carbohydrates (glycans) adhered to a cell membrane. Thus, for an elementary understanding of biology it is important to get a detailed knowledge about the functions of glycans [1,2]. Over 50% of all proteins in organisms are modified by glycosylation and such a post-translational modification is crucial for regulation of many cellular processes. Glycans are built-up step-by-step using an enzymatic addition of carbohydrate building blocks to proteins/lipids [3]. Aberrant glycosylation is associated with many cellular properties involving cell proliferation, differentiation, transformation, migration, invasion, apoptosis, and immune responses.
Cancer is one of the predominant diseases leading to mortality, with approximately 14.1 million new malignant cases with 8.2 million associated deaths every year [4]. Due to the progressive increase of the disease occurrence we can speak of a ’cancer epidemic’ [5]. Cancer cells undergo significant modifications in terms of glycan expression. Glycosylation patterns and level of glycans on the cell surfaces often give us information about the biological condition of the cells. Various tumor-associated carbohydrate antigens (TACAs) were identified to mediate key steps during cancer progression. For example TACAs such as the Thomsen-nouvelle (Tn; GalNAc-O-Ser/Thr), sTn (sialyl Tn; NeuAcα2-6GalNAcα-O-Ser/Thr), and Thomsen-Friedenreich (TF; Galβl-3GalNAcαl-O-Ser/Thr) [6,7] antigens can be used as diagnostic tumor markers and therapeutic targets [8]. The TF antigen is over-expressed in many carcinoma cells and it is biosynthesized from the Tn core. Correlation between levels of the TF and the Tn has never been observed [9].
However, the most common and very specific TACA is the Tn antigen discovered in 1957 [10]. The Tn antigen as a small glycan is expressed early in transformed cells and is the precursor for synthesis of other aberrant O-glycans [11]. Its presence was confirmed in 70–90% of cancer types [11,12,13,14,15,16] and its expression corresponds with metastatic progression of the disease and a poor prognosis for cancer patients. On the other hand, good prognosis for cancer patients is associated with high levels of naturally generated anti-TACA antibodies (antibodies against aberrant glycans) [17].
Early cancer detection and personalized patient treatment are required in order to improve the survival rates of cancer patients [18]. Thus, cost-effective and simple tests and methods, which can detect cancer biomarkers in a mildly invasive or non-invasive way directly in serum/urine are required. Conventional instrumental-based methods have distinct drawbacks, when applied in glycomics and for diagnostic purposes [19], this is why affinity-based devices have a huge potential in cancer diagnostics [20]. Devices based on electrochemical methods offer ultrasensitive, rapid, simple, reliable, and economical assay protocols applicable also for biomarkers detection [21,22,23].
Nanotechnology is a driving force for advancements in many scientific disciplines including also cancer diagnostics, cancer therapy and glycomics [24,25]. Nanoparticles and nanomaterials with engineered surface characteristics can be effectively applied as scaffolds for displaying of glycans that allow precise surface positioning and higher density than using traditional approaches [22]. Furthermore, addition of nanomaterials such as NPs, carbon nanotubes (CNTs) or graphene may enhance sensitivity of biosensing [26,27]. The most prominent nanomaterial is graphene with unique physico-chemical characteristics. One-atom 2D thick layer of sp2 hybridized carbon atoms—graphene — has fascinated the scientific community since the early description of its properties in 2004 [28,29]. Despite their short history, graphene-based materials are frequently used in (electro)biosensing thanks to their exceptional, unique and impressive electrical, thermal, optical and mechanical properties as a consequence of its configuration [30,31]. Moreover, depending on the purpose, graphene surface can be easily functionalized through non-covalent (π-π stacking, hydrophobic and electrostatic interactions) or covalent interaction (utilization of free oxygen groups in graphene oxide). Our recent study suggests [32] that unmodified graphene due to hydrophobic nature can effective denature proteins, that can result in development of interfacial layers exhibiting substantially compromised bioreceptive properties and/or being significantly prone to non-specific protein binding, while working with complex samples like human serum.
In our recent review paper we found out that several glycan biosensors developed on graphene modified interfaces offer quite high limits of detection (i.e., in the range of nM–μM) (see also Table 1 in the current manuscript) [22]. In this manuscript we wanted to investigate if such biosensing performance is the attribute of the detection platform used (FET sensing or electrochemistry using built-in redox mediators) or it is an inherent attribute of graphene interface. This is why in this study we investigate basic characteristics and biosensing performance of graphene screen-printed electrodes (GSPE) oxidized by potentiostatic activation to design glycan biosensor for detection of a tumor-associated antibody.

2. Materials and Methods

2.1. Chemicals

Potassium hexacyanoferrate (II) trihydrate, N-hydroxysuccinimide (NHS), N-(3-dimethylaminopropyl)-N′-ethylcarbodiimide hydrochloride (EDC), phosphate buffered saline tablet (PBS, one tablet dissolved in 200 mL of deionized water (DW) yields 0.01 M phosphate buffer, 0.0027 M potassium chloride and 0.137 M sodium chloride, pH 7.4, at 25 °C), KH2PO4, K2HPO4, TWEEN 20, lectin from Dolichosbiflorus (DBA), Concanavalin A (Con A) and human serum albumin (HSA), were of ≥99% purity or p.a. grade and were purchased from Sigma Aldrich (St. Louis, MO, USA).
Antibody GOD3-2C4 (2C4), a mouse IgG1κ antibody not cross-reacting with the GalNAc-β-O epitope or the blood group A antigen and specific to both synthetic Tn antigens and mucin-associated Tn antigen, was produced using a procedure as published by Jansson and co-workers [33]. Antibody GOD3-2C4 binds to the Tn antigen expressed by cancer of breast, colon, lung, ovary, and pancreas and was the first anti-Tn antibody showing anti-tumor activity on a solid tumor in-vivo [33] and recently the antibody was applied to identify possible carrier of the Tn antigen in samples from patients having breast cancer [15]. Binding specificity towards various glycans, glycoprotein and proteins showed no binding of GOD3-2C4 antibody to BSA or HSA proteins with a biospecific binding towards the Tn antigen [33]. The Tn antigen (GalNAcα1-O-serine) was provided from Carbosynth (Newbury, UK). The Tn-BSA (Tn antigen conjugated to bovine serum albumin) conjugate for Surface Plasmon Resonance (SPR) experiments was purchased from GLYcoDiag (Orléans, France).
All solutions and buffer components were freshly prepared in 0.055 μS cm−1 ultrapure deionized water (DW) and filtered prior to use using 0.2 μm sterile filters. HSA was dissolved in 10 mM PBS solution with pH 7.4 and 0.05 % TWEEN 20. The Tn antigen was dissolved in 10 mM PBS solution with pH 7.4, both solutions were prepared at concentration of 1 mg mL−1 and were stored at −20 °C in aliquots.

2.2. Electrode Pretreatment

First, the surfaces of bare graphene screen-printed electrodes (GSPEs, d = 4 mm, DropSens, Llanera, Spain) were potentiostatically activated. Chronoamperometry was chosen as an activation procedure. We started with optimization of an activation time and potential. Three different time intervals (30 s, 60 s and 90 s) in combination with two different potential values (+1.5 V and +1.7 V) were examined [34]. The process was carried out in three-electrode electrochemical cells with an Ag/AgCl/3 M KCl reference and a counter Pt electrode (Bioanalytical Systems, West Laffayette, IN, USA) using phosphate buffer (50 mM, pH 6.0). The actual measurement was carried out by a laboratory potentiostat/galvanostatAutolab PGSTAT 302N (Ecochemie, Utrecht, The Netherlands). Measurements were run under Nova Software 1.10.

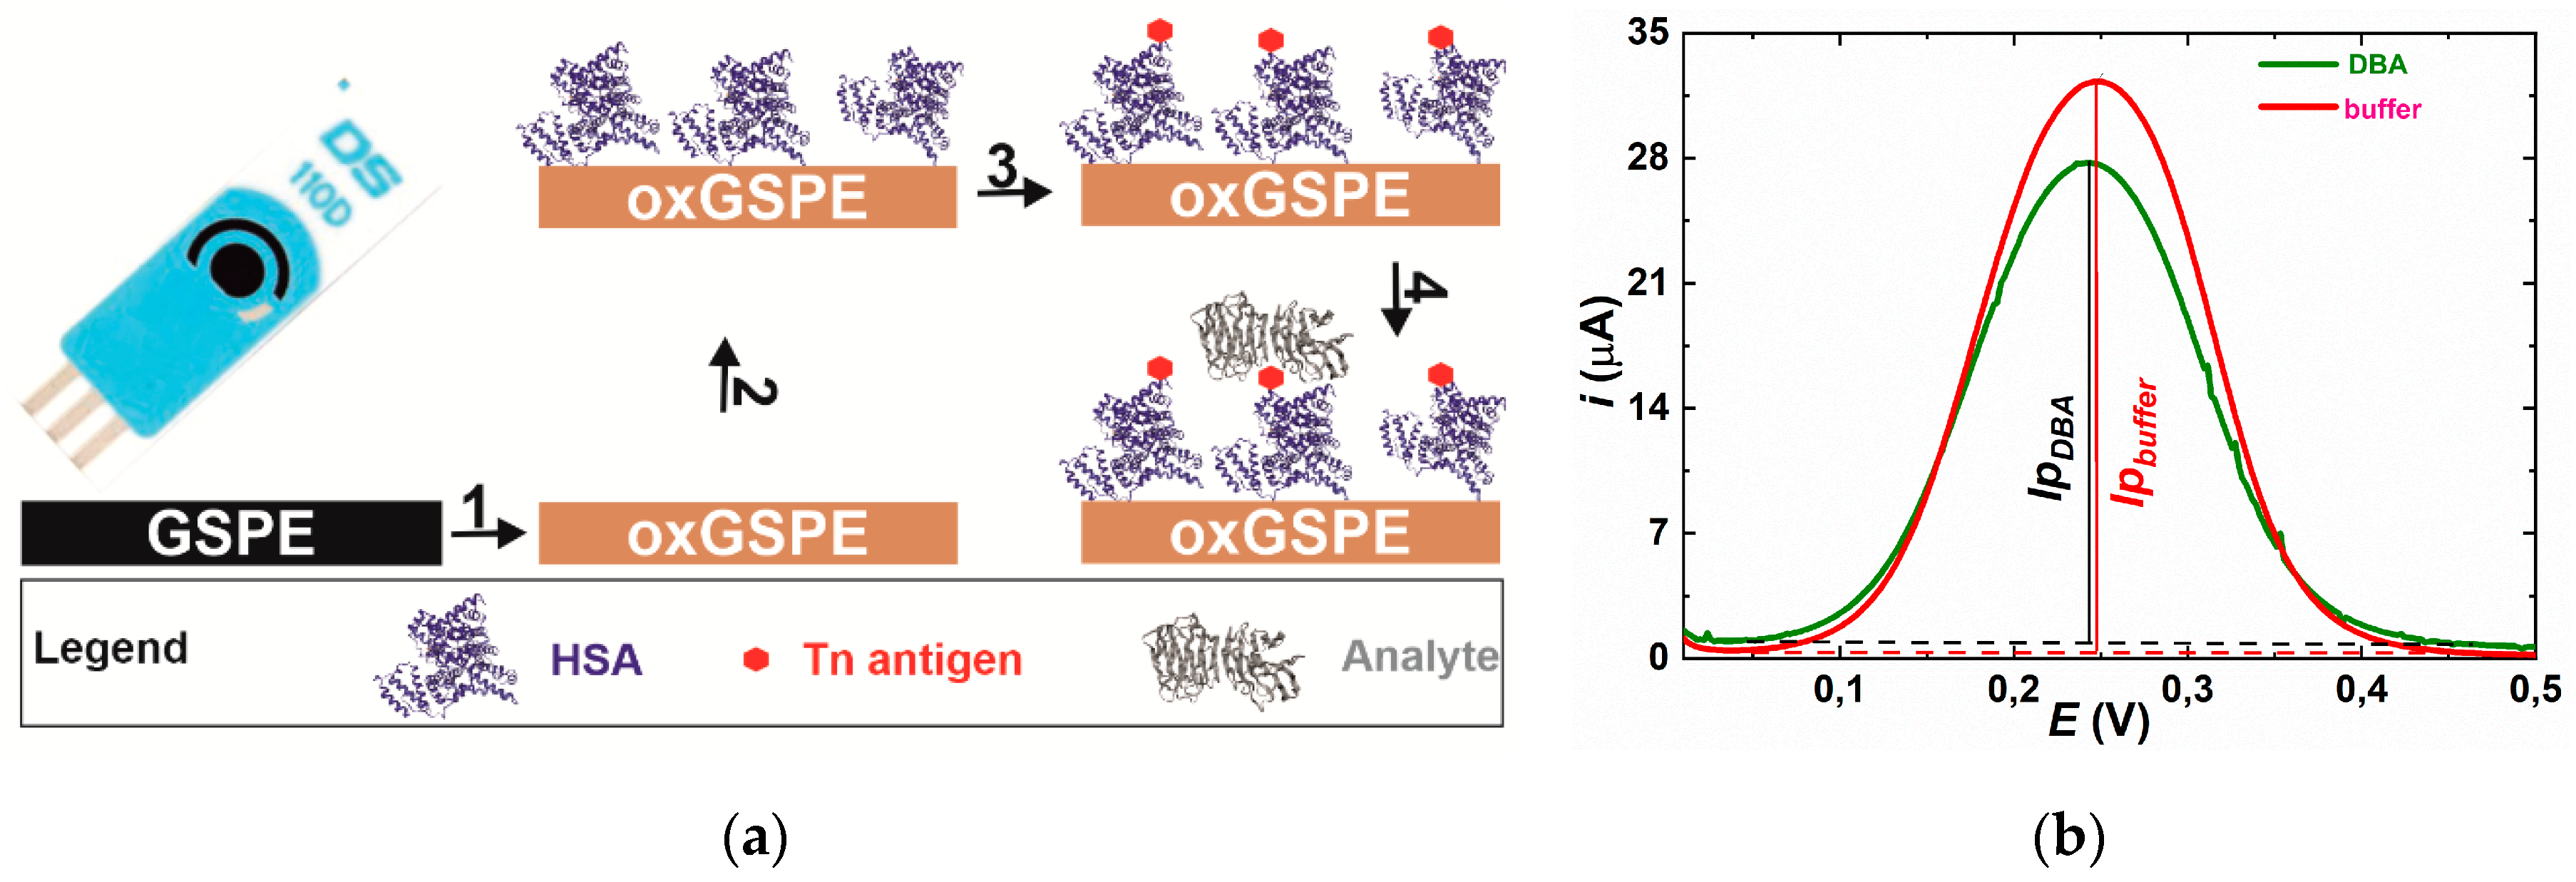
2.3. The Glycan Biosensor

After electrochemical activation step, working surfaces of GSPEs were washed with DW. Free (electro)activated carboxyl groups were activated with 40 µL solution of 200 mM EDC and 50 mM NHS mixed at a ratio of 1+1 just prior immobilization (solution of EDC and NHS were previously prepared in DW and stored separately at −80 °C in aliquots) for 12 min [35]. After this chemical activation, the electrodes were washed with DW. The next step was an incubation of surfaces with HSA (10−5−10−1 mg mL−1 dissolved in PBS with 0.05% TWEEN 20) for 15 min. After immobilization of HSA, the protein was activated with 40 µL solution of 200 mM EDC and 50 mM NHS at a ratio of 1 + 1 for 12 min and then the activated surface was incubated with the Tn antigen (100 µM) for 15 min. The HSA and glycan immobilization were performed at a room temperature.

2.4. Differential Pulse Voltammetry (DPV) Measurement

DPV was measured in an electrolyte containing 5 mM potassium hexacyanoferrate (II) trihydrate and 0.01 M PBS, pH 7.4. The parameters applied for the differential pulse voltammetry were as follows: 60 s accumulation time at 0.2 V, 50 ms modulation time, 0.5 s interval time, 25 mV modulation amplitude, and 5 mV step. Measurements were run under Nova Software 1.10 (Ecochemie,). The results were presented in a form i vs. E plot where a peak height was compared and analyzed (Figure 1b) for analyte (lectin or GOD3-2C4 antibody) concentration typically from 9 aM up to 9 pM. The biosensor exhibits saturation of the response signal at concentrations higher than 9 pM (Figure S1). Each analyte was measured at least in triplicate on three independent biosensor devices (electrodes) and results are shown with a standard deviation (±SD) or relative standard deviation (RSD) calculated in Excel. It is worth noting that such RSDs are not relative standard errors of analyte detection, but rather represent reproducibility of the biosensor construction, since each calibration curve was constructed by an independent biosensor device. Measurements of a particular analyte were performed on the same day. See the Electronic Supporting Material (ESM) file for other characterization tools applied in the study.

3. Results and Discussion

The glycan biosensor was developed in three consecutive steps: 1. Activation of GSPE by an anodic potential; 2. Covalent immobilization of HSA on activated surface of GSPE electrode and 3. Covalent attachment of Tn antigen on HSA layer (Figure 1a).

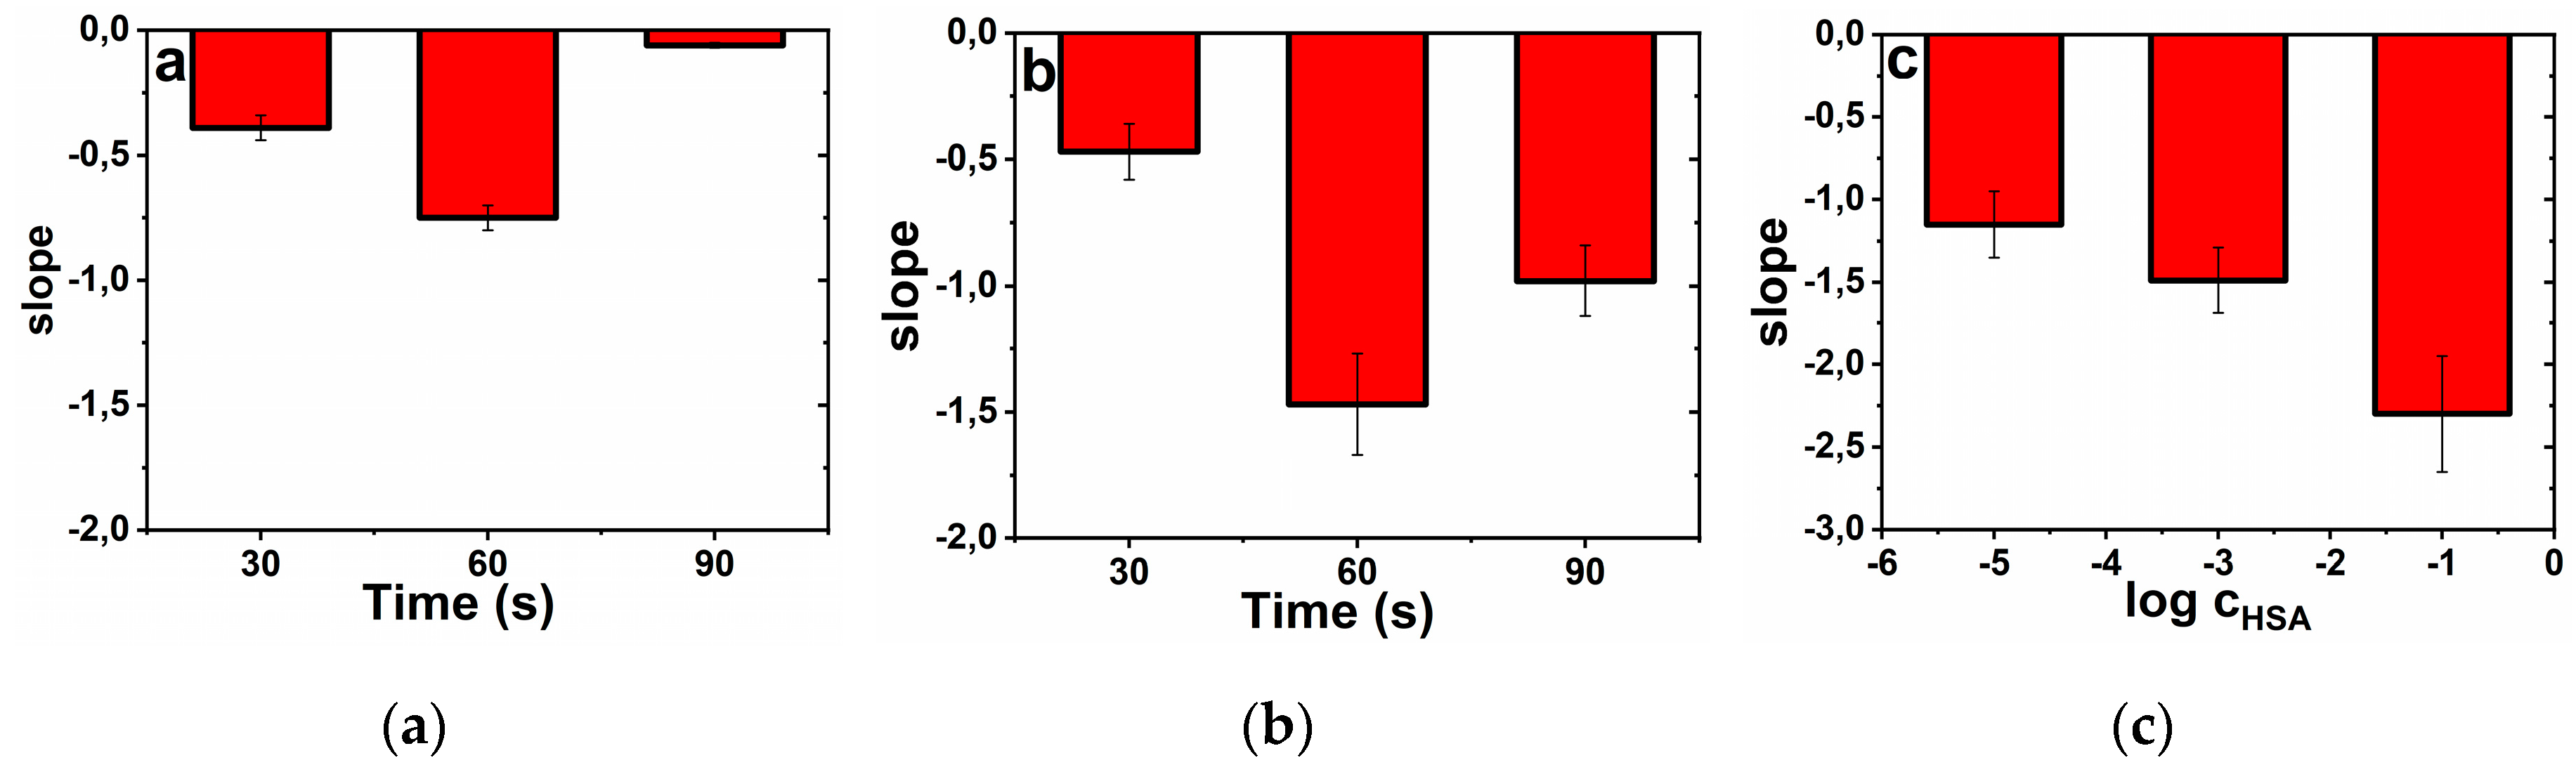
3.1. Optimization of Construction of the Glycan Biosensor

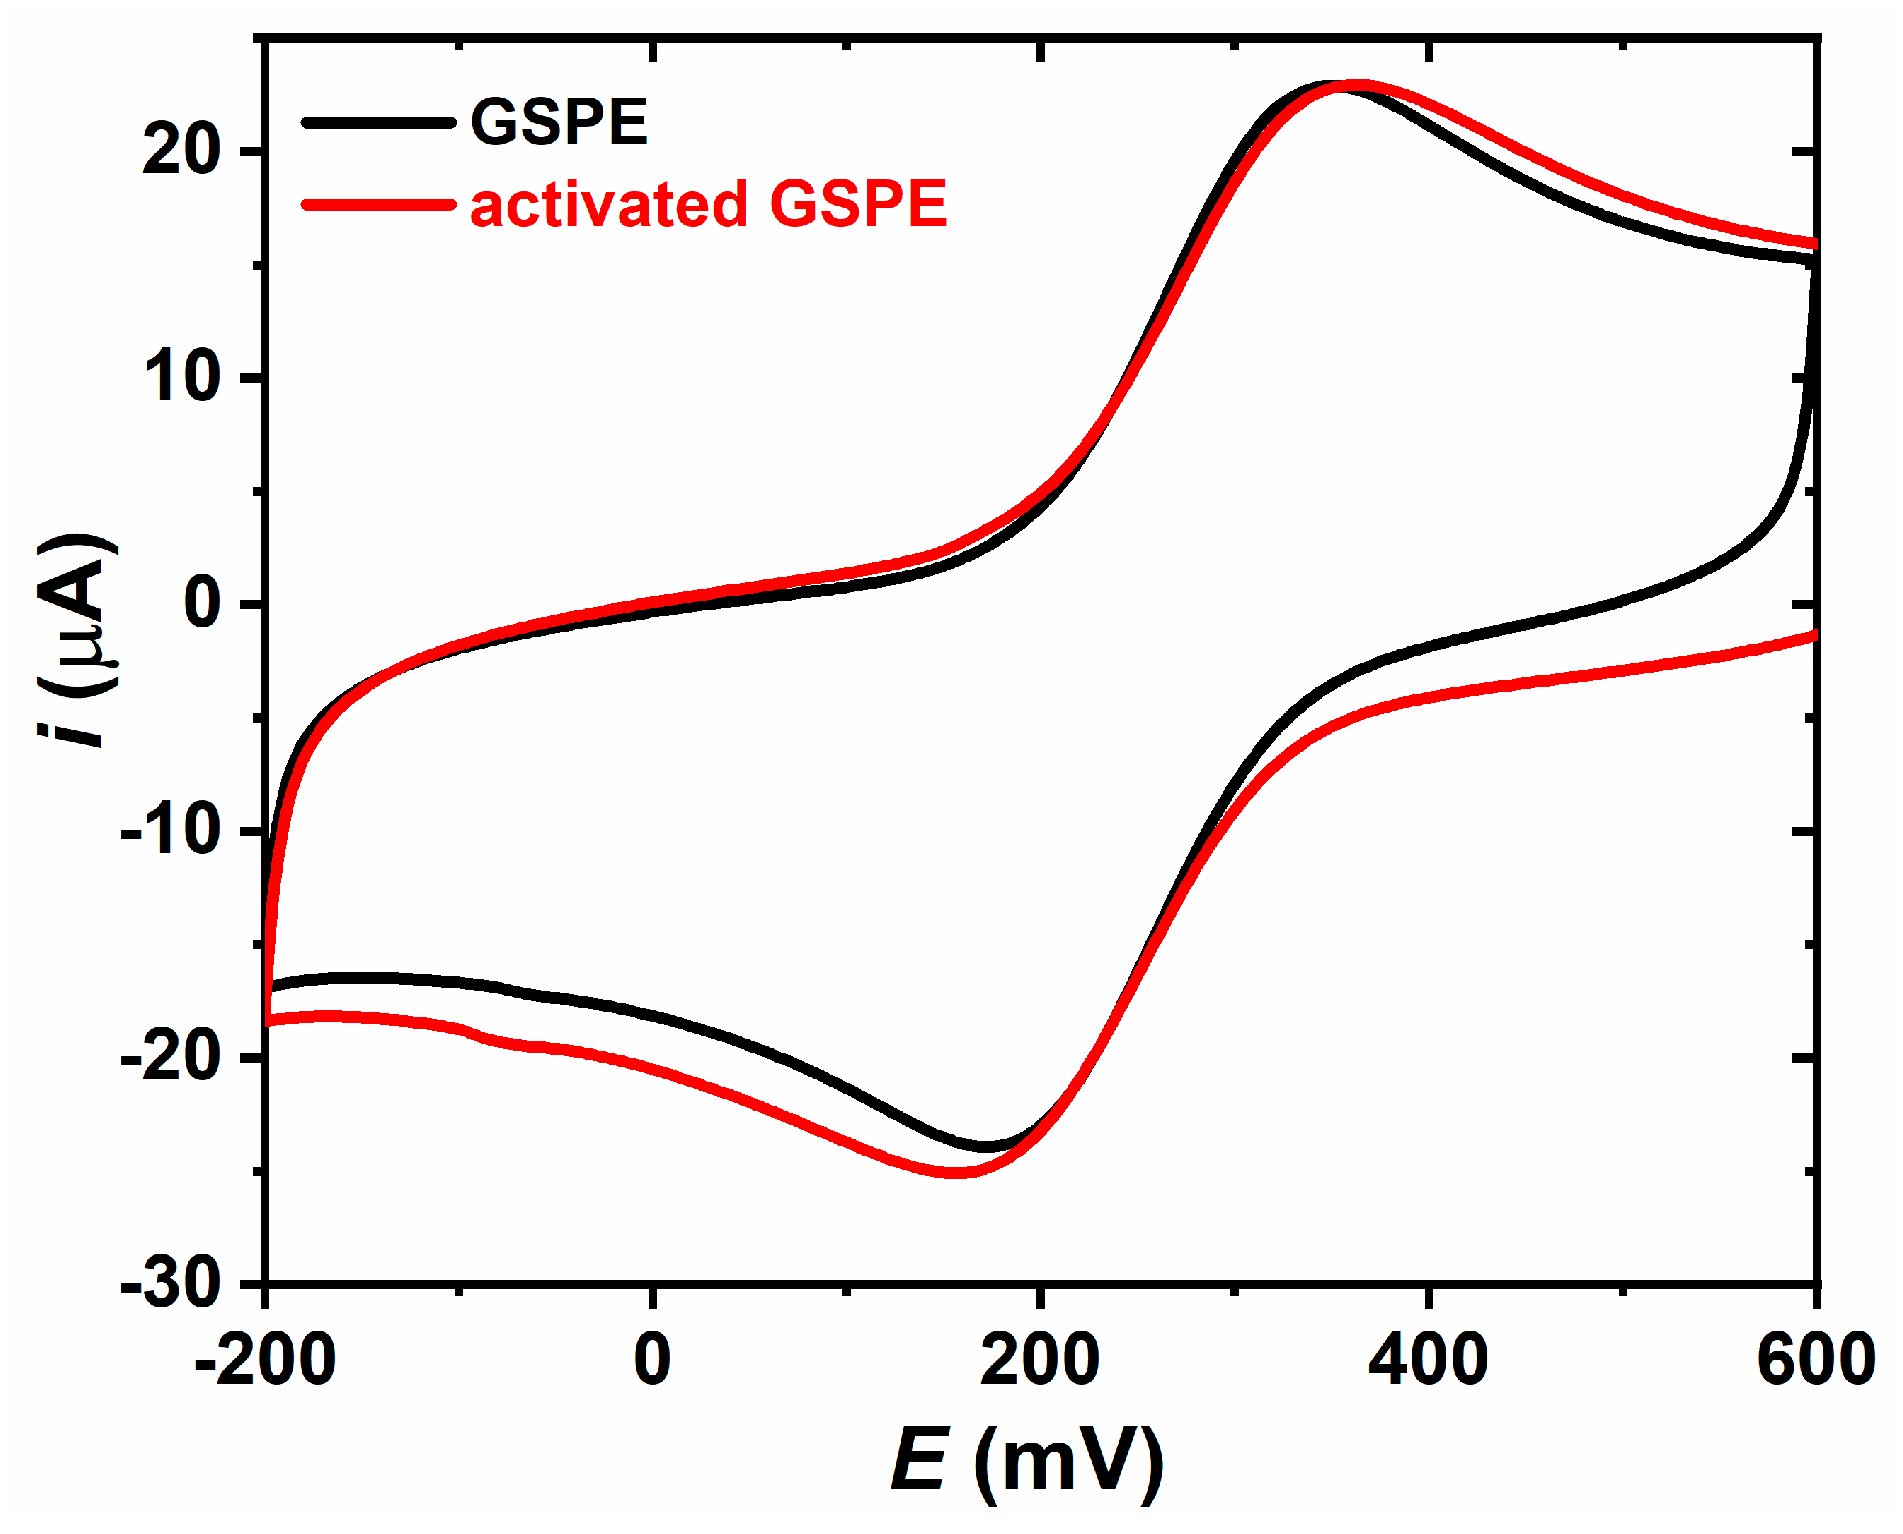
3.1.1. Electrode Activation

The first parameter, which was optimized was the process of electrode surface activation by application of an anodic potential (+1.5 V and +1.7 V vs. Ag/AgCl/3 M KCl) for defined time (30 s, 60 s and 90 s). There are two reasons for oxidation of graphene surface. The first one is deposition of oxygenated functional groups like -COOH for covalent attachment of HSA as a natural nanoscaffold for subsequent immobilization of the Tn antigen. The second reason is to prevent denaturation of HSA after interaction with graphene surface and to prevent exposure of hydrophobic parts of the protein backbone after denaturation, what can induce non-specific binding of proteins from complex matrices [32].
The results suggest that at an oxidation potential of +1.5 V vs. Ag/AgCl/3 M KCl, the highest sensitivity of −(0.75 ± 0.05) % M−1 for DBA lectin detection was observed after application of the potential for 60 s (Figure 2a). When the GSPE was activated by the anodic potential of +1.7 V vs. Ag/AgCl/3 M KCl, again the optimal time of oxidation was 60 s with the sensitivity of the DBA detection of −(1.47 ± 0.2) % M−1 (Figure 2b), representing an increase of the biosensor sensitivity 2-fold. In order to prepare the glycan biosensor in a robust way, for further work an activation potential of +1.5 V applied for 60 s was selected since the biosensor based on activation at +1.5 V for 60 s offered RSD of 6.7% (Figure 2a), while the biosensor built-up on activation at +1.7 V for 60 s offered RSD of 13.6% (Figure 2b).

3.1.2. Modification of the Electrode by HSA

The other parameter which was optimized during the glycan biosensor preparation was the concentration of HSA applied for electrode modification. The results suggest that the ability of the glycan biosensor to detect DBA lectin increased with an increased concentration of HSA applied for electrode surface patterning almost in a linear fashion (Figure 2c). The highest sensitivity of −(2.30 ± 0.35) % M−1 (Figure 2c) for DBA detection was observed on the surface patterned by HSA from the 0.1 g L−1 HSA (~1.5 µM) solution. We did not test higher HSA concentration since we could expect formation of unwanted multilayers of HSA and this is why we considered 0.1 g L−1 HSA solution as the optimal one.

3.2. Characterization of the Surfaces

3.2.1. Electrochemical Characterization of the Surfaces

The GSPE and modified GSPE electrodes were characterized using cyclic voltammetry (Figure 3). The results indicate that at a scan rate of 0.1 V s−1, GSPE exhibits ΔE = (0.176 ± 0.033) V (Table S1), a value which increases to ΔE = (0.187 ± 0.032) V upon electrochemical surface activation (Table S2). The results thus confirm deposition of negative functional groups on GSPE during its electrochemical oxidation. From such electrochemical investigation we calculated also electrochemical surface area as follows: (0.149 ± 0.009) cm2 (roughness factor of 1.19) for GSPE and (0.171± 0.010) cm2 (roughness factor of 1.36) for activated GSPE. Covalent immobilization of HSA resulted in slight decrease of ΔE to a value of (0.177 ± 0.047) V (Table S3), a value, which then decreased to (0.156 ± 0.021) V after covalent attachment of the Tn antigen (Table S4).

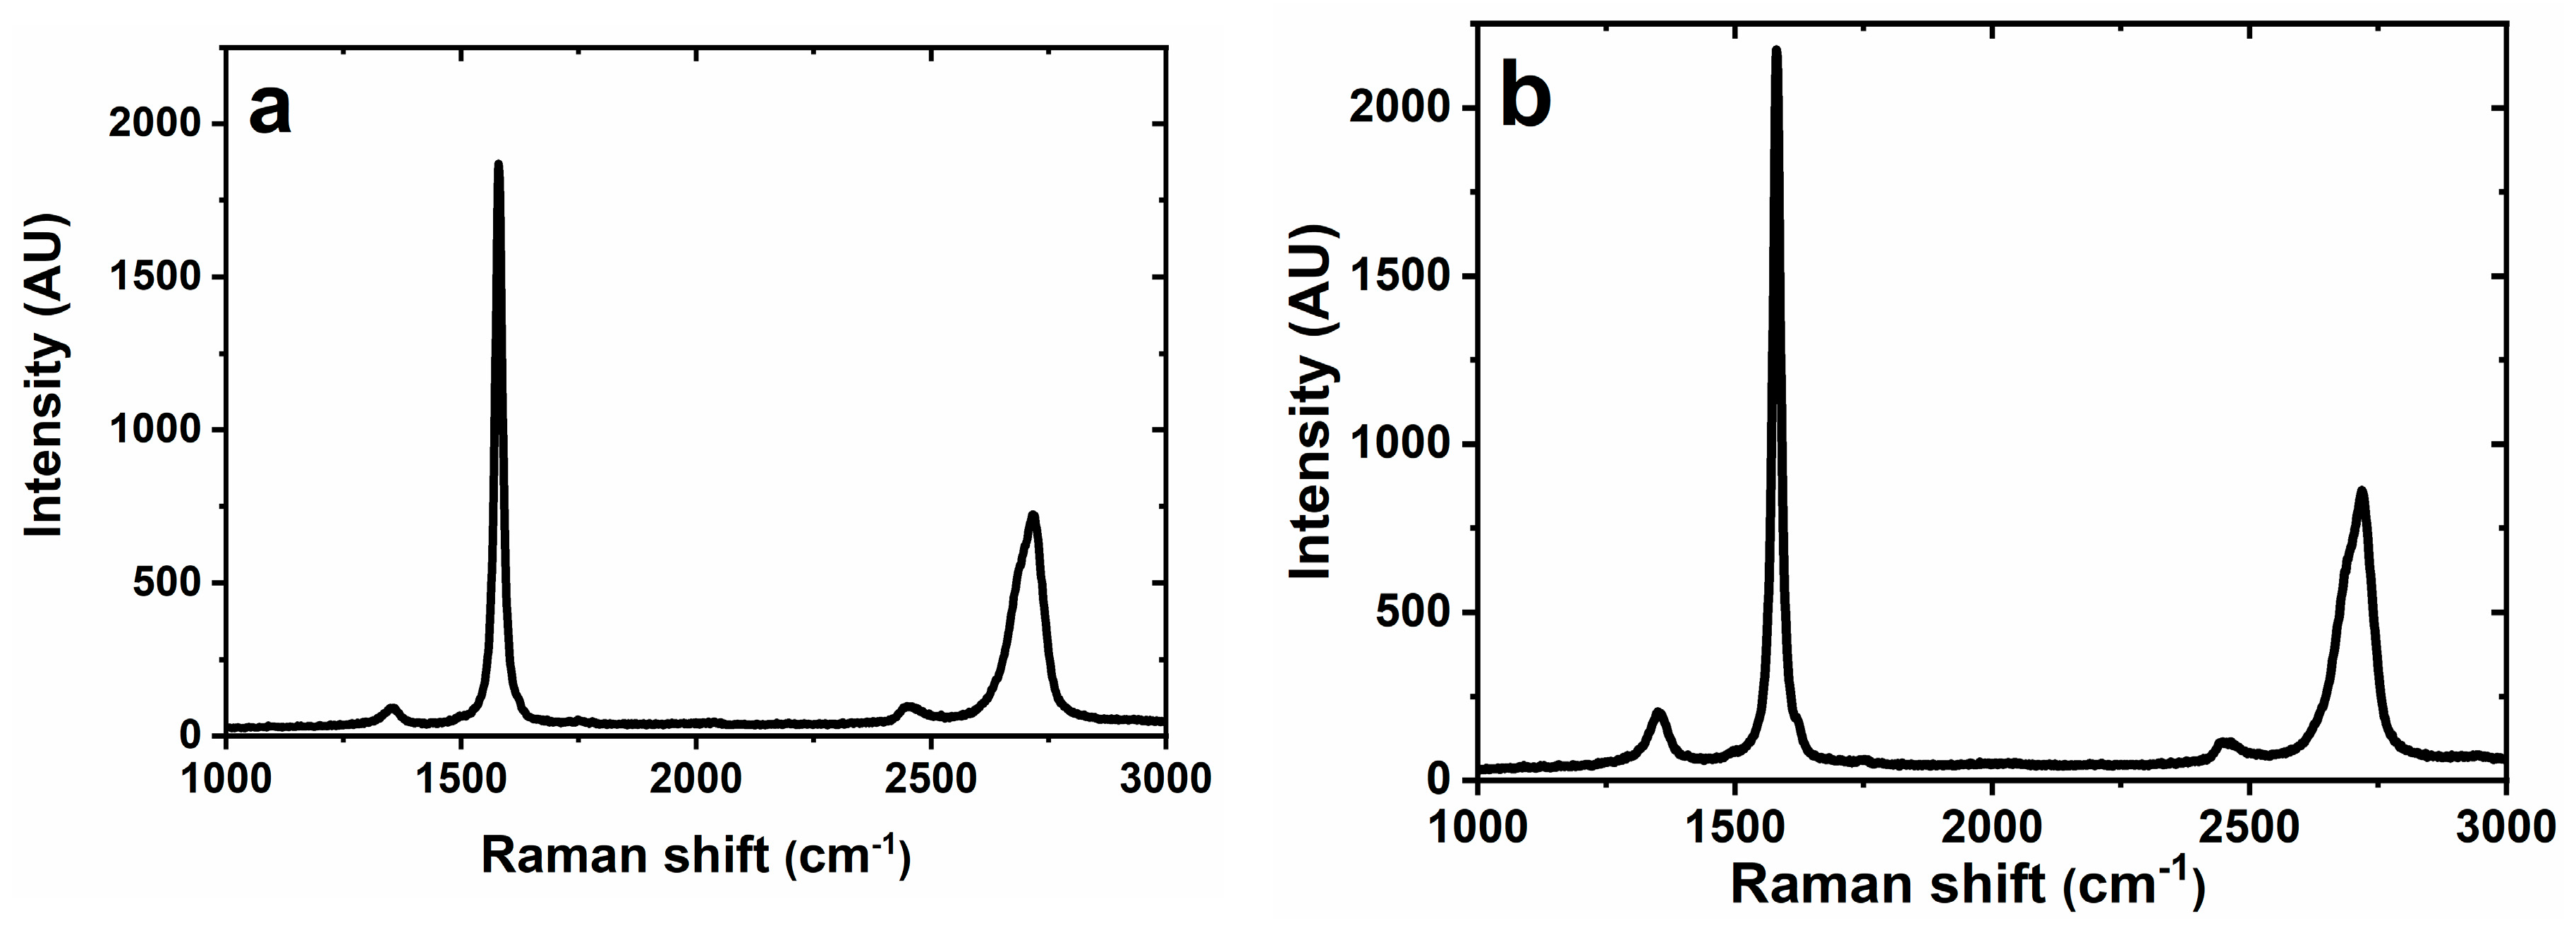
3.2.2. Raman Spectroscopy

Only two interfaces were characterized using Raman spectroscopy — GSPE before and after activation (Figure 4). The positions of the peaks at ~1350 cm−1 (D peak), ~1580 cm−1 (G peak) and ~2720 cm−1 (2D peak) are consistent with the literature [36,37] describing graphene-based screen-printed electrodes and peak at ~2450 cm−1 can be attributed to D+D´´ peak [38]. The position of the G peak at ~1580 cm−1 indicates the presence of multi-layered graphene or graphite [37]. The same conclusion can be judged from position of 2D peak at ~2720 cm−1, but small shoulder at ~2685 cm−1 indicated presence of two-layered or three-layered graphene flakes [39]. Presence of few-layered graphene flakes can be confirmed by low D/G value of 0.0495 (before activation) and 0.0944 (after activation) [40]. A positive shift of 2D peak from 2716 cm−1 (before activation) towards 2719 cm−1 (after activation) and a positive shift of G peak after activation (1580 cm−1 → 1581 cm−1) indicates that the sample after activation is more oxidized [41]. Also an increase of D/G ratio from 0.043 ± 0.010 to 0.080 ± 0.015 after activation indicates presence of oxidized species indicating presence of defects [32]. All data obtained from Raman spectroscopy are summarized in Table S5.

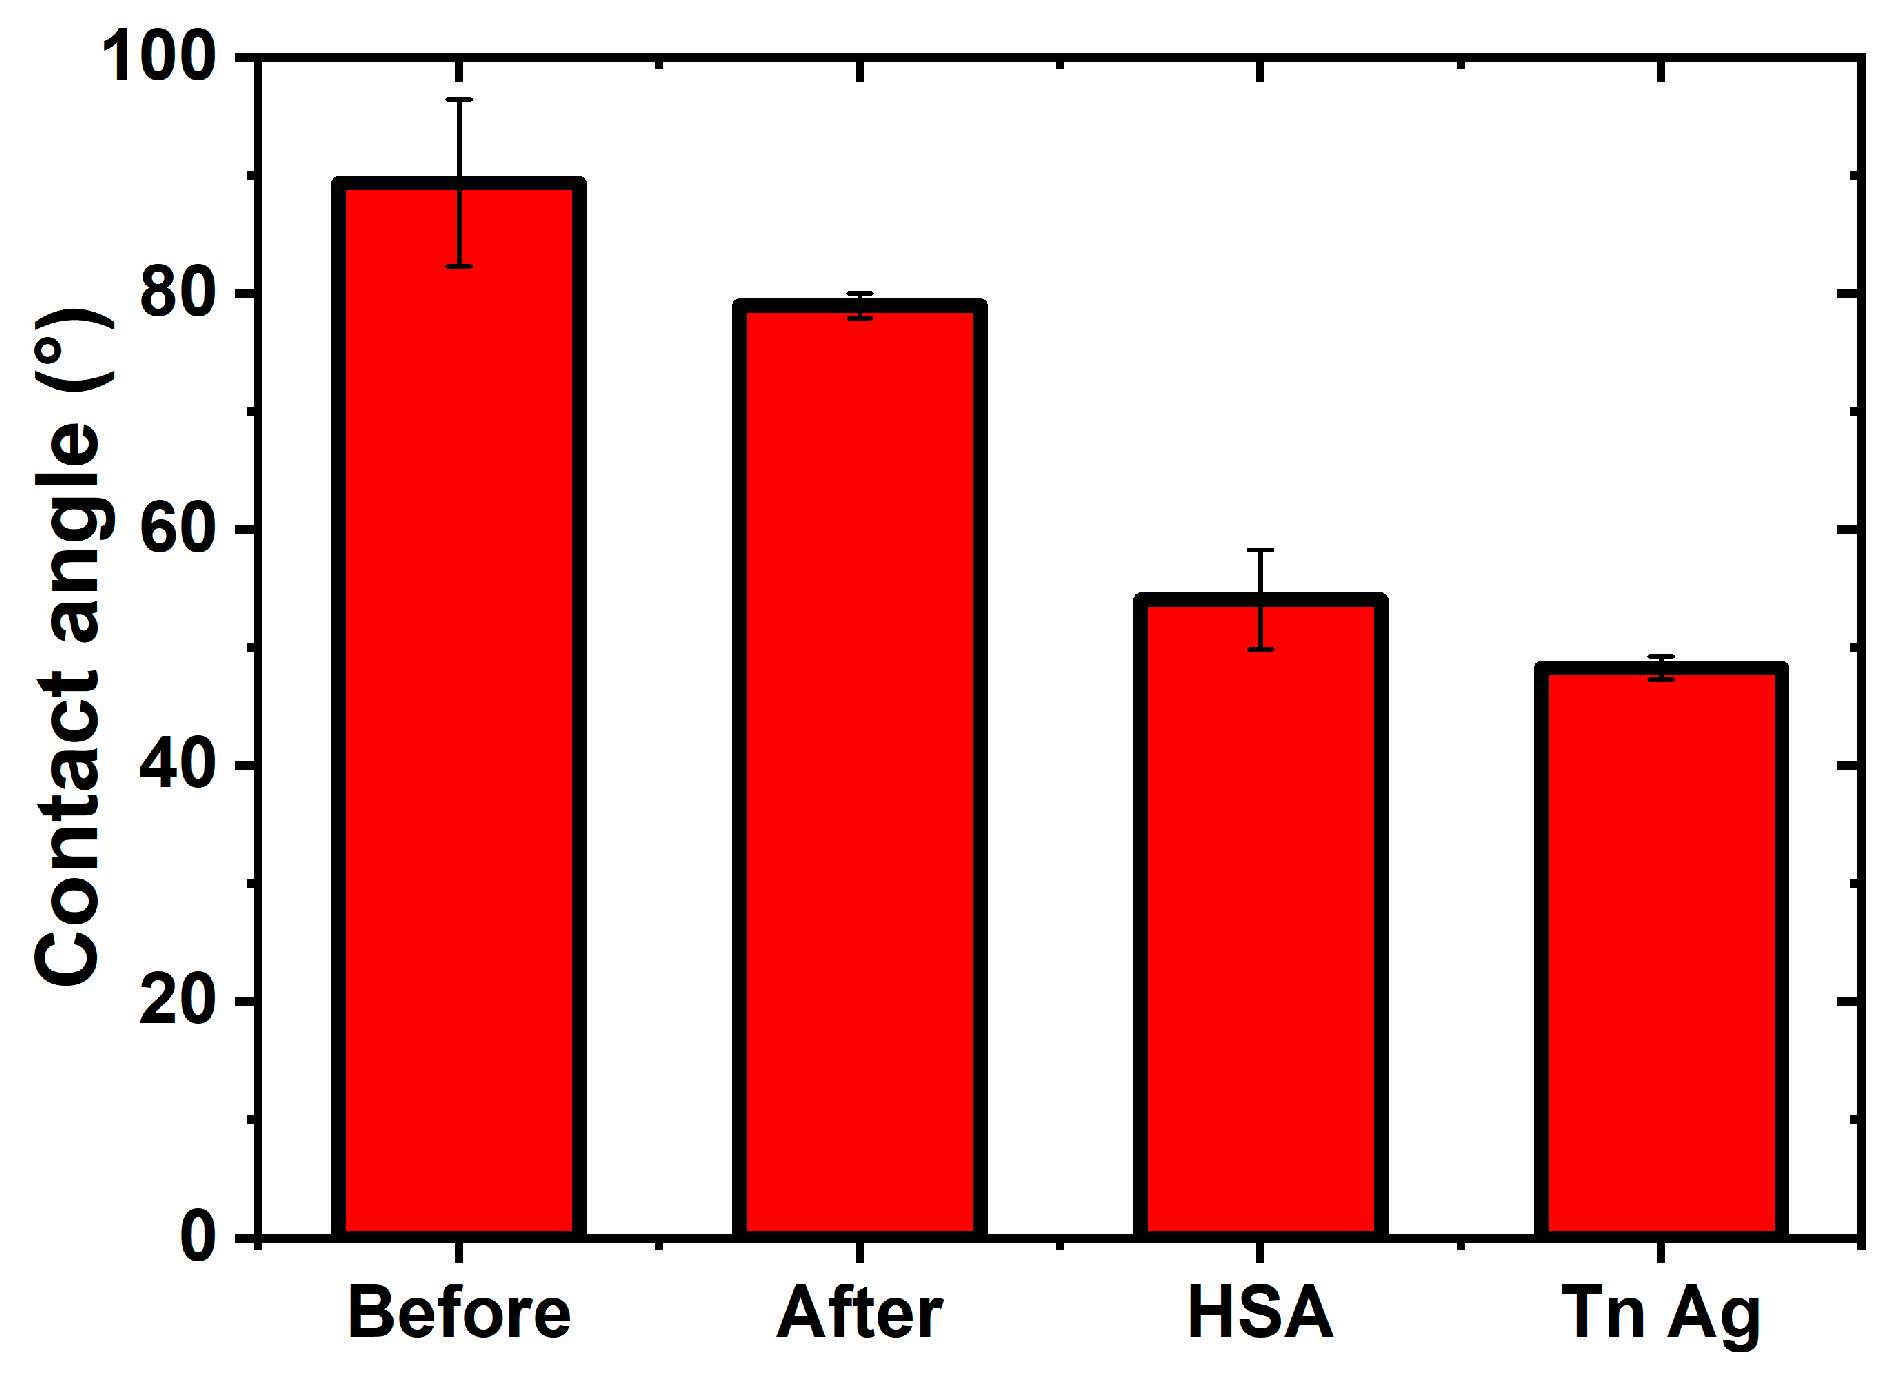
3.2.3. Contact Angle Measurements

The step-by-step built-up of the glycan biosensor can be monitored by changes in the contact angle measurements. Such analysis really confirmed that the highest contact angle was observed on GSPE (89.4 ± 7.1)°, and by subsequent surface patterning contact angle decreased to (79.0 ± 1.0)° (after anodic activation), (54.1 ± 4.1)° (after HSA immobilization) and finally reached the value of (48.3 ± 1.0)° for the surface with Tn antigen immobilized to it (Figure 5). Such assays confirmed the successful built-up of the biosensor interface. An increase of hydrophilicity of the graphene electrode by electrochemical oxidation is obvious due to delivery of oxygen containing groups. Upon incubation of the modified electrode with HSA further increase in hydrophilicity observed can be explained by delivery of high density of amino acids having a diverse range of functional groups and charges. Final incubation with Tn antigen further increases hydrophilicity of the surface by delivering high density of hydrophilic -OH groups.

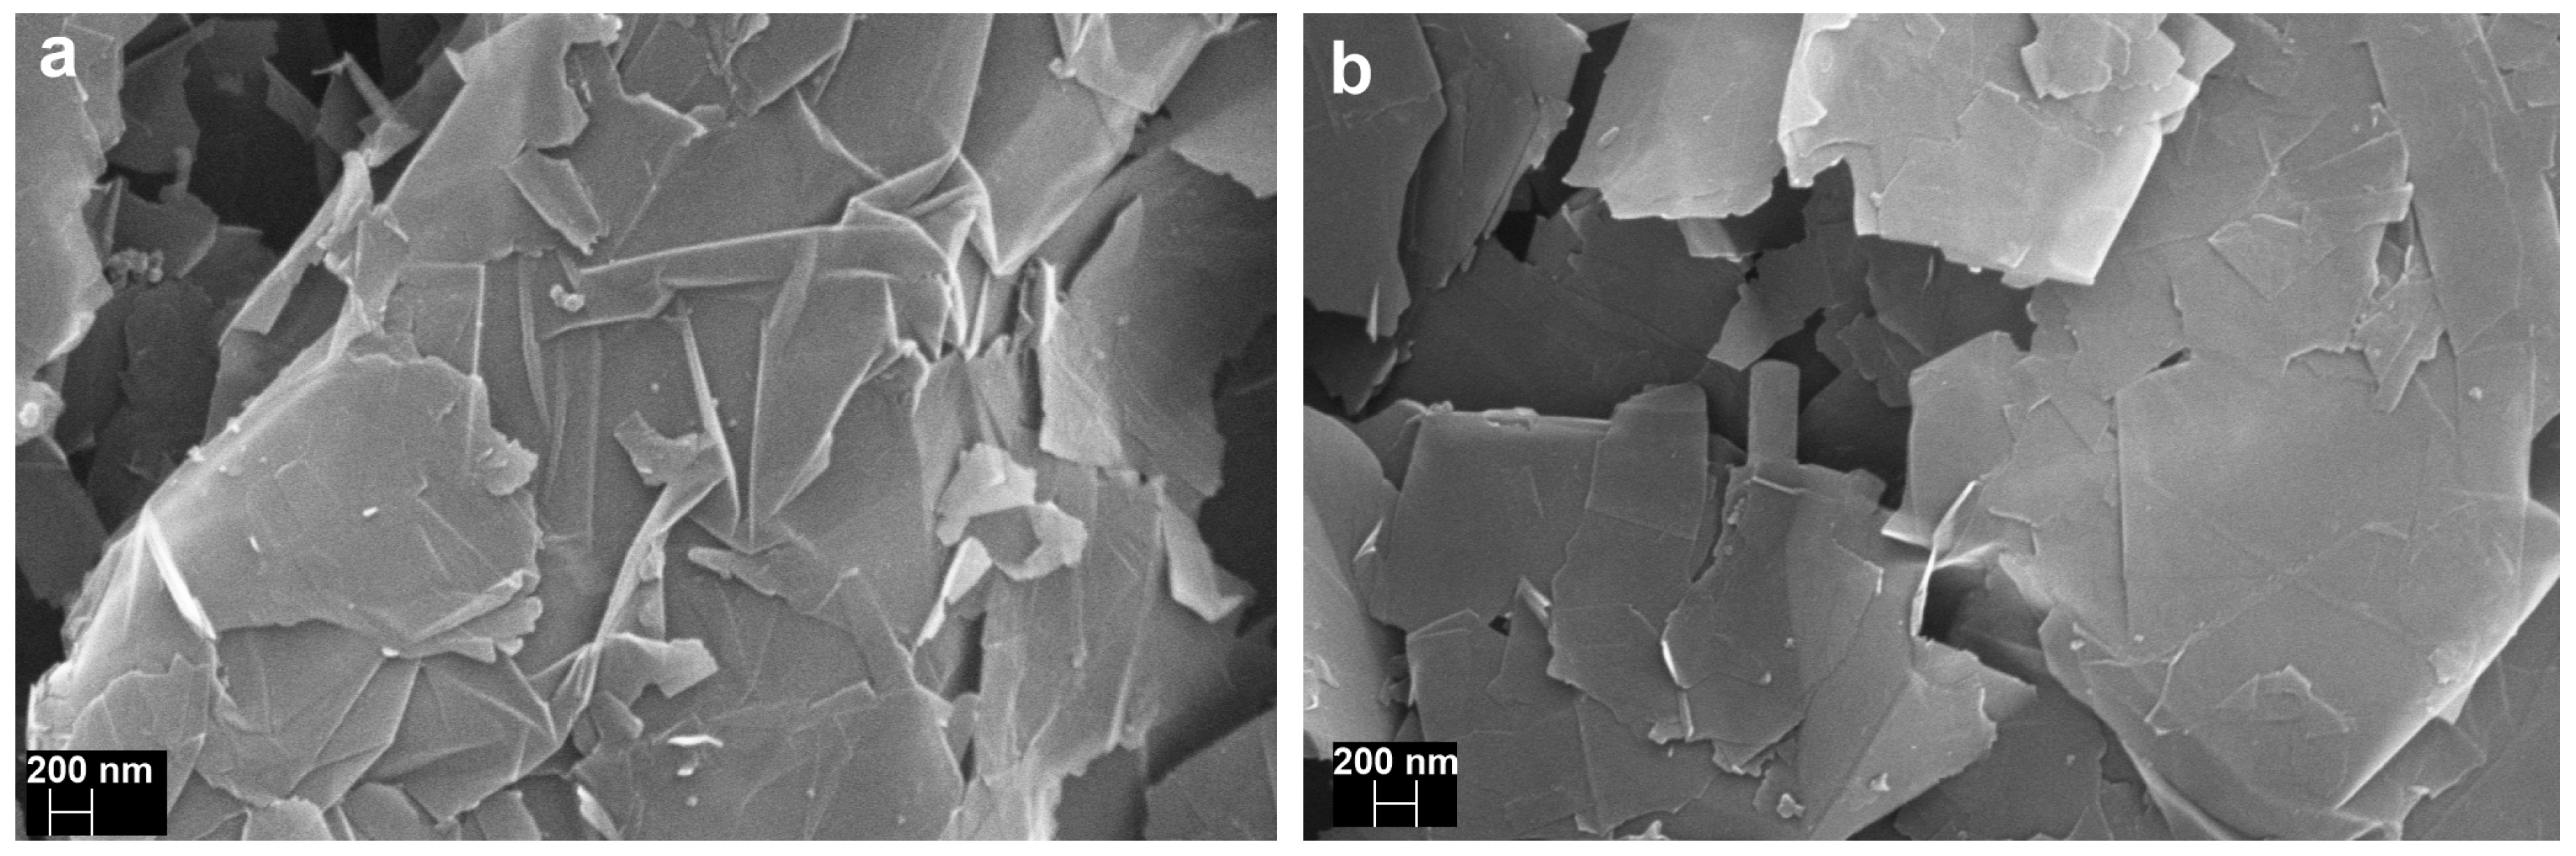
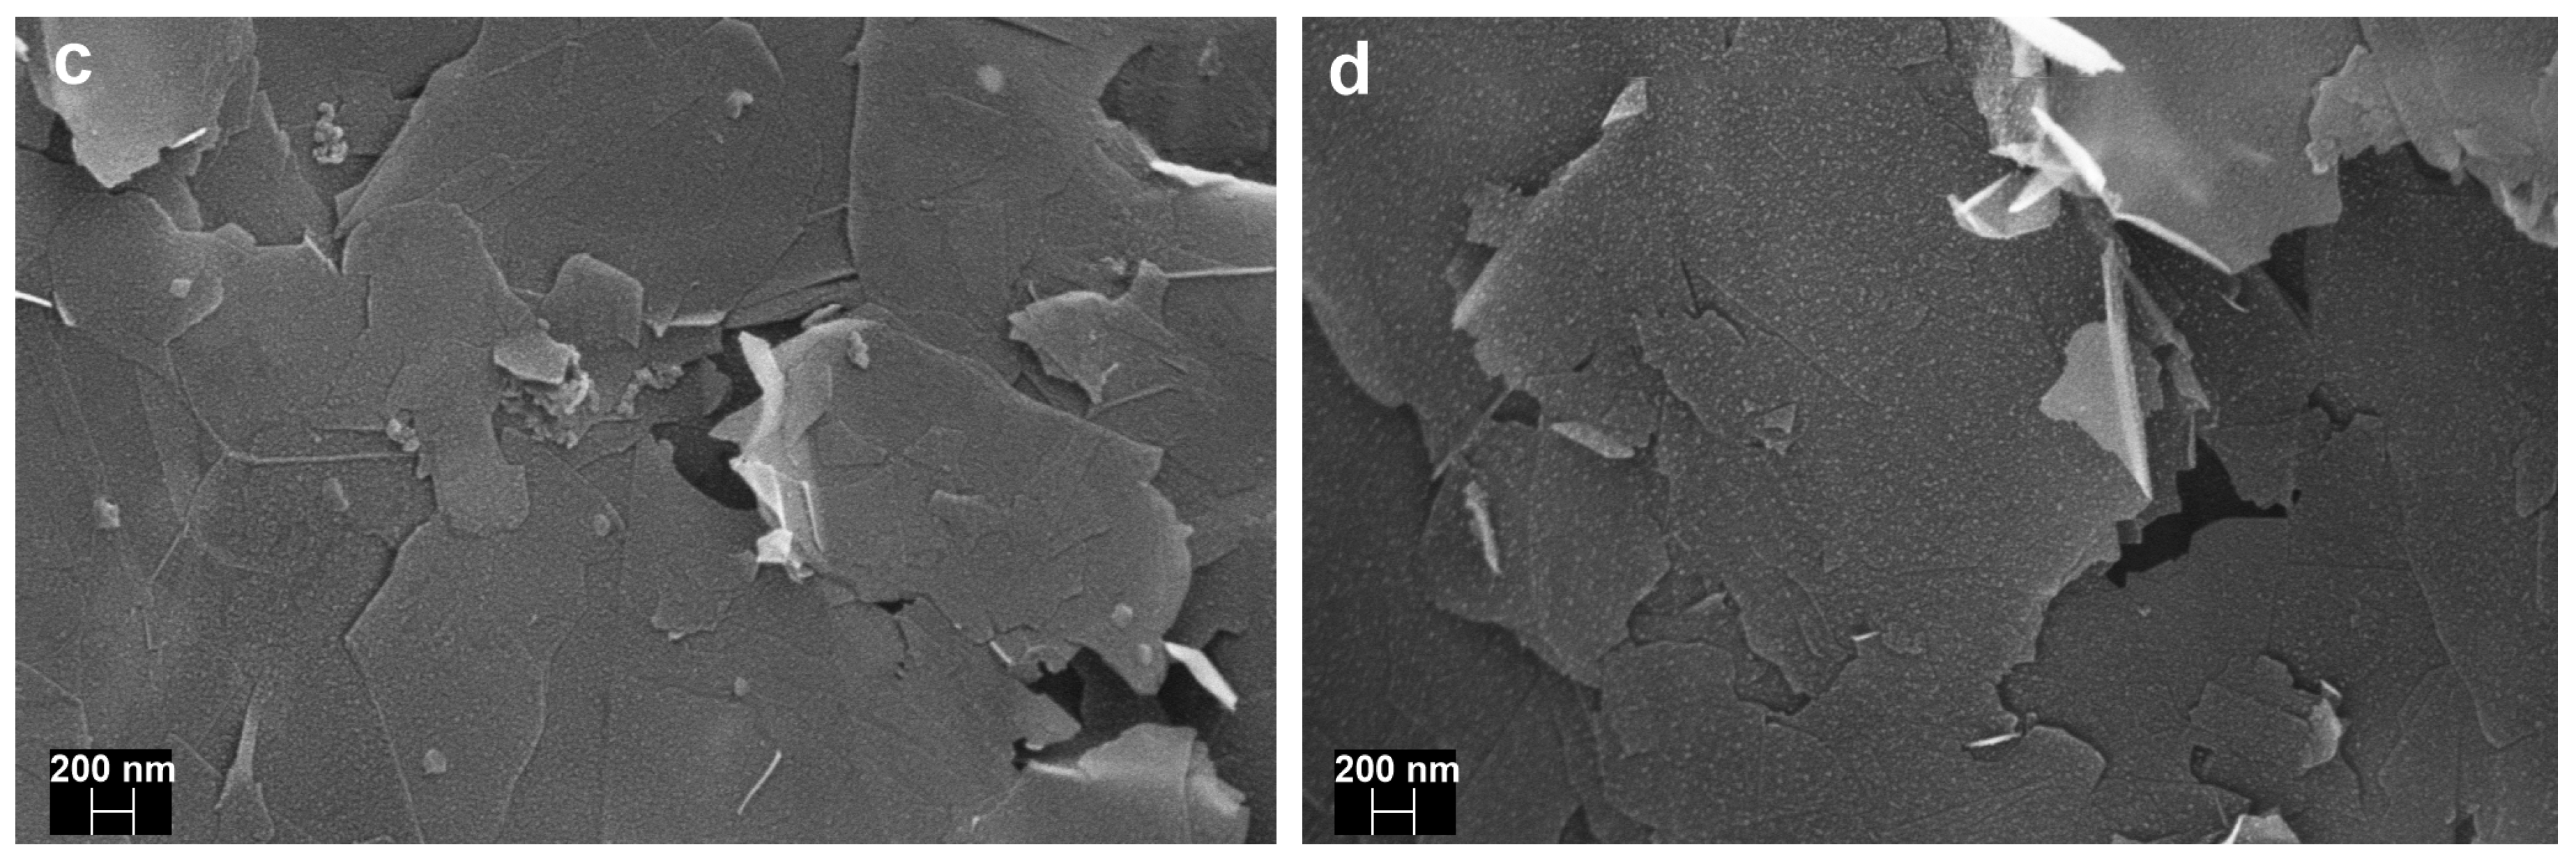
3.2.4. Scanning Electron Microscopy (SEM)

SEM analysis confirmed presence of graphene flakes of different sizes re-stacked on the surface of GSPE (Figure 6a,b). SEM images revealed that the morphology of the interface after bioconjugation did not change (Figure 6c,d). More SEM images can be found in ESM file (Figures S2 and S3).

3.2.5. EDX Measurements

EDX is able to provide information about the composition of quite thick interfacial layer (1–2 µm). The results obtained by this method suggest that a slight increase of carbon content was observed upon anodic activation of graphene SPE i.e., from a value of (88.1 ± 2.3)% to a value of (92.8 ± 1.7)%. At the same time, the oxygen content decreased from a value of (9.5 ± 1.2)% to a value of (6.7 ± 1.6)%. After HSA attachment, a significant N content was present on the surface i.e., (17.5 ± 0.7)% due to deposition of amino acids. After Tn antigen immobilization the N content slightly dropped with a mild increase of O content (see Table S6 in the ESM file). Thus we can conclude successful immobilization of both HSA and Tn antigen on the electrode surface.

3.2.6. Secondary Ion Mass Spectrometry (SIMS) Measurements

SIMS experiments confirmed successful immobilization of HSA molecules as a nanoscaffold on activated GPSE (Figure S4 vs. Figure S5). While SIMS spectra on activated GPSE with immobilized HSA confirm presence of several types of ion fragments containing N element (i.e., CH4N+, C2H6N+, C3H8N+, C5H10N+, C11H24N+, etc.) in a positive polarity (Figure S5), on activated GPSE such ion fragments were not identified (Figure S4). This indicated successful modification of activated GPSE by HSA molecules.

3.2.7. Atomic Force Microscopy (AFM) Measurements

AFM experiments were run on activated GPSE electrode without any HSA immobilized and on the activated GPSE with HSA covalently attached on the activated GPSE. The results showed that on the interface with HSA immobilized there are present features having height of ~5.5 nm (Figure S6), what is in an excellent agreement with expected size of the HSA molecule. Therefore, HSA molecules were successfully attached on the interface.

3.2.8. The Glycan Biosensor

Finally, after optimization of the interfacial layer designs and its characterization, the glycan biosensor was constructed with the Tn antigen immobilized on a HSA-modified GSPE. The results indicated a negligible interaction for a negative control (Con A), significantly higher sensitivity of –(2.82 ± 0.34) % M−1 for a positive control (DBA, R2 = 0.918) and a high sensitivity of −(1.37 ± 0.14) % M−1 for the analyte (2C4, R2 = 0.940) (Figure 7). The results indicate that average non-specific binding is approximately 3.3% of the specific response towards DBA lectin and only 6.9% of the specific response towards the 2C4 analyte. The results obtained here are consistent with our previous report that DBA lectin is 1.3-fold better binder than 2C4 antibody towards Tn antigen immobilized on HSA on gold [35], but in case of immobilization of Tn antigen on HSA attached to GSPE, the sensitivity ratio DBA:2C4 is much higher i.e., 2.1-fold. Specific binding of 2C4 towards the Tn antigen was confirmed in the SPR study (Figure 8), while when using PNA (Peanut agglutinin) lectin as a control no binding was observed. PNA was in the SPR experiment applied as a control, since Con A would interfere with the dextran matrix of the CM5 SPR chip. Reproducibility of the glycan biosensor preparation is satisfactory within 10–12%. Detection limit for analysis of DBA and 2C4 is in low aM level (Table 1).
Recently we summarized the applications of graphene-based electrochemical glycan biosensor for detection of a wide range of analytes including proteins, lectins, intact viruses and human liver cancer cells [22]. Some of these devices were built on graphene patterned interfaces using either field-effect transistor based biosensing [42] or a transducing scheme involving immobilized glycans with a built in redox moiety [43,44]. Such graphene-based glycan devices could detect analytes down to nM level, what means that our electrochemical glycan biosensor based on Tn antigen immobilized on HSA layer attached to graphene SPE is few orders of magnitude more sensitive compared to these devices [42,43,44] (Table 1). This suggests that quite high limit of detection obtained using devices previously published [42,43,44] is a result of detection platform applied rather than the attribute of graphene modified interface.

4. Conclusions

In this study we show that careful design of an interfacial layer on GSPE leads to the development of an ultrasensitive glycan biosensor able to detect its analyte — a tumor-associated antibody— down to low aM level. At the same time the glycan biosensor is able to selectively detect its analyte with only a minute response after addition of a control protein (Con A). Reproducibility of the biosensor preparation is satisfactory, within 10–12%. When compared with other electrochemical glycan based biosensors, our device is much more sensitive in terms of limit of detection achieved [42,43,44]. There is still a need to investigate robustness of the label-free assay system in an array format of analysis and to compare it with other commercially available label-free systems such as surface-plasmon resonance-based ones.

Supplementary Materials

The following data are available online at https://www.mdpi.com/1424-8220/19/24/5409/s1, Figure S1: Binding of DBA on the glycan biosensor at higher concentration of DBA, Figure S2: SEM images of bare GSPE at different magnifications. Figure S3: SEM images of activated graphene SPE at different magnifications, Table S1: Basic electrochemical properties obtained using ferricyanide as a redox probe on GSPE., Table S2: Basic electrochemical properties obtained using ferricyanide as a redox probe on activated GSPE., Table S3: Basic electrochemical properties obtained using ferricyanide as a redox probe on activated GSPE with immobilized HSA., Table S4: Basic electrochemical properties obtained using ferricyanide as a redox probe on activated GSPE with immobilized HSA., Table S5: Characterization of plain GSPE before and after activation using Raman spectroscopy, Table S6: EDX analysis of various interfaces.

Author Contributions

Conceptualization: J.T.; P.K.; Methodology: F.K., A.B., L.L., M.J., D.V.; Investigation: F.K.; A.B., L.L., M.J., D.V.; Resources: O.B., B.J.; Writing—original draft preparation: F.K.; A.B., L.L., M.J., D.V.; Writing—review and editing: B.J., O.B., P.K., J.T.; Visualization: F.K.; A.B., L.L., M.J., D.V., P.K., J.T.; Project administration: P.K., J.T.; Funding acquisition: P.K., J.T.

Funding

The financial support received from the Slovak Scientific Grant Agency VEGA 2/0137/18 and 2/0090/16 from the Slovak Research and Development Agency APVV 17-0300 is acknowledged. This publication is the result of the project implementation: Centre for materials, layers and systems for applications and chemical processes under extreme conditions—Stage I, ITMS no.: 26240120007, supported by the ERDF. This publication was supported by Qatar University Collaborative Grant QUCG-CAM-19/20-2. The findings achieved herein are solely the responsibility of the authors.

Acknowledgments

We would like to dedicate this work to deceased Emil Paleček.

Conflicts of Interest

The authors declare no conflict of interest.

References

  1. Ho, W.L.; Hsu, W.M.; Huang, M.C.; Kadomatsu, K.; Nakagawara, A. Protein glycosylation in cancers and its potential therapeutic applications in neuroblastoma. J. Hematol. Oncol. 2016, 9, 100. [Google Scholar] [CrossRef] [PubMed] [Green Version]
  2. Zhang, X.; Liu, M.; Mao, Y.; Xu, Y.; Niu, S. Ultrasensitive photoelectrochemical immunoassay of antibody against tumor-associated carbohydrate antigen amplified by functionalized graphene derivates and enzymatic biocatalytic precipitation. Biosens. Bioelectron. 2014, 59, 21–27. [Google Scholar] [CrossRef] [PubMed]
  3. Moremen, K.W.; Tiemeyer, M.; Nairn, A.V. Vertebrate protein glycosylation: Diversity, synthesis and function. Nat. Rev. Mol. Cell Biol. 2012, 13, 448–462. [Google Scholar] [CrossRef] [PubMed] [Green Version]
  4. Torre, L.A.; Bray, F.; Siegel, R.L.; Ferlay, J.; Lortet-Tieulent, J.; Jemal, A. Global cancer statistics. 2012. CA Cancer J. Clin. 2015, 65, 87–108. [Google Scholar] [CrossRef] [Green Version]
  5. Siegel, R.L.; Miller, K.D.; Jemal, A. Cancer statistics, 2017. CA A Cancer J. Clin. 2017, 67, 7–30. [Google Scholar] [CrossRef] [Green Version]
  6. Springer, G.F. T and Tn, general carcinoma autoantigens. Science 1984, 224, 1198–1206. [Google Scholar] [CrossRef]
  7. Itzkowitz, S.H.; Yuan, M.; Montgomery, C.K.; Kjeldsen, T.; Takahashi, H.K.; Bigbee, W.L.; Kim, Y.S. Expression of Tn, Sialosyl-Tn, and T Antigens in Human Colon Cancer. Cancer Res. 1989, 49, 197–204. [Google Scholar]
  8. Richichi, B.; Thomas, B.; Fiore, M.; Bosco, R.; Qureshi, H.; Nativi, C.; Renaudet, O.; BenMohamed, L. A cancer therapeutic vaccine based on clustered Tn-antigen mimetics induces strong antibody-mediated protective immunity. Angew. Chem.-Int. Ed. 2014, 53, 11917–11920. [Google Scholar] [CrossRef]
  9. Gill, D.J.; Tham, K.M.; Chia, J.; Wang, S.C.; Steentoft, C.; Clausen, H.; Bard-Chapeau, E.A.; Bard, F.A. Initiation of GalNAc-type O-glycosylation in the endoplasmic reticulum promotes cancer cell invasiveness. Proc. Natl. Acad. Sci. USA 2013, 110, E3152–E3161. [Google Scholar] [CrossRef] [Green Version]
  10. Moreau, R.; Dausset, J.; Bernard, J.; Moullec, J. Acquired hemolytic anemia with polyagglutinability of erythrocytes by a new factor present in normal blood. Bull. Mem. Soc. Med. Hop. Paris 1957, 73, 569–587. [Google Scholar]
  11. Persson, N.; Stuhr-Hansen, N.; Risinger, C.; Mereiter, S.; Polónia, A.; Polom, K.; Kovács, A.; Roviello, F.; Reis, C.A.; Welinder, C.; et al. Epitope mapping of a new anti-Tn antibody detecting gastric cancer cells. Glycobiology 2017, 27, 635–645. [Google Scholar] [CrossRef] [PubMed] [Green Version]
  12. Ho, W.L.; Chou, C.H.; Jeng, Y.M.; Lu, M.Y.; Yang, Y.L.; Jou, S.T.; Lin, D.T.; Chang, H.H.; Lin, K.H.; Hsu, W.M.; et al. GALNT2 suppresses malignant phenotypes through IGF-1 receptor and predicts favorable prognosis in neuroblastoma. Oncotarget 2014, 5, 12247–12259. [Google Scholar] [CrossRef] [PubMed] [Green Version]
  13. Ganneau, C.; Simenel, C.; Emptas, E.; Courtiol, T.; Coïc, Y.M.; Artaud, C.; Dériaud, E.; Bonhomme, F.; Delepierre, M.; Leclerc, C.; et al. Large-scale synthesis and structural analysis of a synthetic glycopeptide dendrimer as an anti-cancer vaccine candidate. Org. Biomol. Chem. 2017, 15, 114–123. [Google Scholar] [CrossRef] [PubMed]
  14. Sharma, P.; Allison, J.P. The future of immune checkpoint therapy. Science 2015, 348, 56. [Google Scholar] [CrossRef] [PubMed]
  15. Welinder, C.; Baldetorp, B.; Blixt, O.; Grabau, D.; Jansson, B. Primary Breast Cancer Tumours Contain High Amounts of IgA1 Immunoglobulin: An Immunohistochemical Analysis of a Possible Carrier of the Tumour-Associated Tn Antigen. PLoS ONE 2013, 8, e61749. [Google Scholar] [CrossRef] [PubMed] [Green Version]
  16. Hoja-Łukowicz, D.; Przybyło, M.; Pocheć, E.; Drabik, A.; Silberring, J.; Kremser, M.; Schadendorf, D.; Laidler, P.; Lityńska, A. The new face of nucleolin in human melanoma, Cancer Immunology. Immunotherapy 2009, 58, 1471–1480. [Google Scholar] [CrossRef]
  17. Qin, Q.; Yin, Z.; Wu, X.; Haas, K.M.; Huang, X. Valency and density matter: Deciphering impacts of immunogen structures on immune responses against a tumor associated carbohydrate antigen using synthetic glycopolymers. Biomaterials 2016, 101, 189–198. [Google Scholar] [CrossRef] [Green Version]
  18. Díaz-Zaragoza, M.; Hernández-Ávila, R.; Viedma-Rodríguez, R.; Arenas-Aranda, D.; Ostoa-Saloma, P. Natural and adaptive IgM antibodies in the recognition of tumor-associated antigens of breast cancer (Review). Oncol. Rep. 2015, 34, 1106–1114. [Google Scholar] [CrossRef] [Green Version]
  19. Tkac, J.; Bertok, T.; Hires, M.; Jane, E.; Lorencova, L.; Kasak, P. Glycomics of prostate cancer: Updates. Expert Rev. Proteomics 2019, 16, 65–76. [Google Scholar] [CrossRef]
  20. Tkac, J.; Gajdosova, V.; Hroncekova, S.; Bertok, T.; Hires, M.; Jane, E.; Lorencova, L.; Kasak, P. Prostate-specific antigen glycoprofiling as diagnostic and prognostic biomarker of prostate cancer. Interface Focus 2019, 9, 20180077. [Google Scholar] [CrossRef] [Green Version]
  21. Bertok, T.; Lorencova, L.; Chocholova, E.; Jane, E.; Vikartovska, A.; Kasak, P.; Tkac, J. Electrochemical impedance spectroscopy-based biosensors: Mechanistic principles, analytical examples for assay of protein cancer biomarkers and challenges towards commercialization. ChemElectroChem 2019, 6, 989–1003. [Google Scholar] [CrossRef] [Green Version]
  22. Blsakova, A.; Kveton, F.; Tkac, J. Glycan Modified Interfaces in Biosensing: An Electrochemical Approach. Curr. Opin. Electrochem. 2019, 14, 60–65. [Google Scholar] [CrossRef]
  23. Paleček, E.; Tkáč, J.; Bartošík, M.; Bertók, T.; Ostatná, V.; Paleček, J. Electrochemistry of Nonconjugated Proteins and Glycoproteins. Toward Sensors for Biomedicine and Glycomics. Chem. Rev. 2015, 115, 2045–2108. [Google Scholar] [CrossRef] [PubMed]
  24. Dosekova, E.; Filip, J.; Bertok, T.; Both, P.; Kasak, P.; Tkac, J. Nanotechnology in Glycomics: Applications in Diagnostics, Therapy, Imaging, and Separation Processes. Med. Res. Rev. 2017, 37, 514–626. [Google Scholar] [CrossRef]
  25. Damborska, D.; Bertok, T.; Dosekova, E.; Holazova, A.; Lorencova, L.; Kasak, P.; Tkac, J. Nanomaterial-based biosensors for detection of prostate specific antigen. Microchim. Acta 2017, 184, 3049–3067. [Google Scholar] [CrossRef]
  26. Wang, S.K.; Cheng, C.M. Glycan-based diagnostic devices: Current progress, challenges and perspectives. Chem. Commun. 2015, 51, 16750–16762. [Google Scholar] [CrossRef]
  27. Yang, W.; Ratinac, K.R.; Ringer, S.P.; Thordarson, P.; Gooding, J.J.; Braet, F. Carbon Nanomaterials in Biosensors: Should You Use Nanotubes or Graphene? Angew. Chem. Int. Ed. 2010, 49, 2114–2138. [Google Scholar] [CrossRef]
  28. Novoselov, K.S.; Geim, A.K.; Morozov, S.V.; Jiang, D.; Zhang, Y.; Dubonos, S.V.; Grigorieva, I.V.; Firsov, A.A. Electric field in atomically thin carbon films. Science 2004, 306, 666–669. [Google Scholar] [CrossRef] [Green Version]
  29. Geim, A.K.; Novoselov, K.S. The rise of graphene. Nat. Mater. 2007, 6, 183–191. [Google Scholar] [CrossRef]
  30. Novoselov, K.S.; Fal’ko, V.I.; Colombo, L.; Gellert, P.R.; Schwab, M.G.; Kim, K. A roadmap for graphene. Nature 2012, 490, 192–200. [Google Scholar] [CrossRef]
  31. Ratinac, K.R.; Yang, W.; Gooding, J.J.; Thordarson, P.; Braet, F. Graphene and Related Materials in Electrochemical Sensing. Electroanalysis 2011, 23, 803–826. [Google Scholar] [CrossRef]
  32. Klukova, L.; Filip, J.; Belicky, S.; Vikartovska, A.; Tkac, J. Graphene oxide-based electrochemical label-free detection of glycoproteins down to aM level using a lectin biosensor. Analyst 2016, 141, 4278–4282. [Google Scholar] [CrossRef] [PubMed] [Green Version]
  33. Welinder, C.; Baldetorp, B.; Borrebaeck, C.; Fredlund, B.-M.; Jansson, B. A new murine IgG1 anti-Tn monoclonal antibody with in vivo anti-tumor activity. Glycobiology 2011, 21, 1097–1107. [Google Scholar] [CrossRef] [PubMed] [Green Version]
  34. Wang, J.; Pedrero, M.; Sakslund, H.; Hammerich, O.; Pingarron, J. Electrochemical activation of screen-printed carbon strips. Analyst 1996, 121, 345–350. [Google Scholar] [CrossRef]
  35. Kveton, F.; Blšáková, A.; Hushegyi, A.; Damborsky, P.; Blixt, O.; Jansson, B.; Tkac, J. Optimization of the Small Glycan Presentation for Binding a Tumor-Associated Antibody: Application to the Construction of an Ultrasensitive Glycan Biosensor. Langmuir 2017, 33, 2709–2716. [Google Scholar] [CrossRef] [Green Version]
  36. Karuwan, C.; Wisitsoraat, A.; Phokharatkul, D.; Sriprachuabwong, C.; Lomas, T.; Nacapricha, D.; Tuantranont, A. A disposable screen printed graphene–carbon paste electrode and its application in electrochemical sensing. RSC Adv. 2013, 3, 25792–25799. [Google Scholar] [CrossRef]
  37. Randviir, E.P.; Brownson, D.A.; Metters, J.P.; Kadara, R.O.; Banks, C.E. The fabrication, characterisation and electrochemical investigation of screen-printed graphene electrodes. Phys. Chem. Chem. Phys. 2014, 16, 4598–4611. [Google Scholar] [CrossRef] [Green Version]
  38. Klar, P.; Lidorikis, E.; Eckmann, A.; Verzhbitskiy, I.A.; Ferrari, A.; Casiraghi, C. Raman scattering efficiency of graphene. Physi. Rev. B 2013, 87, 205435. [Google Scholar] [CrossRef] [Green Version]
  39. Wall, M. The Raman Spectroscopy of Graphene and the Determination of Layer Thickness. Thermo Scientific; Thermo Fisher Scientific Inc.: Madison, WI, USA, 2011. [Google Scholar]
  40. Raman Spectroscopy Characterization of Graphene & Graphene Oxide. Available online: https://instanano.com/characterization/experimental/raman-graphene.html (accessed on 1 October 2019).
  41. Vijayarangamuthu, K.; Ahn, S.; Seo, H.; Yoon, S.H.; Park, C.M.; Jeon, K.J. Temporospatial control of graphene wettability. Adv. Mater. 2016, 28, 661–667. [Google Scholar] [CrossRef]
  42. Chen, Y.N.; Vedala, H.; Kotchey, G.P.; Audfray, A.; Cecioni, S.; Imberty, A.; Vidal, S.; Star, A. Electronic Detection of Lectins Using Carbohydrate-Functionalized Nanostructures: Graphene versus Carbon Nanotubes. Acs Nano 2012, 6, 760–770. [Google Scholar] [CrossRef] [Green Version]
  43. Zhu, B.W.; Cai, L.; He, X.P.; Chen, G.R.; Long, Y.T. Anthraquinonyl glycoside facilitates the standardization of graphene electrodes for the impedance detection of lectins. Chem. Cent. J. 2014, 8, 6. [Google Scholar] [CrossRef] [PubMed] [Green Version]
  44. He, X.P.; Zhu, B.W.; Zang, Y.; Li, J.; Chen, G.R.; Tian, H.; Long, Y.T. Dynamic tracking of pathogenic receptor expression of live cells using pyrenyl glycoanthraquinone-decorated graphene electrodes. Chem. Sci. 2015, 6, 1996–2001. [Google Scholar] [CrossRef] [PubMed] [Green Version]
Figure 1. (a) Modification of graphene screen-printed electrode (GSPE) by electrochemical oxidation (step 1), covalent immobilization of human serum albumin (HSA) as a natural nanoscaffold (step 2) and a covalent immobilization of a Tn antigen to HSA (step 3); The final step is incubation with the analyte protein (step 4); (b) Typical DPV obtained on the electrode incubated with plain buffer (red) and after incubation with 9×10⁻¹² M DBA lectin. Relative response towards DBA is calculated as ΔI=(IpbufferIpDBA)/Ipbuffer×100.
Sensors 19 05409 g001
Figure 2. Optimization of the glycan biosensor preparation. (a) Application of an anodic potential of +1.5 V vs. Ag/AgCl/3 M KCl or (b) of +1.7 V vs. Ag/AgCl/3 M KCl to activate graphene SPE and (c) optimization of the effect of HSA concentration (expressed in g L−1) on the glycan biosensor sensitivity towards DBA lectin as an analyte.
Sensors 19 05409 g002
Figure 3. CV of 2.5 mM ferricyanide in PBS buffer on various electrodes assayed at a scan rate of 0.1 V s−1. Electrochemical surface area for GSPE is (0.149 ± 0.009) cm2 (roughness factor of 1.19) and for activated GSPE is (0.171 ± 0.010) cm2 (roughness factor of 1.36).
Sensors 19 05409 g003
Figure 4. Raman spectra obtained for (a) plain graphene SPE and for (b) activated graphene SPE
Sensors 19 05409 g004
Figure 5. Contact angle measurements on various interfaces during preparation of the glycan biosensor.
Sensors 19 05409 g005
Figure 6. Scanning electron micrographs of (a) a plain graphene SPE, (b) an activated graphene SPE, (c) an electrode surface after HSA attachment and (d) an electrode after covalent immobilization of Tn antigen on the HSA layer. The scale in all SEM images is 200 nm.
Sensors 19 05409 g006aSensors 19 05409 g006b
Figure 7. The binding preference of the Tn glycan biosensor was investigated using a negative control (Con A, a lectin not recognizing Tn antigen), a positive control (DBA lectin, recognizing Tn antigen) and an analyte (a tumor associated antibody 2C4). DPV was measured in an electrolyte containing 5 mM potassium hexacyanoferrate (II) trihydrate and 0.01 M PBS, pH 7.4. The parameters applied for the differential pulse voltammetry were as follows: 60 s accumulation time at 0.2 V, 50 ms modulation time, 0.5 s interval time, 25 mV modulation amplitude, and 5 mV step. Linear regression fit for DBA: ΔI = (−55.6 ± 4.8) + (−2.82 ± 0.34)×c, R2 = 0.918 and for the 2C4 antibody ΔI = (−28.3 ± 2.0) + (−1.37 ± 0.14)×c, R2 = 0.940. The plot for Con A could not be linearly fitted.
Sensors 19 05409 g007
Figure 8. SPR experiment showing binding of 2C4 antibody towards the Tn antigen. Association phase is indicated by a green timeframe, while dissociation phase by a red timeframe as shown in the upper part of the figure. The SPR study was carried out with the following concentration of 2C4: 50 nM, 25 nM, 12.5 nM, 6.3 nM and 3.1 nM.
Sensors 19 05409 g008
Table 1. Performance of graphene-based electrochemical glycan biosensors.
ElectrodeGlycanImmobilizationDetectionAnalyteLODRef.
CCGpyrene-functionalized monosaccharidesπ–π stacking interactionsFET sensingLectins~1 nM[42]
grapheneantraquinonyl-modified
monosaccharides
π–π stacking interactionsDPVLectins~1 µM[43]
graphene SPEpyrenyl-anthraquinone
monosaccharides
π–π stacking interactionsDPVLectins~50 nM[44]
graphene SPEpyrenyl-anthraquinone
monosaccharides
π–π stacking interactionsDPVCells~200-400 cells/mL[44]
oxidized grapheneTn antigencovalent on HSADPVLectin
(DBA)
~1 aMThis work
oxidized grapheneTn antigencovalent on HSADPVAntibody
(2C4)
~10 aMThis work
CCG—chemically converted graphene using hydrazine, DPV—differential pulse voltammetry, FET - field-effect transistor, LOD—limit of detection, SPE—screen-printed electrodes.

