Field Test of Excess Pore Water Pressure at Pile–Soil Interface Caused by PHC Pipe Pile Penetration Based on Silicon Piezoresistive Sensor

Abstract
:1. Introduction
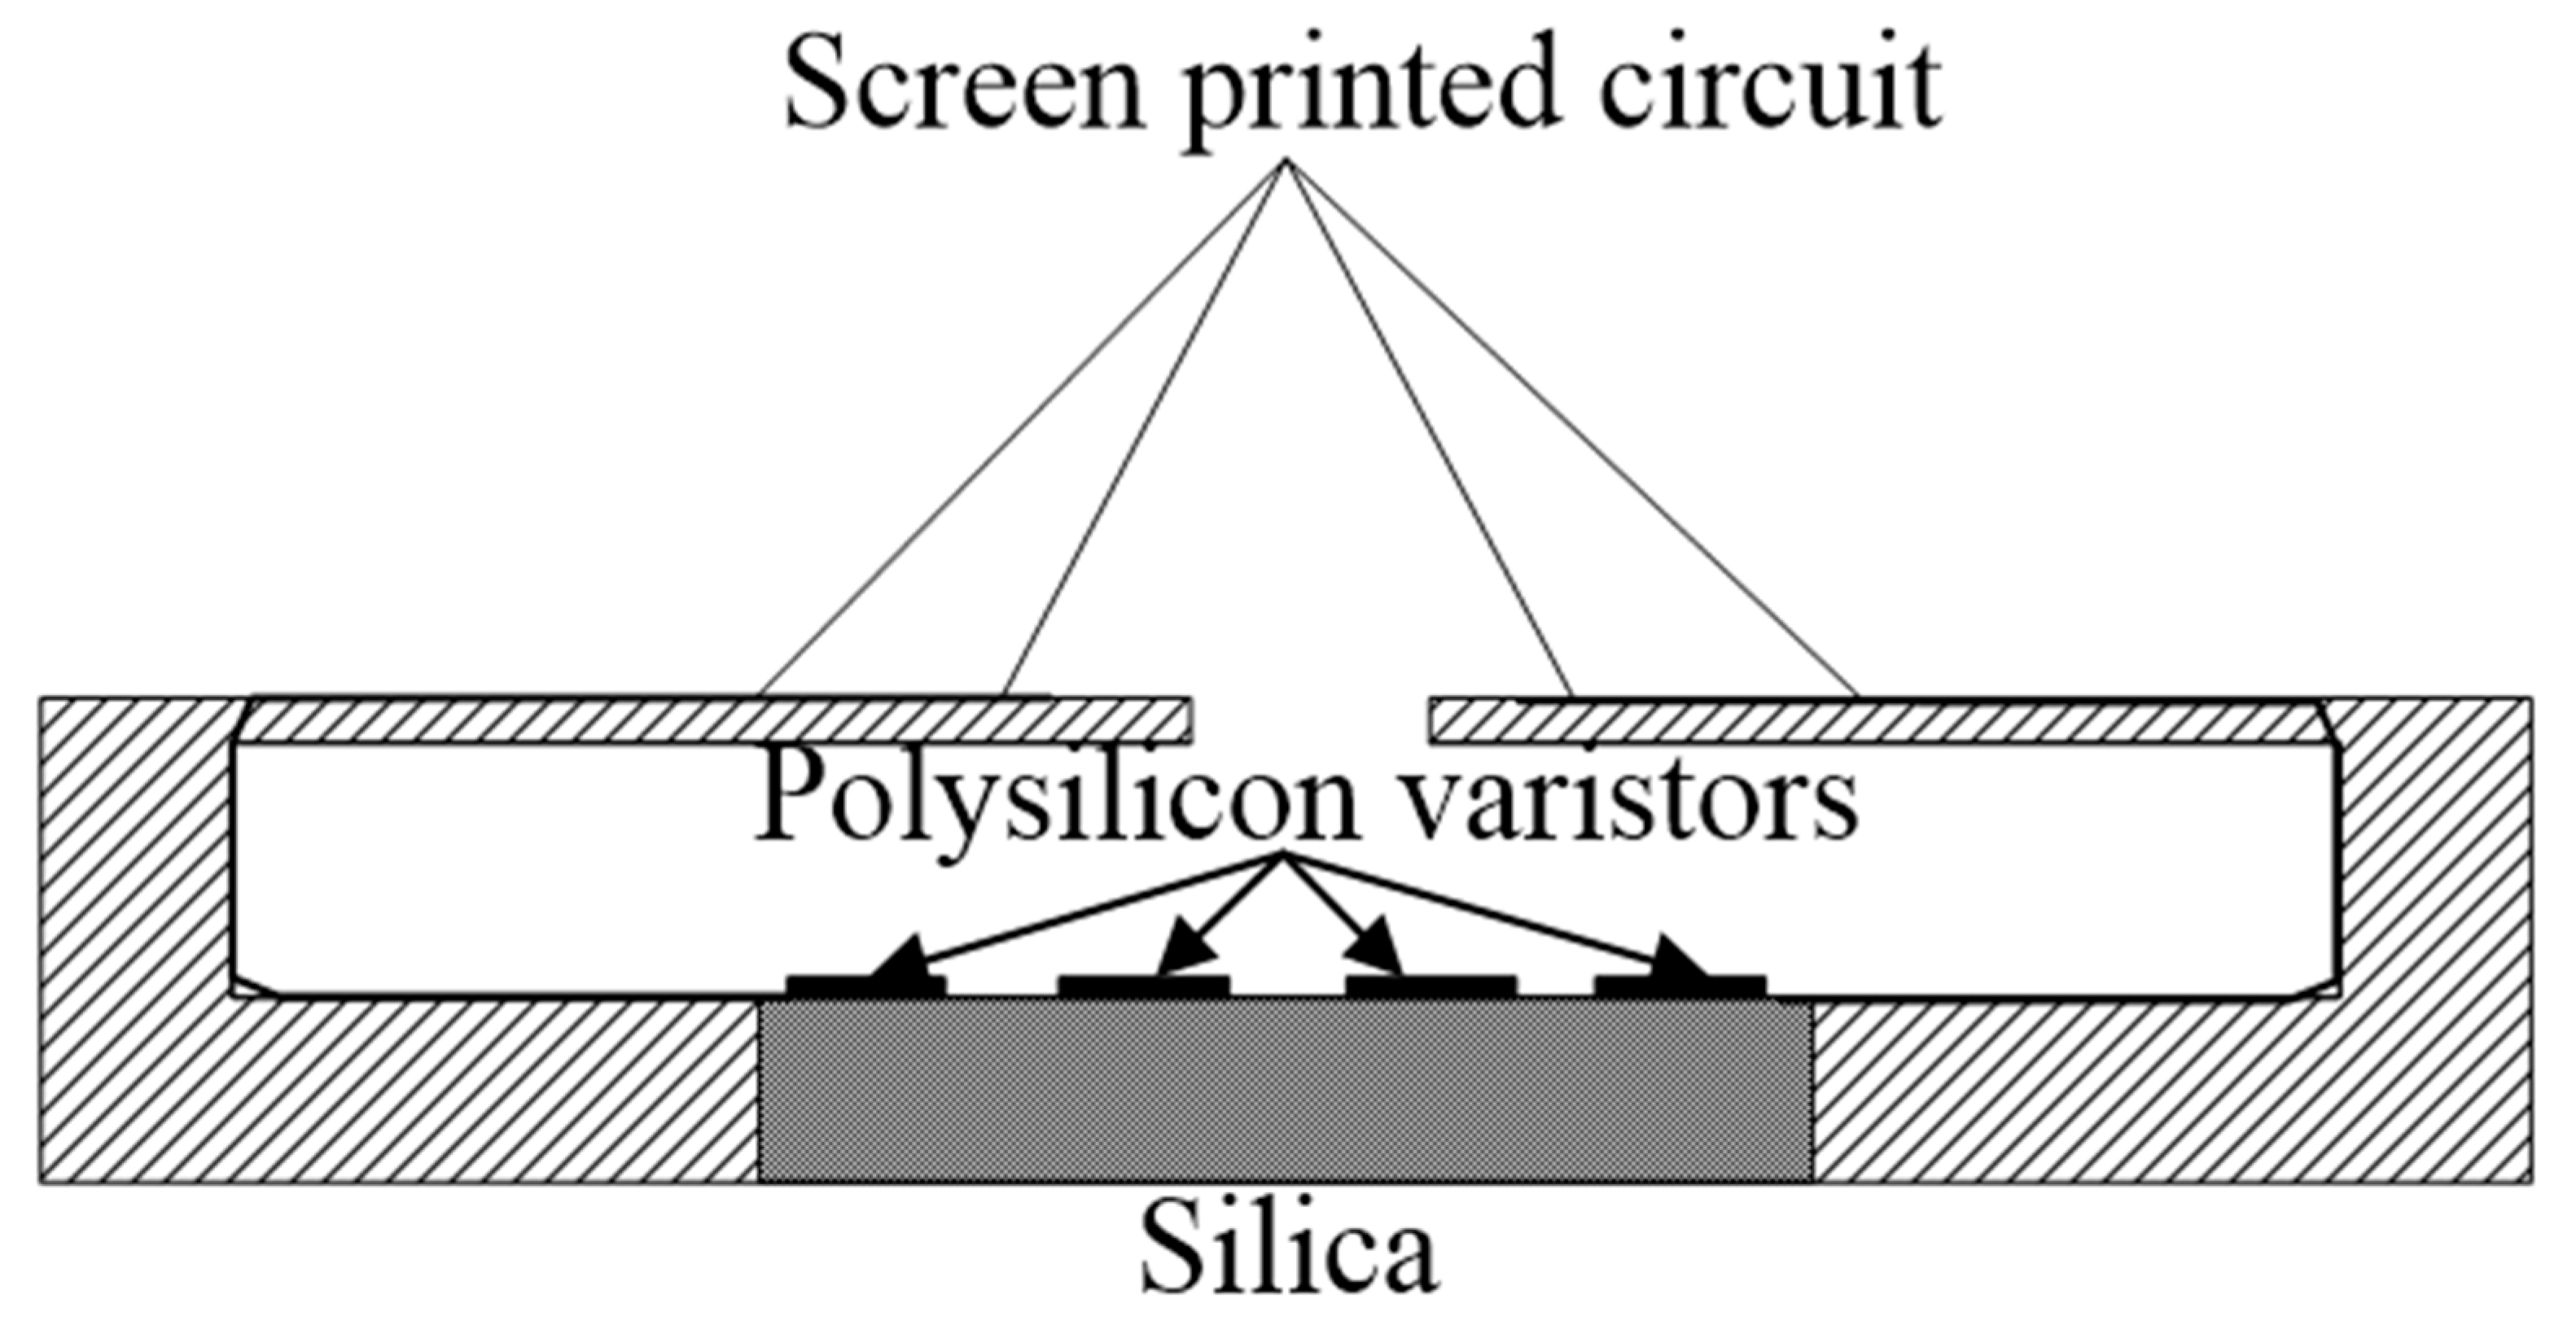
2. Silicon Piezoresistive Sensor
3. Engineering Geological Survey of the Test Site
4. Test Pile Conditions and Measuring Point Arrangement
4.1. Conditions of Test Pile
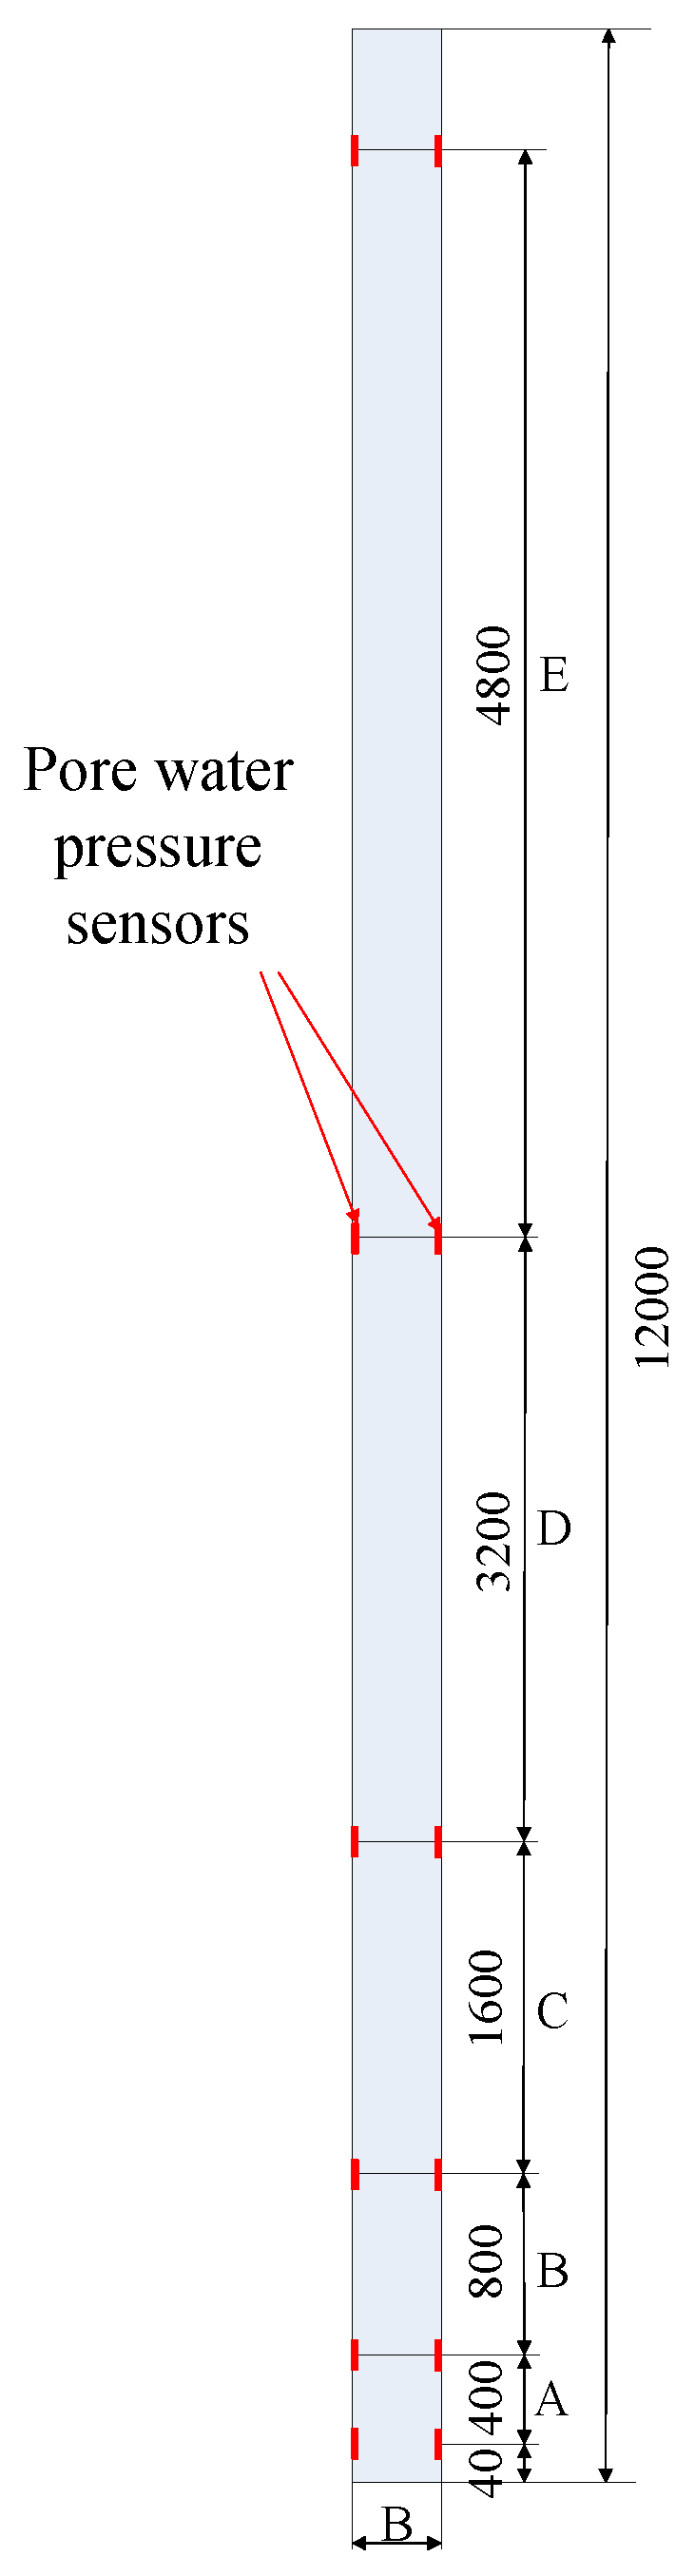
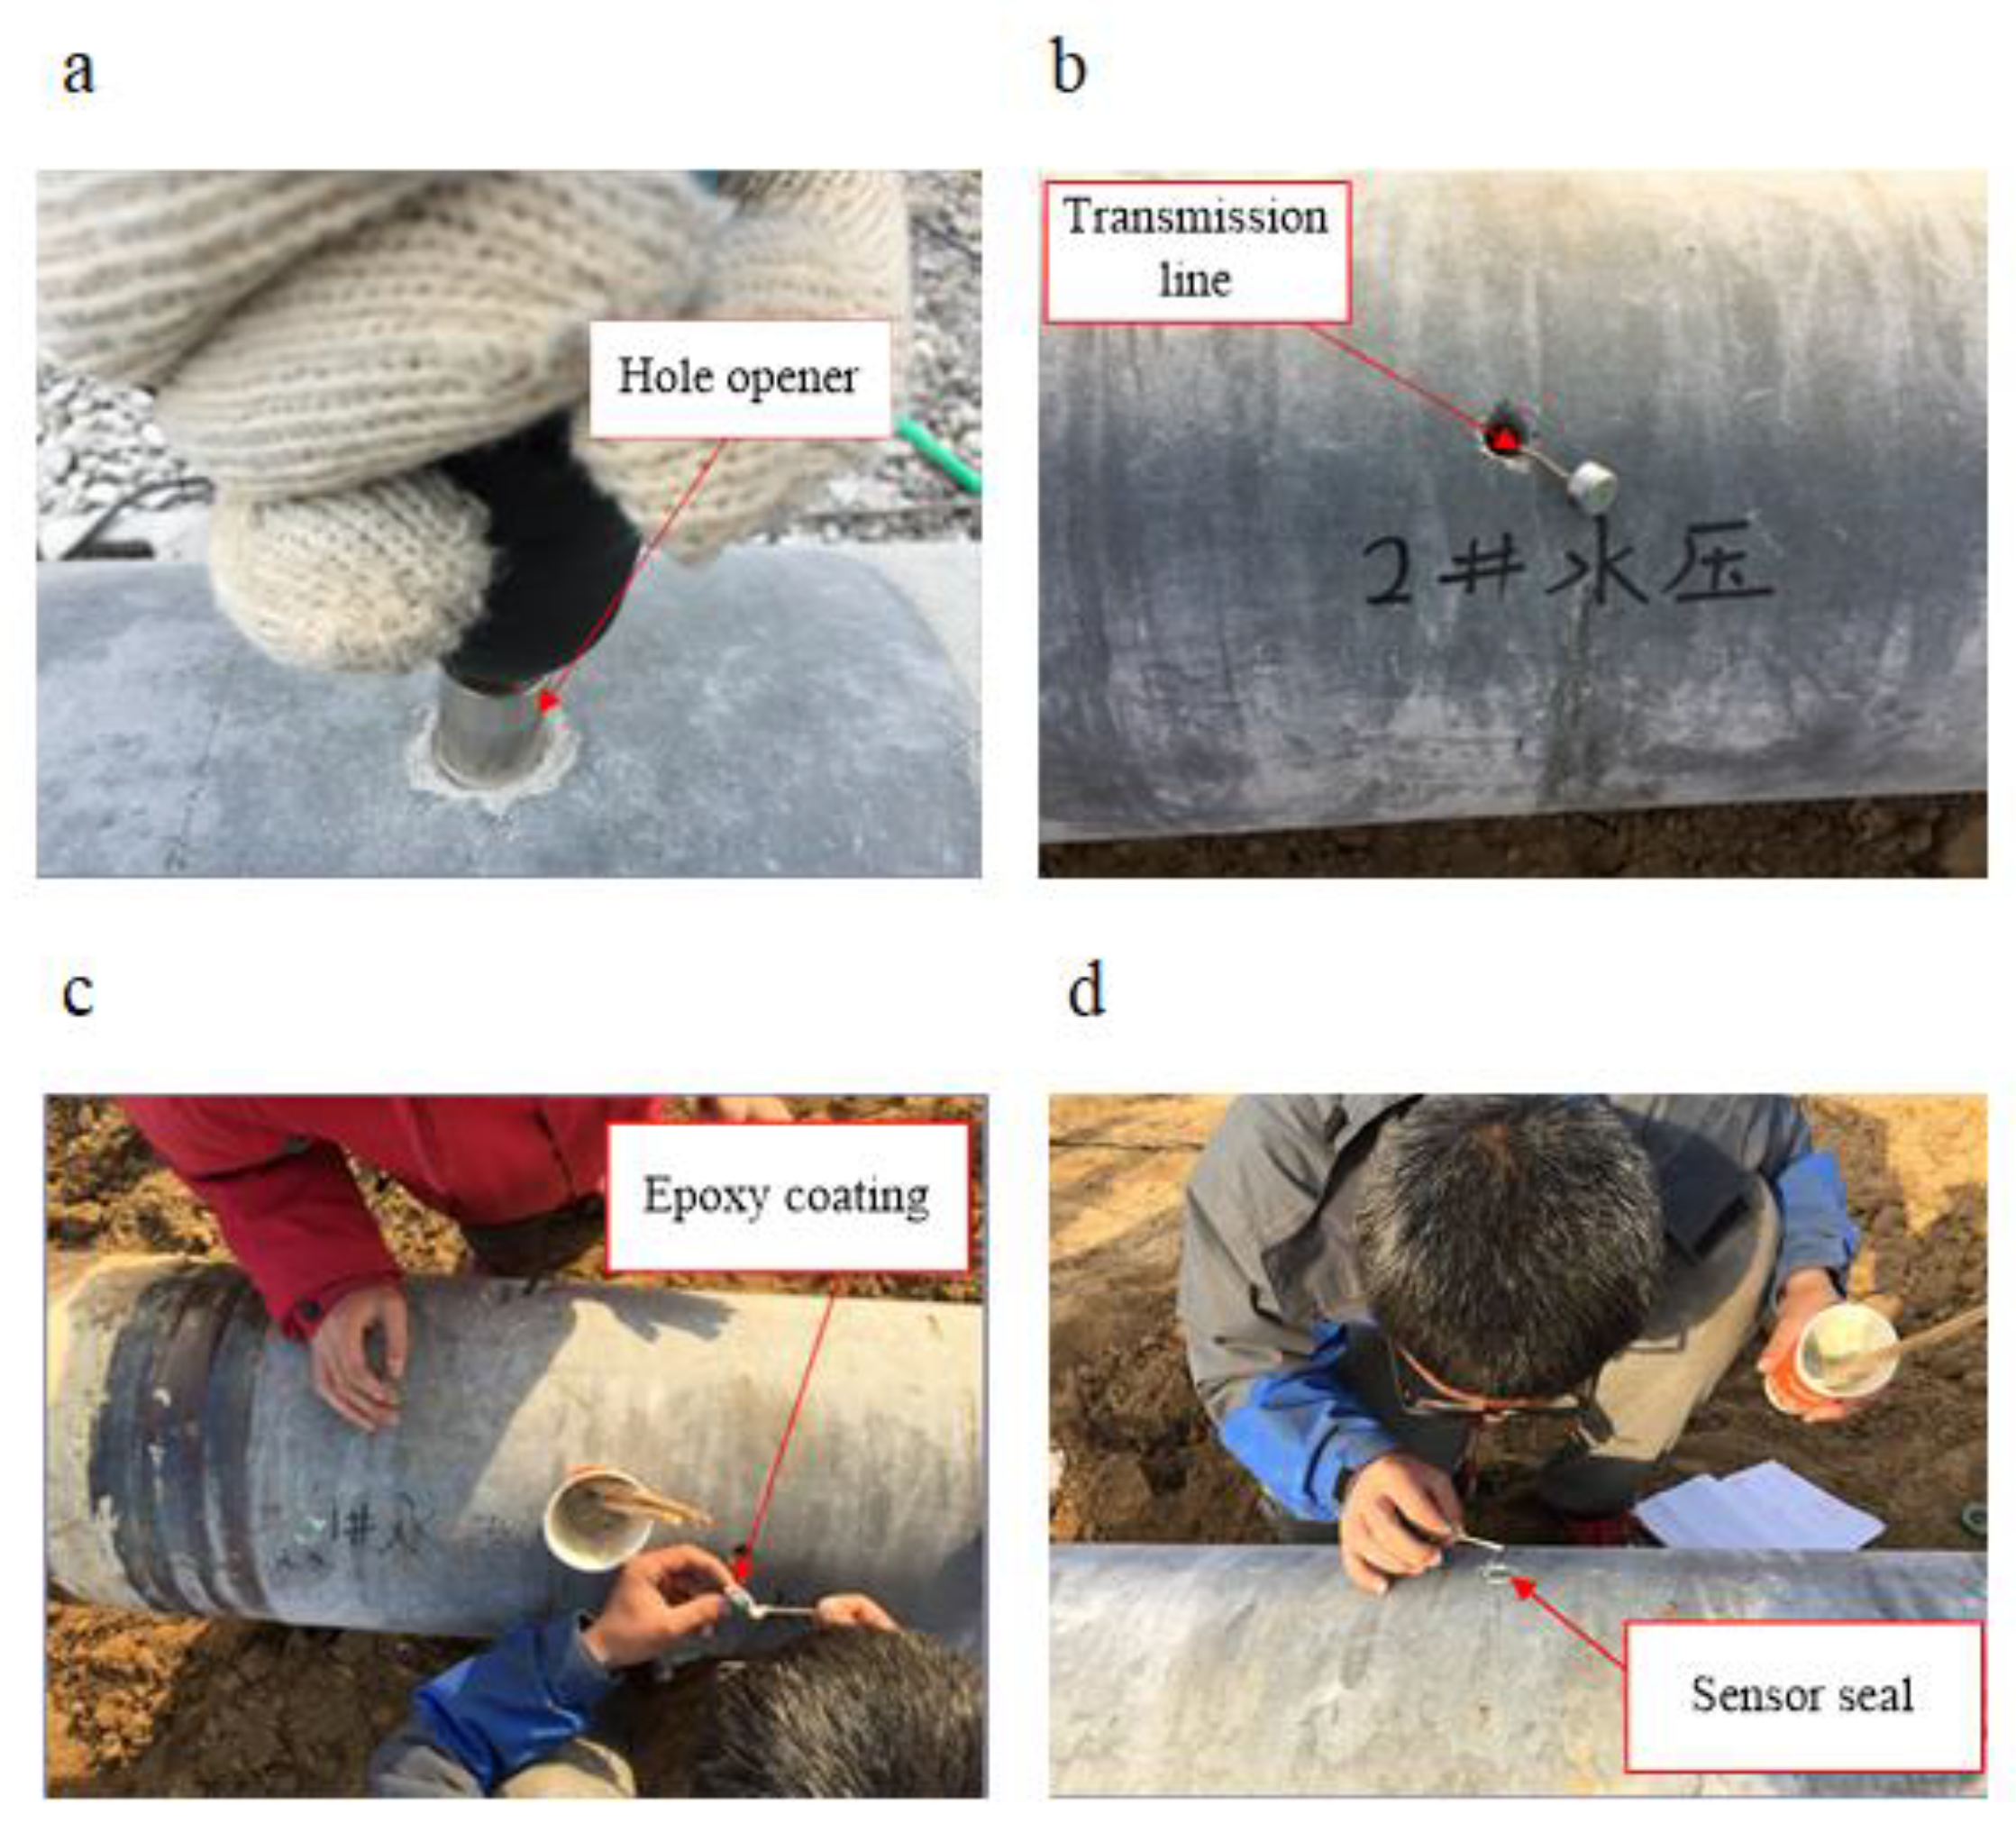
4.2. Arrangement of Measuring Points
5. Test Results and Analysis
5.1. Development Law of Pore Water Pressure at Pile–Soil Interface during Pile Jacking
- (1)
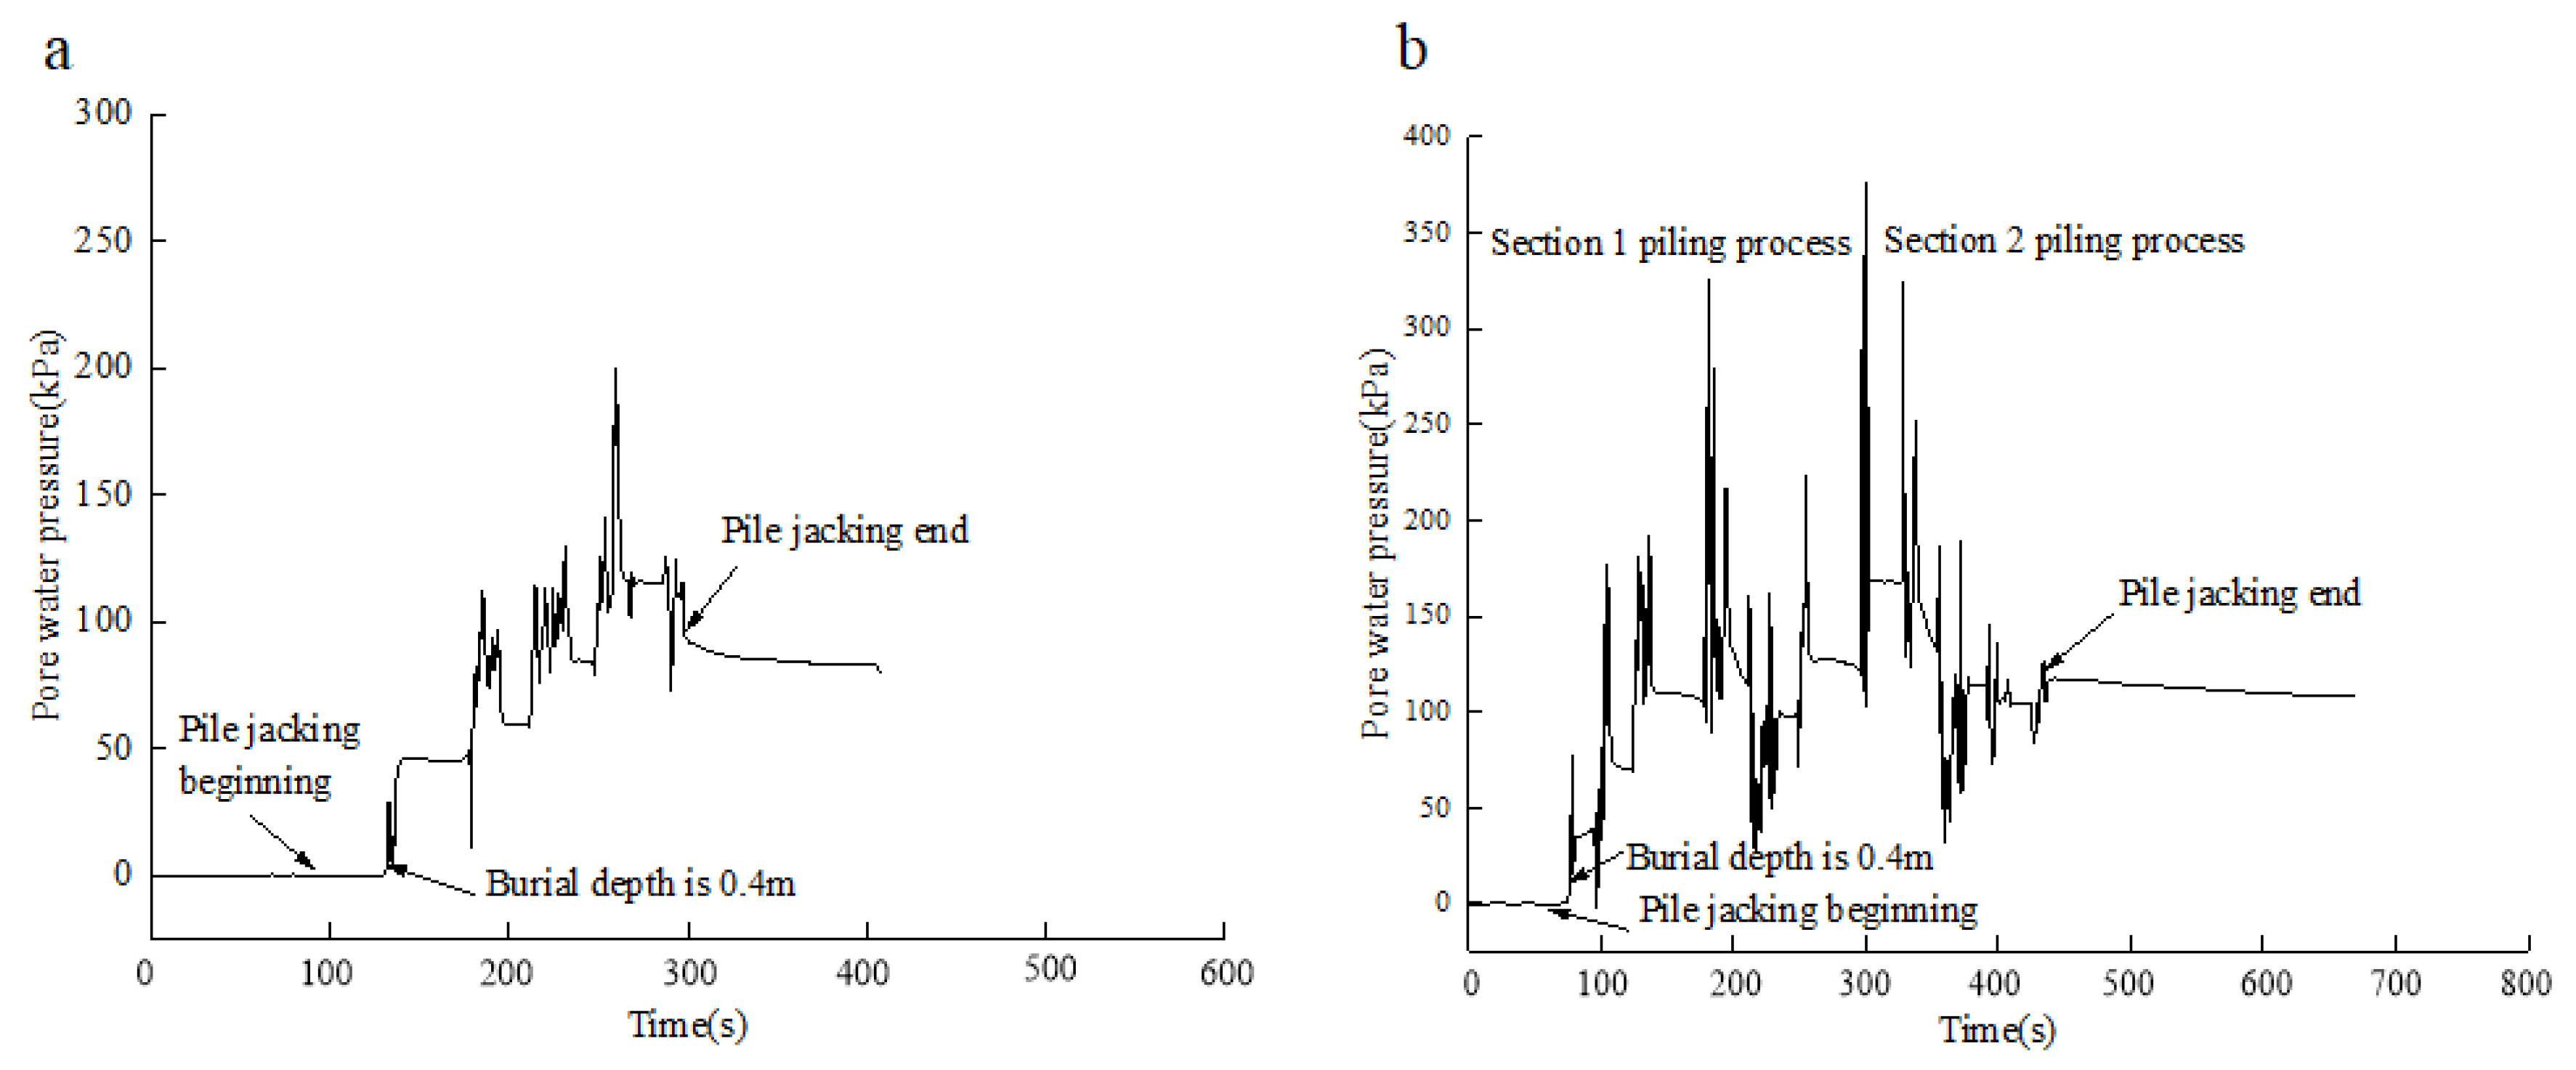
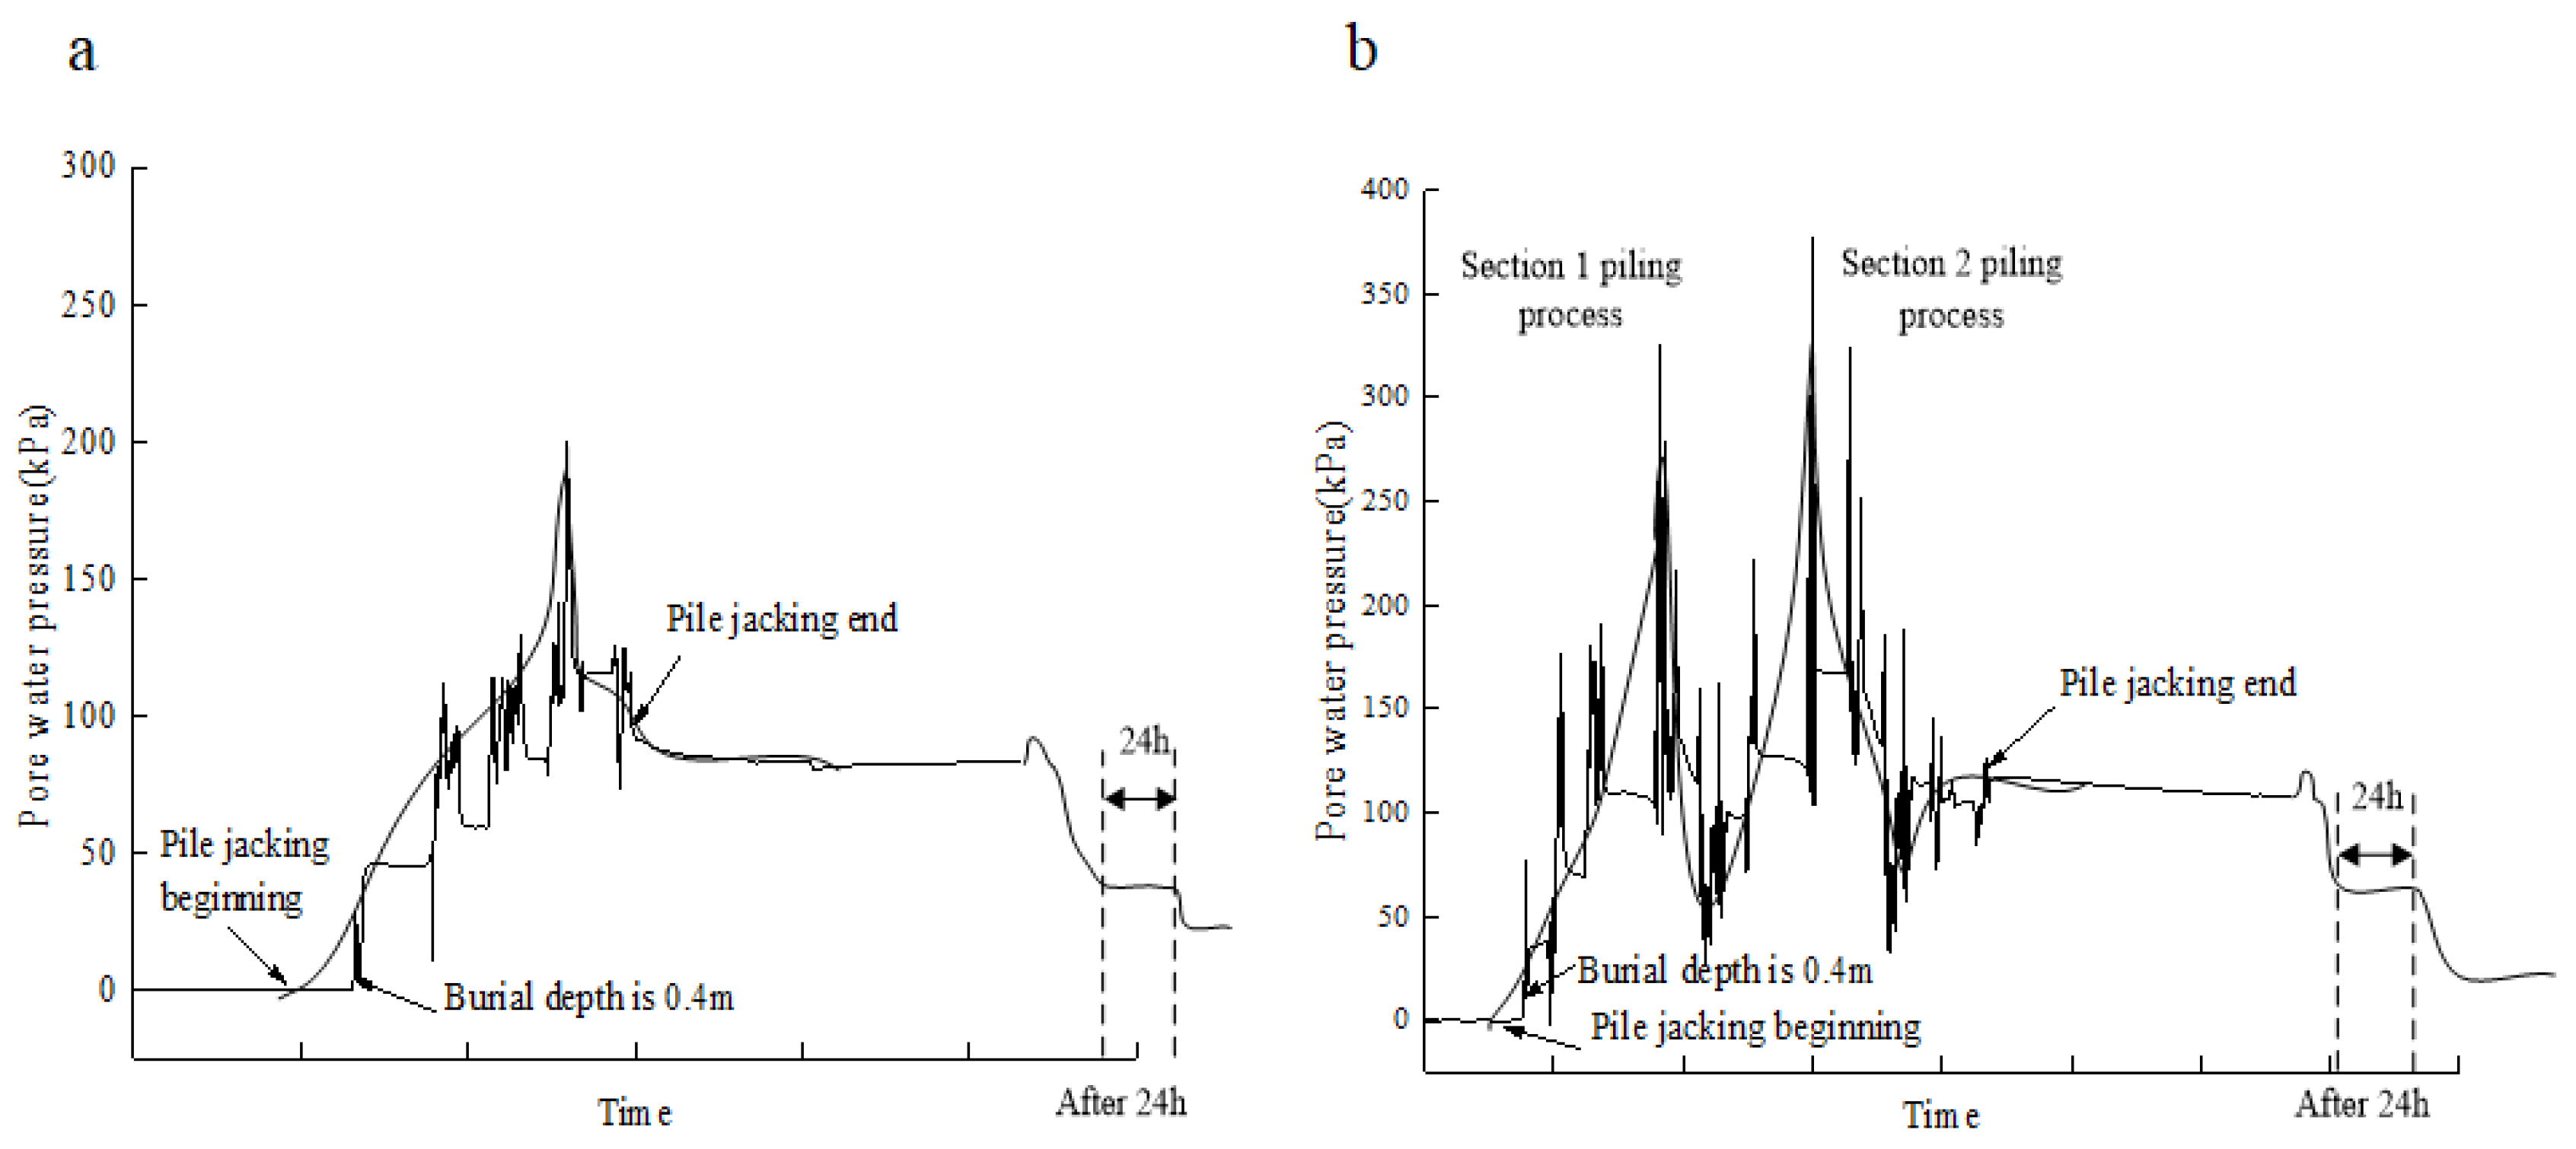
- At the initial stage of pile jacking, the excess pore water pressure at the pile–soil interface increased sharply, indicating that the soil was extruded and expanded when shearing occurred at the pile–soil interface, which resulted in the increase in excess pore water pressure at the pile–soil interface with the burial depth. Through field observation, Tang et al. [32,33] also found the same change law.
- (2)
- During pile jacking, the excess pore water pressure at the pile–soil interface increased to the peak and then began to decline, but the excess pore water pressure was still large after the decline. At the end of the S1 pile jacking, the excess pore water pressure from the pile end position h/B = 1 decreased from 201.4 to 86.3 kPa. After the end of pile jacking in the upper section of test pile S2, the excess pore water pressure from the pile end position h/B = 1 decreased from the maximum 324.6 to 39.2 kPa. It can be seen that the excess pore water pressure dissipates rapidly in the interval of pile jacking, and, after the end of pile jacking in the under section of test pile S2, the pressure drops from 374.1 to 114.3 kPa. The pore water pressure sensors measured at different positions h/B from the pile end have the same variation law as above.
- (3)
- After the completion of pile jacking, there is a hydraulic gradient between the pile–soil interface and the soil around the pile, and the pore water pressure in the soil around the pile will transfer to the pile–soil interface under the action of seepage. Therefore, the pore water pressure at the pile–soil interface will be stable within 24 h in the early stage of consolidation and will rise before the disappearance of the hydraulic gradient. After the hydraulic gradient disappeared completely, the pore water pressure began to dissipate, and the pore water pressure curve showed a downward trend.
5.2. Dissipation Law of Pore Water Pressure at Pile–Soil Interface during Pile Jacking
- (1)
- Unlike the dissipation law of pore water pressure in the soil around the pile, the dissipation law of excess pore water pressure at the pile–soil interface after the pile jacking end first goes up and then down. The reason is that the pressure difference between the pile–soil interface and the soil around the pile occurs after the construction, that is, a hydraulic gradient exists between the pile–soil interface and the soil around the pile, and the pore water pressure in the soil around the pile will transfer to the pile–soil interface under the action of seepage. Therefore, the excess pore water pressure at the pile–soil interface rises first at the initial stage of consolidation, and the pressure difference between the pile–soil interface and the soil surrounding the pile does not exist until the hydraulic gradient disappears.
- (2)
- The excess pore water pressure of the test pile S1 and S2 pile–soil interface measured within 24 h after becoming basically stable was 41 and about 65 kPa, respectively, and at this time, the excess pore water pressure dissipation degree had reached 75%–85%, and the dispersal rate is obviously more than the soil consolidation theory calculation speed, namely on the field test of the pile–soil interface excess pore water pressure dissipation rate and soil consolidation theory calculation speed. The permeability coefficient of the viscous soil layer is about 1.0 × 10⁻⁷ cm/s and the coefficient of consolidation Cv is about 6.0 × 10⁻³ cm2/s. The field-measured pore water pressure dissipation rate is obviously faster than the calculation rate based on the consolidation theory around the pile. Some scholars have made corresponding studies [34]. It is generally believed that the hydraulic splitting effect occurs in the soil around the pile due to the excessive pore water pressure generated in the process of continuous pile jacking, resulting in a large number of fractures. As a result, the consolidation speed of soil around the pile was accelerated at the beginning of the end of pile jacking. With time, cracks were gradually bridged, the permeability of soil around the pile was reduced, and the consolidation speed gradually slowed down. Different pore water pressure sensors from the pile to the pile end h/B were tested, which had the same variation law as above [35].
5.3. Change Law of Excess Pore Water Pressure at the Pile–Soil Interface with the Burial Depth
6. Conclusions
- (1)
- At the initial stage of pile jacking, the excess pore water pressure at the pile–soil interface increased sharply, and the excess pore water pressure increased with the increase in burial depth. At the end of pile jacking, the excess pore water pressure at the pile–soil interface dissipated rapidly, and the excess pore water pressure of test pile S1 decreased from 201.4 to 86.3 kPa, while the excess pore water pressure of test pile S2 decreased from 324.6 to 39.2 kPa.
- (2)
- After the end of pile jacking, the dissipation law of excess pore water pressure at the pile–soil interface is that it rises first and then falls. Due to the existence of a hydraulic gradient, the pore water pressure in the soil around the pile will transfer to the pile–soil interface under the action of seepage. The excess pore water pressure at the pile–soil interface will first rise at the initial stage of consolidation and then dissipate when the hydraulic gradient disappears at the pile–soil interface. With the extension of time, the fracture of the pile–soil interface under the action of hydraulic fracturing increases the dissipation rate of the pile–soil interface.
- (3)
- The excess pore water pressure at the pile–soil interface has an influence on the shear strength change at the pile–soil interface during the process of pile jacking, and the shear strength change at the pile–soil interface during the process of pile jacking can reflect the change trend of excess pore water pressure. Research on the generation and dissipation of excess pore water pressure at the pile–soil interface in the process of pile jacking plays an important role in the pile’s mechanical characteristics and bearing capacity and has important engineering application value.
- (4)
- The dissipation trend of pore water pressure at different positions of the pile body is consistent. After a period of steady state, the pore water pressure dissipates gradually with the increase in time. With the increase in the sensor position, the pore water pressure decreases and the dissipation rate of pore water decreases.
Author Contributions
Funding
Conflicts of Interest
References
- Zhang, L.M.; Wang, H. Field study of construction effects in jacked and driven steel H-piles. Géotechnique 2009, 59, 63–69. [Google Scholar] [CrossRef]
- Yang, J.; Tham, L.G.; Lee, P.K.K.; Chan, S.T.; Yu, F. Behaviour of jacked and driven piles in sandy soil. Géotechnique 2006, 56, 245–259. [Google Scholar] [CrossRef] [Green Version]
- Li, L.; Li, J.; Sun, D.; Zhang, L. Time-dependent bearing capacity of a jacked pile: An analytical approach based on effective stress method. Ocean Eng. 2017, 143, 177–185. [Google Scholar] [CrossRef]
- Wang, Z.; Miao, L.; Wang, F. Theoretical and numerical analysis of jacked pile in sand. In GeoCongress 2012: State of the Art and Practice in Geotechnical Engineering; GeoCongress: Oakland, CA, USA, 2012; pp. 245–254. [Google Scholar]
- He, F.; Huang, Z. Hydrodynamic performance of pile-supported OWC-type structures as breakwaters: An experimental study. Ocean Eng. 2014, 88, 618–626. [Google Scholar] [CrossRef]
- Yan, S.; Jia, Z.; Liu, W.; Li, J. Reserch on the Large Diameter and Supper Long Pile Running under Self-Weight in the Ocean Engineering. J. Coast. Res. 2015, 73, 809–814. [Google Scholar] [CrossRef]
- Rollins, K.M.; Brown, D.A. Design Guidelines for Increasing the Lateral Resistance of Highway-Bridge Pile Foundations by Improving Weak Soils; Transportation Research Board: Washington, DC, USA, 2011. [Google Scholar]
- Lueprasert, P.; Jongpradist, P.; Jongpradist, P.; Suwansawat, S. Numerical investigation of tunnel deformation due to adjacent loaded pile and pile-soil-tunnel interaction. Tunn. Undergr. Space Technol. 2017, 70, 166–181. [Google Scholar] [CrossRef]
- Kou, H.; Chu, J.; Guo, W.; Zhang, M.Y. Field study of residual forces developed in pre-stressed high-strength concrete (PHC) pipe piles. Can. Geotech. J. 2016, 53, 696–707. [Google Scholar] [CrossRef]
- Xing, H.F.; Zhao, H.W.; Ye, G.B.; Xu, C. Effect of driving long pre-stressed high-strength concrete pipe piles in alluvium and its mechanical behavior. Bull. Eng. Geol. Environ. 2012, 71, 771–781. [Google Scholar] [CrossRef]
- Wu, Z.P.; Yang, X.D.; Bao, L. Application research of prestressed high strength concrete pipe pile in construction. Appl. Mech. Materials. Trans Tech Publ. Ltd 2012, 193, 1393–1396. [Google Scholar] [CrossRef]
- Liu, H.; Chen, Y.; Liu, J. Construction of a large diameter cast-in-situ concrete pipe pile for ground improvement. Adv. Ground Improv. Res. Pract. United States China 2009, 37, 120–129. [Google Scholar]
- Lehane, B.M.; Gavin, K.G. Base resistance of jacked pipe piles in sand. J. Geotech. Geoenviron. Eng. 2001, 127, 473–480. [Google Scholar] [CrossRef]
- Yang, Q.; Zhang, S.; Huang, S.; He, Y. Effect of ground quartz sand on properties of high-strength concrete in the steam-autoclaved curing. Cem. Concr. Res. 2000, 30, 1993–1998. [Google Scholar] [CrossRef]
- Yu, F.; Yang, J. Base capacity of open-ended steel pipe piles in sand. J. Geotech. Geoenviron. Eng. 2012, 138, 1116–1128. [Google Scholar] [CrossRef] [Green Version]
- Golewski, G.L. Estimation of the optimum content of fly ash in concrete composite based on the analysis of fracture toughness tests using various measuring systems. Constr. Build. Mater. 2019, 213, 142–155. [Google Scholar] [CrossRef]
- Cooke, R.W.; Price, G. Strains and displacements around friction piles. 8th Int. Conf. Soil Mech. Found. Eng. Mosc. 1973, 2, 53–60. [Google Scholar]
- Roy, M.; Tremblay, M.; Tavenas, F.; Rochelle, P.L. Development of pore pressures in quasi-static penetration tests in sensitive clay. Can. Geotech. J. 1982, 19, 124–138. [Google Scholar] [CrossRef]
- Hwang, J.H.; Liang, N.; Chen, C.S. Ground response during pile driving. J. Geotech. Geoenviron. Eng. 2001, 127, 939–949. [Google Scholar] [CrossRef]
- Gupta, R.C. Soil deformation and excess pore pressure field around a closed-ended pile. Discussion and closure. J. Geotech. Eng. 2003, 129, 1–12. [Google Scholar]
- Liu, J.; Zhang, Z.; Yu, F.; Xie, Z.Z. Case history of installing instrumented jacked open-ended piles. J. Geotech. Geoenviron. Eng. 2012, 138, 810–820. [Google Scholar] [CrossRef]
- Burns, S.E.; Mayne, P.W. Pore pressure dissipation behavior surrounding driven piles and cone penetrometers. Transp. Res. Rec. 1999, 1675, 17–23. [Google Scholar] [CrossRef]
- Doherty, P.; Gavin, K. Shaft capacity of open-ended piles in clay. J. Geotech. Geoenviron. Eng. 2011, 137, 1090–1102. [Google Scholar] [CrossRef] [Green Version]
- Kou, H.; Zhang, M.; Yu, F. Shear zone around jacked piles in clay. J. Perform. Constr. Facil. 2015, 29, 04014169. [Google Scholar] [CrossRef]
- Pestana, J.M.; Hunt, C.E.; Bray, J.D. Soil deformation and excess pore pressure field around a closed-ended pile. J. Geotech. Geoenviron. Eng. 2002, 128, 1–12. [Google Scholar] [CrossRef]
- Luo, Z.Y.; Zhu, X.R.; Wang, L.F. Field studies on effect of jacked pile on adjacent buildings and roads in clay. Found. Anal. Des. Innov. Methods 2006, 34, 195–202. [Google Scholar]
- Wang, R.L.; Gu, H.; Mo, Y.L.; Song, G. Proof-of-concept experimental study of damage detection of concrete piles using embedded piezoceramic transducers. Smart Mater. Struct. 2013, 22, 042001. [Google Scholar] [CrossRef]
- Wang, R.; Zhu, D.; Liu, X.; Sima, J. Monitoring the freeze–thaw process of soil with different moisture contents using piezoceramic transducers. Smart Mater. Struct. 2015, 24, 057003. [Google Scholar] [CrossRef]
- Barrias, A.; Casas, J.R.; Villalba, S. A review of distributed optical fiber sensors for civil engineering applications. Sensors 2016, 16, 748. [Google Scholar] [CrossRef] [Green Version]
- Schubert, D.; Jenschke, W.; Uhlig, T.; Schmidt, F.M. Piezoresistive properties of polycrystalline and crystalline silicon films. Sens. Actuators 1987, 11, 145–155. [Google Scholar] [CrossRef]
- Lee, F.H.; Ng, Y.W.; Yong, K.Y. Effects of installation method on sand compaction piles in clay in the centrifuge. Geotech. Test. J. 2001, 24, 314–323. [Google Scholar]
- Tang, S.; He, L.; Fu, Z. Excess pore water pressure caused by an installing pile in soft foundation. Rock Soil Mech. 2002, 23, 725–732. [Google Scholar]
- Tang, S.; Wang, Y.; Ye, Z. Excess pore water pressure caused by installing pile group in saturated soft soil. J. Tongji Univ. 2003, 31, 1290–1294. [Google Scholar]
- Holloway, D.M. Pile Driving Analysis Using the One-Dimensional Wave Equation. Army Eng. Waterw. Exp. Stn. 1975, 101, 306–325. [Google Scholar]
- Simonsen, T.R.; Sorensen, K.K. Field measurements of pore-water pressure changes in a stiff fissured very high plasticity Palaeogene clay during excavation and pile driving. In Proceedings of the 19th International Conference on Soil Mechanics and Geotechnical Engineering, Seoul, Korea, 17–22 September 2017. [Google Scholar]
- Liao, Y.; Lei, J.; Yang, K.; Liu, J. Model Test Analysis of Excess Pore Water Pressure during the Sinking of a Pipe Pile with a Group of Holes. J. Highw. Transp. Res. Dev. (Engl. Ed.) 2018, 12, 22–28. [Google Scholar] [CrossRef]
- Pan, H.; Chen, G.X.; Sun, T.; Hu, Q.X. Characteristics of excess pore water pressure of Nanjing saturated fine sand under the interaction of wave and earthquake loading. Mar. Georesources Geotechnol. 2012, 30, 32–51. [Google Scholar] [CrossRef]


| Soil Type | Soil Thickness (m) | Severe r/(kN/m2) | Moisture Content w(%) | Void Ratio e | Liquid Limit wL(%) | Plastic Limit wP(%) | Cohesion C(kPa) | Internal Friction Angle φ(°) | Compresson Modulus Es(MPa) | Characteristic Value of Bearing Capacity fak(kPa) |
|---|---|---|---|---|---|---|---|---|---|---|
| Plain fill | 2.44 | |||||||||
| Silt | 1.45 | 18.6 | 27.7 | 0.792 | 28.5 | 19.6 | 10.0 | 18.9 | 6.0 | 95 |
| Silty clay | 0.54 | 18.4 | 31.1 | 0.881 | 32.5 | 20.0 | 16.9 | 7.3 | 3.0 | 80 |
| Silty clay | 0.77 | 18.4 | 30.5 | 0.873 | 32.1 | 19.7 | 18.5 | 10.0 | 3.0 | 80 |
| Silt | 2.39 | 18.8 | 28.0 | 0.796 | 28.9 | 20.0 | 9.5 | 19.9 | 6.5 | 100 |
| Silty clay | 3.66 | 18.3 | 31.5 | 0.892 | 32.3 | 19.8 | 18.8 | 7.2 | 3.0 | 80 |
| Silt | 2.39 | 18.8 | 28.0 | 0.793 | 28.9 | 19.9 | 10.0 | 20.3 | 7.0 | 120 |
| Silty clay | 0.8 | 18.5 | 30.8 | 0.875 | 32.6 | 19.8 | 17.9 | 9.9 | 3.5 | 85 |
| Silty clay | 6.37 | 18.5 | 30.8 | 0.862 | 32.6 | 19.9 | 18.6 | 10.7 | 4.0 | 90 |
| Silt | 1.49 | 18.8 | 27.7 | 0.789 | 28.6 | 19.7 | 10.7 | 20.3 | 7.0 | 120 |
| Silt | 1.54 | 19.0 | 27.0 | 0.754 | 28.7 | 20.2 | 11.7 | 22.0 | 7.5 | 160 |
| Silty sand | 17.68 | 19.3 | 24.0 | 0.692 | 5.0 | 34.0 | 10.3 | 220 |
| Sensor Position | h/B = 1 | h/B = 3 | h/B = 7 | h/B = 15 | h/B = 27 | |
|---|---|---|---|---|---|---|
| Time | ||||||
| 12 h | 105 | 96 | 88 | 45 | 28 | |
| 24 h | 98 | 86 | 70 | 38 | 19 | |
| 36 h | 92 | 75 | 65 | 33 | 15 | |
| 48 h | 85 | 70 | 61 | 28 | 12 | |
© 2020 by the authors. Licensee MDPI, Basel, Switzerland. This article is an open access article distributed under the terms and conditions of the Creative Commons Attribution (CC BY) license (http://creativecommons.org/licenses/by/4.0/).
Share and Cite
Wang, Y.; Liu, X.; Zhang, M.; Yang, S.; Sang, S. Field Test of Excess Pore Water Pressure at Pile–Soil Interface Caused by PHC Pipe Pile Penetration Based on Silicon Piezoresistive Sensor. Sensors 2020, 20, 2829. https://doi.org/10.3390/s20102829
Wang Y, Liu X, Zhang M, Yang S, Sang S. Field Test of Excess Pore Water Pressure at Pile–Soil Interface Caused by PHC Pipe Pile Penetration Based on Silicon Piezoresistive Sensor. Sensors. 2020; 20(10):2829. https://doi.org/10.3390/s20102829
Chicago/Turabian StyleWang, Yonghong, Xueying Liu, Mingyi Zhang, Suchun Yang, and Songkui Sang. 2020. "Field Test of Excess Pore Water Pressure at Pile–Soil Interface Caused by PHC Pipe Pile Penetration Based on Silicon Piezoresistive Sensor" Sensors 20, no. 10: 2829. https://doi.org/10.3390/s20102829