Effect of Distortion in Velocity Profile on Flow Measurements Using Averaging Flow Sensors
Abstract
1. Introduction
2. Materials and Methods
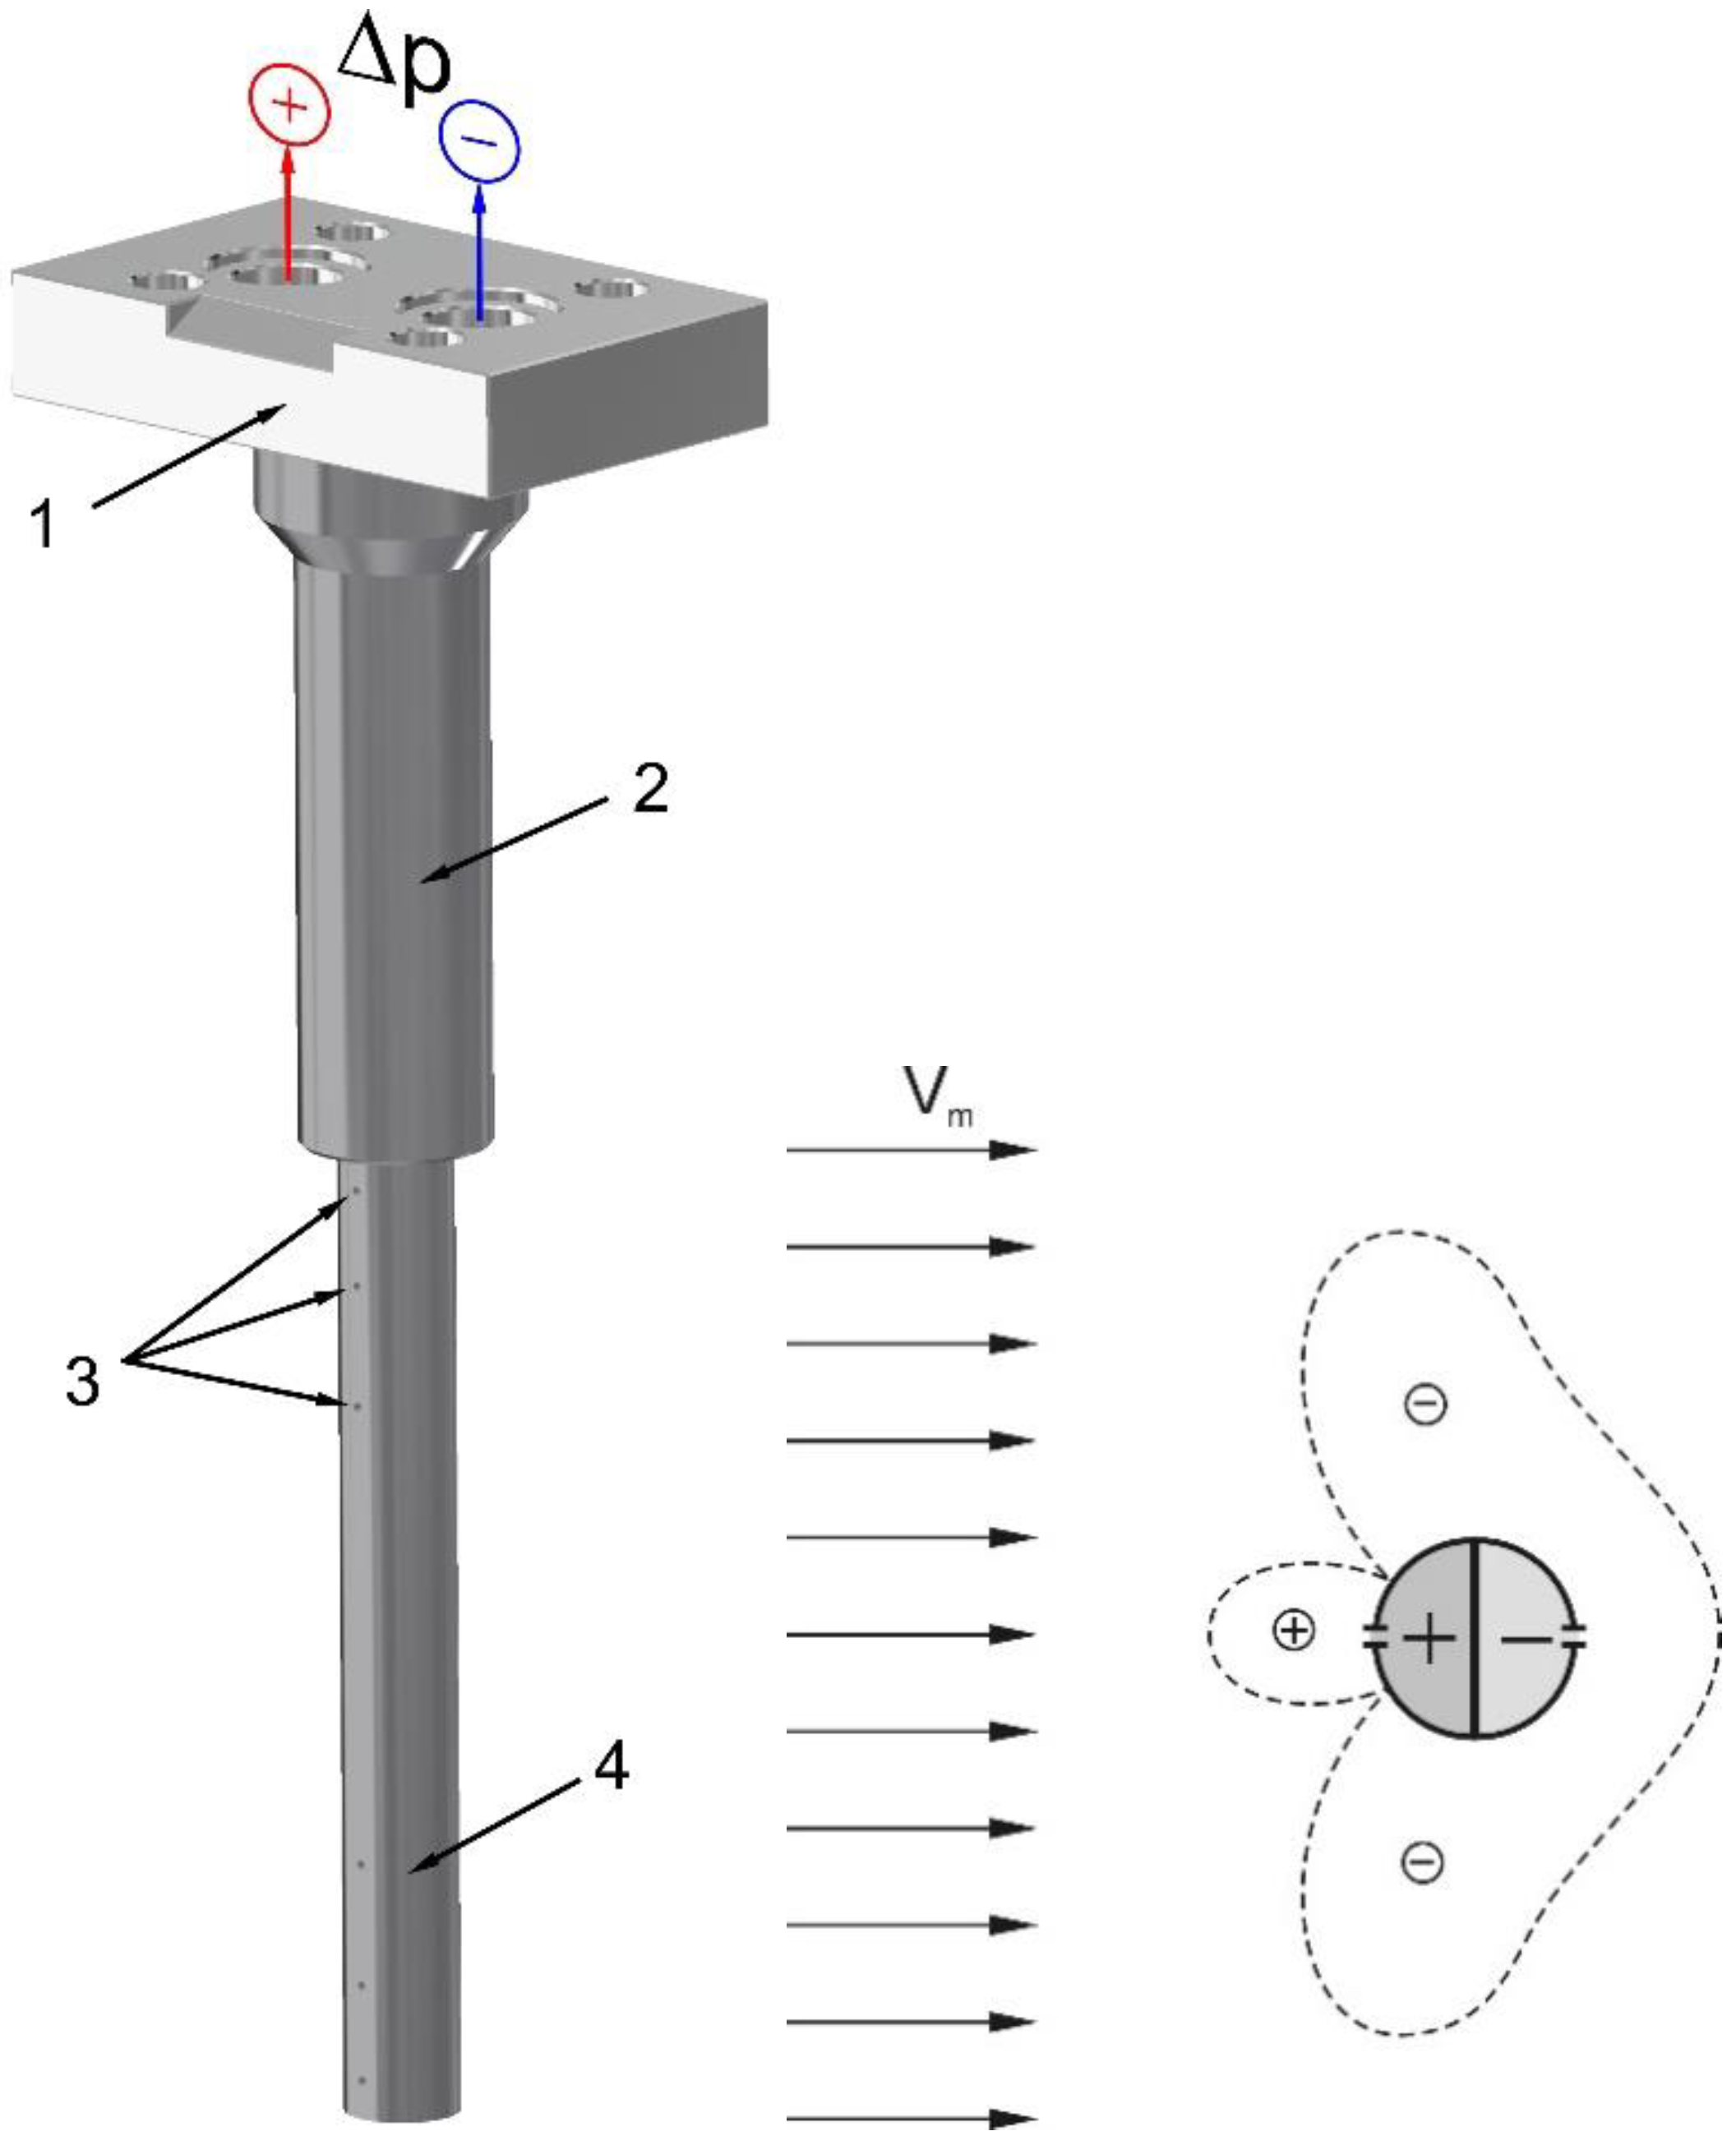
2.1. Flow-Averaging Pitot Tube Flowmeters
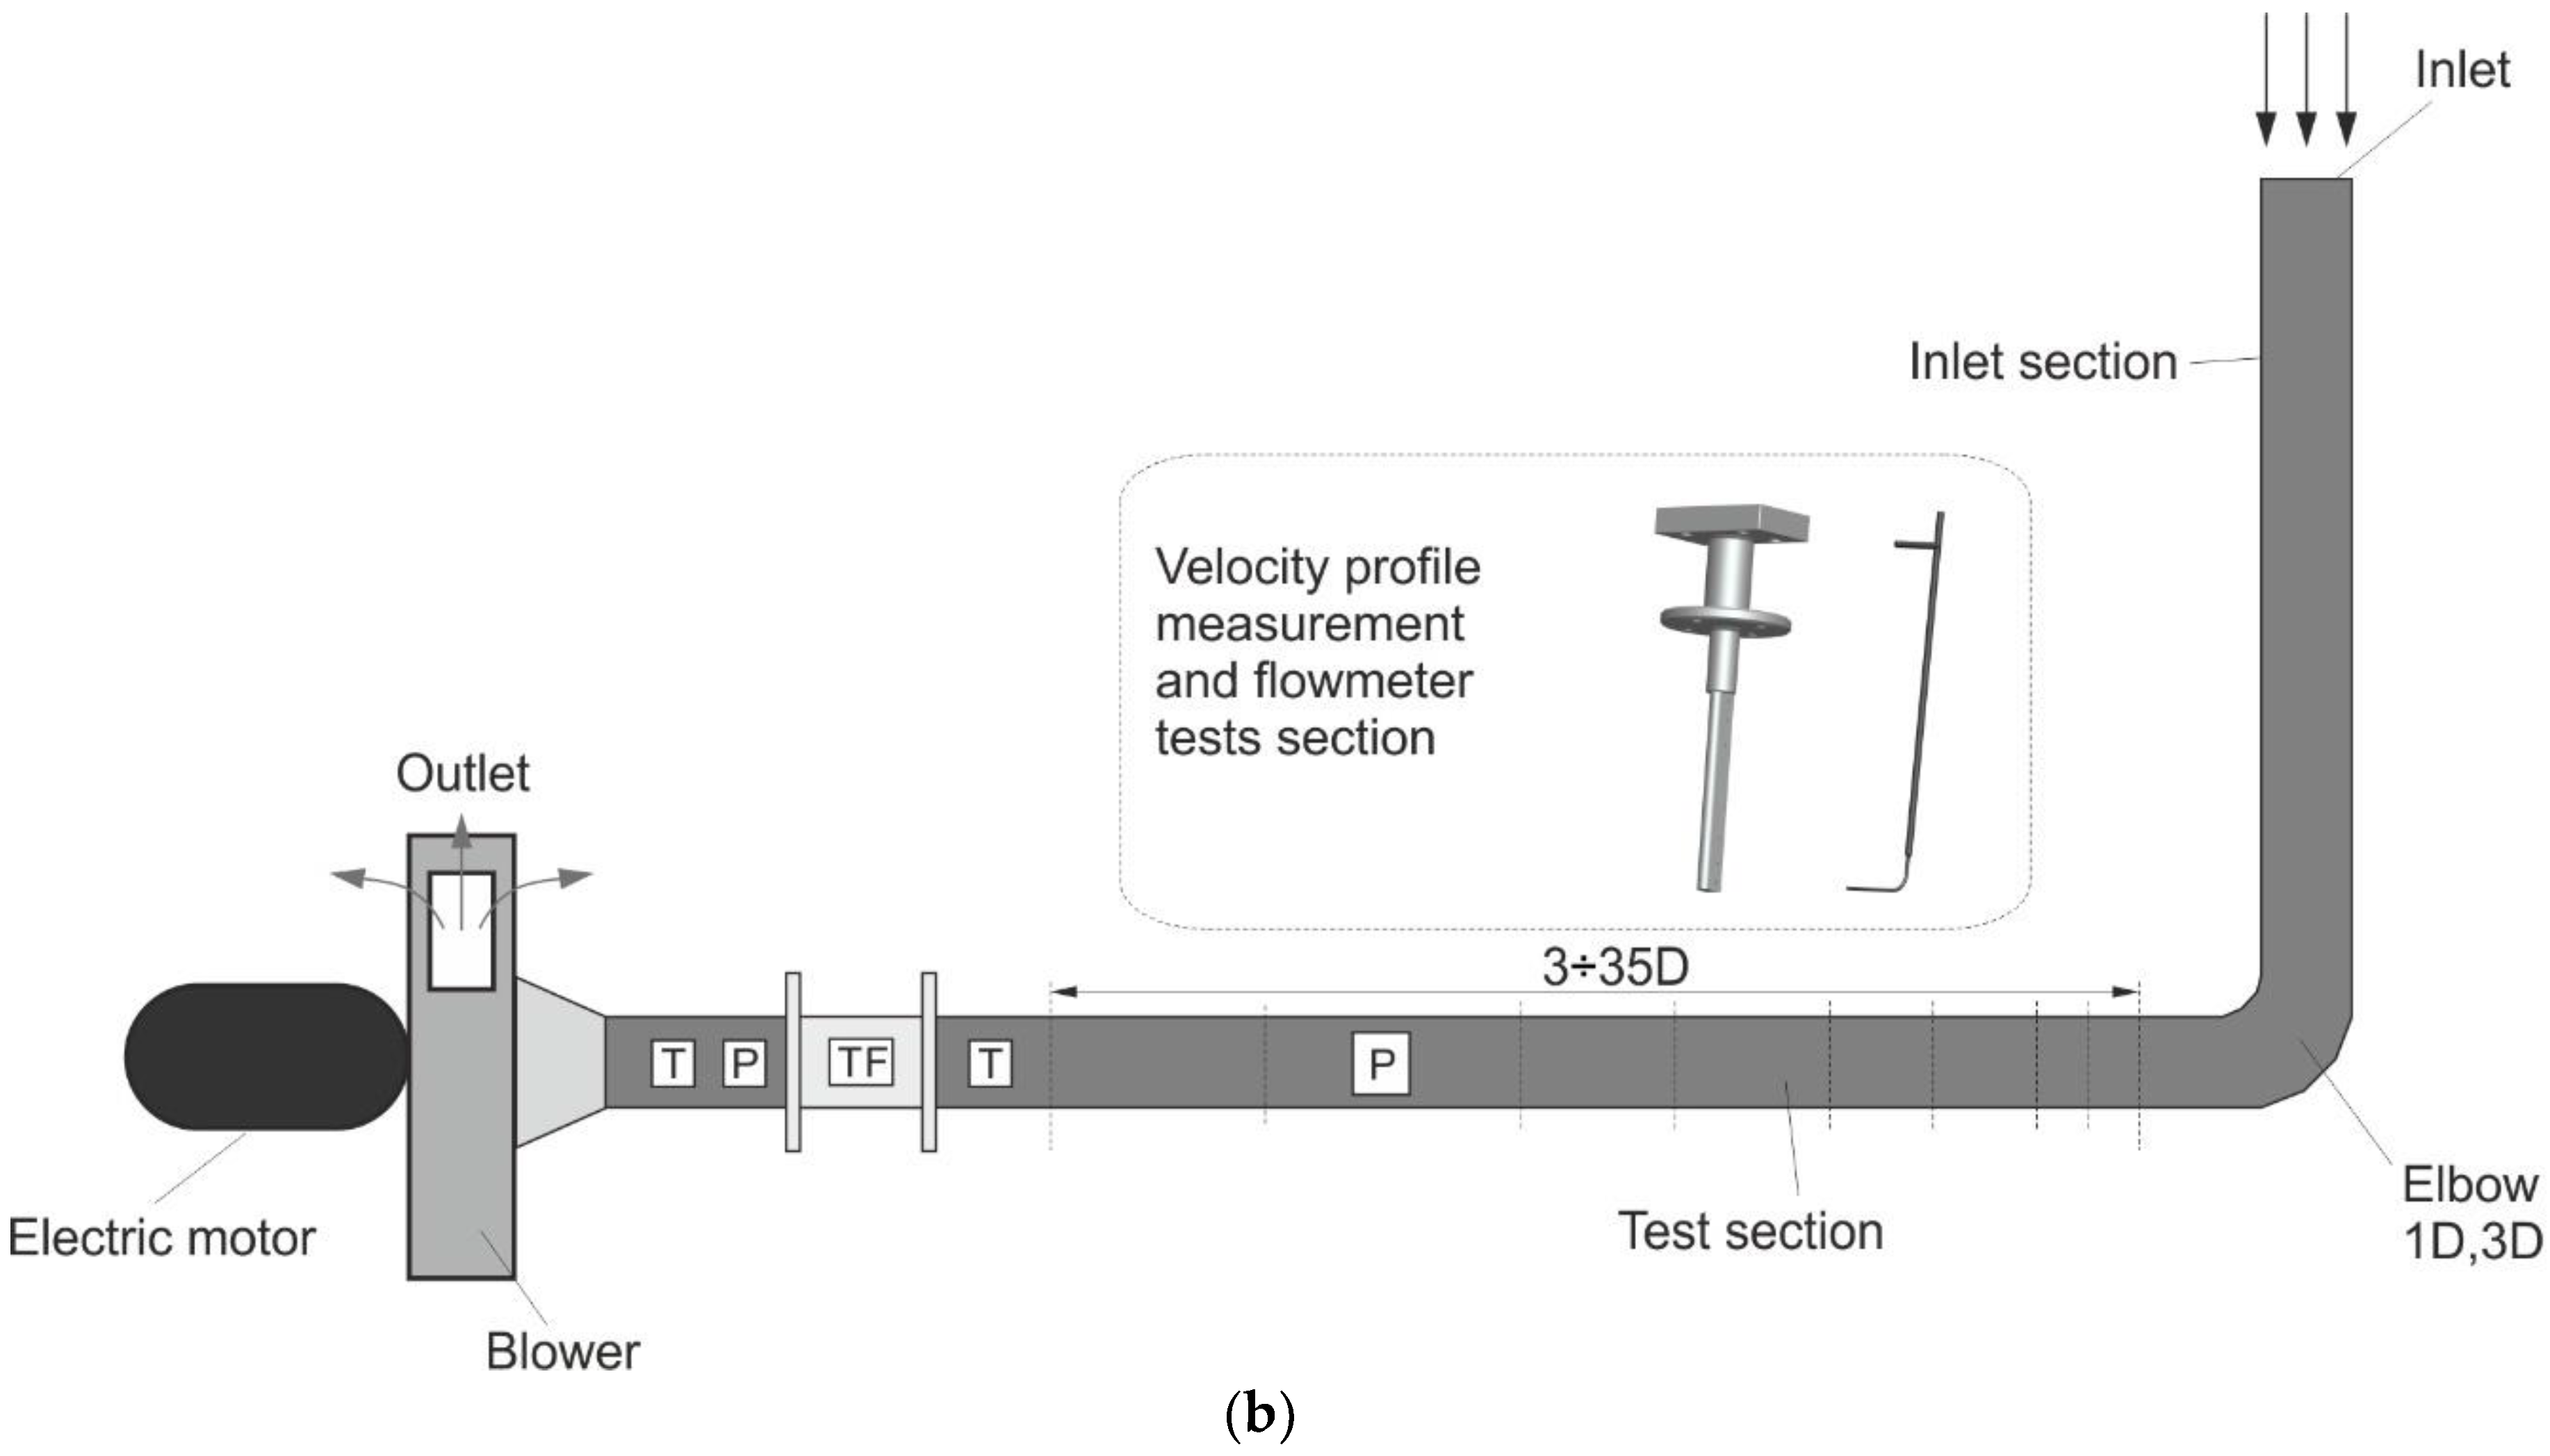
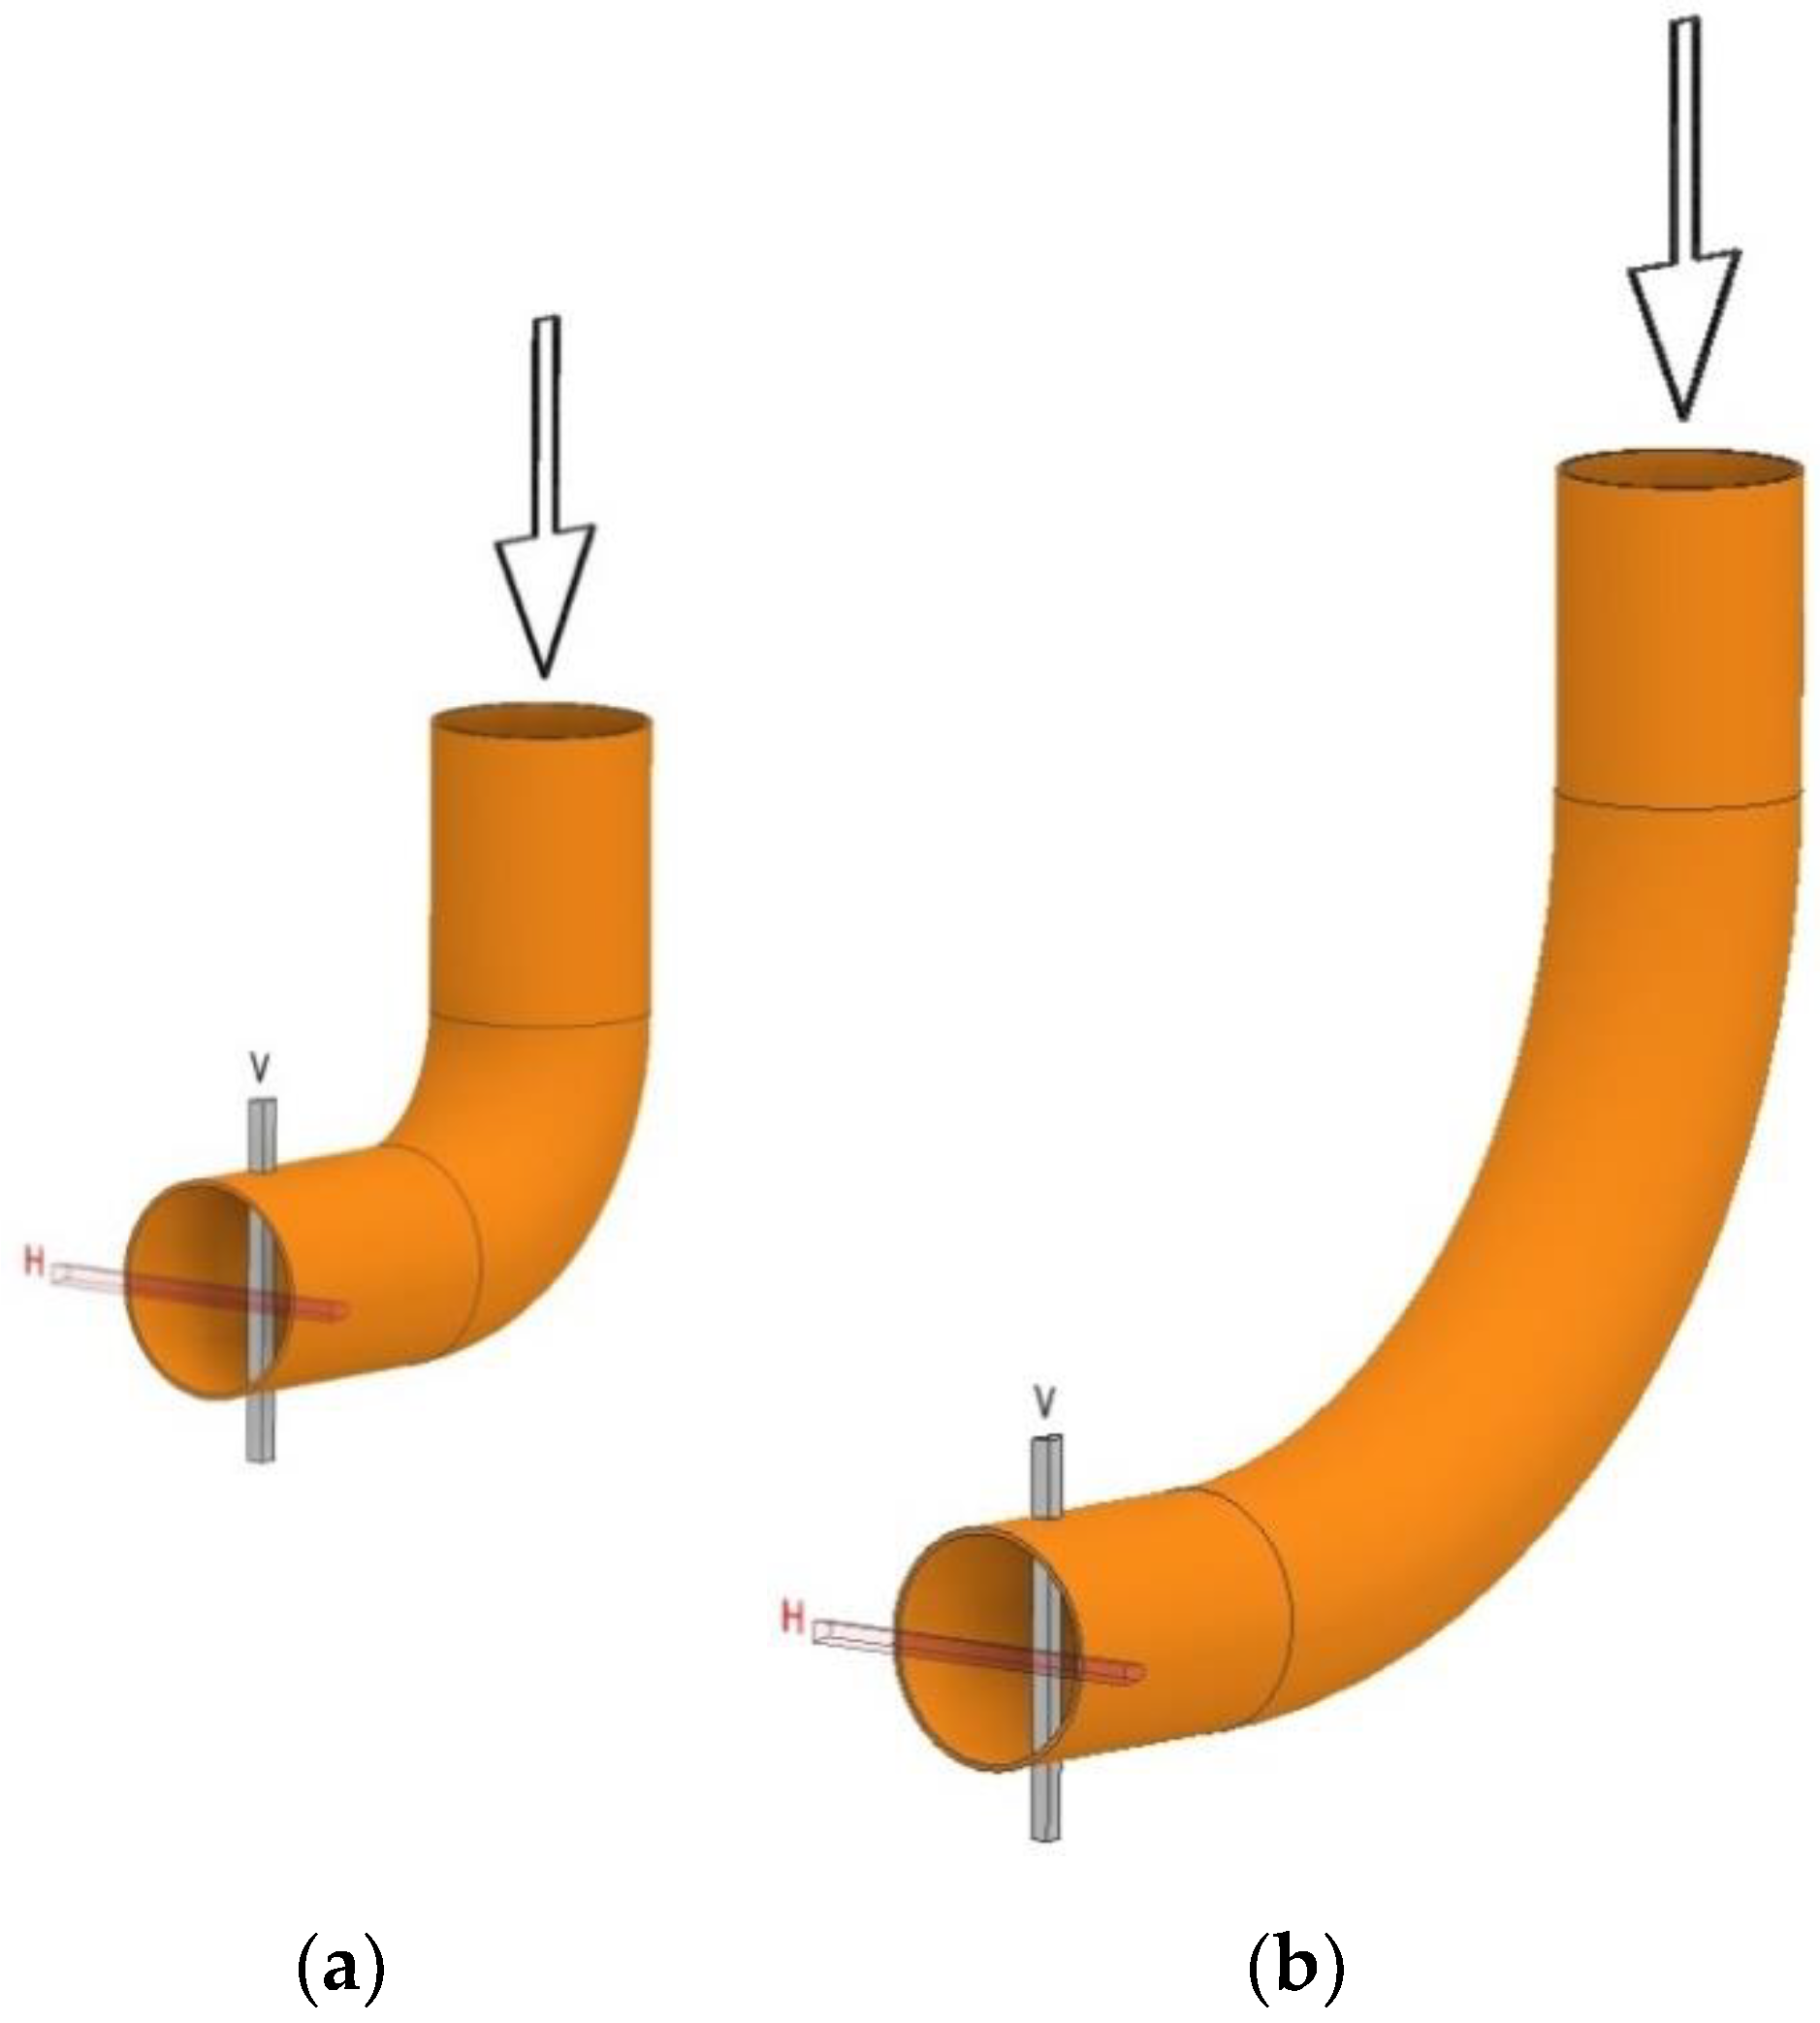
2.2. Test Stand
2.3. Mathematical Model of Transient Flow
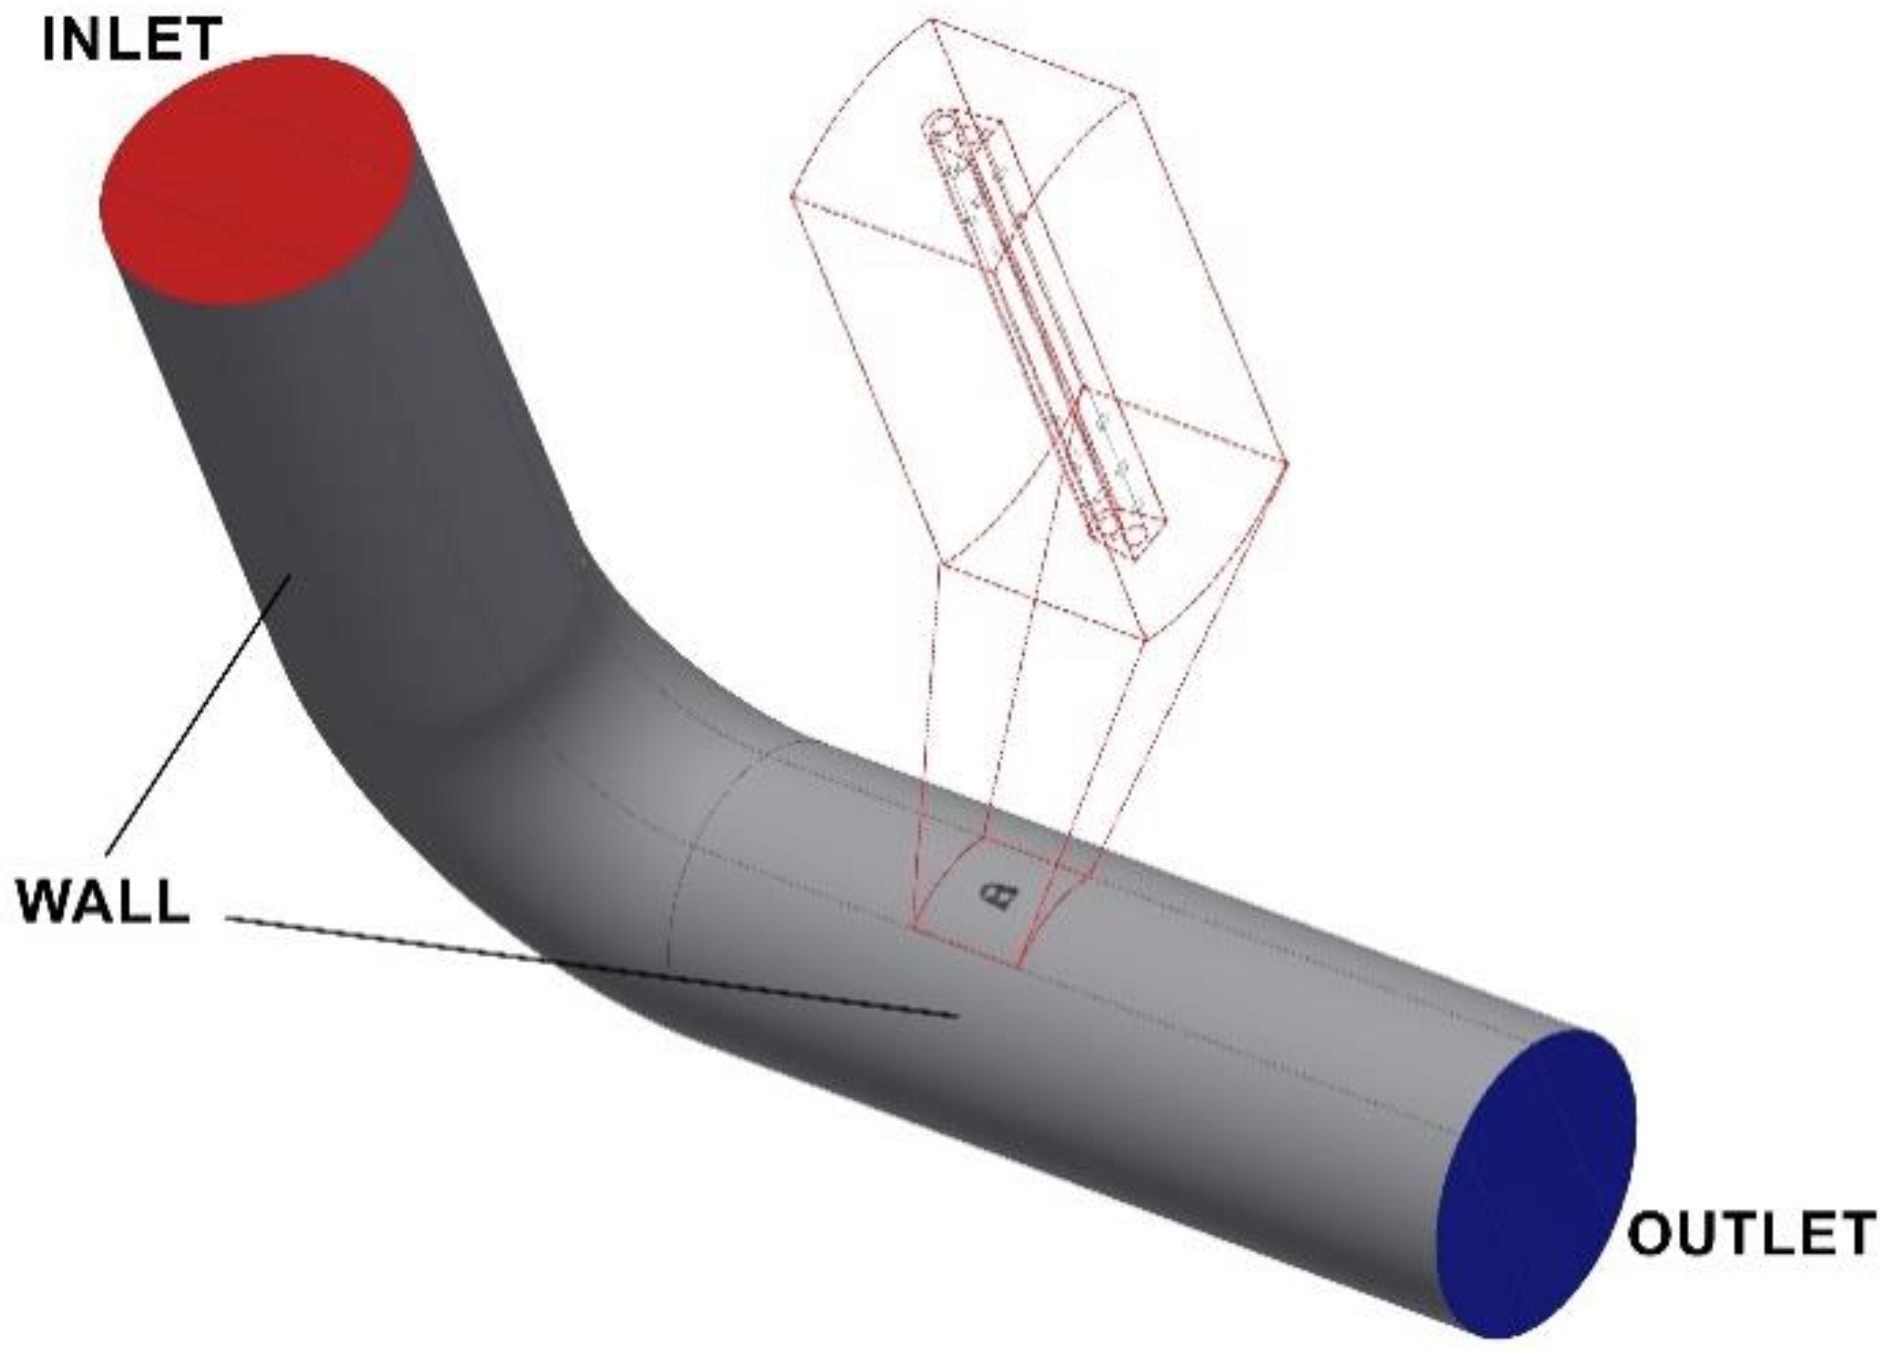
2.4. Mathematical and Numerical Models of Flow around the Probe
- INLET (at the inlet)–k = 1.22 m2/s2, ω = 189.4 1/s, Ux = 18.0 m/s, Uy = 0; Uz = 0
- OUTLET (at the outlet)-
- WALL (along all walls of the pipelines and the probe)-Ux = 0; Uy = 0; Uz = 0
- Gradient—least square cell-based
- Pressure—second-order
- Momentum—second-order upwind
- Turbulent kinetic energy—second-order upwind,
- Specific dissipation rate—second-order upwind
- Transient Formulation—second-order implicit
- max iteration per time step-20
- continuity–10−5
- x-velocity–10−6
- y-velocity–10−6
- z-velocity–10−6
- k–10−6
- omega–10−6
3. Results and Discussion
4. Conclusions
- (a)
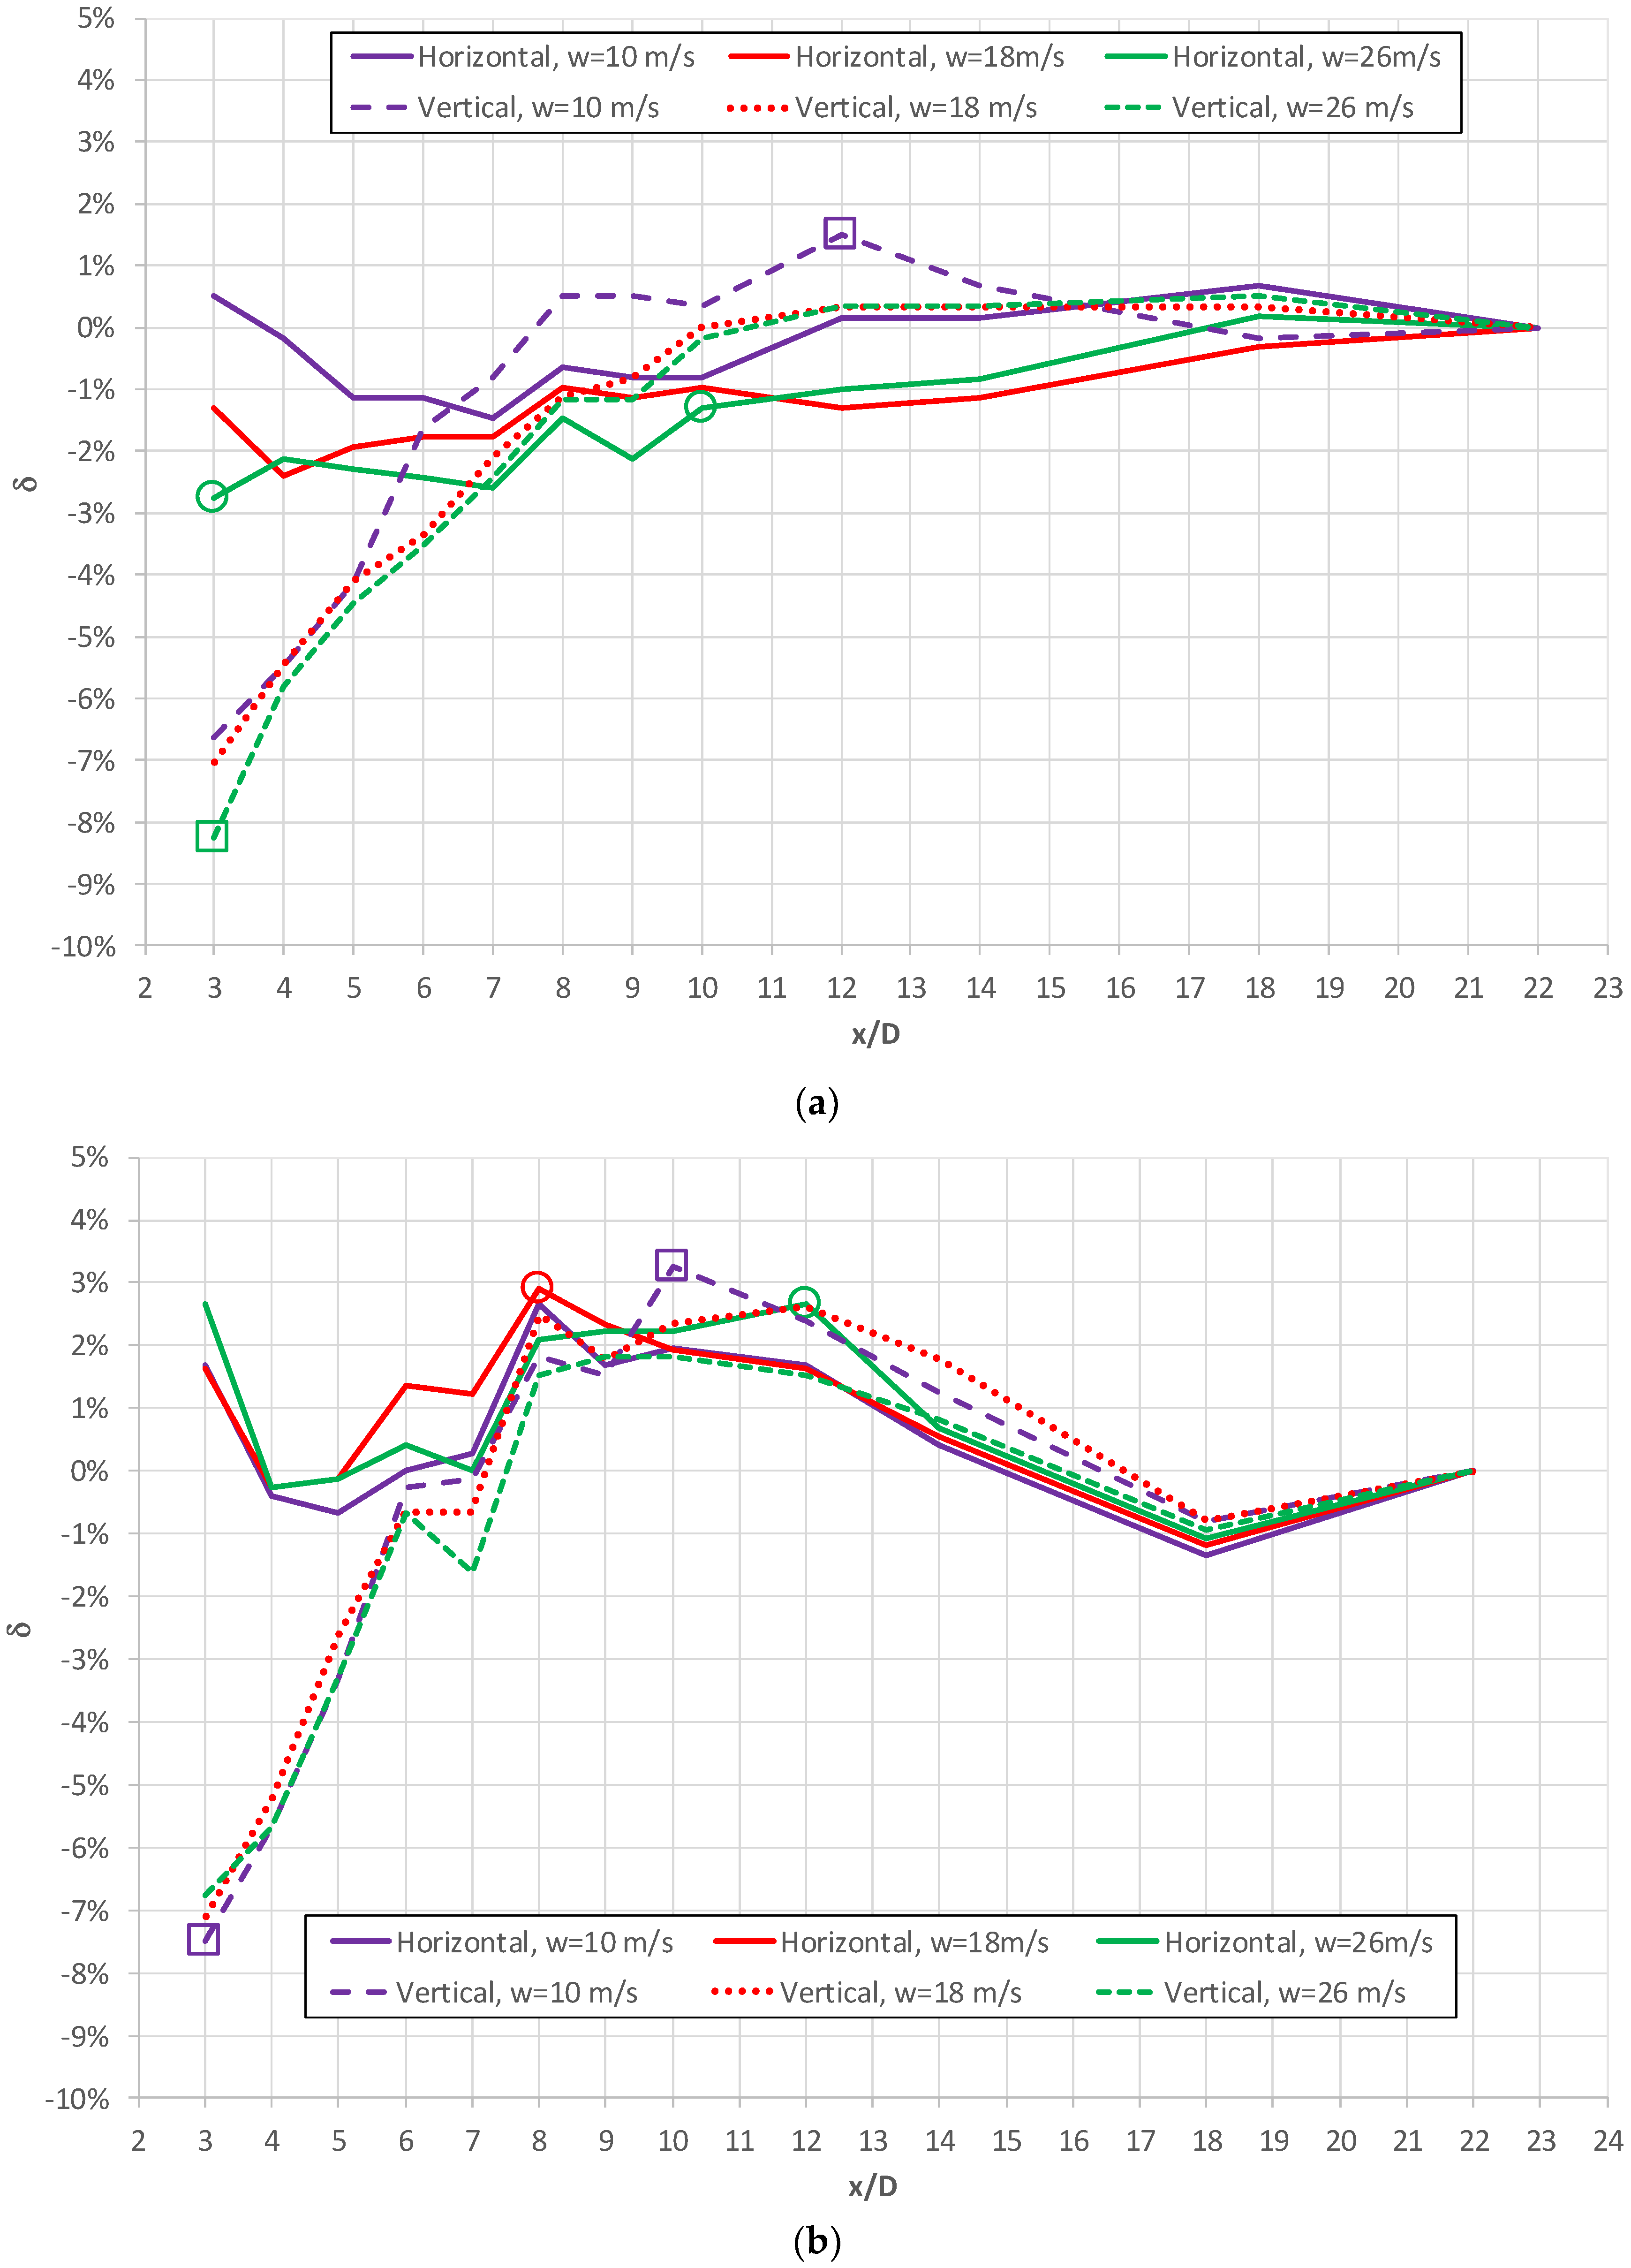
- The results of detailed studies summarized in Table 1 provide information on the distance between the probe and the obstruction and offer insight into its installation in a way that can lead to a reduction in additional measurement error. As shown in Table 1, the results of this systematic error can assume considerable values with a different sign. An additional error in the range 2–3% can sometimes be considered acceptable for technological installations and automatic regulation systems.
- (b)
- In some investigated cases, the standard k-ω turbulence model when applied provided good quantitative conformity between the calculated and the measured differential pressures inside the averaging chambers.
- (c)
- In some cases, mathematical modeling and numerical simulations can provide useful insights into assessing this additional measurement error. Most importantly, information regarding phenomena of flow around a probe and the effect of the distortion of a velocity field can be obtained.
- (d)
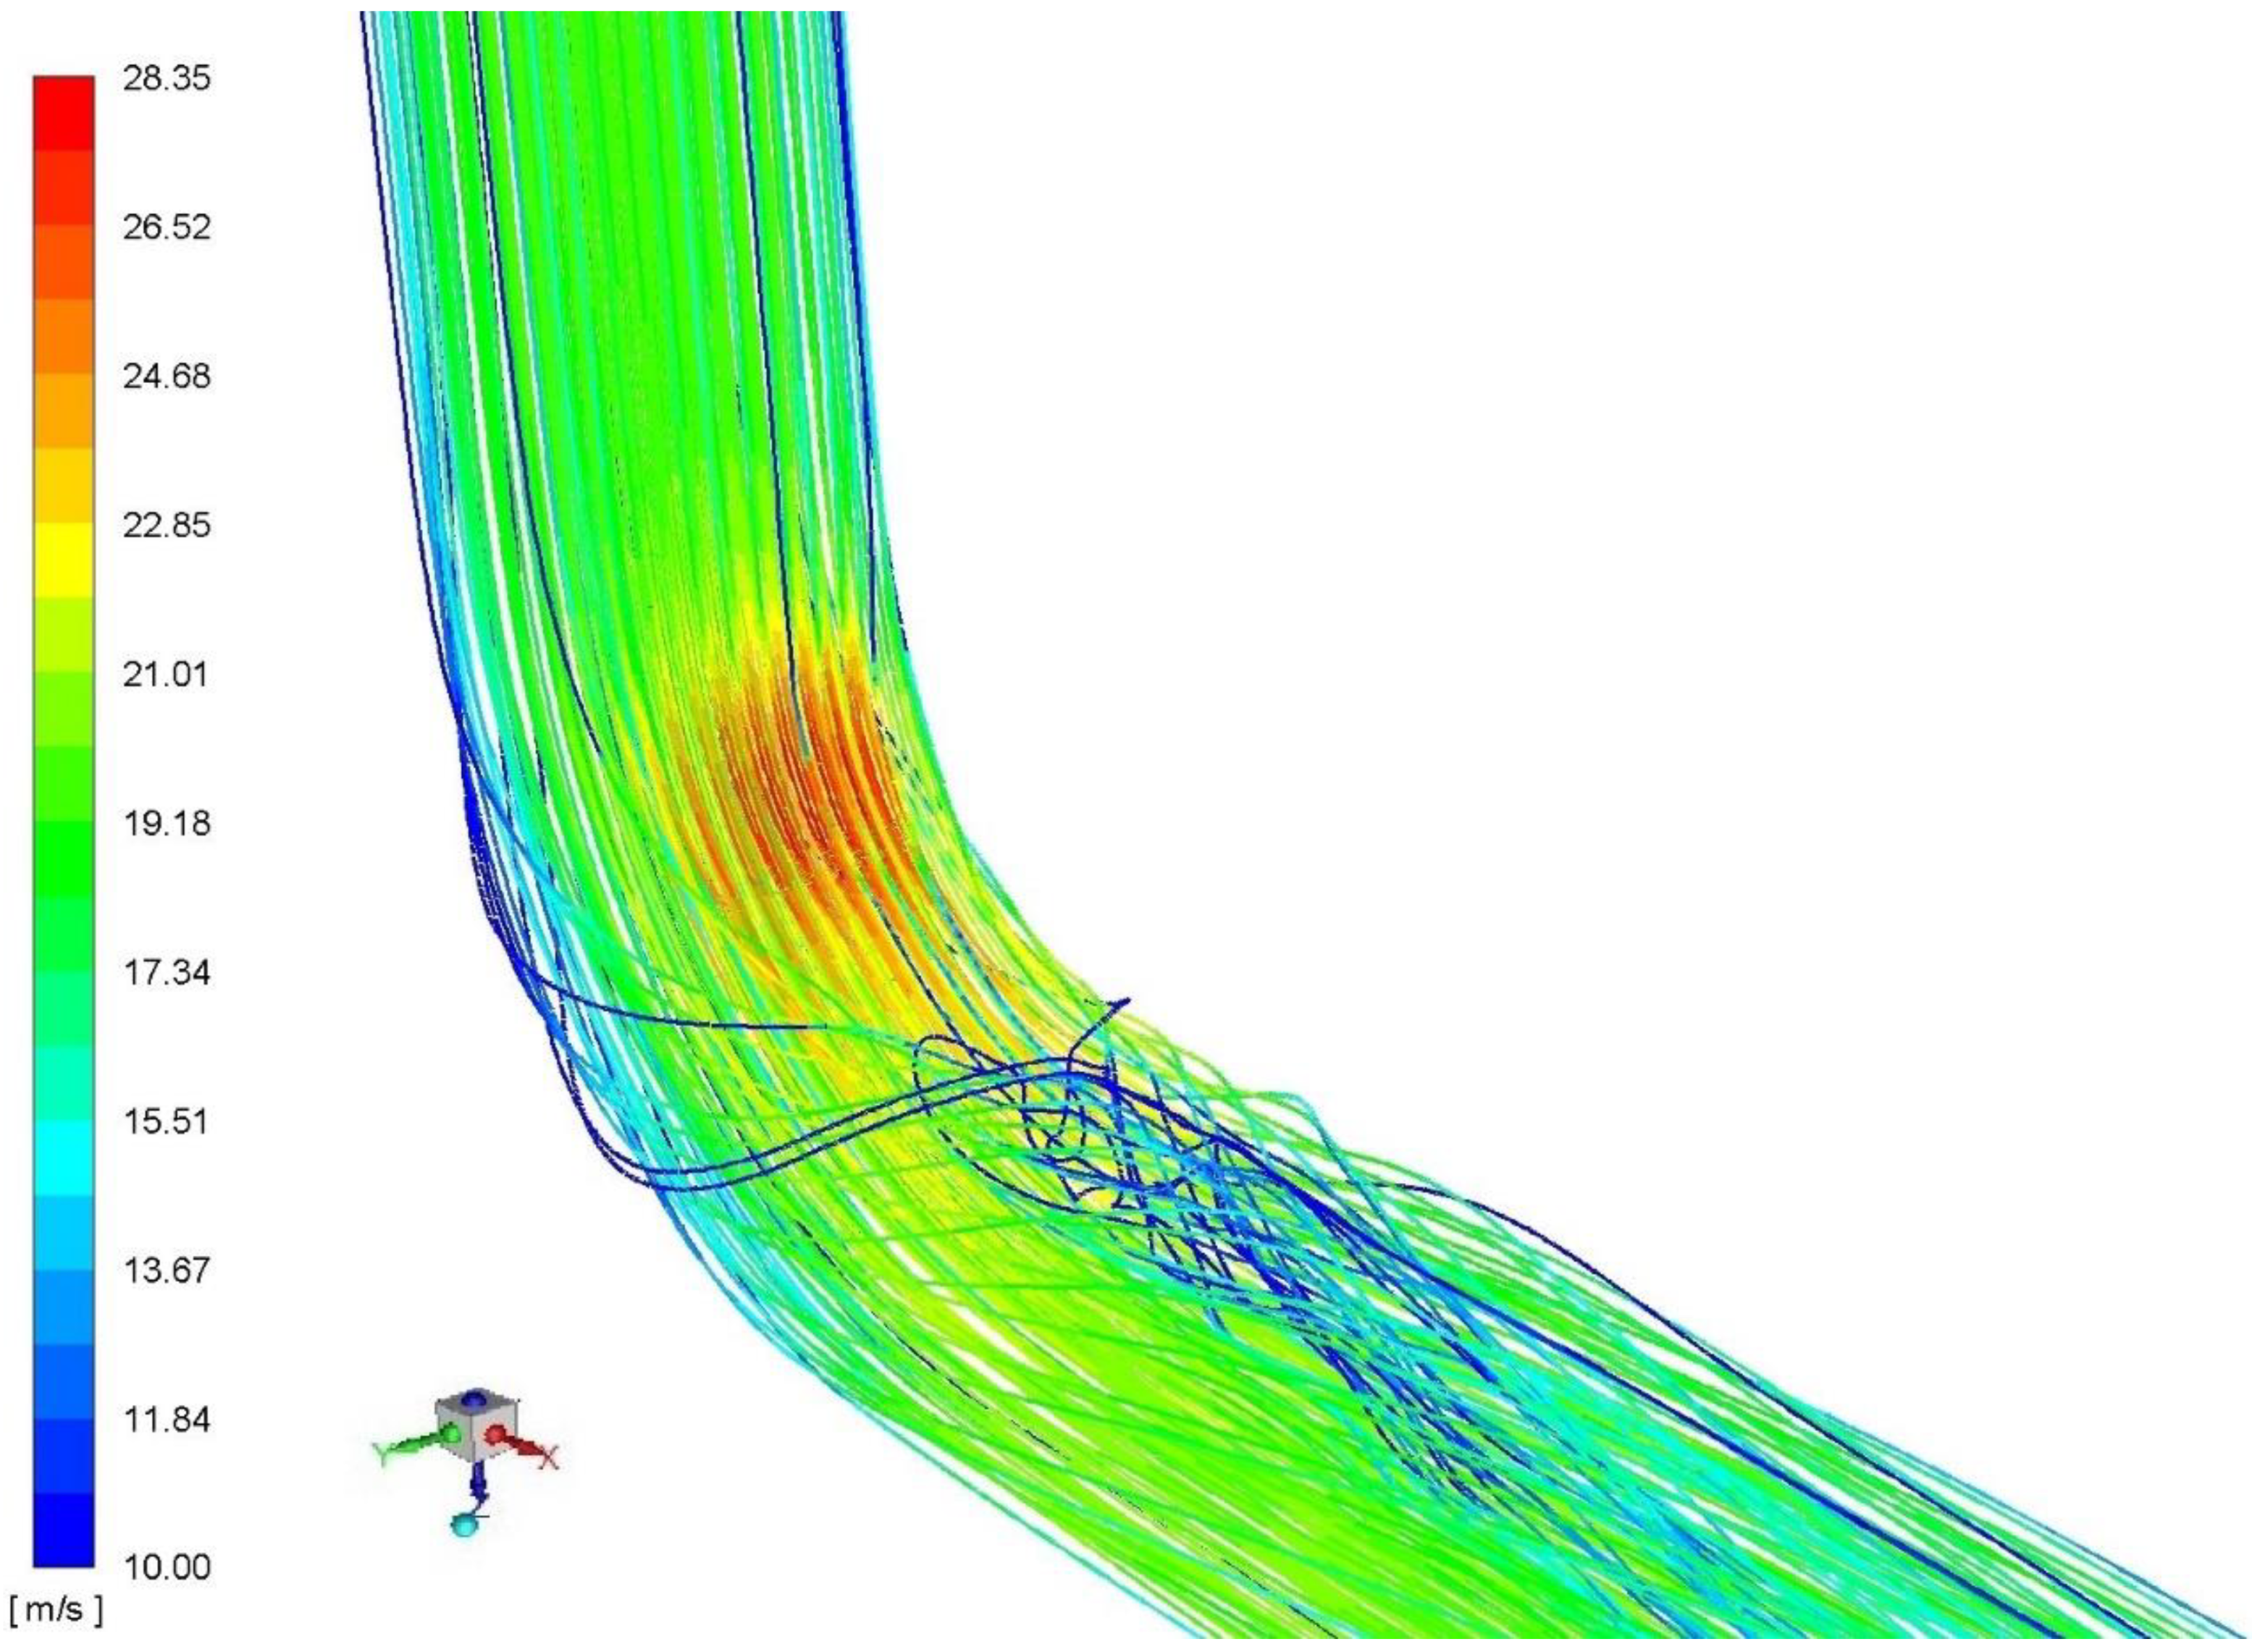
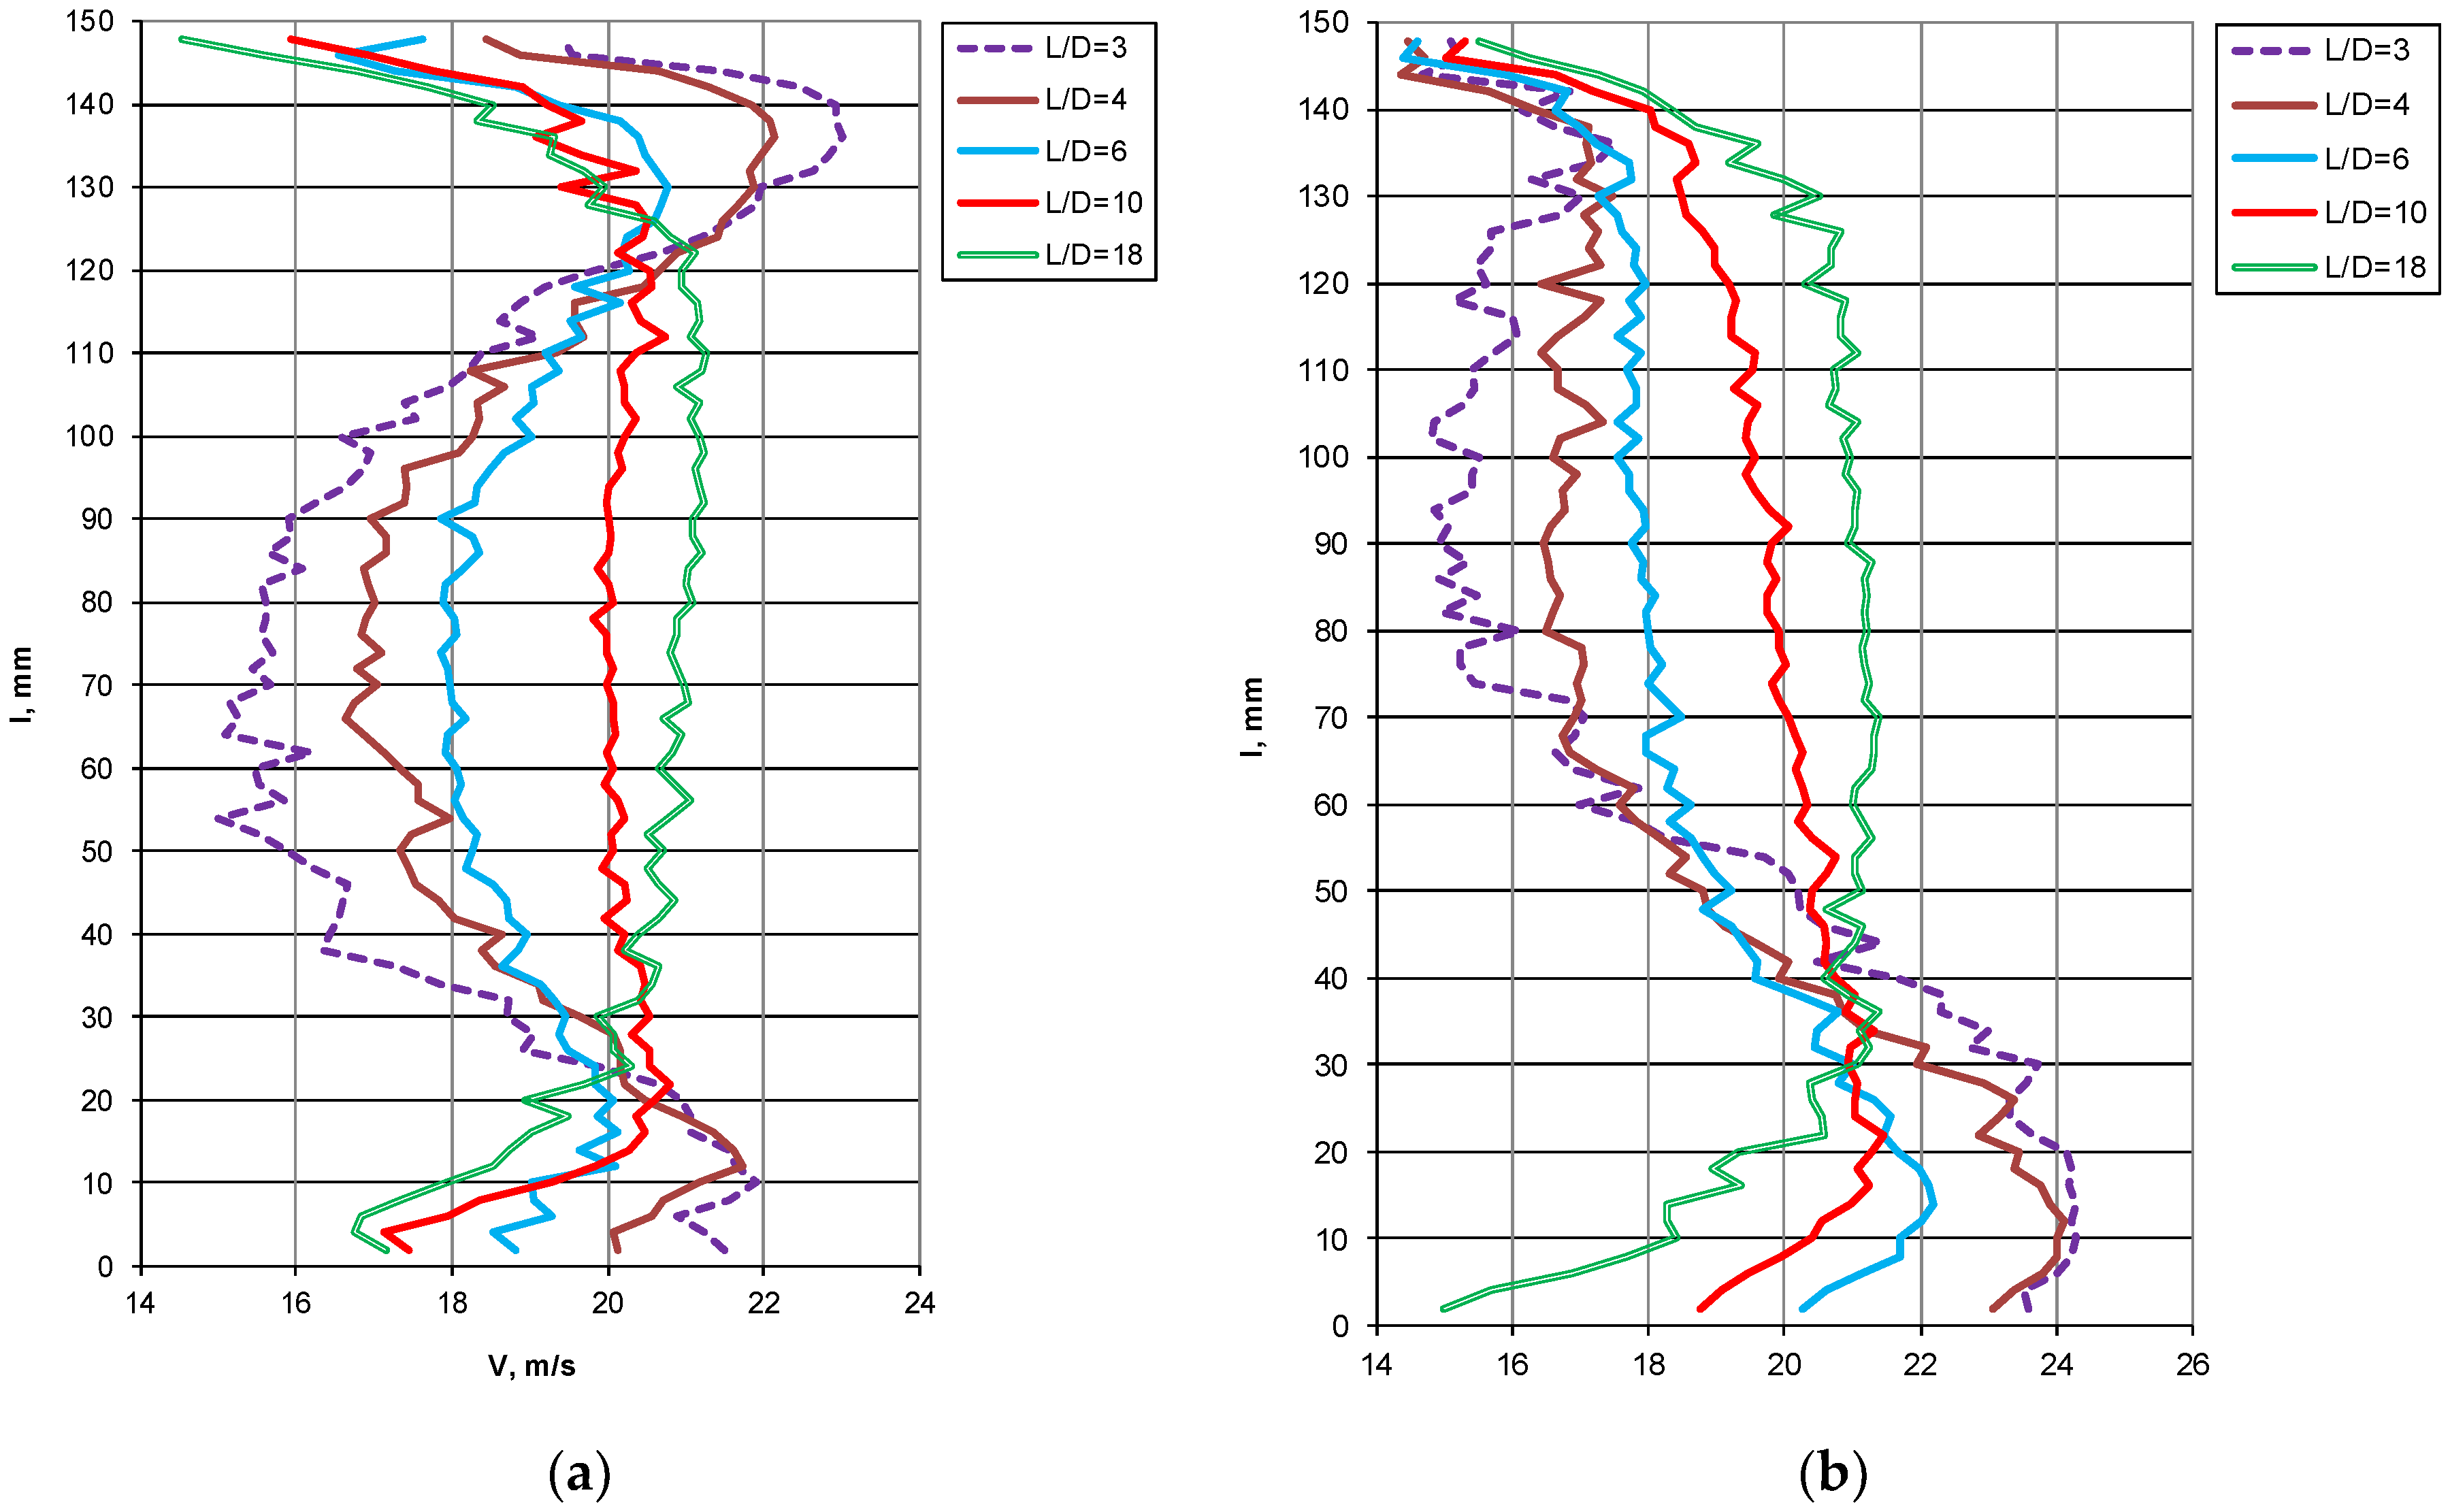
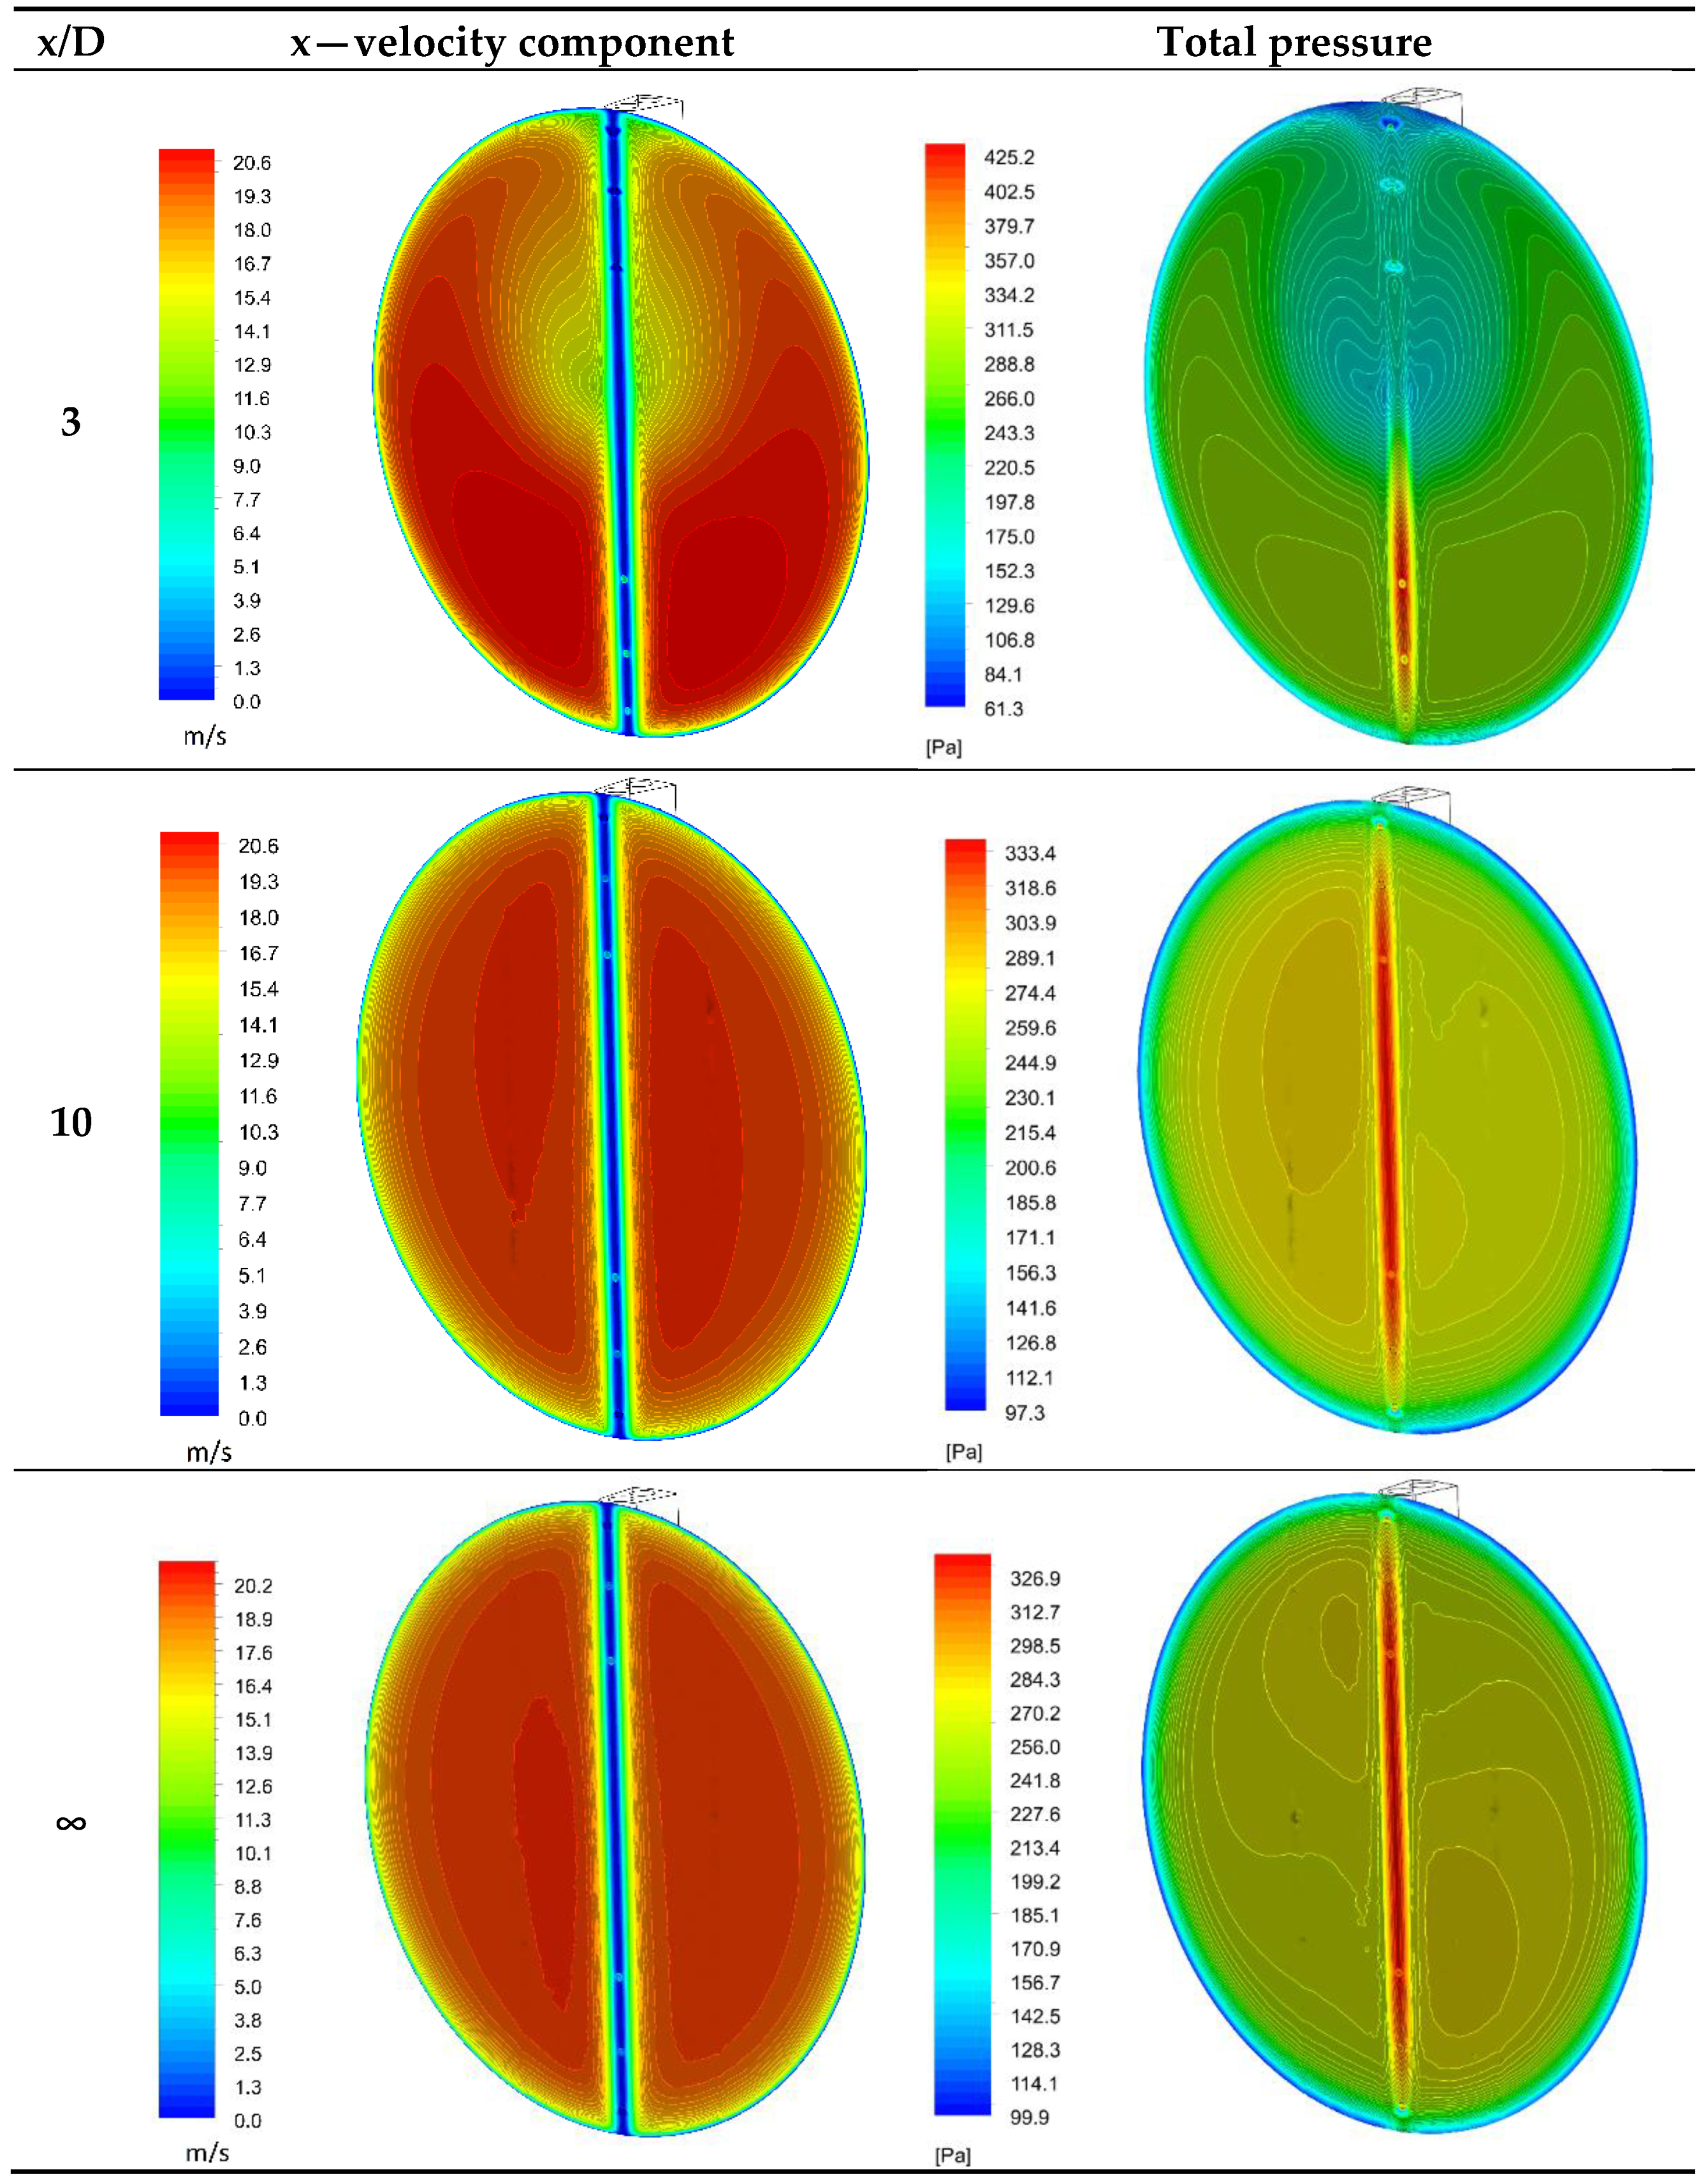
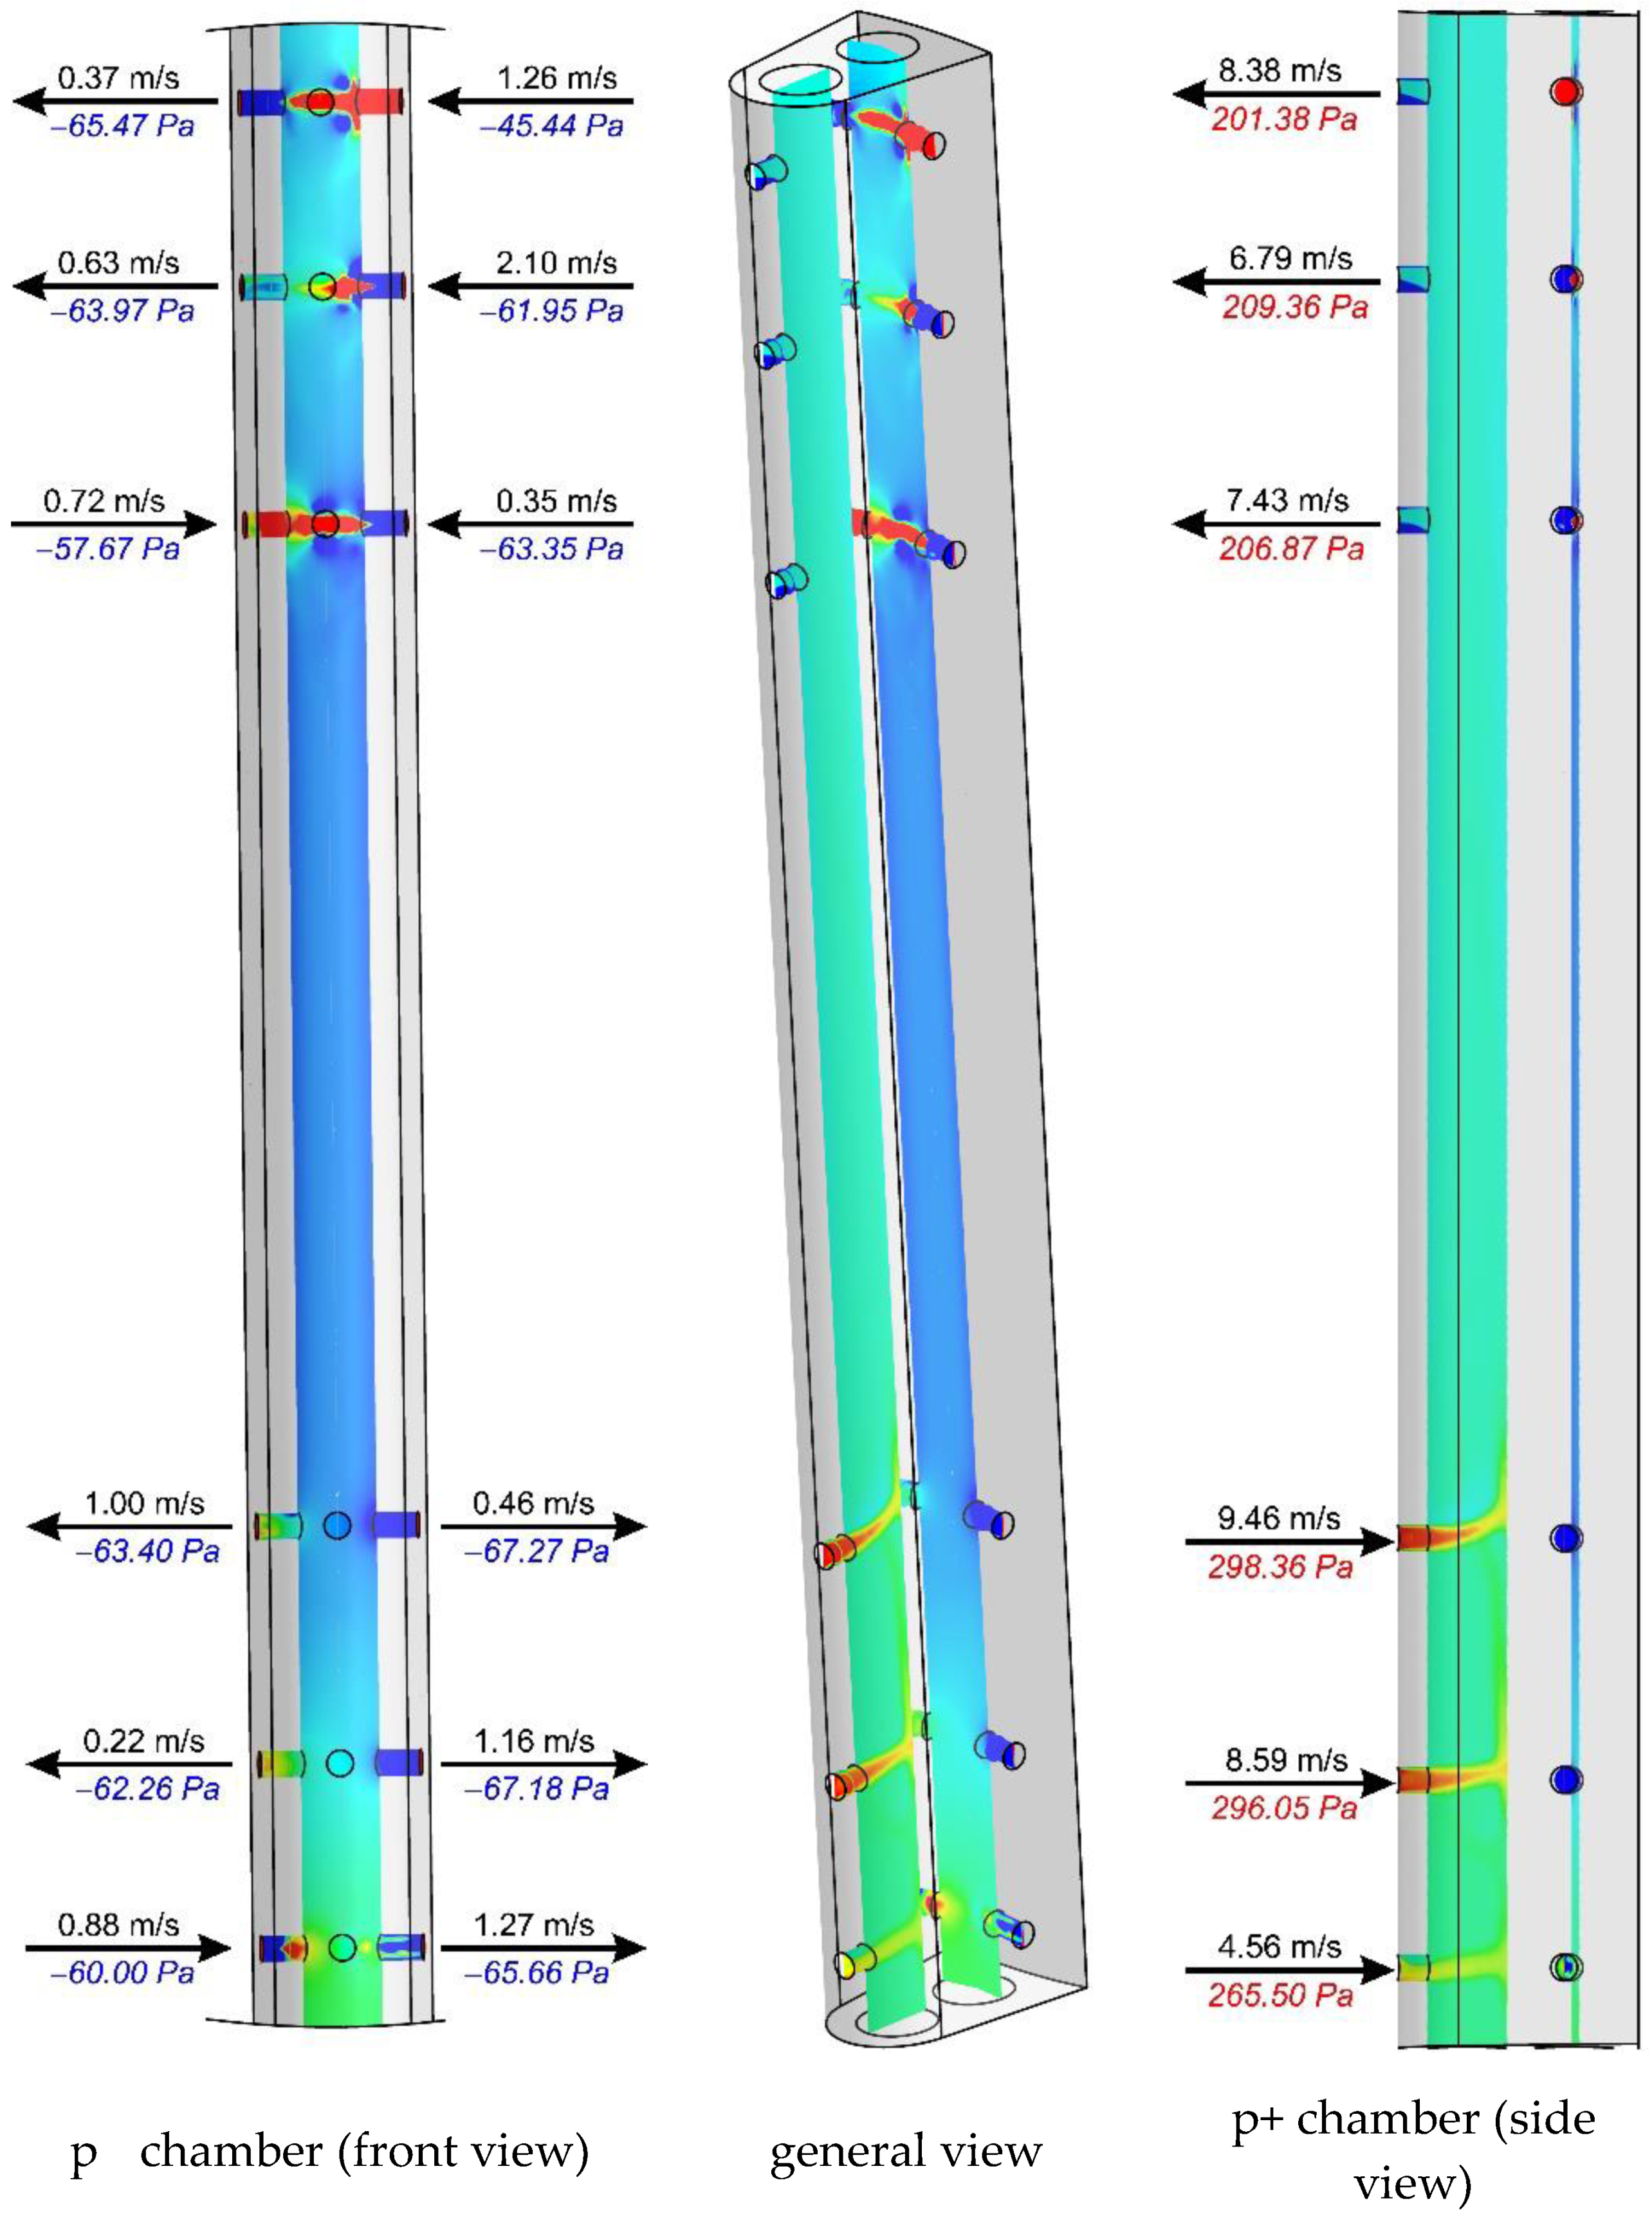
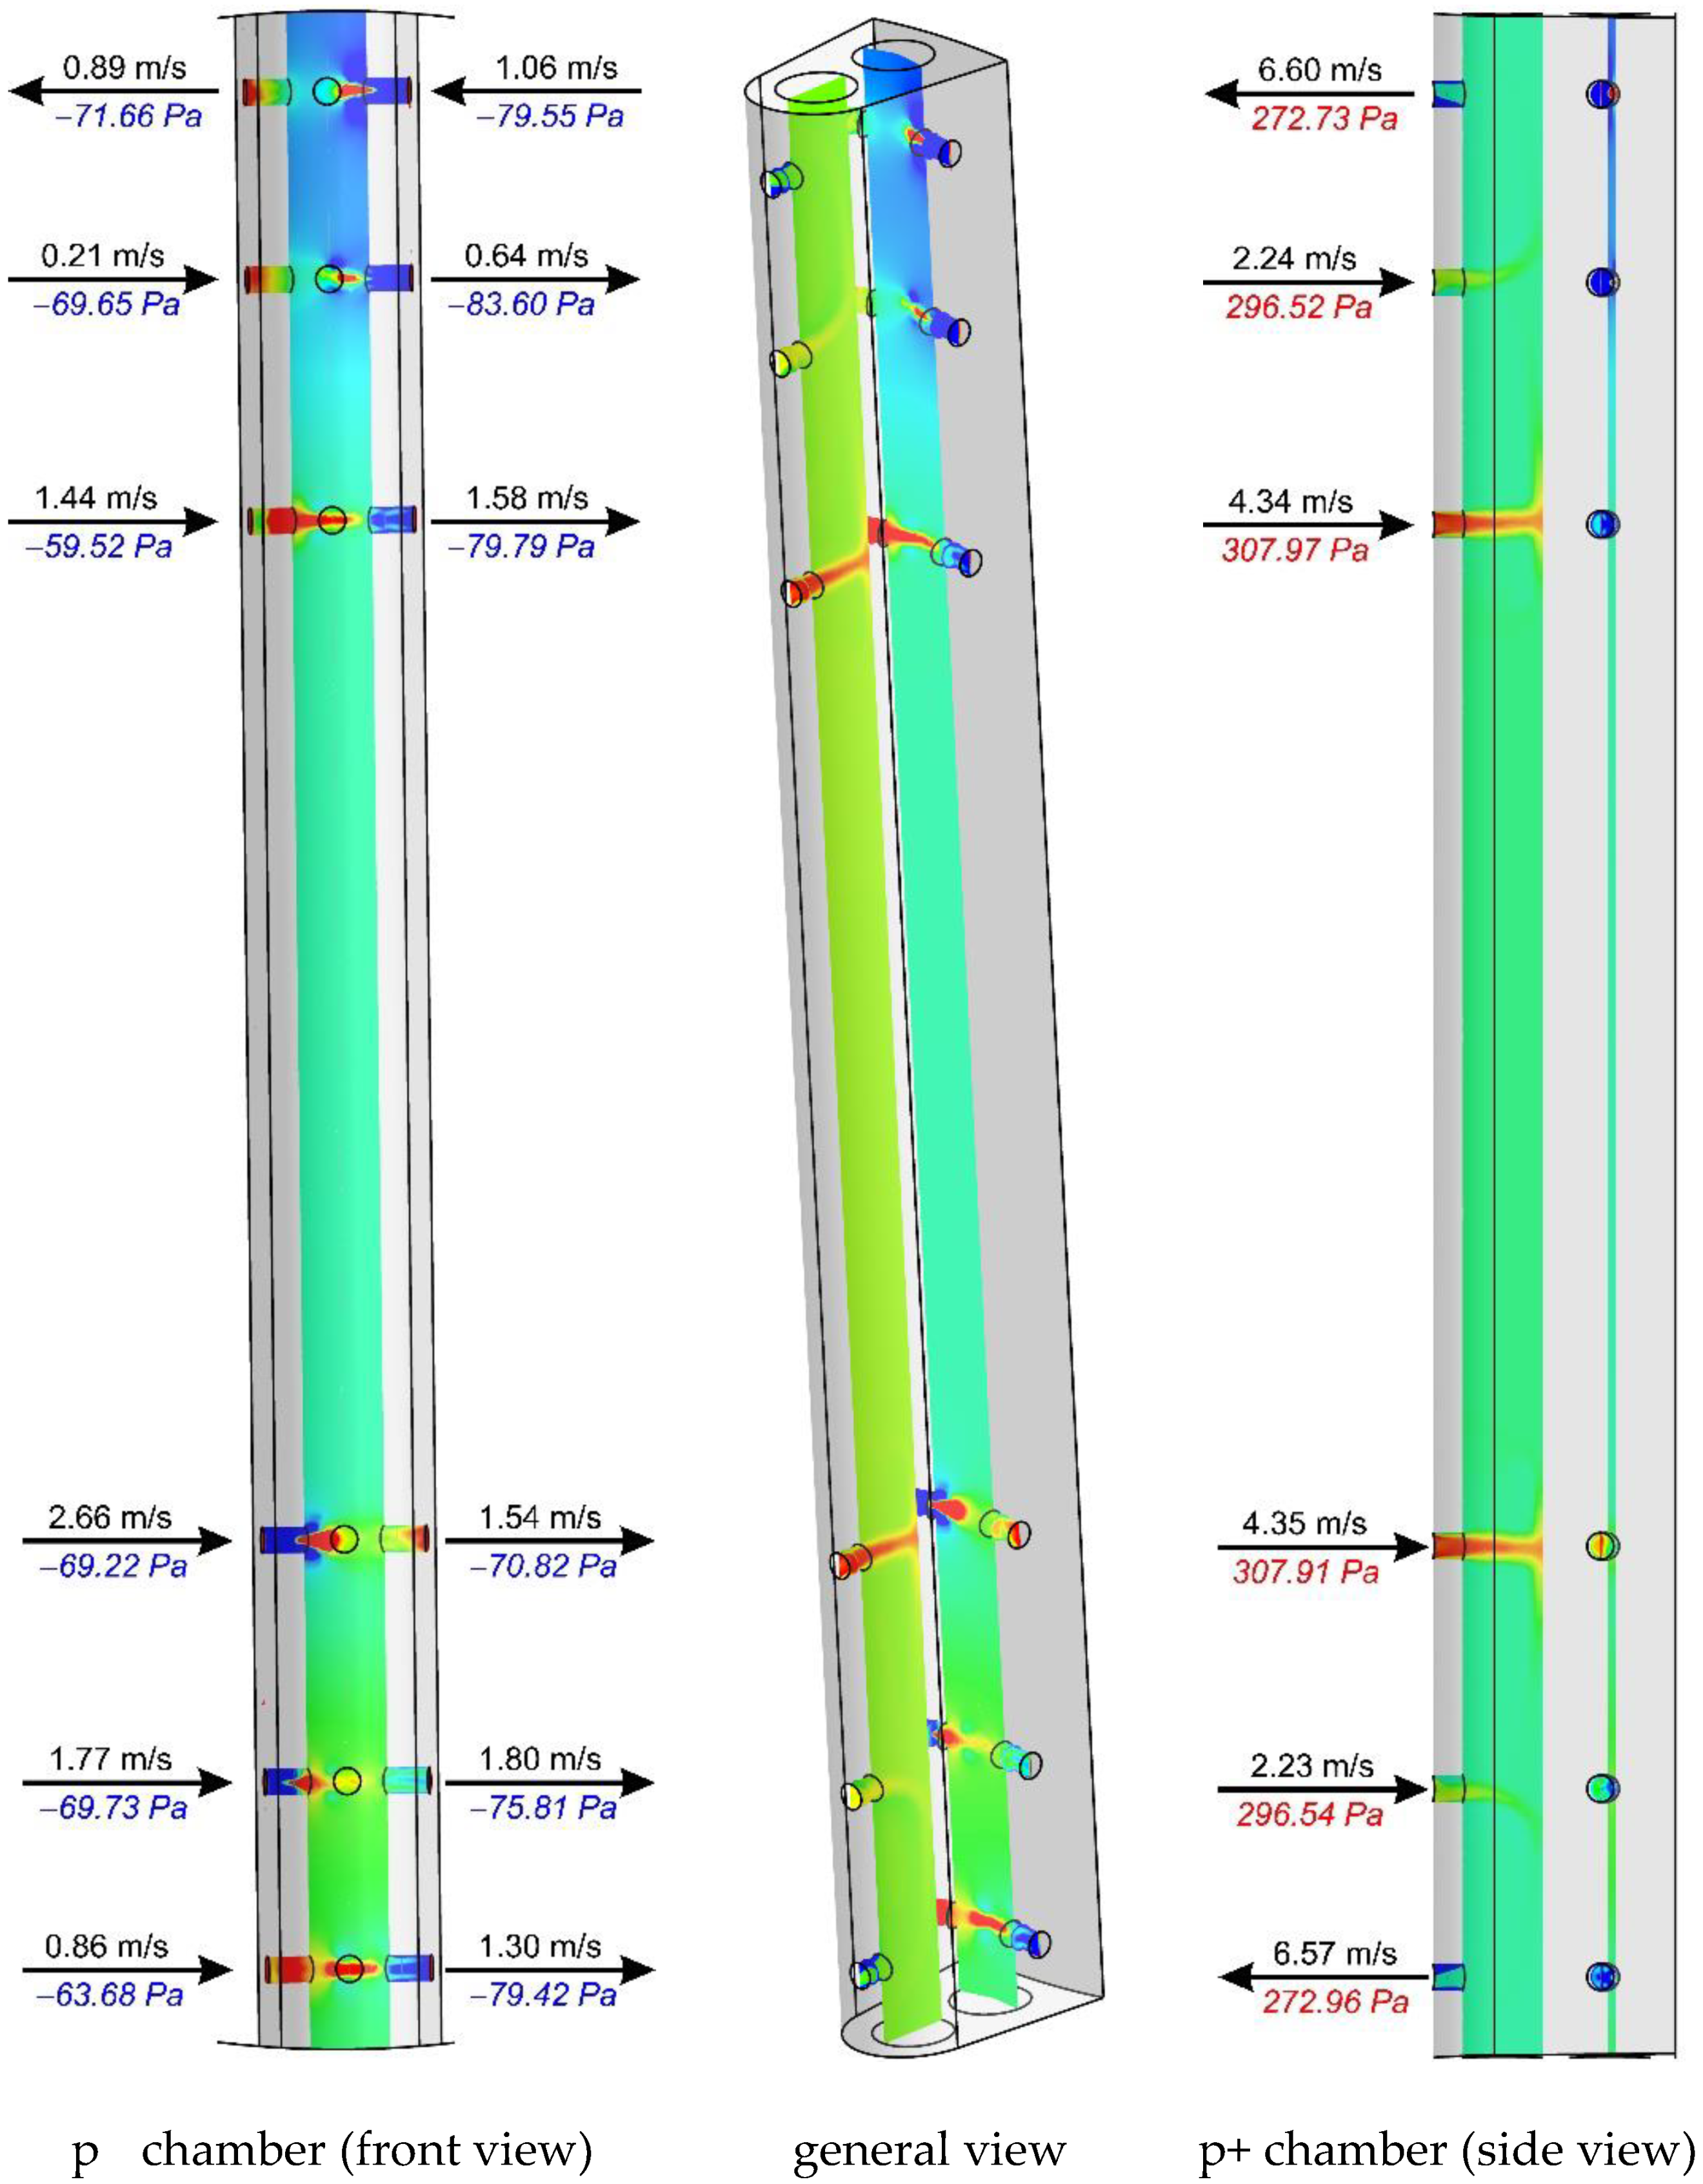
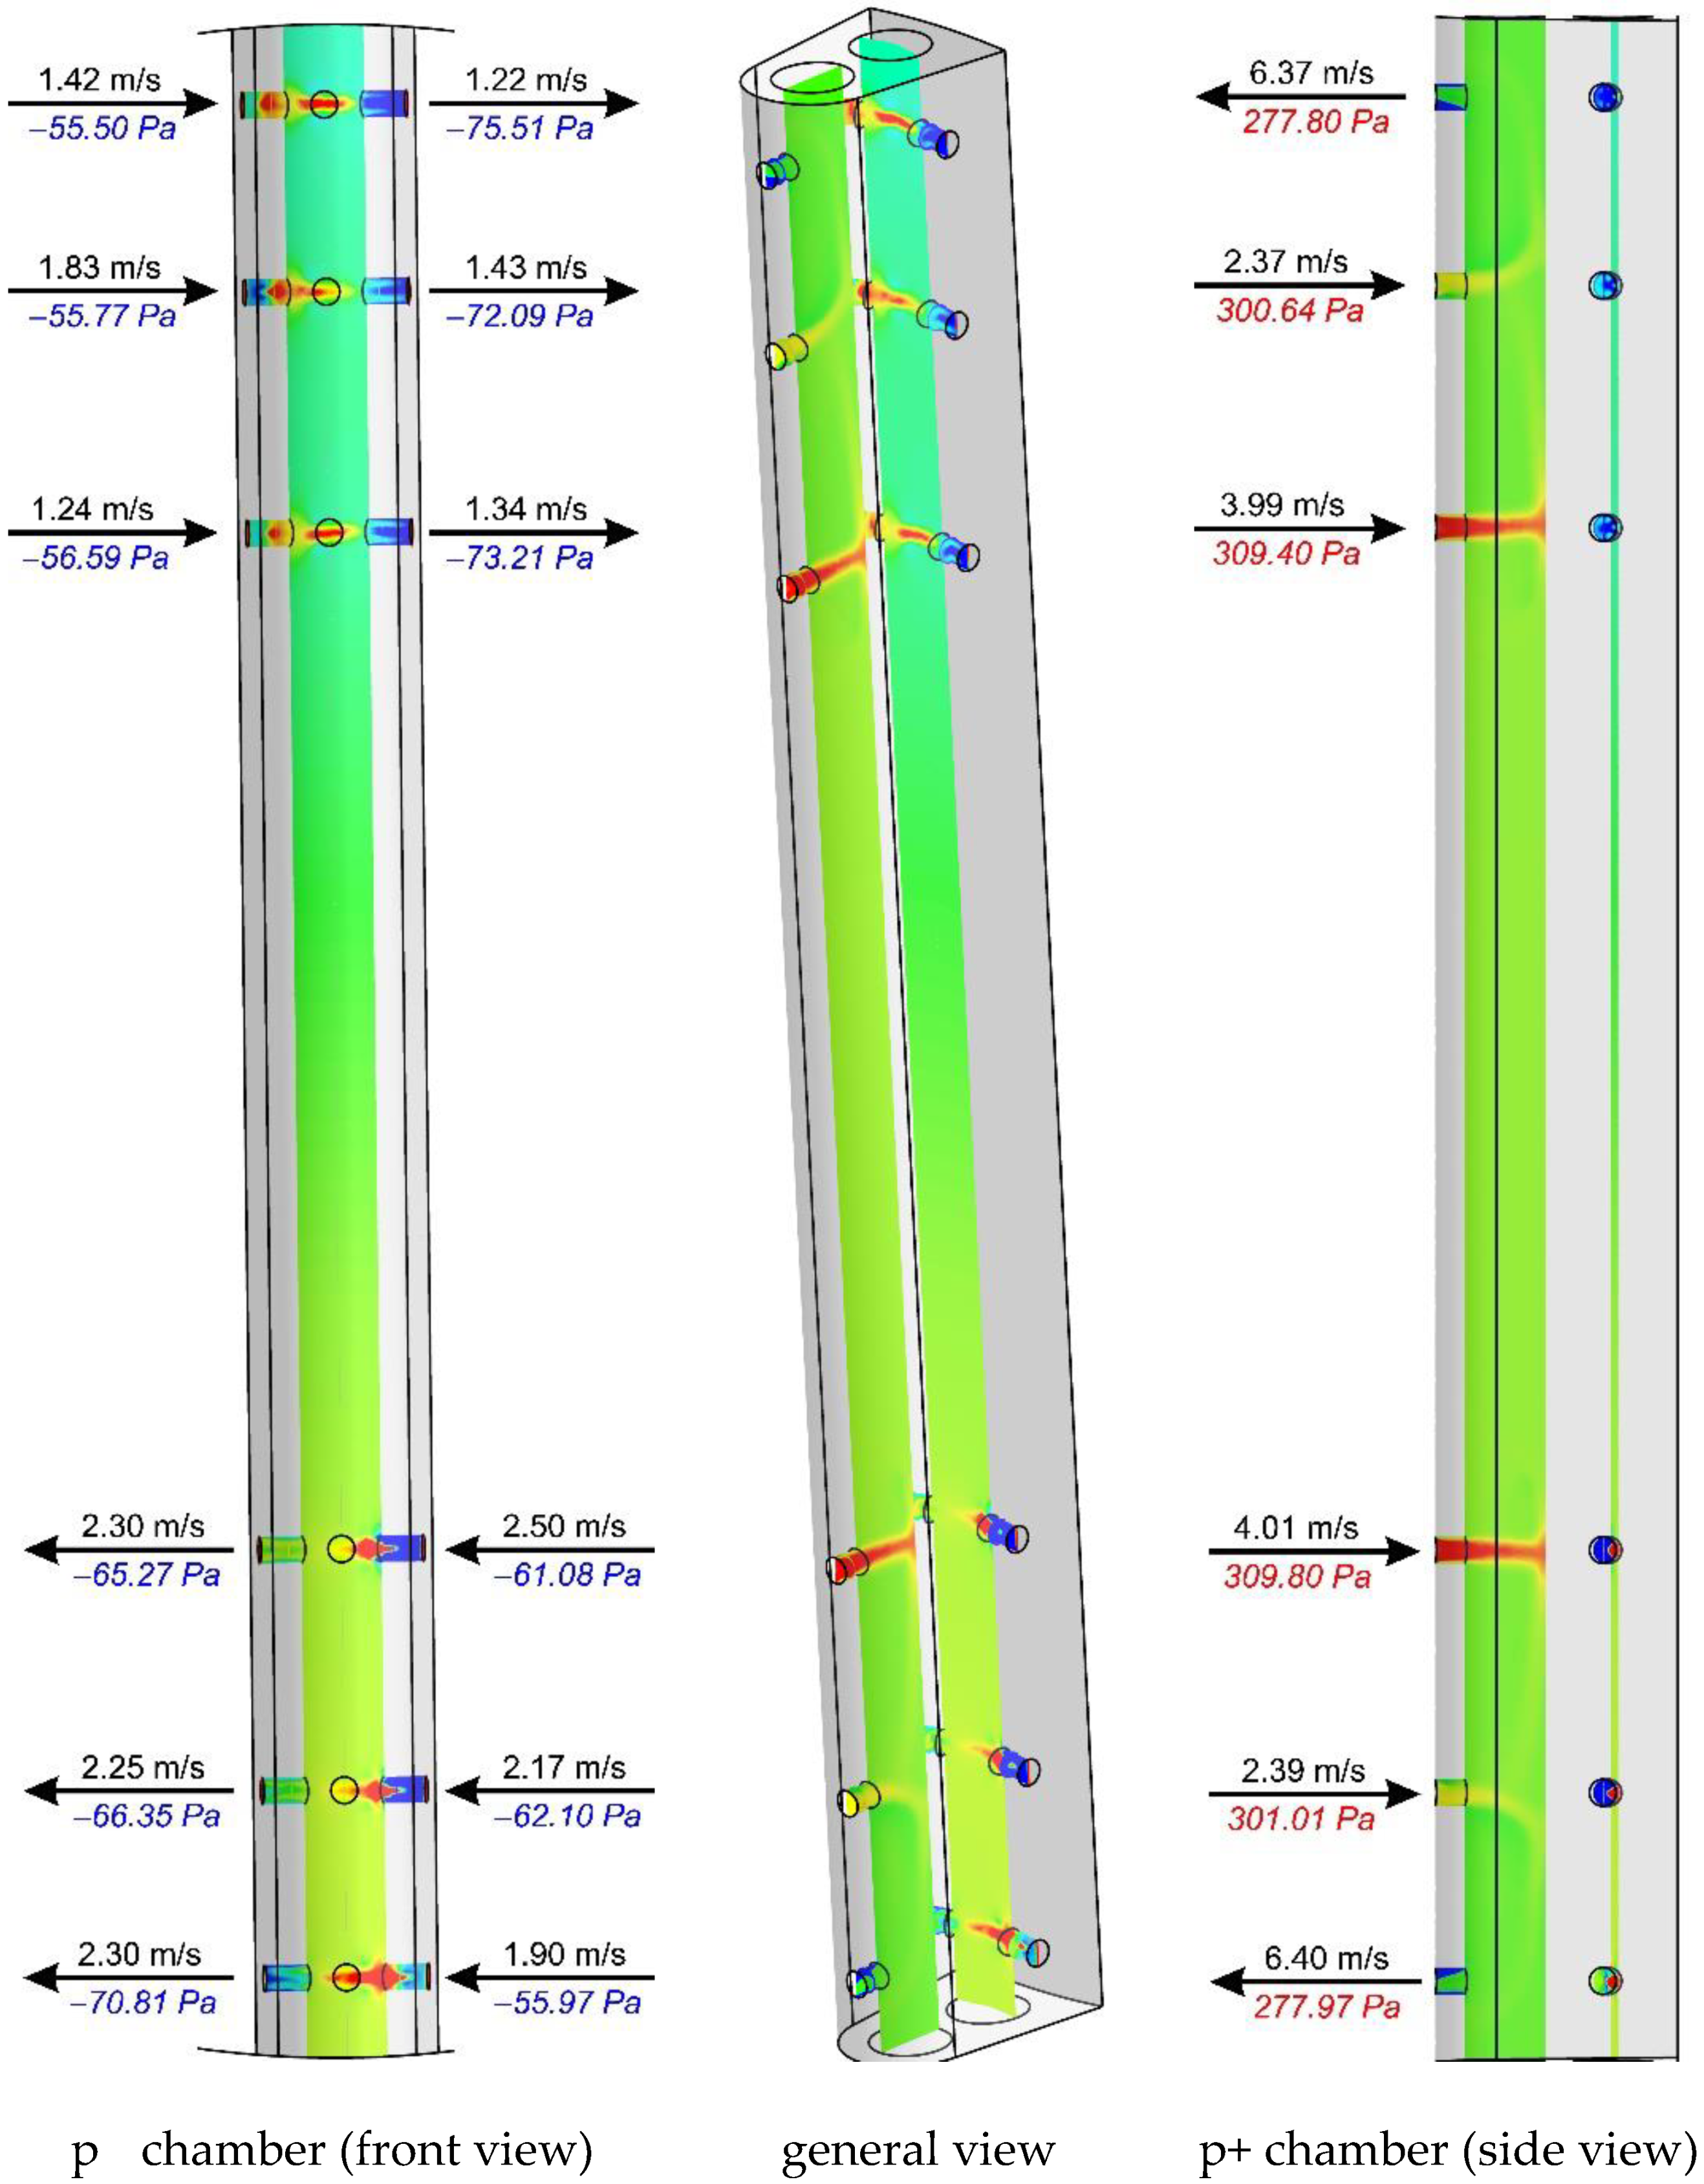
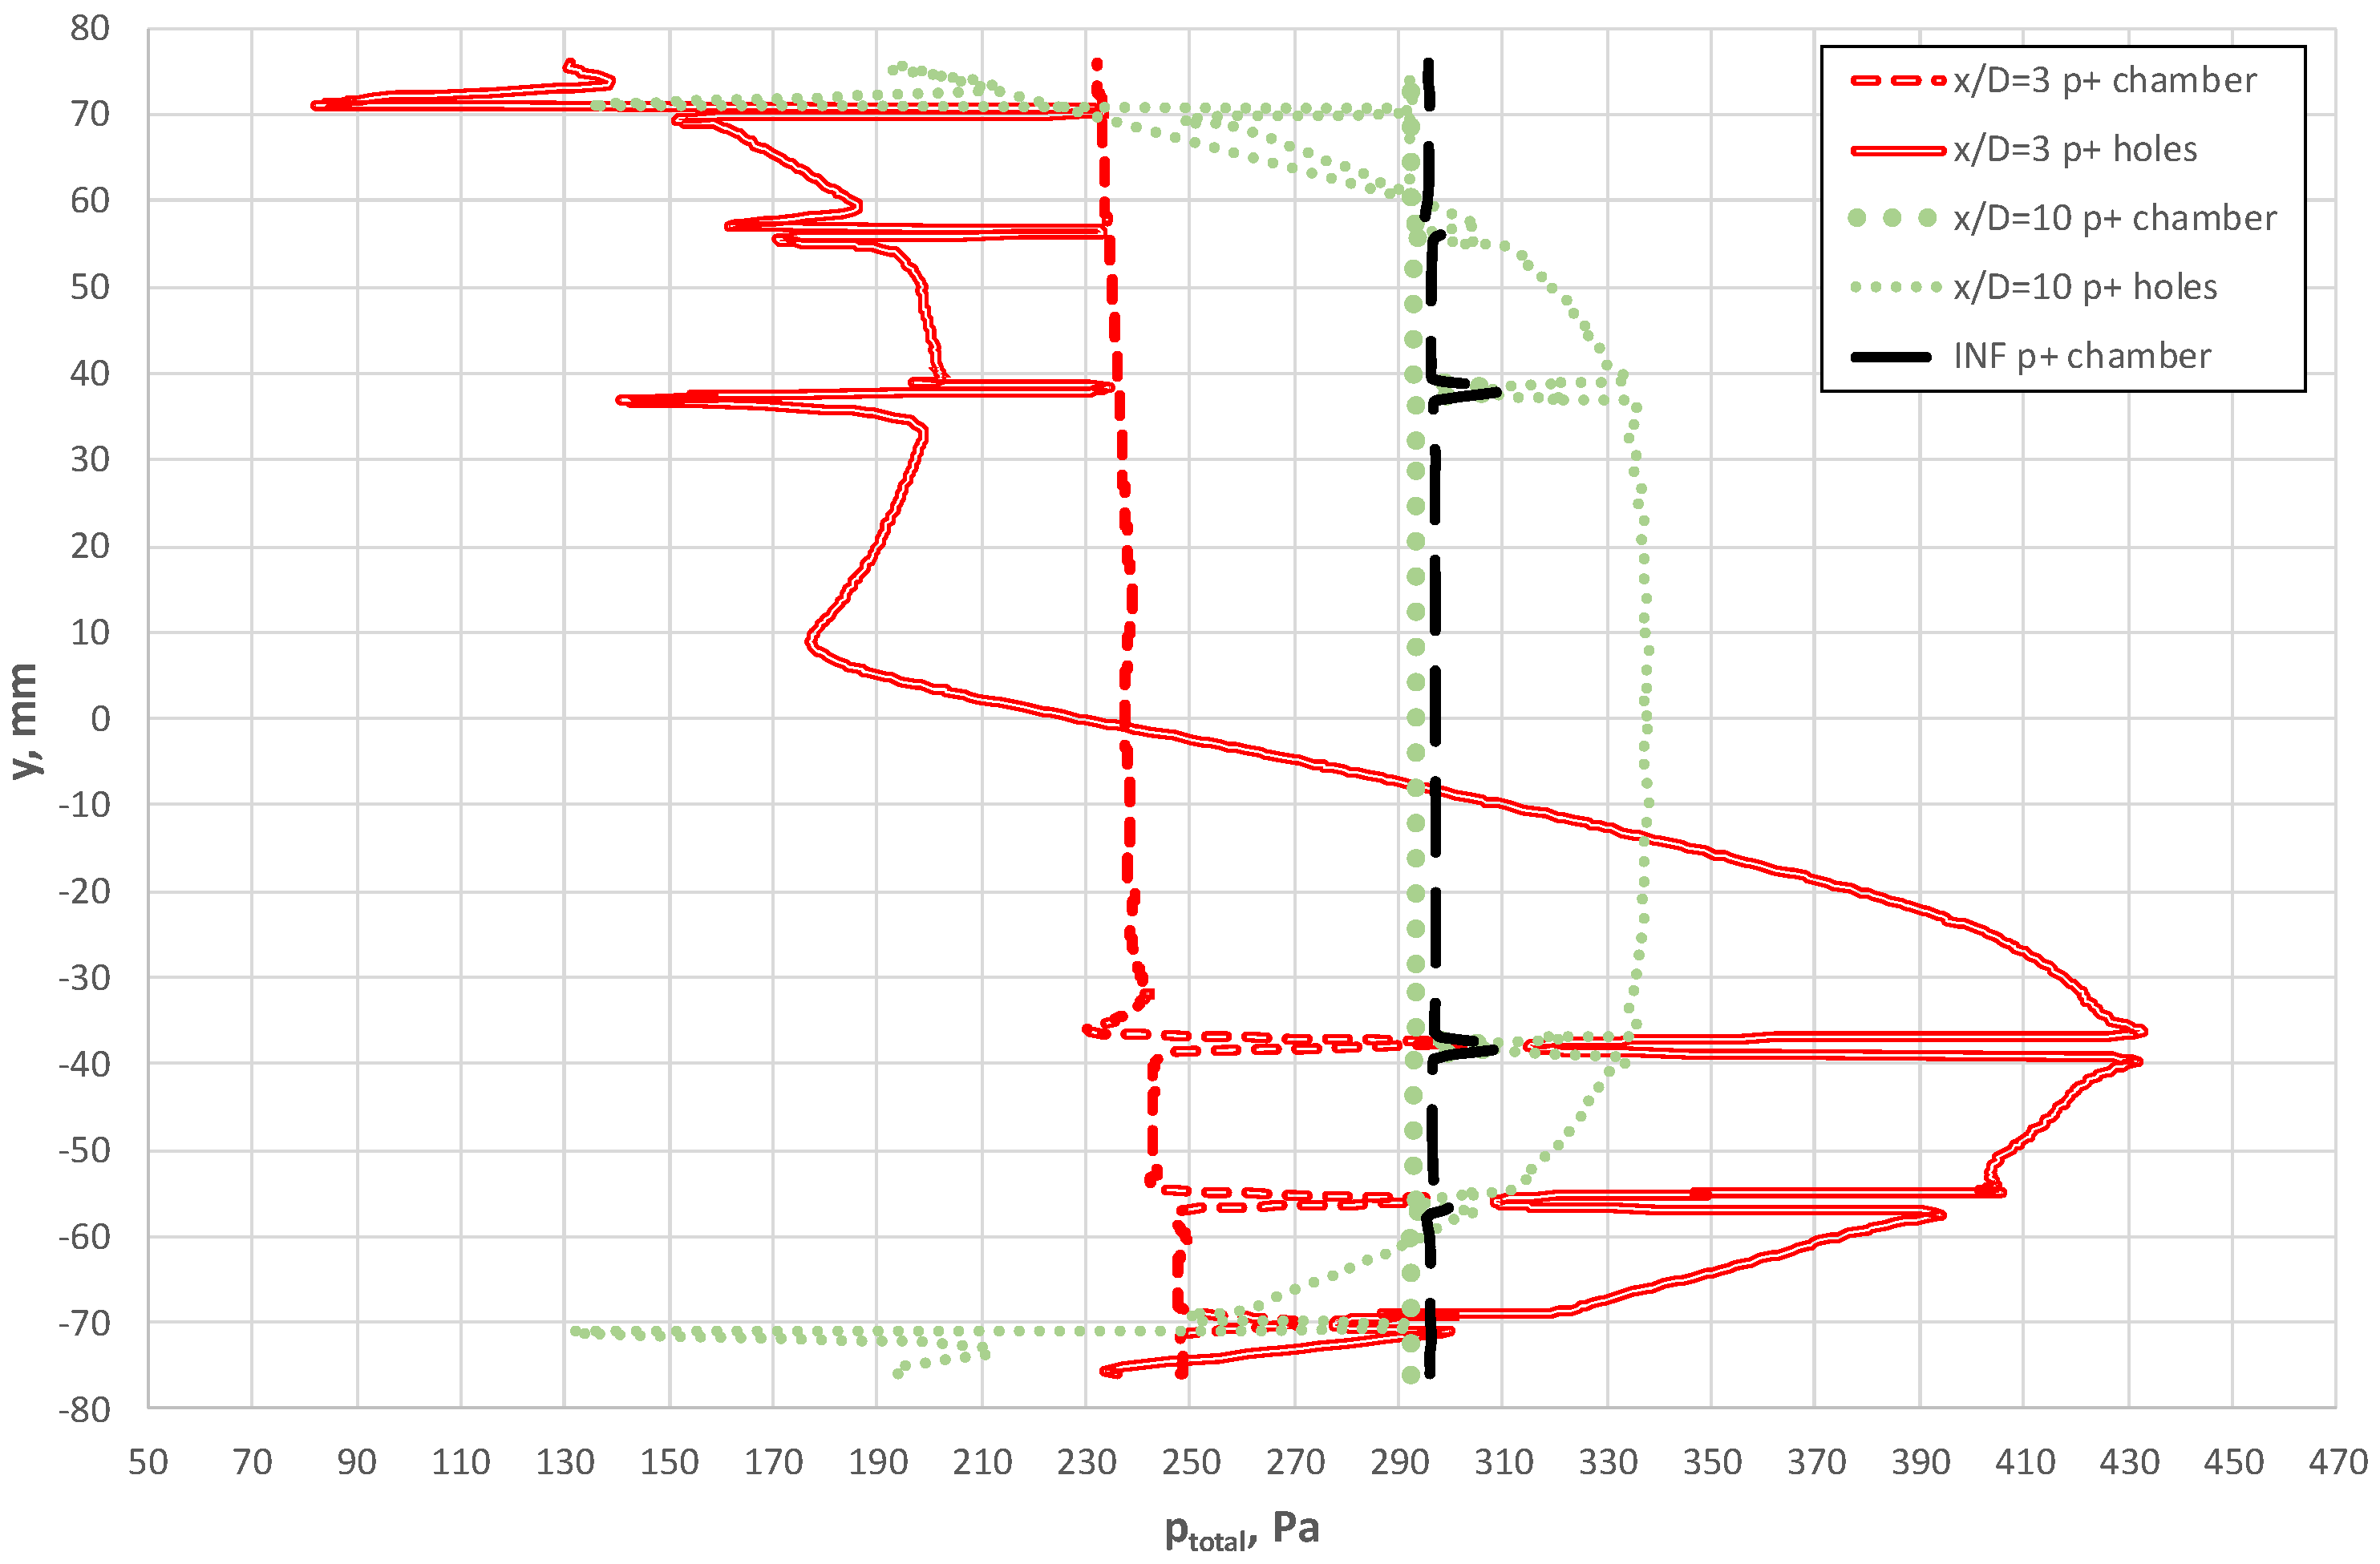
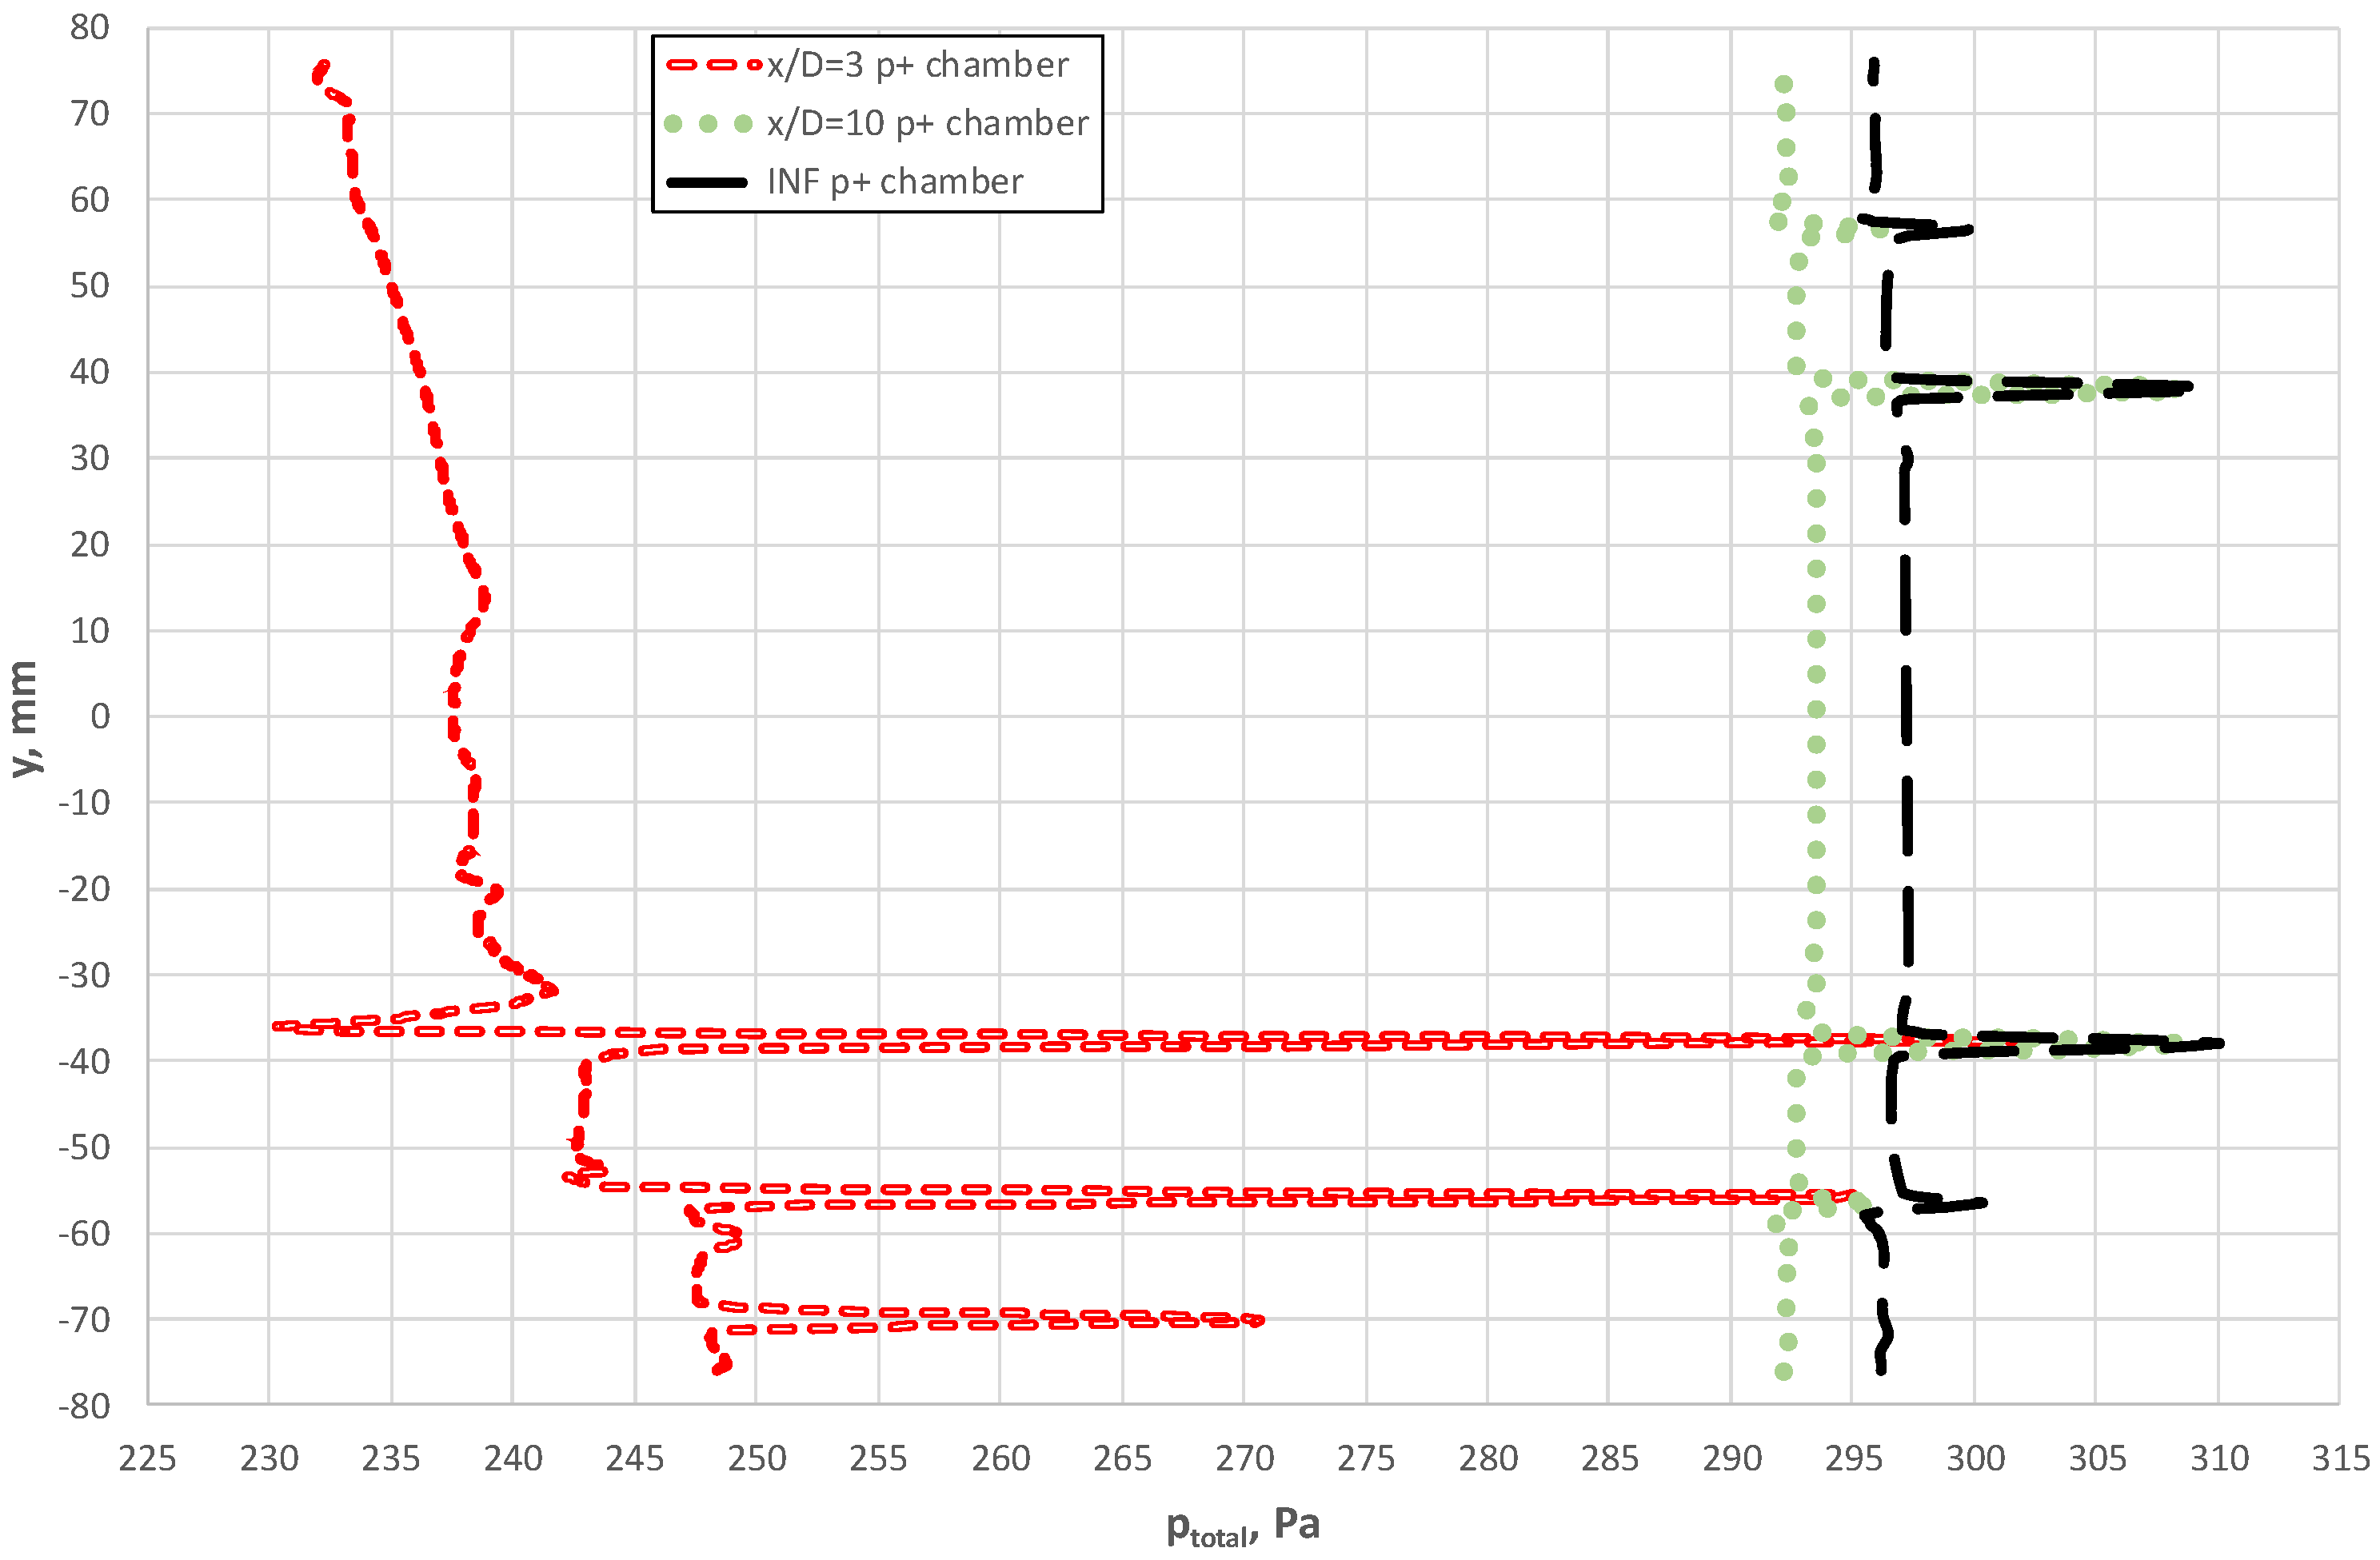
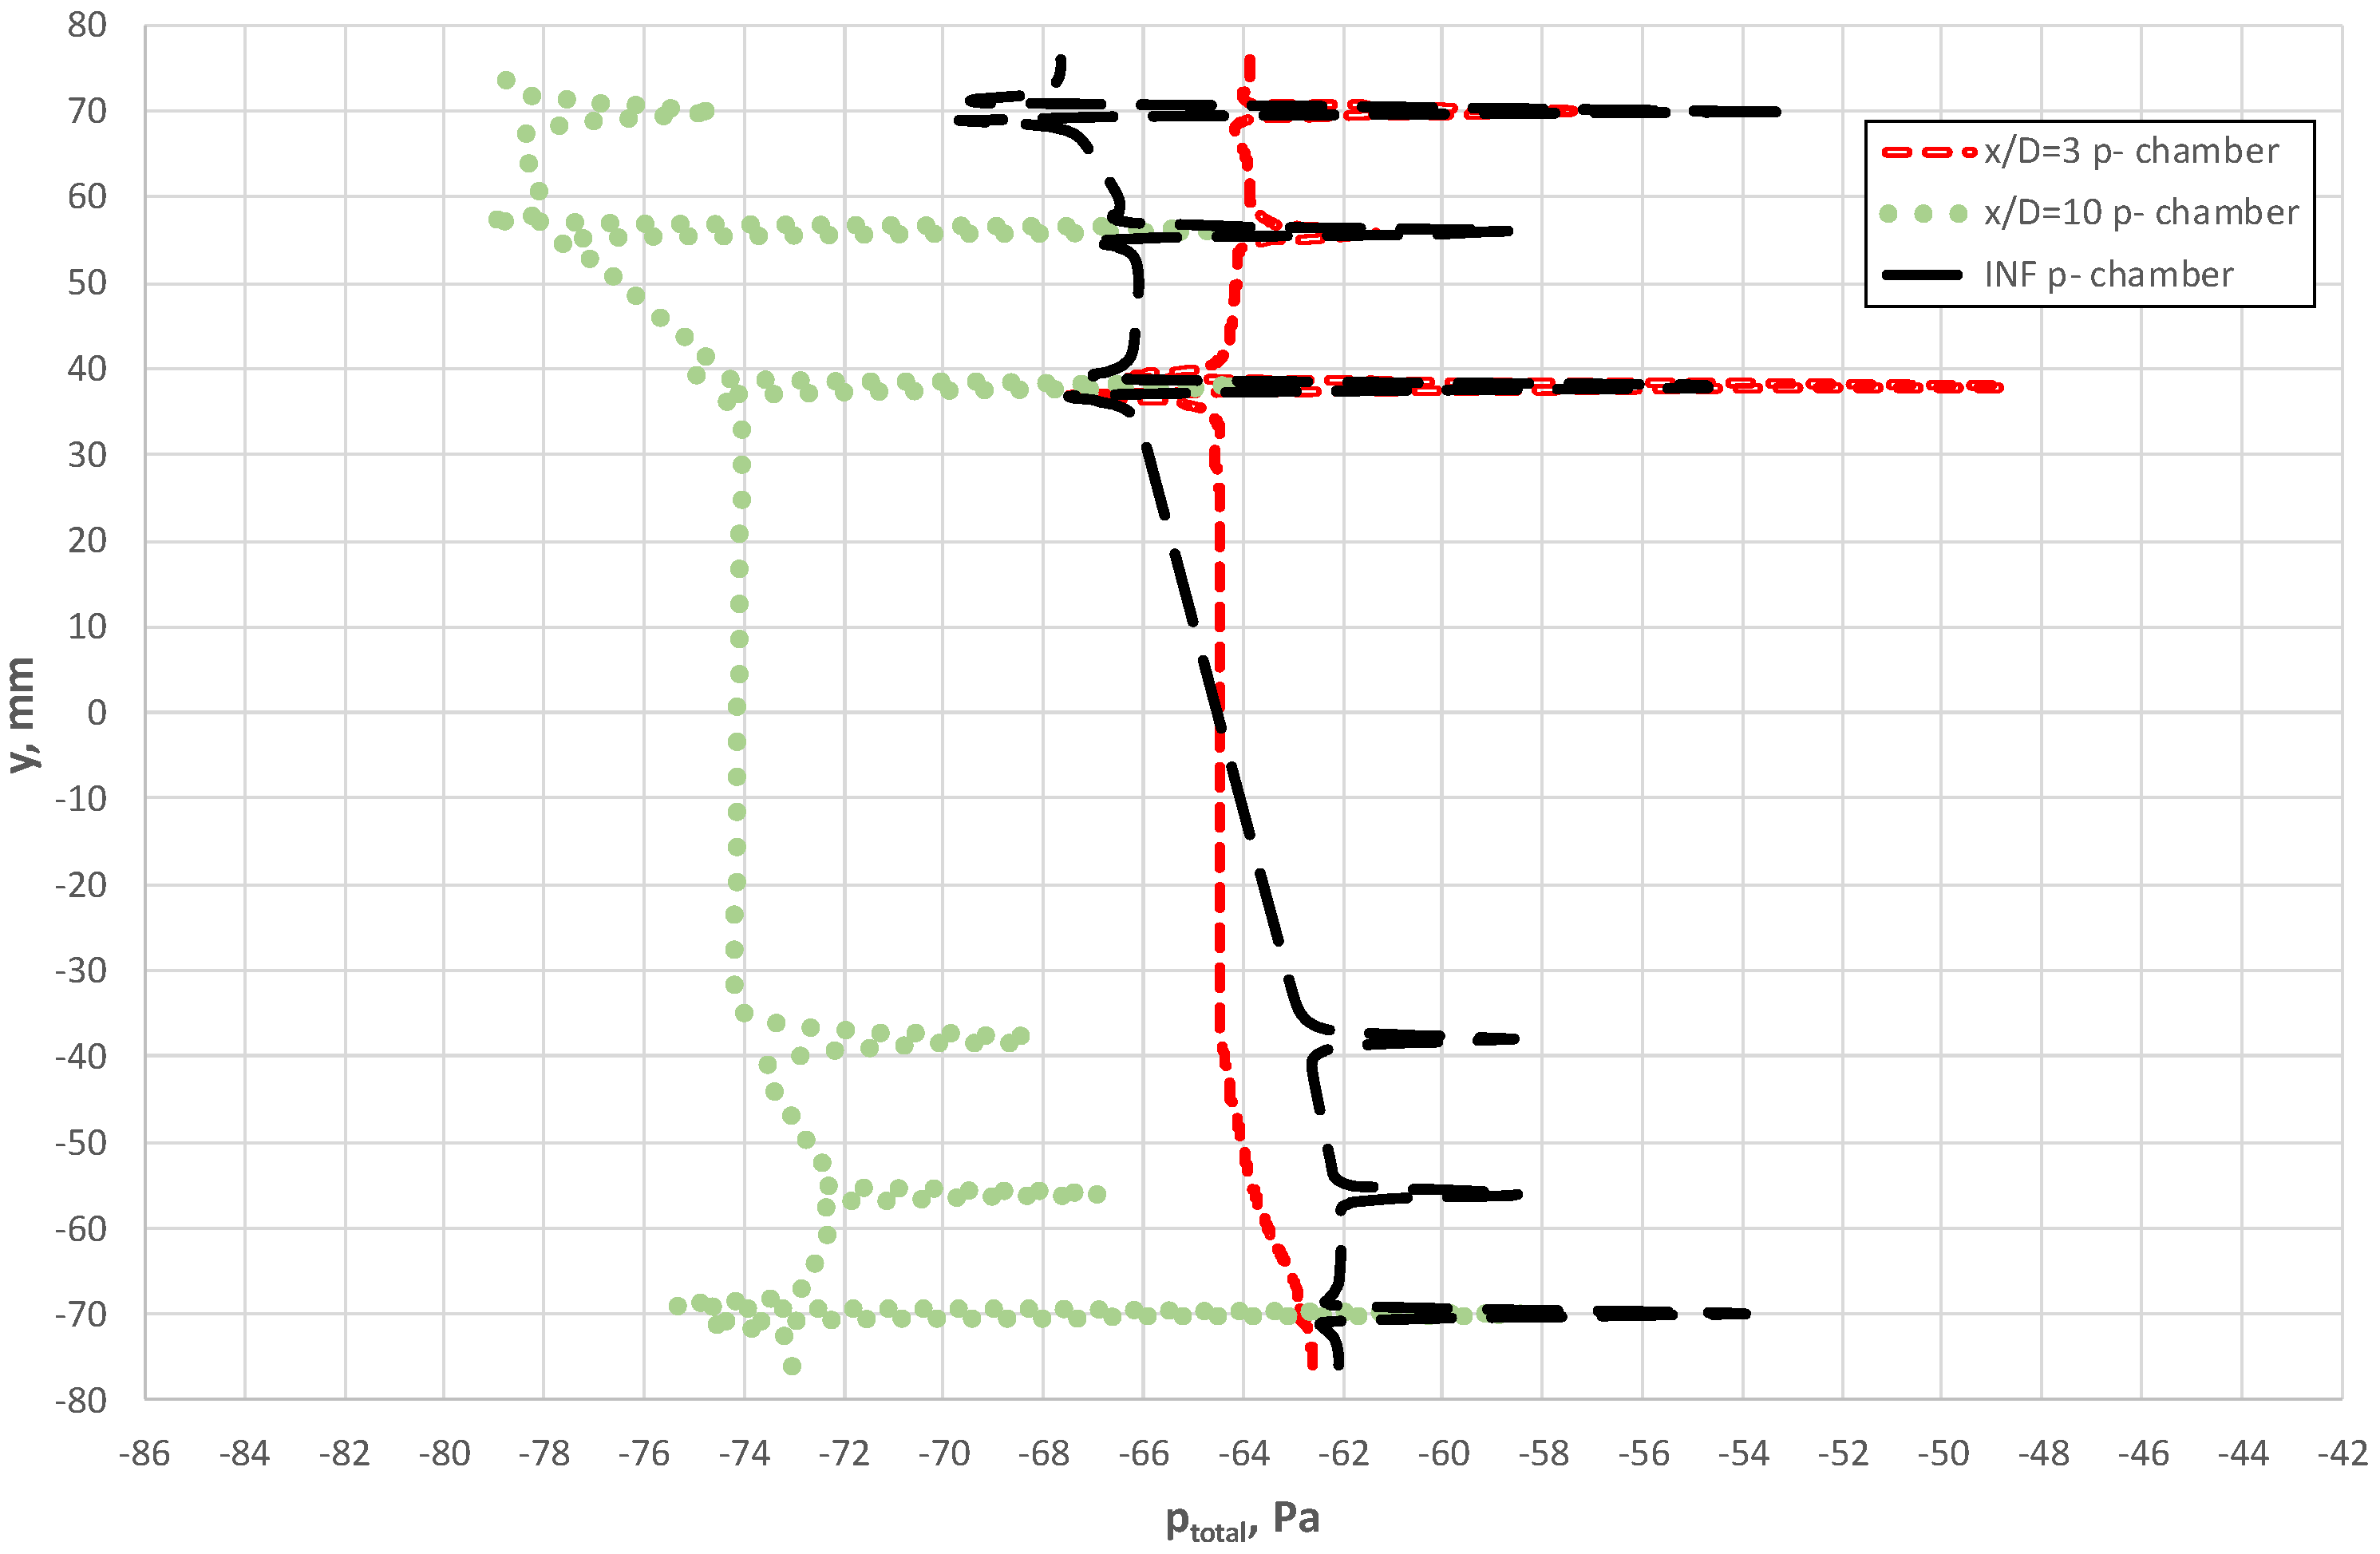
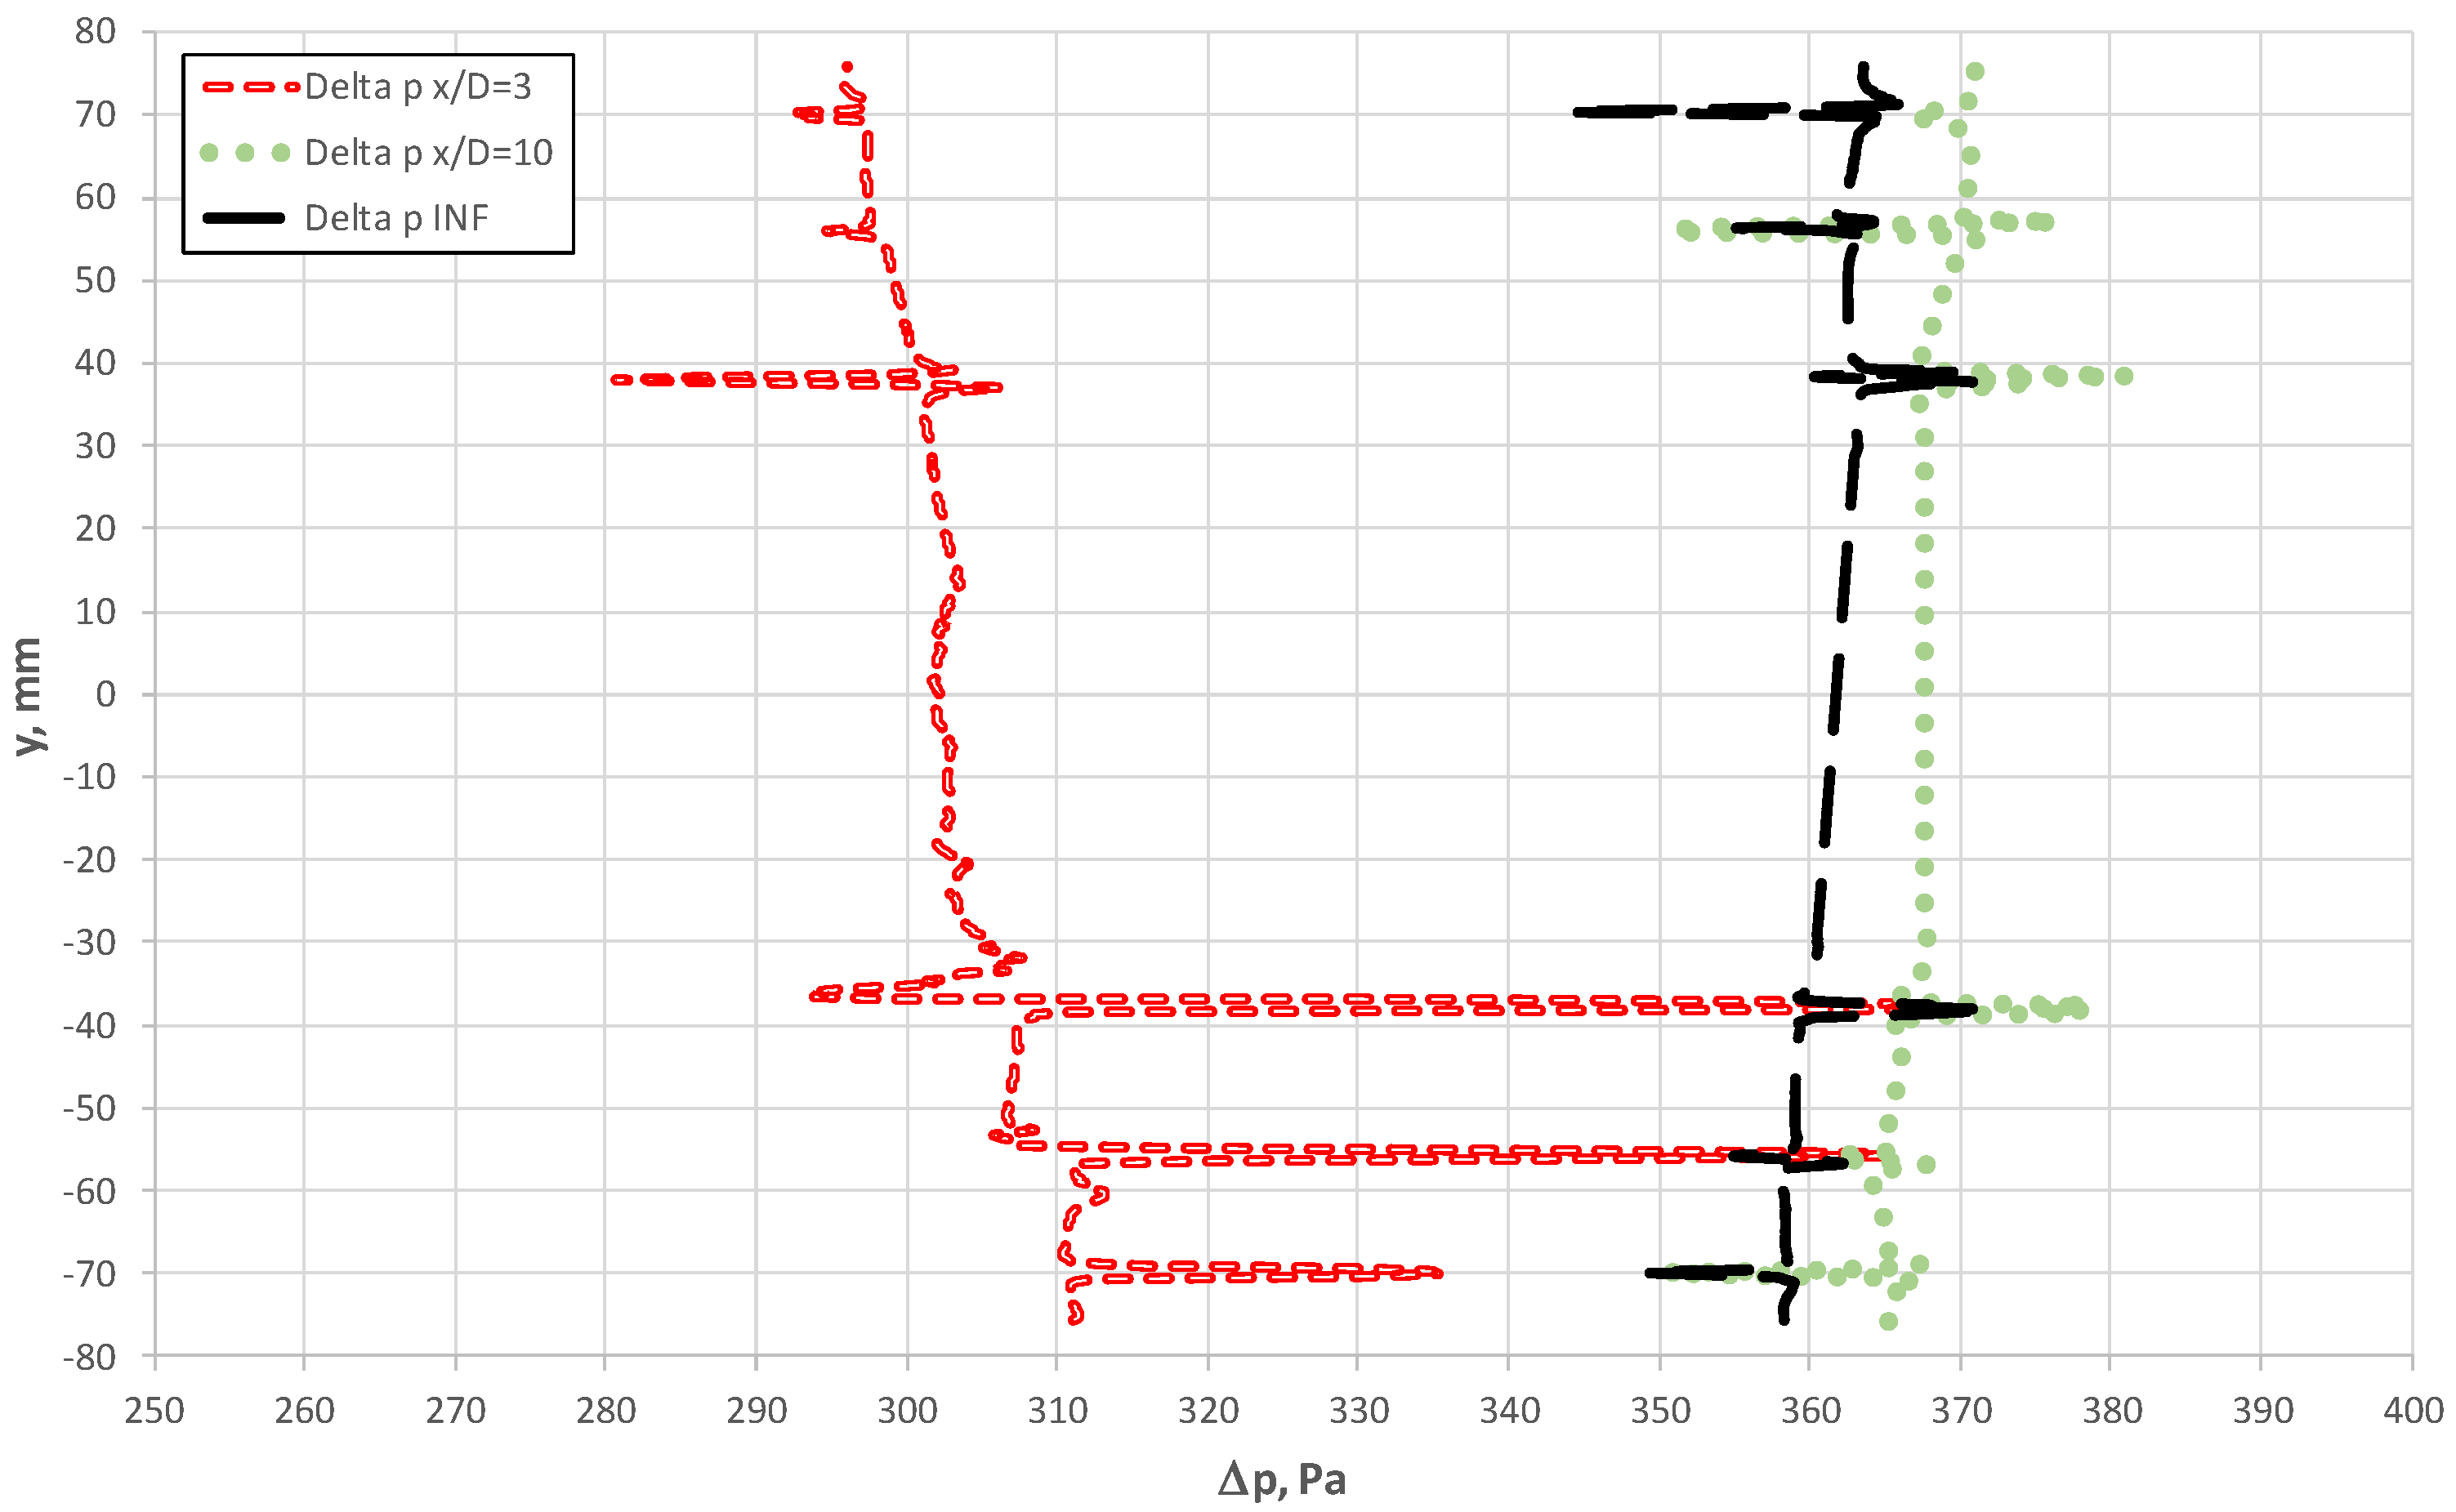
- The numerical simulations conducted on the streamlined probe located downstream of a single elbow provide grounds for the analysis of the distribution of pressures and velocities inside and around flow-averaging chambers. Despite the considerable variations in total pressure along the surface of the probe, the applied diameters of the bore holes and averaging chambers offer a successful averaging of pressures in the chambers. In the investigated case of calculations, the distribution of pressures in the p+ chamber assume a state of balance. In general, we can conclude that in this case, the value of the averaged pressure in the p+ chamber had a decisive effect on the additional measurement error. Consequently, we see that the distance between the pipe elbow and the place of installation of the probe affected the distribution of pressures and the value Δp registered between the pressure-averaging chambers.
- (e)
- Mathematical modeling can provide valuable insights into details of the installation and further adaptations of the probe design to improve the quality of measurements. A way to limit the additional measurement error will be the location of the holes in the probe that will allow the best possible averaging of the deformed velocity profile. This requires numerical calculations, analysis of the velocity profile at the location of the probe and selection of points better representing the average velocity in cross-section.
Author Contributions
Funding
Acknowledgments
Conflicts of Interest
Nomenclature
| Cd (-) | Discharge coefficient |
| qv (m3/s) | Volumetric flow rate |
| K (-) | Flow coefficient (empirical) |
| K∞ (-) | Flow coefficient referred to undisturbed flow |
| A (m2) | Cross-sectional area of pipeline |
| Δp (Pa) | Differential pressure |
| ρ (kg/m3) | Fluid density |
| DN (mm) | Nominal diameter of pipeline |
| D (mm) | Diameter of pipeline |
| Ui (m/s) | Components of velocity vector along directions x, y, z, respectively |
| p (Pa) | Absolute pressure |
| µef (Pa⋅s) | Effective viscosity |
| µt (Pa⋅s) | Turbulent viscosity (eddy viscosity) |
| µ (Pa⋅s) | Molecular viscosity |
| k (m2/s2) | Turbulent kinetic energy |
| ω (1/s) | Specific dissipation rate |
| w (m/s) | Mean velocity of fluid |
| Gk (kg/m∙s3) | Generation of turbulent kinetic energy k |
| Gω (kg/m3∙s2) | Generation of specific dissipation rate ω |
| Γk (kg/m∙s) | Effective diffusivity of k |
| Γω (kg/m∙s) | Effective diffusivity of ω |
| Yk (kg/m∙s3) | Dissipation of k due to turbulence |
| Yω (kg/m3∙s2) | Dissipation of ω due to turbulence |
| Sk (kg/m∙s3) | Source term referring to k |
| Sω (kg/m3∙s2) | Source term referring to ω |
| (-) | Turbulent Prandtl number for k |
| (-) | Turbulent Prandtl number for ω |
| Cμ (-) | Turbulence model, constant equal to 0.09 |
| Rc (mm) | Elbow radius of curvature with reference to pipeline diameter D |
| Re (-) | Reynolds number |
| qvref (m3/s) | Reference volumetric flow rate |
| x (m) | Longitudinal coordinate in flow direction |
| p+(Pa) | Positive pressure |
| p−(Pa) | Negative pressure |
| dk (mm) | Average chamber probe diameter |
| d0(mm) | Probe impulse hole diameter |
| δ (%) | Systematic error in fluid flow measurement |
| y+(-) | Boundary layer thickness (solution-dependent parameter) |
References
- Lupeau, A.; Platet, B.; Gajan, P.; Strzelecki, A.; Escande, J.; Couput, J.P. Influence of the presence of an upstream annular liquid film on the wet gas flow measured by a Venturi in a downward vertical configuration. Flow Meas. Instrum. 2007, 18, 1–11. [Google Scholar] [CrossRef]
- Li, Y.; Jun, W.; Geng, Y. Study on wet gas online flow rate measurement based on dual slotted orifice plate. Flow Meas. Instrum. 2009, 20, 168–173. [Google Scholar] [CrossRef]
- Adefila, K.; Yan, Y.; Sun, L.; Wang, T. Flow measurement of wet CO2 using an averaging pitot tube and Coriolis mass flowmeters. Int. J. Greenh. Gas. Con. 2017, 63, 289–295. [Google Scholar] [CrossRef]
- Berrebi, J.; Martinsson, P.-E.; Willatzen, M.; Delsing, J. Ultrasonic flow metering errors due to pulsating flow. Flow Meas. Instrum. 2004, 15, 179–185. [Google Scholar] [CrossRef][Green Version]
- ISO 5167-5. Measurement of Fluid Flow by Means of Pressure Differential Devices Inserted in Circular Cross-Section Conduits Running Full—Part 5: Cone Meters; The National Standards Authority of Ireland (NSAI): Dublin, Ireland, 2016.
- Weissenbrunner, A.; Fiebach, A.; Schmelter, S.; Bär, M.; Thamsen, P.U.; Lederer, T. Simulation-based determination of systematic errors of flow meters due to uncertain inflow conditions. Flow Meas. Instrum. 2016, 52, 25–39. [Google Scholar] [CrossRef]
- Singh, R.K.; Singh, S.N.; Seshadri, V. Study on the effect of vertex angle and upstream swirl on the performance characteristics of cone flowmeter using CFD. Flow Meas. Instrum. 2009, 20, 69–74. [Google Scholar] [CrossRef]
- Singh, R.K.; Singhb, S.N.; Seshadri, V. CFD prediction of the effects of the upstream elbow fittings on the performance of cone flowmeters. Flow Meas. Instrum. 2010, 21, 88–97. [Google Scholar] [CrossRef]
- He, D.; Bai, B. Gas-liquid two phase flow with high GVF through a horizontal V-Cone throttle device. Int. J. Multiph. Flow 2017, 91, 51–62. [Google Scholar]
- He, D.; Chen, S.; Bai, B. Experiment and Numerical Simulation on Gas-Liquid Annular Flow through a Cone Sensor. Sensors 2018, 18, 2923. [Google Scholar] [CrossRef]
- Chmielniak, T.; Kotowicz, J.; Węcel, D. Experimental and numerical investigations of the averaging Pitot tube and analysis of installation effects on the flow coefficient. Flow Meas. Instrum. 2008, 19, 301–306. [Google Scholar]
- Kabaciński, M.; Pochwała, S.; Pospolita, J. Influence of Typical Flow Disturbing Elements on the Flow Rate in Selected Averaging Pitot Tubes. TASK Q. 2012, 16, 219–228. [Google Scholar]
- Spitzer, D.W. Flow Measurement: Practical guides for measurement and control. Isa Res. Triangle Park. 1991, 1, 103–106. [Google Scholar]
- Turkowski, M.; Szufleński, P. New criteria for the experimental validation of CFD simulations. Flow Meas. Instrum. 2013, 34, 1–10. [Google Scholar] [CrossRef]
- Vinod, V.; Chandran, T.; Padmakumar, G.; Rajan, K.K. Calibration of an averaging pitot tube by numerical simulations. Flow Meas. Instrum. 2012, 24, 26–28. [Google Scholar] [CrossRef]
- ALLPRONIX Data Sheet Flow Meters. 2018. Available online: https://allpronix.com/product-category/flow-meters/ (accessed on 15 May 2020).
- Fayin Instruments Data sheet Flow Meters. 2018. Available online: http://www.fayin.com.tw. (accessed on 15 May 2020).
- Meriam’s Accutube Flow Sensors Data Sheet. 2018. Available online: http://www.testequipmentdepot.com/meriam/pdf/accutube_series.pdf. (accessed on 15 May 2020).
- Preso Flow Metering Equipment, Data Sheet. 2018. Available online: http://www.mesure.com/docs/Ellipse.pdf (accessed on 15 February 2020).
- Kabaciński, M.; Pospolita, J. Experimental research into a new design of flow—Averaging tube. Flow Meas. Instrum. 2011, 22, 421–427. [Google Scholar] [CrossRef]
- Kotzé, R.; Wiklund, J.; Haldenwang, R.; Fester, V. Measurement and analysis of flow behavior in complex geometries using the Ultrasonic Velocity Profiling (UVP) technique. Flow Meas. Instrum. 2011, 22, 110–119. [Google Scholar] [CrossRef]
- Kabaciński, M.; Pospolita, J. Numerical and experimental research on new cross-sections of averaging Pitot tubes. Flow Meas. Instrum. 2008, 19, 17–27. [Google Scholar] [CrossRef]
- Dobrowolski, B.; Kabaciński, M.; Pospolita, J. A mathematical model of the self—Averaging Pitot tube A mathematical model of a flow sensor. Flow Meas. Instrum. 2005, 16, 251–265. [Google Scholar] [CrossRef]
- Kabaciński, M. Influence of disturbed flow after an elbow on metrological properties of a Flow Averaging Tube. Meas. Autom. Monit. 2016, 62, 7–16. [Google Scholar]
- Kabaciński, M.; Pochwała, S. The impact of velocity profile deformation on flow coefficient value for flowmeter with tube averaging dynamic pressure. Meas. Autom. Control 2011, 57, 157–160. [Google Scholar]
- Kring, J.; Travis, J. LabVIEW for Everyone: Graphical Programming Made Easy and Fun; Prentice Hall: Wilmington, DE, USA, 2006. [Google Scholar]
- Chowdhury, R.R.; Alam, M.M. Turbulent flow analysis on bend and downstream of the bend for different curvature ratio. AIP Conf. Proc. 2016, 1754. [Google Scholar] [CrossRef]
- ANSYS/FLUENT v.19.1 Documentation. 2018. Available online: https://www.pharea-software.com/content/uploads/2018/05/Release_Notes_191.pdf (accessed on 16 May 2020).
- Kim, J.; Yadav, M.; Kim, S. Characteristics of secondary flow induced by 90-degree elbow in turbulent pipe flow. Eng. Appl. Comp. Fluid 2014, 8, 229–239. [Google Scholar] [CrossRef]
- Kabaciński, M.; Pospolita, J. Applicability of the chosen turbulence models in numerical investigations of flows around a body with stream separation. Inz. Chem. Procesowa 2006, 27, 601–621. [Google Scholar]




| Mesh | Super Coarse | Very Coarse | Coarse | Little Coarse | Fine | Very Fine | Super Fine |
|---|---|---|---|---|---|---|---|
| Overall dimension increase | 130% | 125% | 120% | 115% | 110% | 105% | 100% |
| Error ref. to Δp of superfine mesh | −4.1% | −42.4% | 0.6% | 0.3% | 0.3% | −40.1% | 0% |
| Number of elements | 4 837 549 | 5 257 604 | 5 771 527 | 7 982 892 | 8 204 543 | 8 610 560 | 9 676 486 |
| Aspect Ratio | 1–40.155 | 1–43.9 | 1–44.9 | 1–46.1 | 1–47.1 | 1–47.7 | 1–45.4 |
| Skewness range | 0–0.883 | 0–0.893 | 0–0.846 | 0–0.896 | 0–0.869 | 0–0.897 | 0–0.833 |
| Orthogonal Quality range | 0.116–1 | 0.106–1 | 0.154–1 | 0.104–1 | 0.131–1 | 0.103–1 | 0.133–1 |
| Max element length, mm | 2.17 | 2.12 | 2.08 | 1.80 | 1.89 | 1.83 | 1.68 |
| Flowmeter Cross−Section | Radius of Single Elbow, Rc | Orientation of Probe in Relation to Curvature Plane | Maximum Measurement Error at the Distance | |
|---|---|---|---|---|
| <10D,% | ≥10D,% | |||
 | 1D | V | −7.49 | 3.26 |
| H | 2.90 | 2.66 | ||
| 3D | V | 2.62 | 1.48 | |
| H | −1.28 | −1.02 | ||
 | 1D | V | −8.26 | 1.51 |
| H | −2.76 | −1.32 | ||
| 3D | V | −4.15 | 0.42 | |
| H | −1.99 | −0.49 | ||
 | 1D | V | −3.24 | −2.88 |
| H | 2.02 | 1.38 | ||
| 3D | V | −3.07 | −1.76 | |
| H | −1.20 | 0.43 | ||
© 2020 by the authors. Licensee MDPI, Basel, Switzerland. This article is an open access article distributed under the terms and conditions of the Creative Commons Attribution (CC BY) license (http://creativecommons.org/licenses/by/4.0/).
Share and Cite
Kabaciński, M.; Pospolita, J. Effect of Distortion in Velocity Profile on Flow Measurements Using Averaging Flow Sensors. Sensors 2020, 20, 2839. https://doi.org/10.3390/s20102839
Kabaciński M, Pospolita J. Effect of Distortion in Velocity Profile on Flow Measurements Using Averaging Flow Sensors. Sensors. 2020; 20(10):2839. https://doi.org/10.3390/s20102839
Chicago/Turabian StyleKabaciński, Mirosław, and Janusz Pospolita. 2020. "Effect of Distortion in Velocity Profile on Flow Measurements Using Averaging Flow Sensors" Sensors 20, no. 10: 2839. https://doi.org/10.3390/s20102839
APA StyleKabaciński, M., & Pospolita, J. (2020). Effect of Distortion in Velocity Profile on Flow Measurements Using Averaging Flow Sensors. Sensors, 20(10), 2839. https://doi.org/10.3390/s20102839


