Demodulation Method of F-P Sensor Based on Wavelet Transform and Polarization Low Coherence Interferometry


Abstract
:1. Introduction
2. Demodulation Principle and Scheme
- The calibration of the demodulation model
- 1.1
- set a series of sample points at equal intervals within the measurement range, and monitor the variation curves of envelope center.
- 1.2
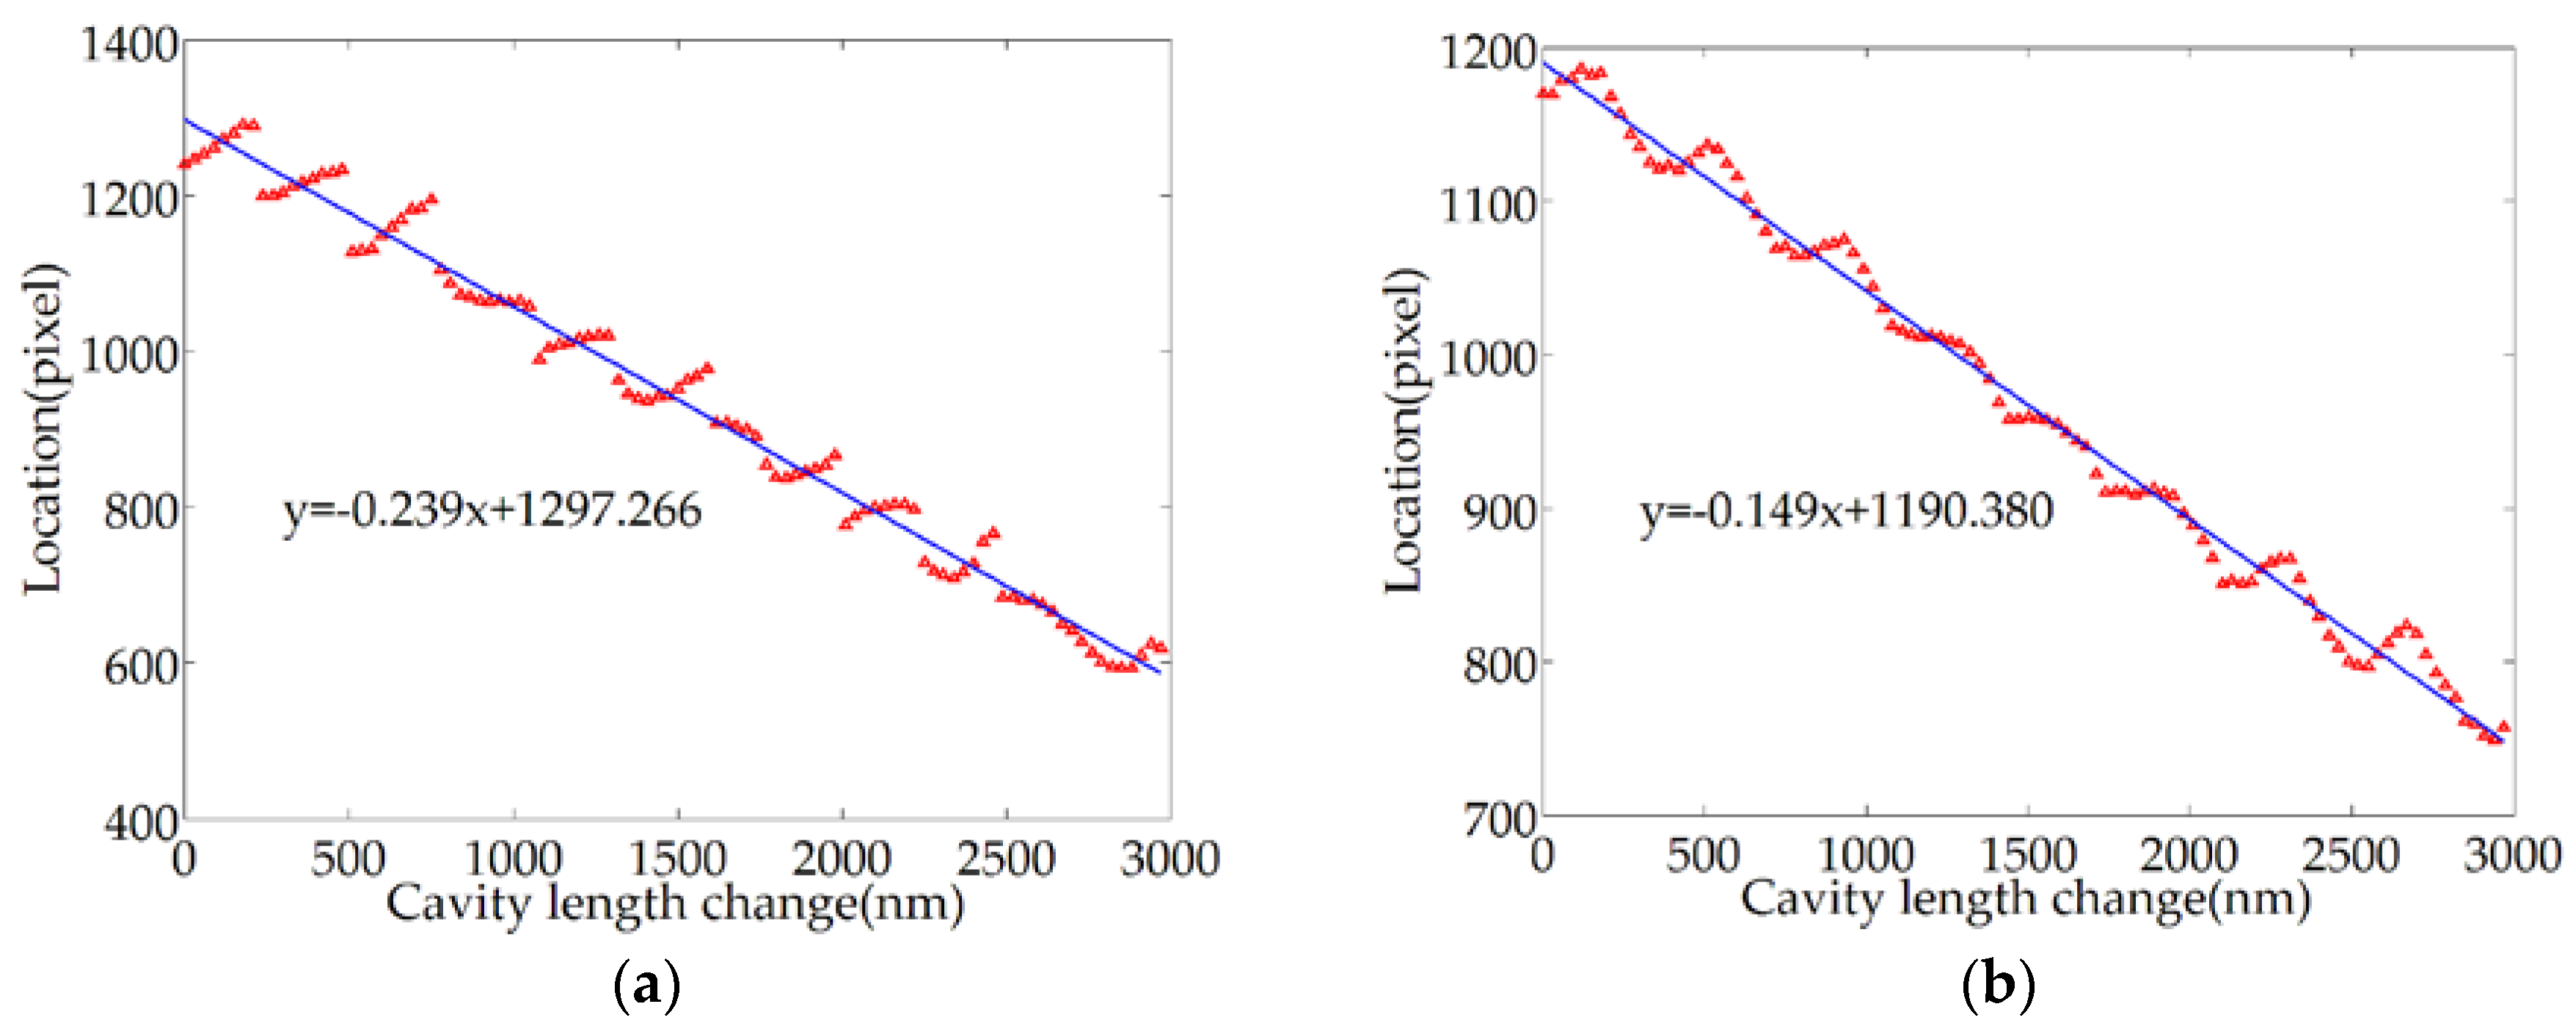
- track the target extremum locations in the vicinity of envelope center, and linear -fit the variation trends of the peak and valley closest to the envelope center.
- 1.3
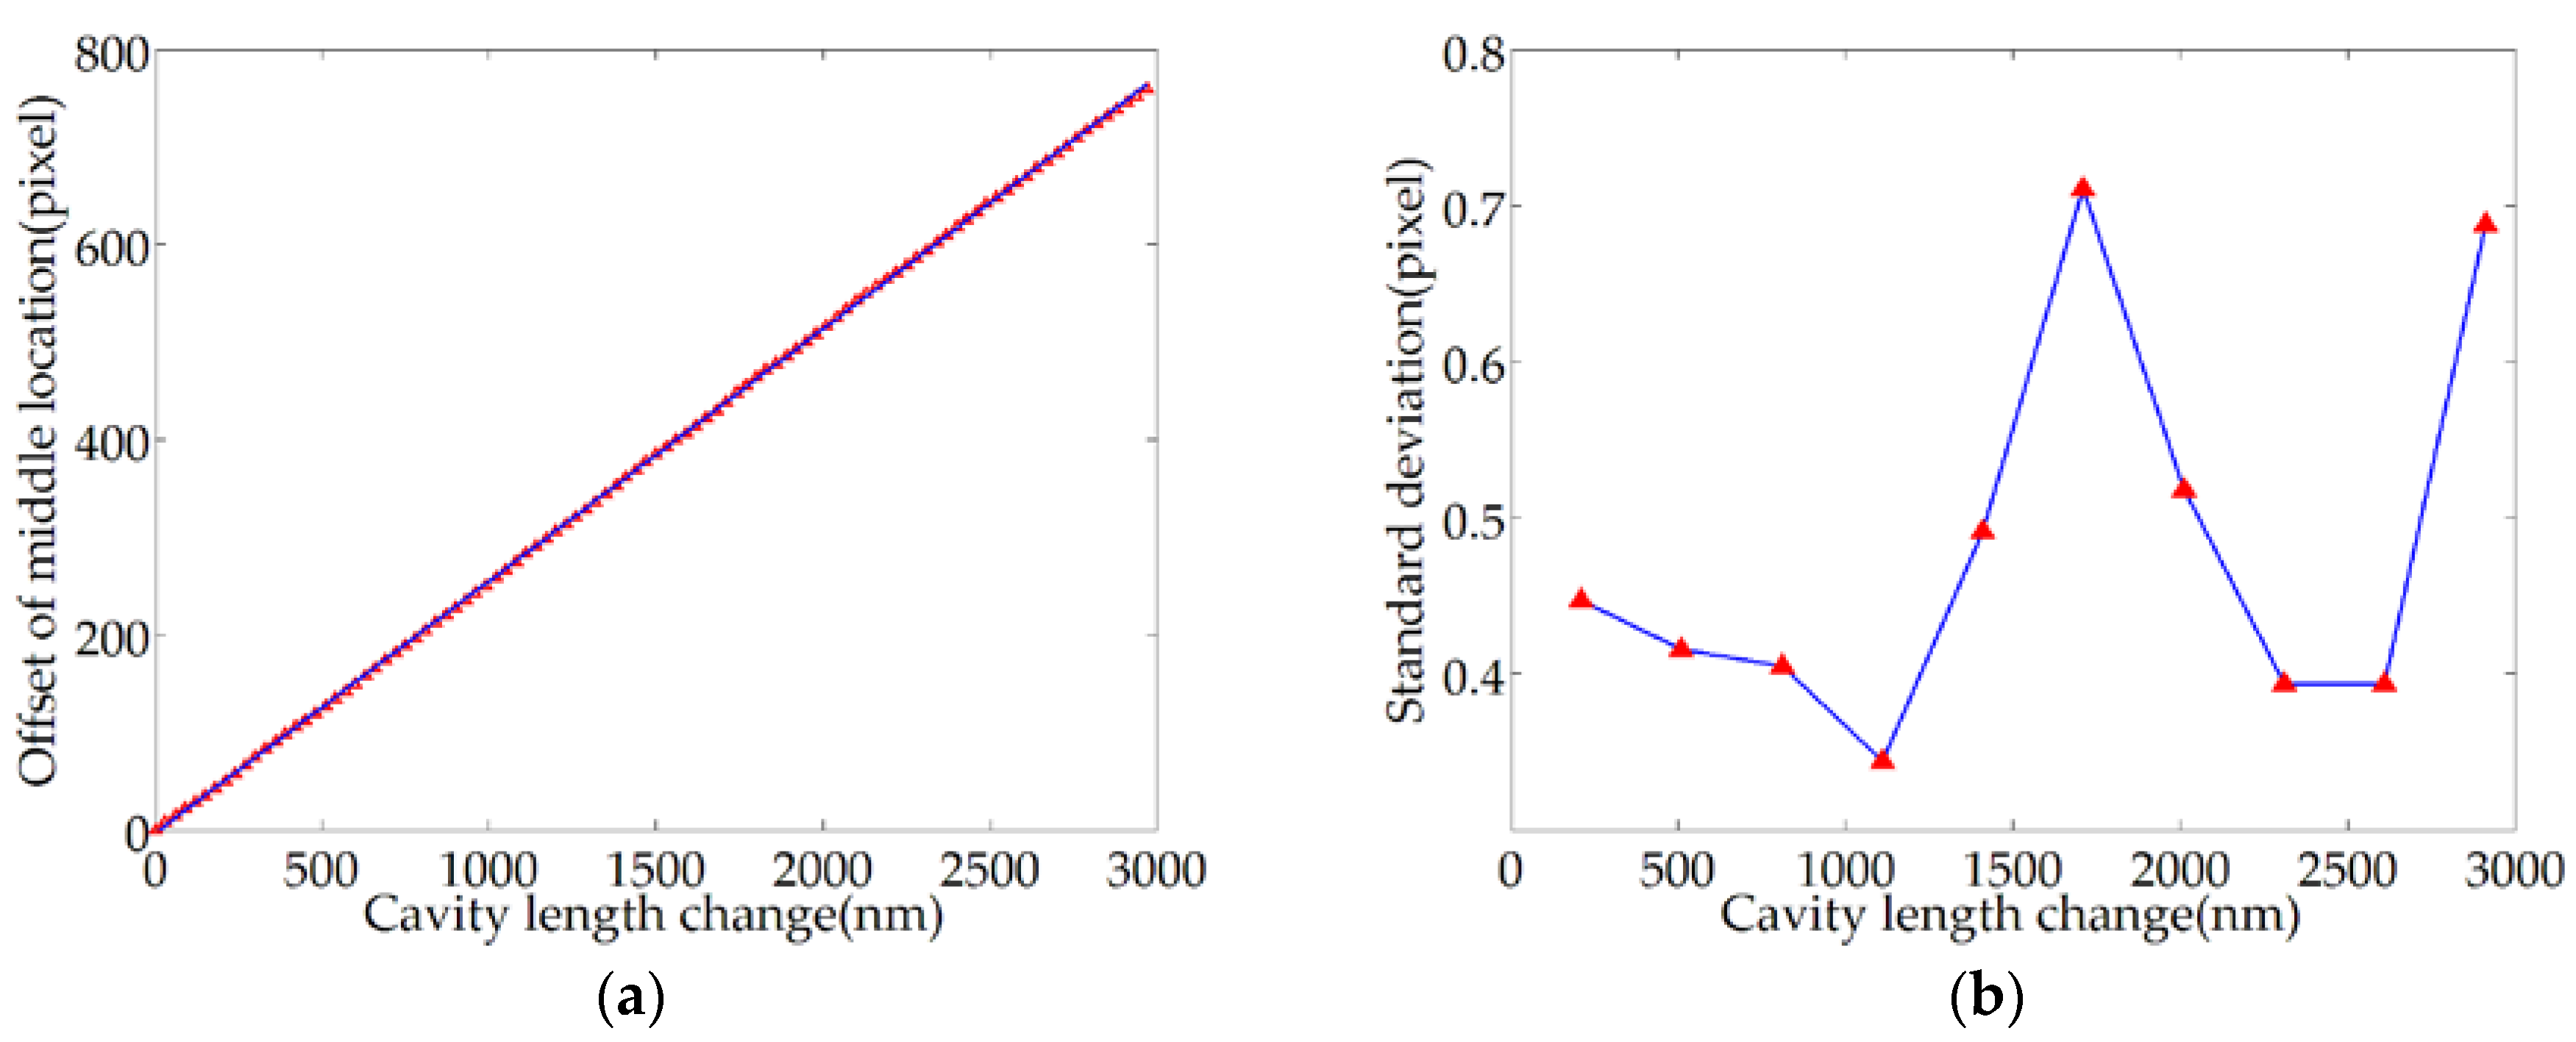
- track the trend of peak/valley locations and calculate the mean value to get the curve of middle location.
- The demodulation of a given F-P sensor
- 2.1
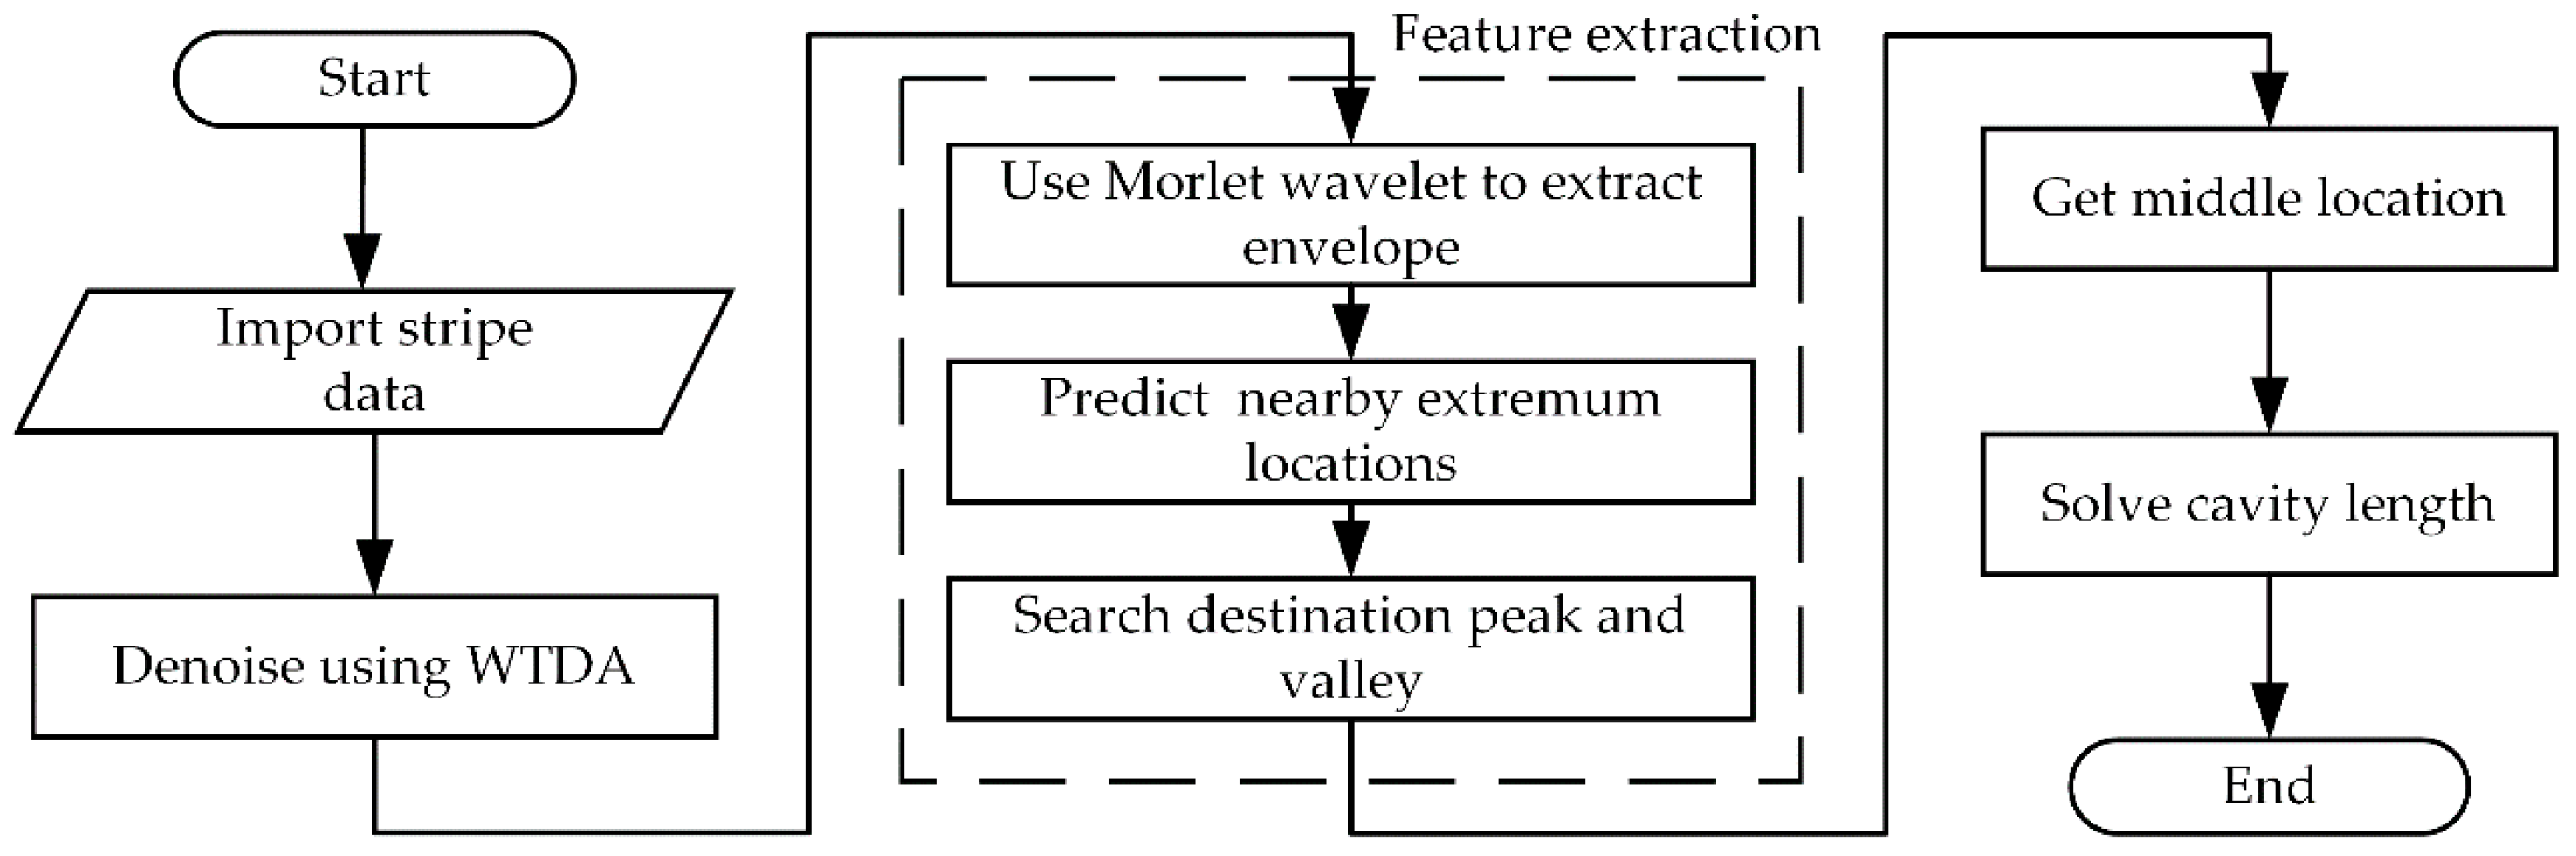
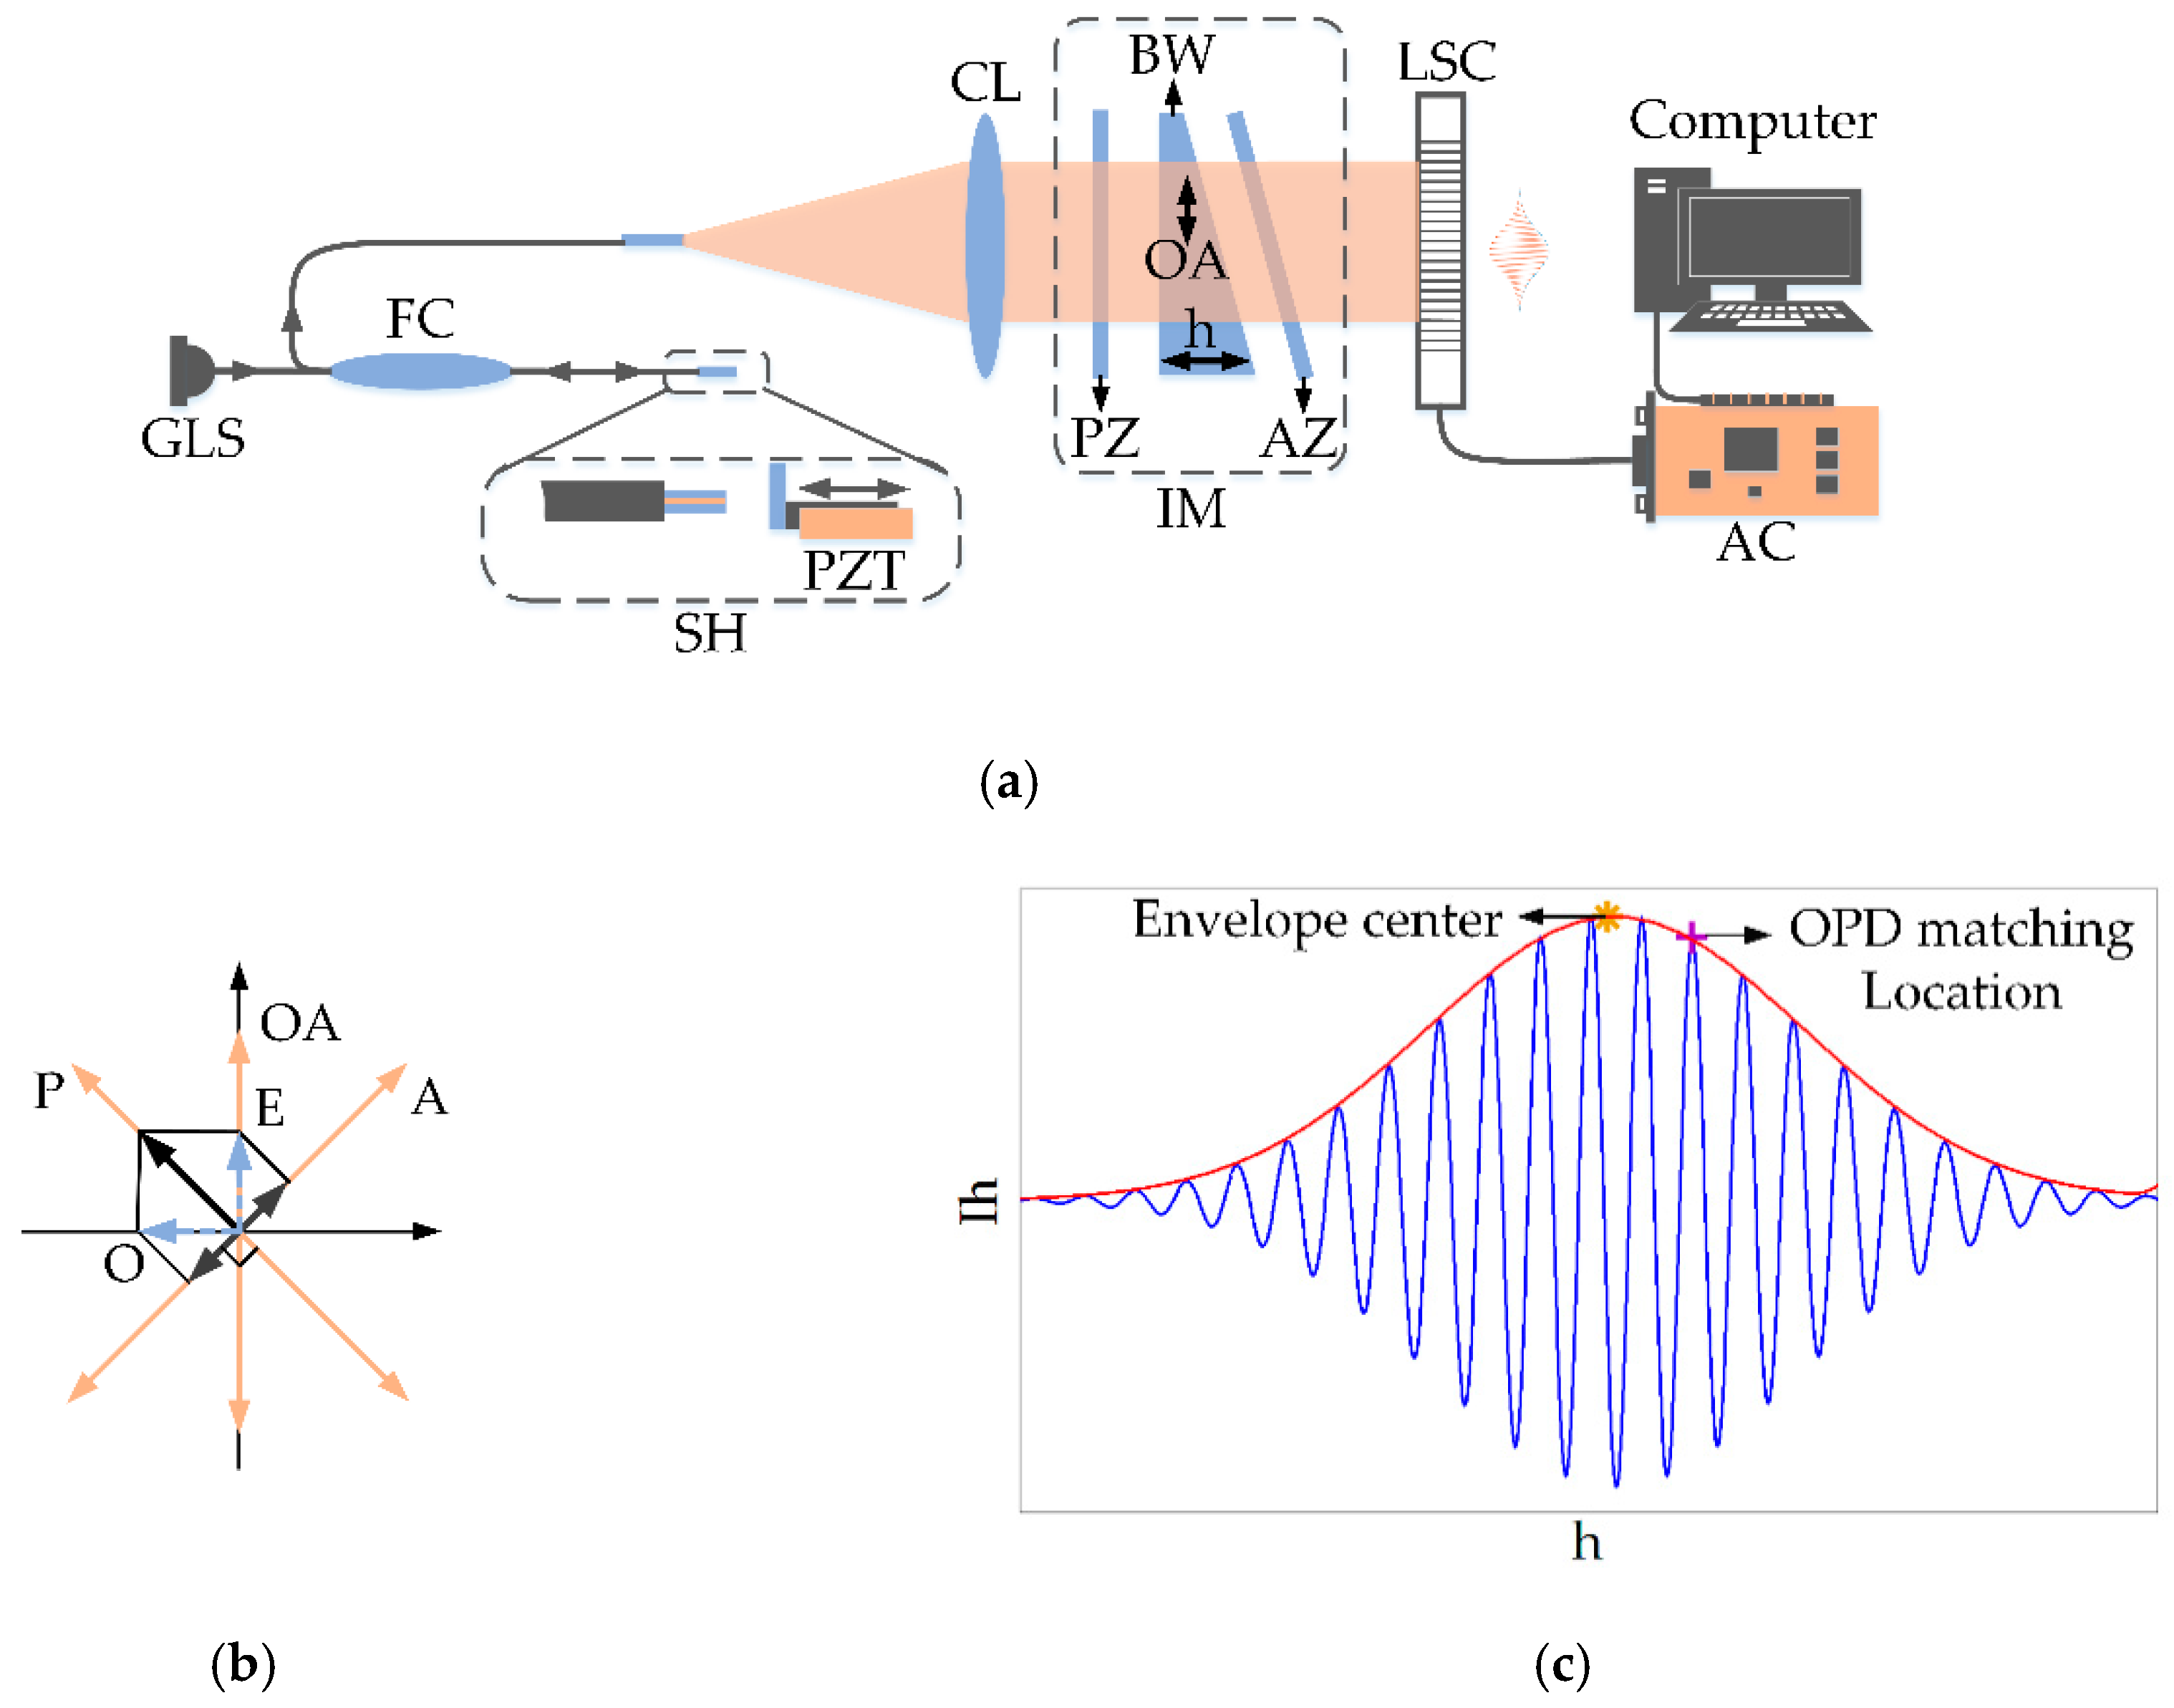
- extract the envelope of the PLCI pattern, and predict the positions of the closest peak and valley according to the calibration trend.
- 2.2
- center on the predicted peak/valley locations, and search for the extreme points in their neighborhood.
- 2.3
- take the searched extremums as the peak/valley locations, calculate the middle location, and derive the cavity length.
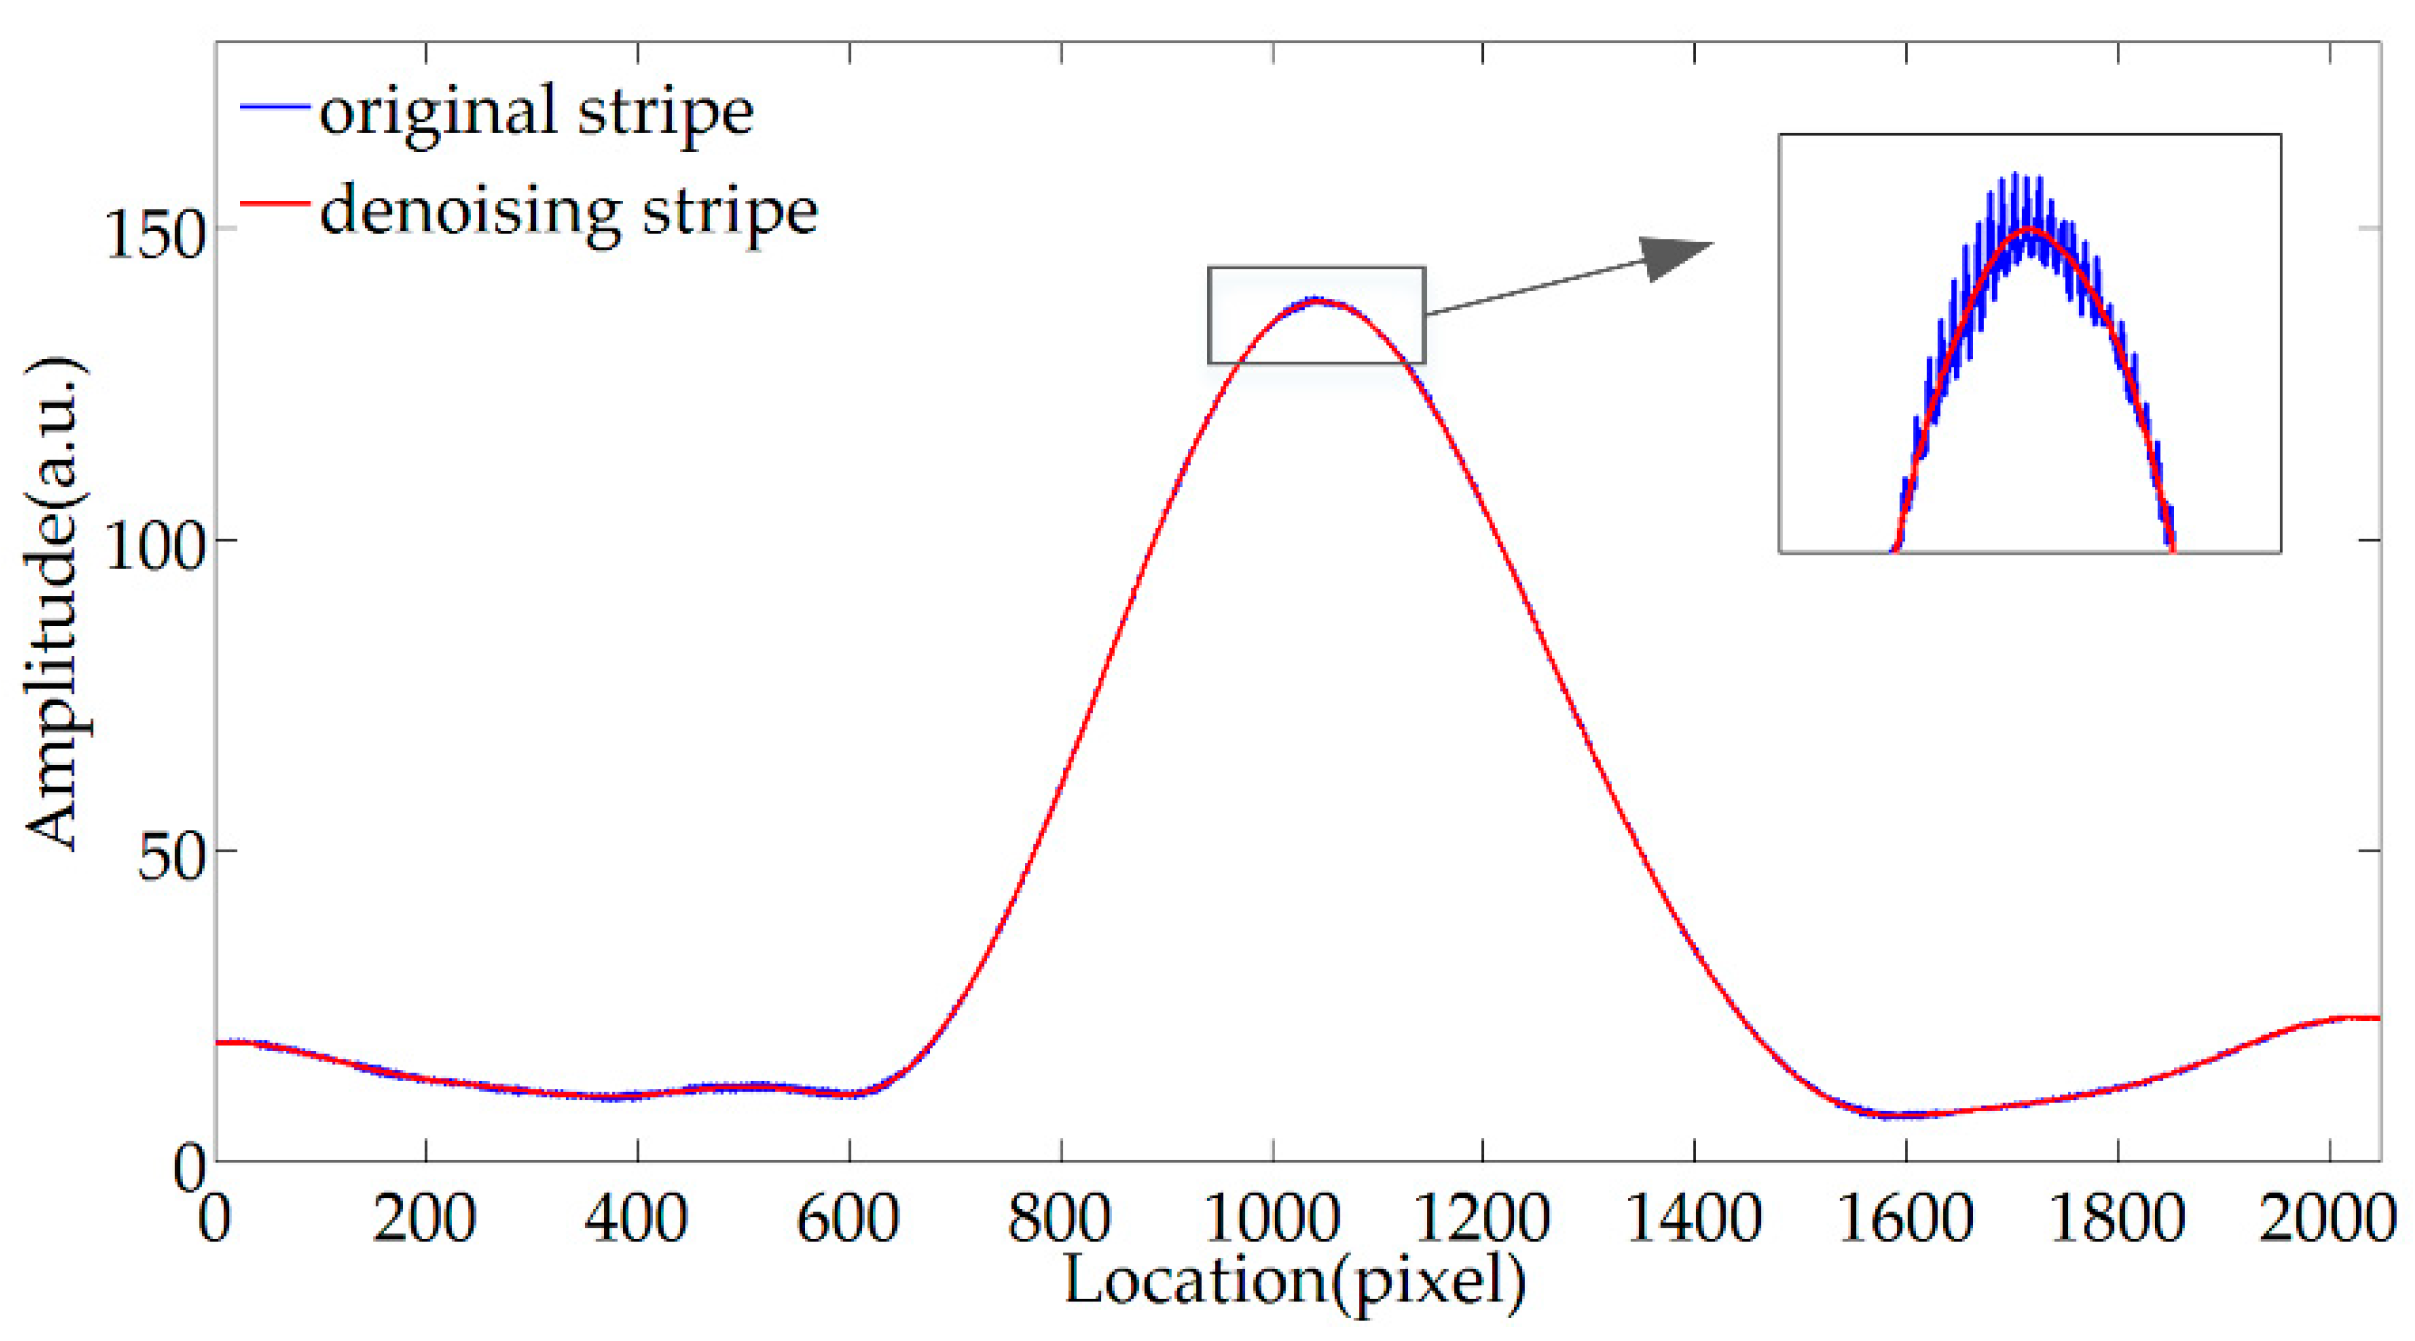
3. PLCI Fringe Wavelet Processing
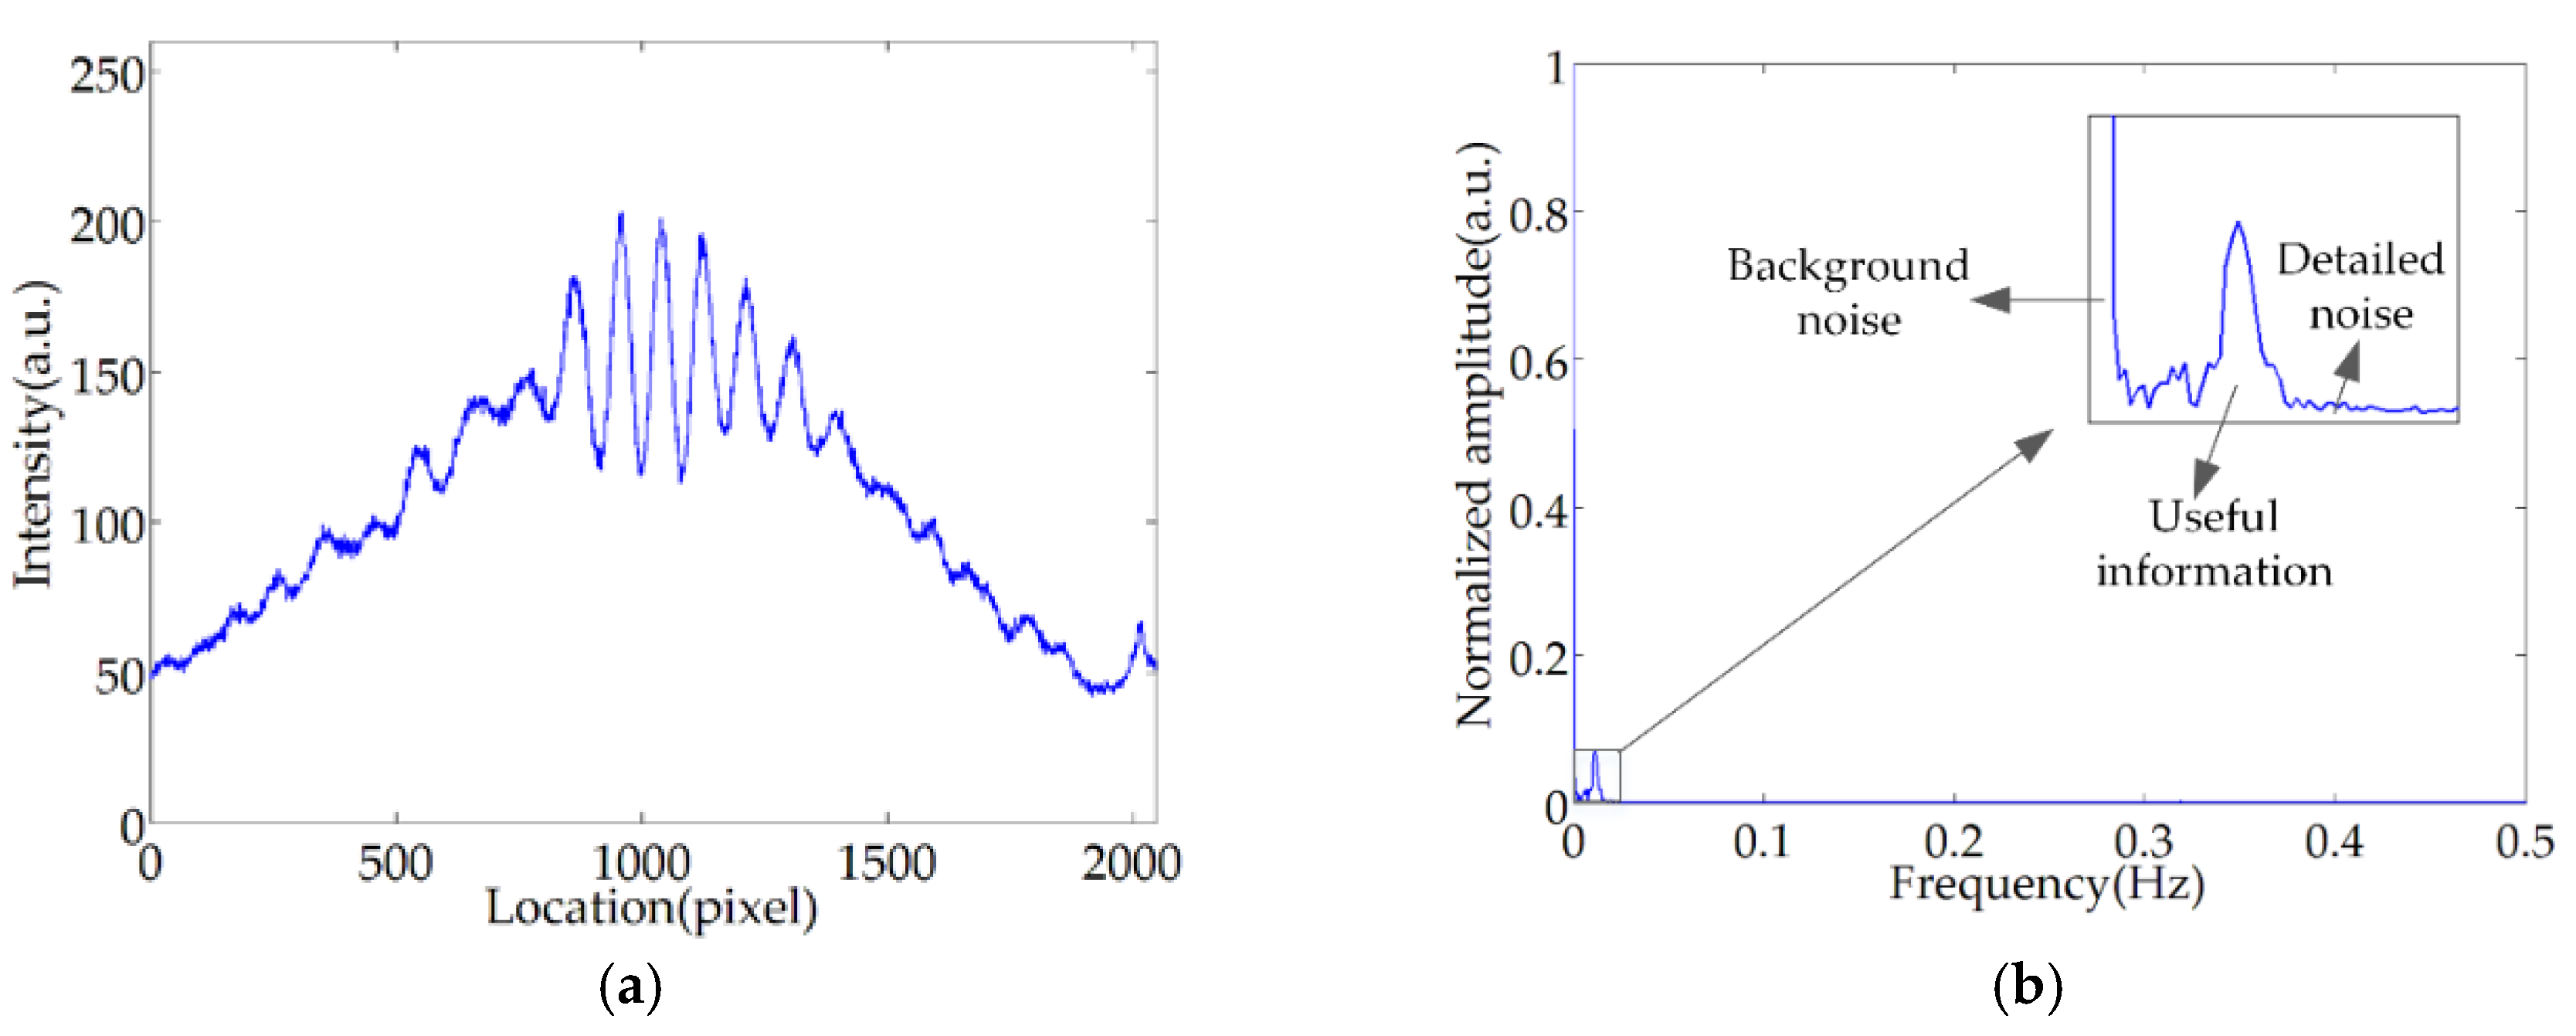
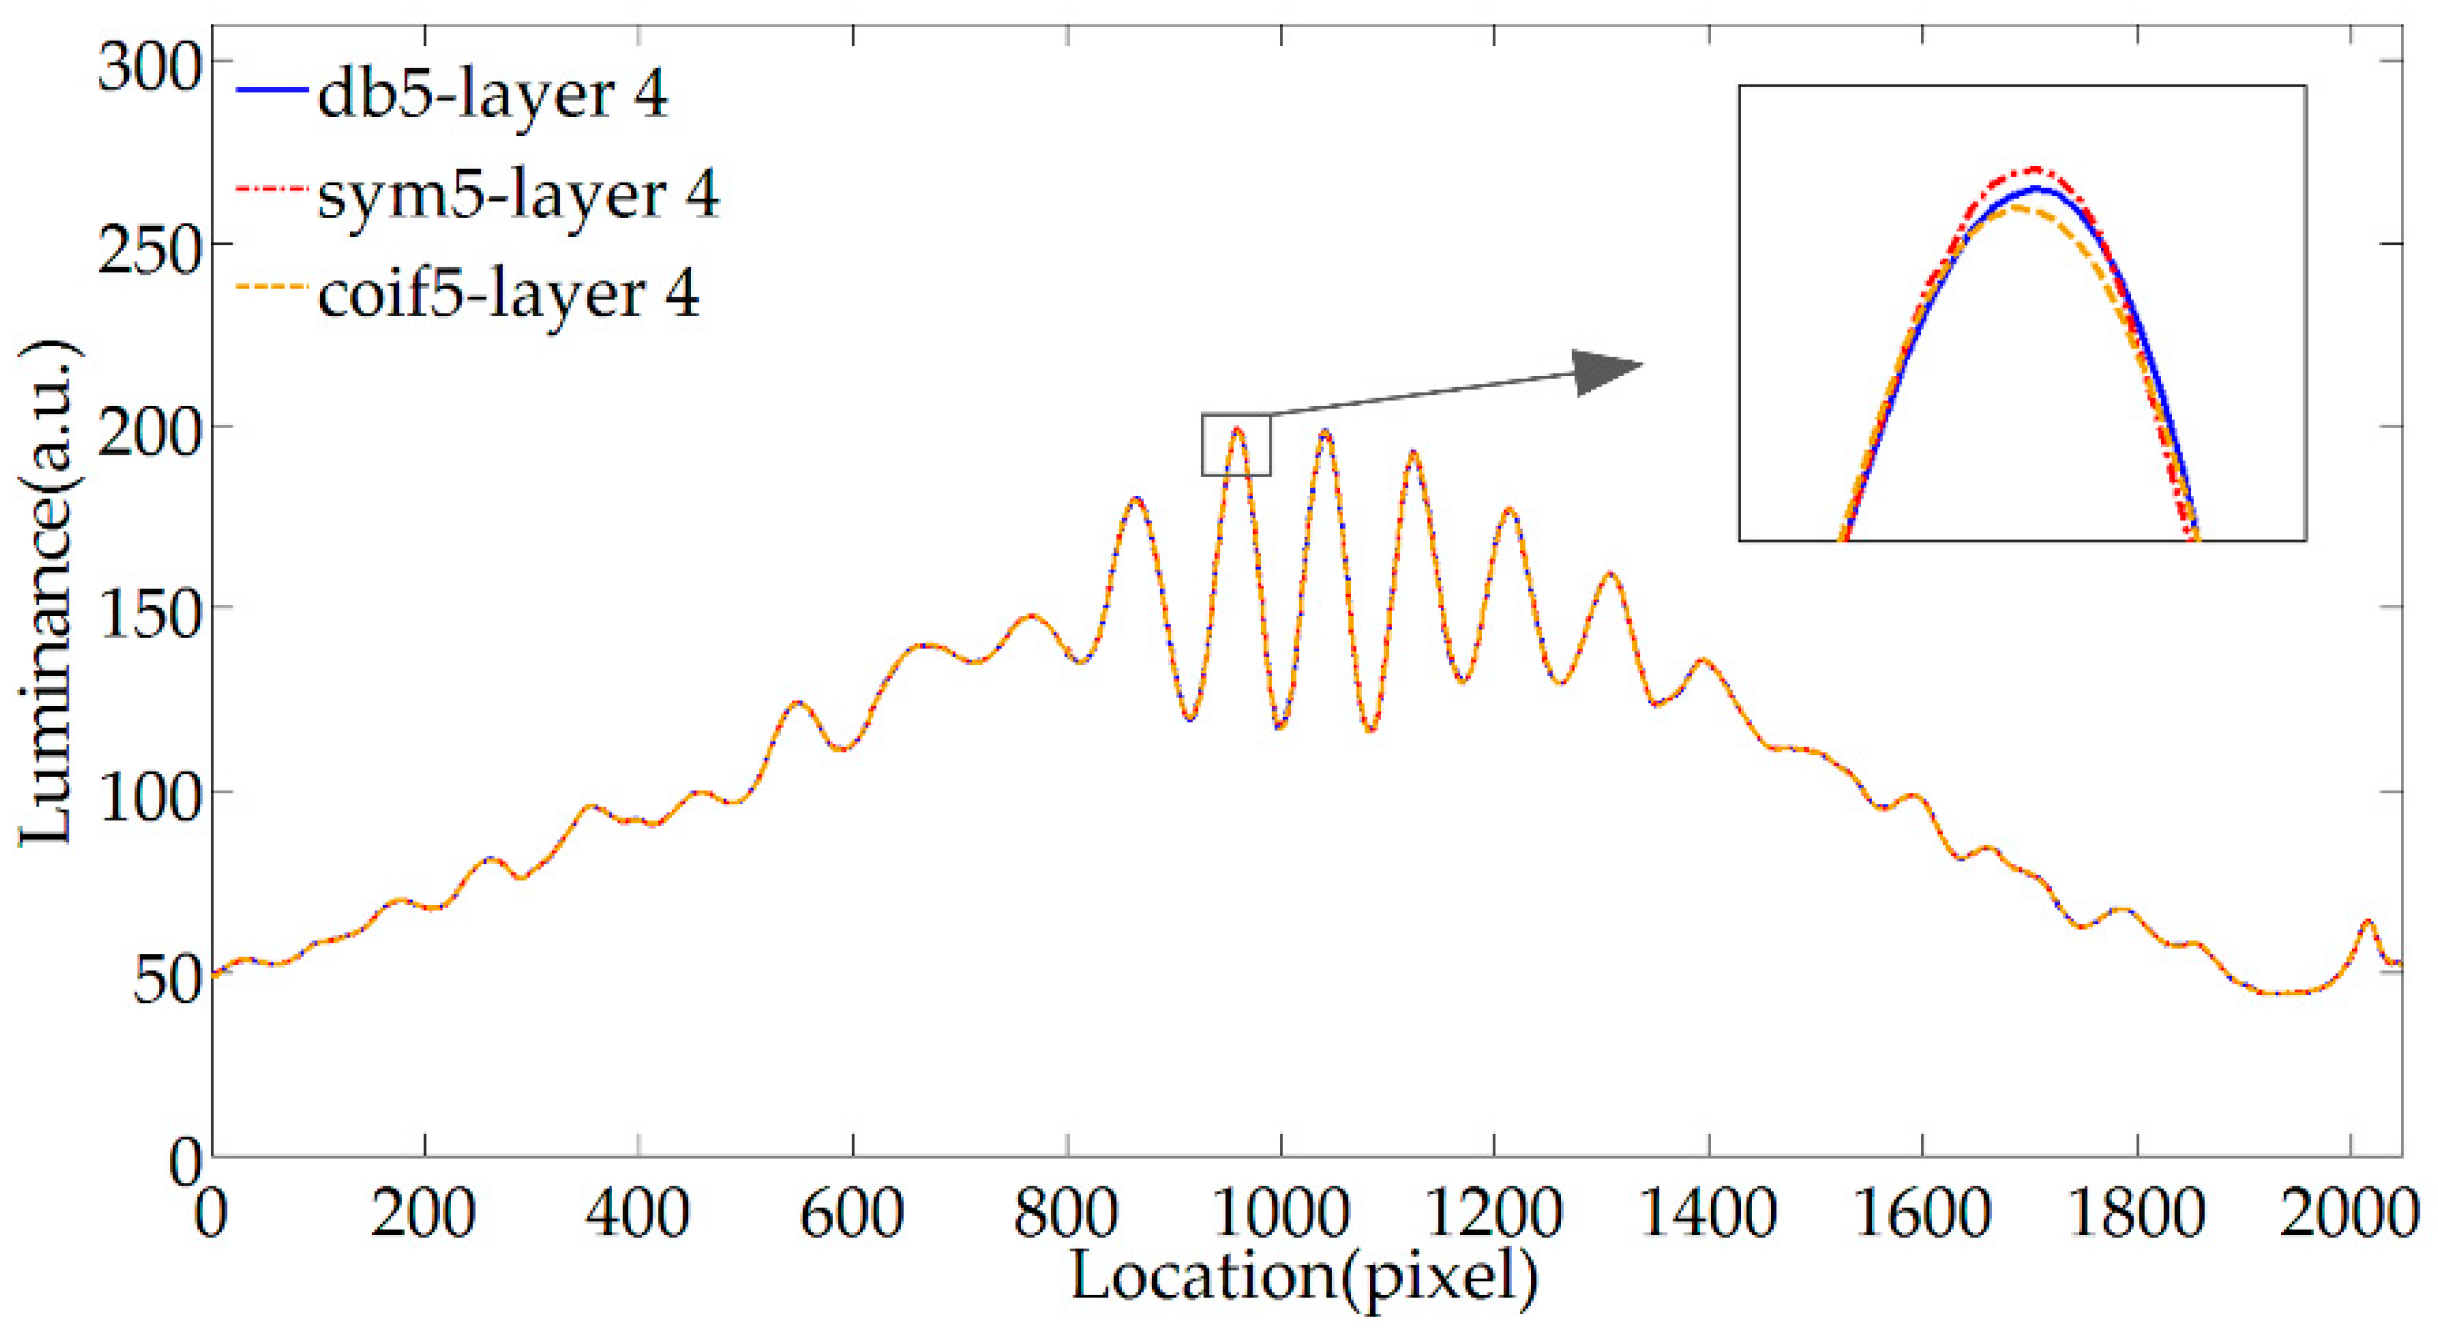
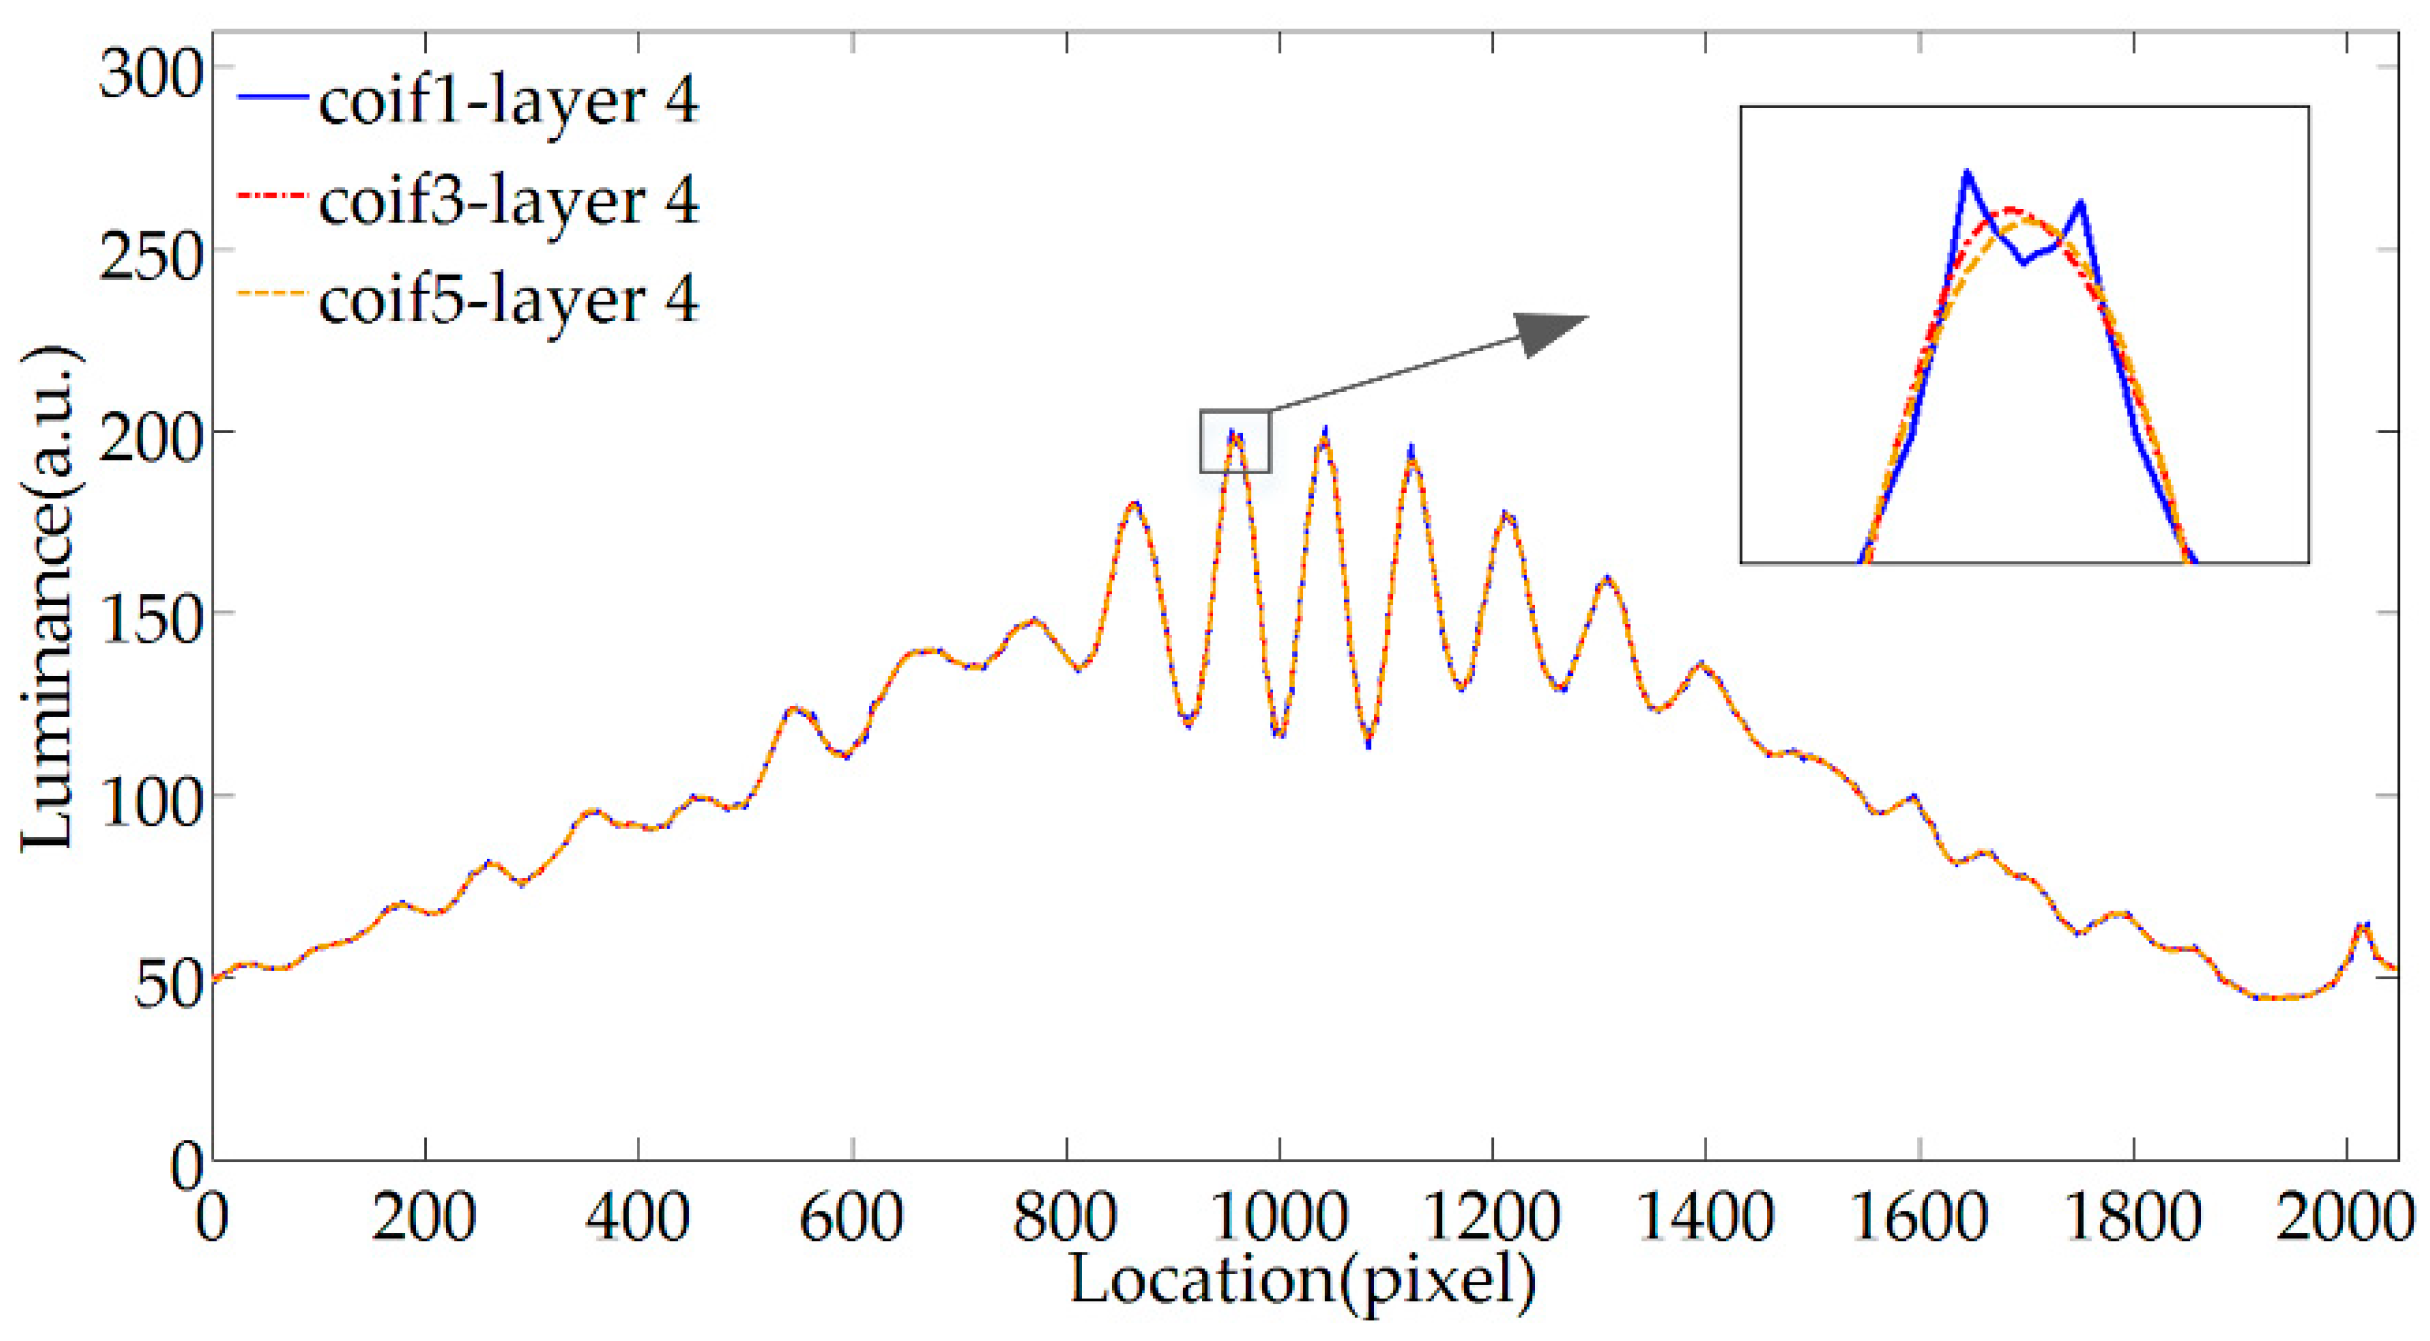
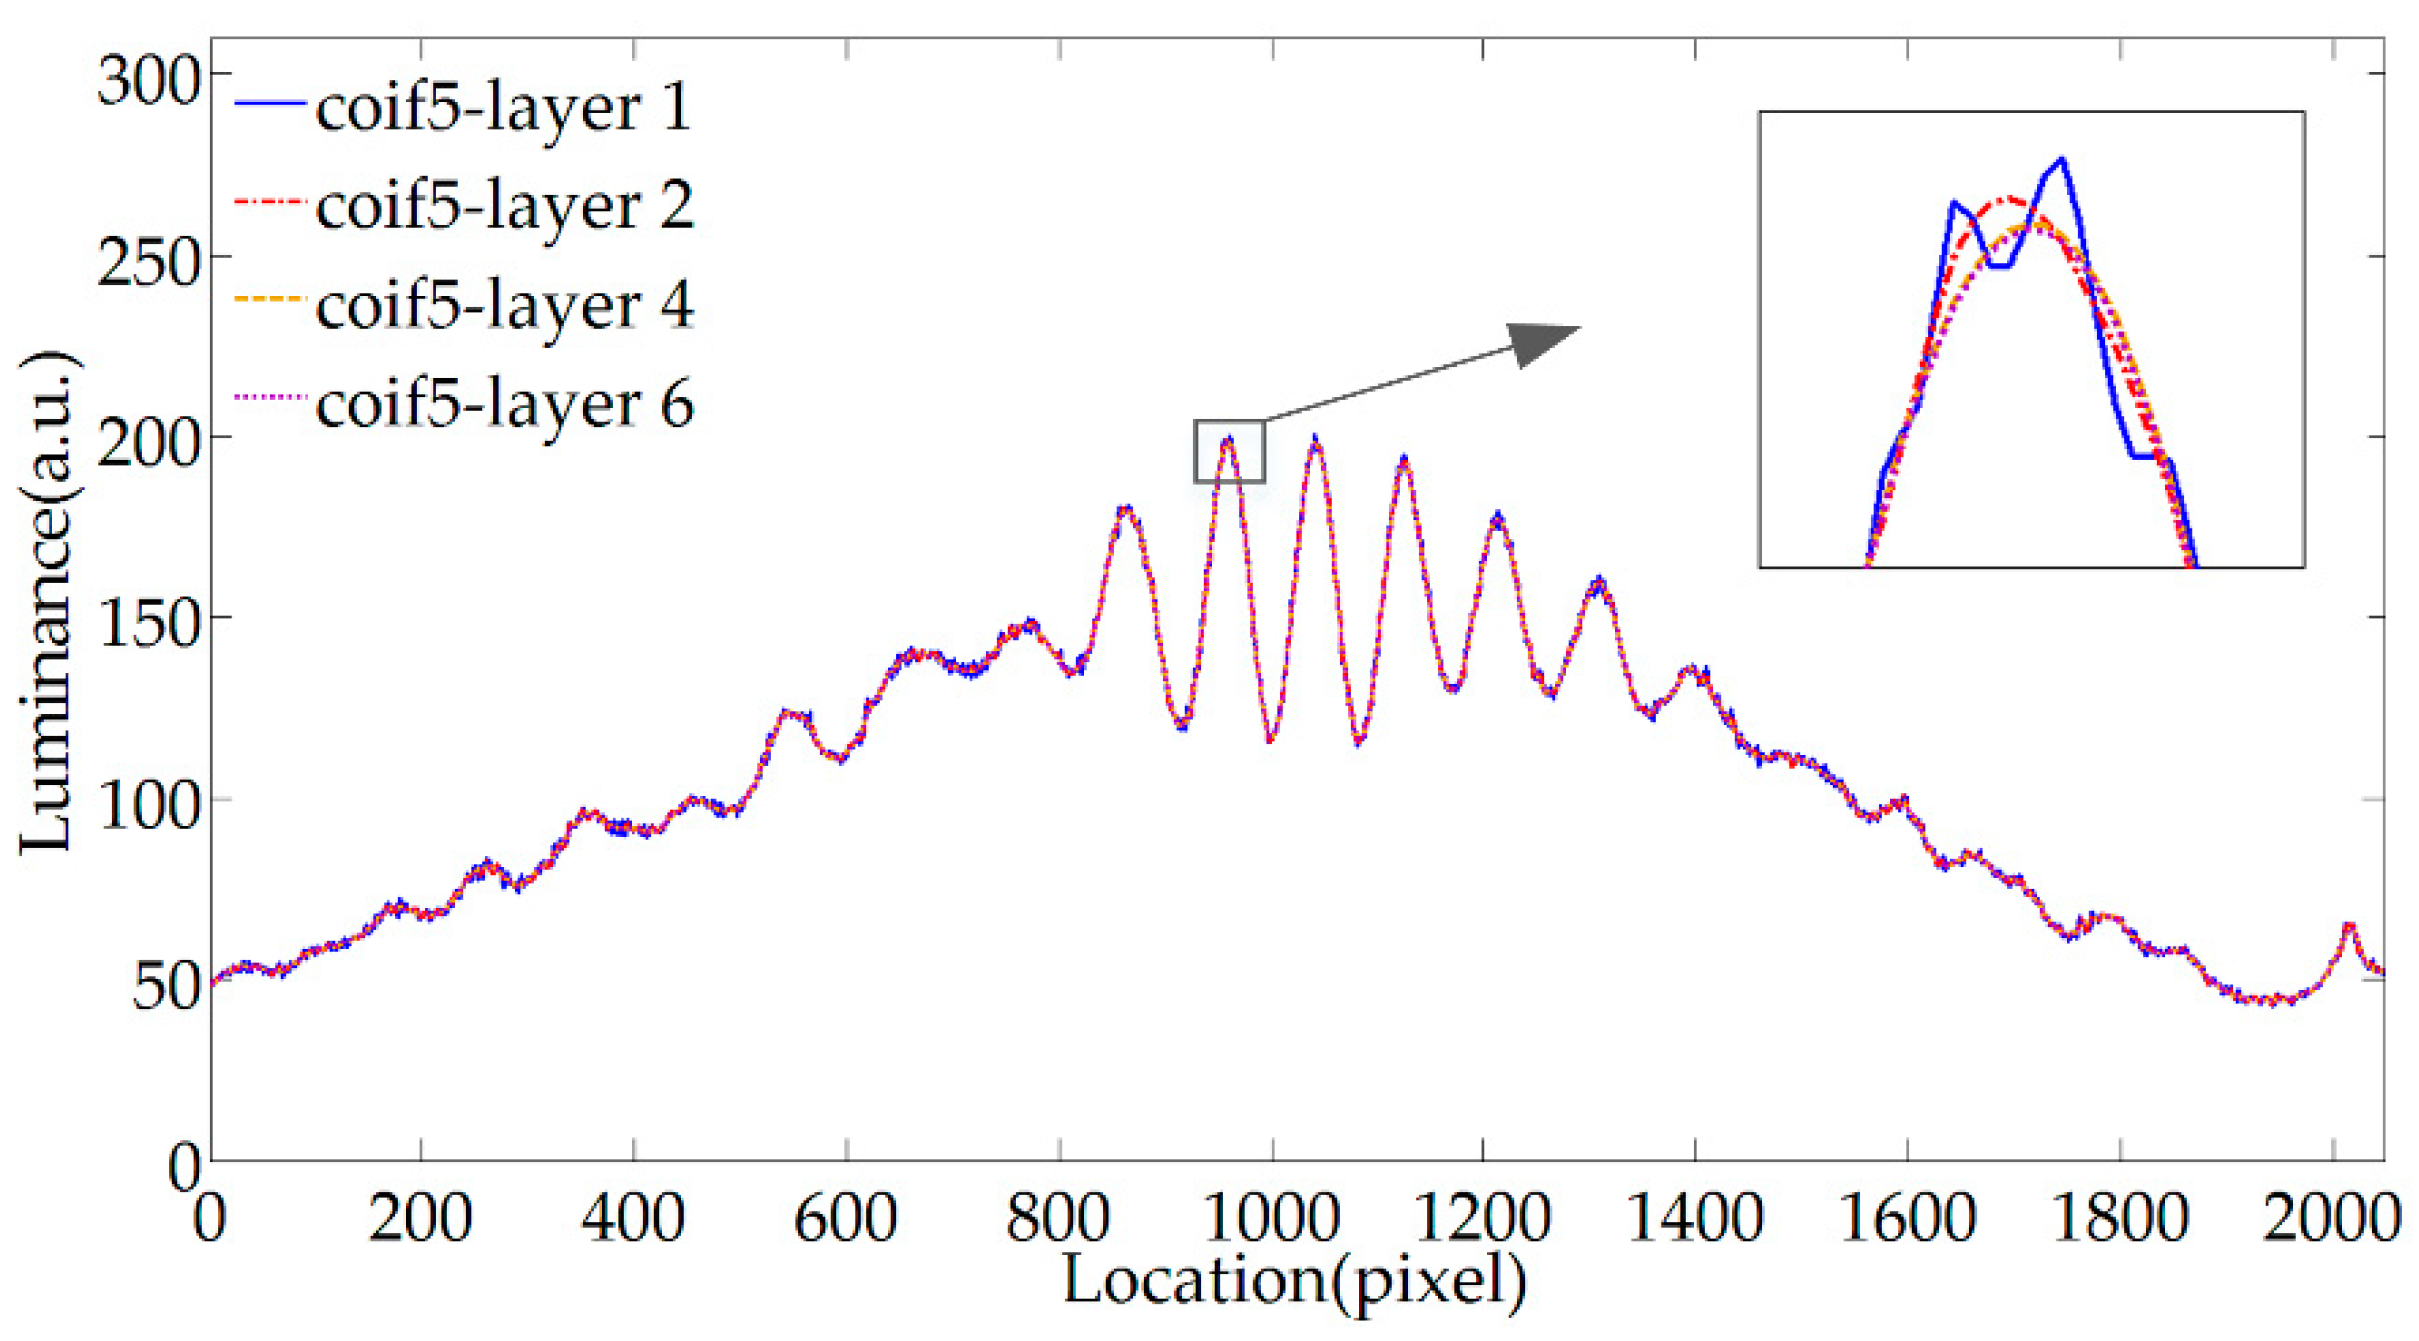
3.1. WTD
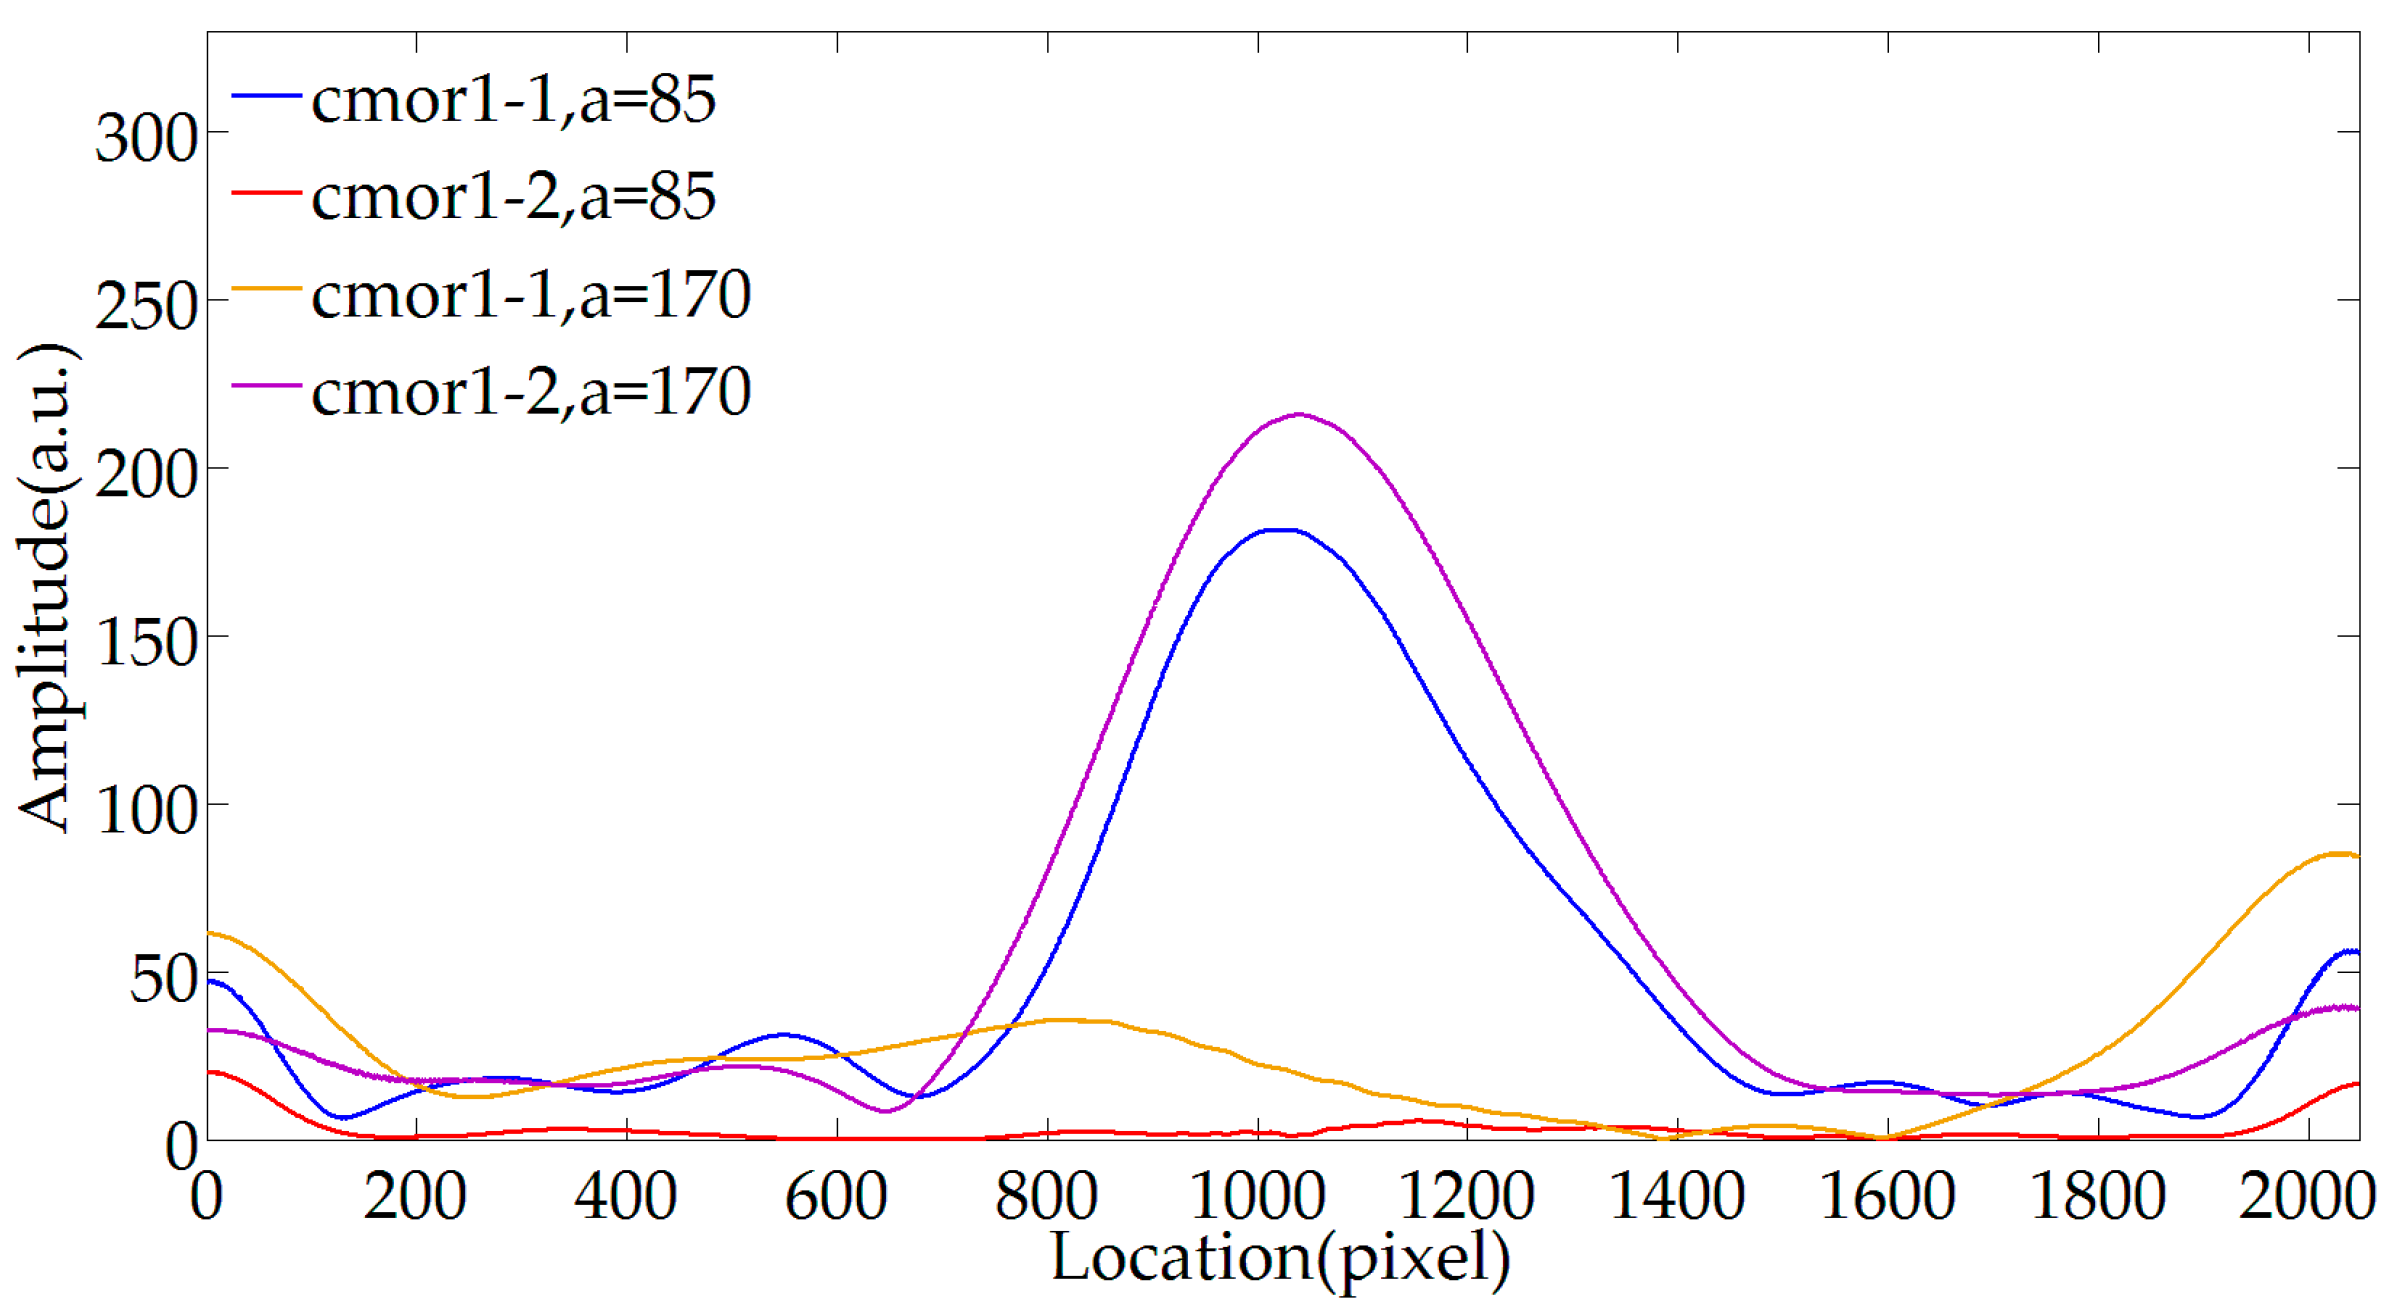
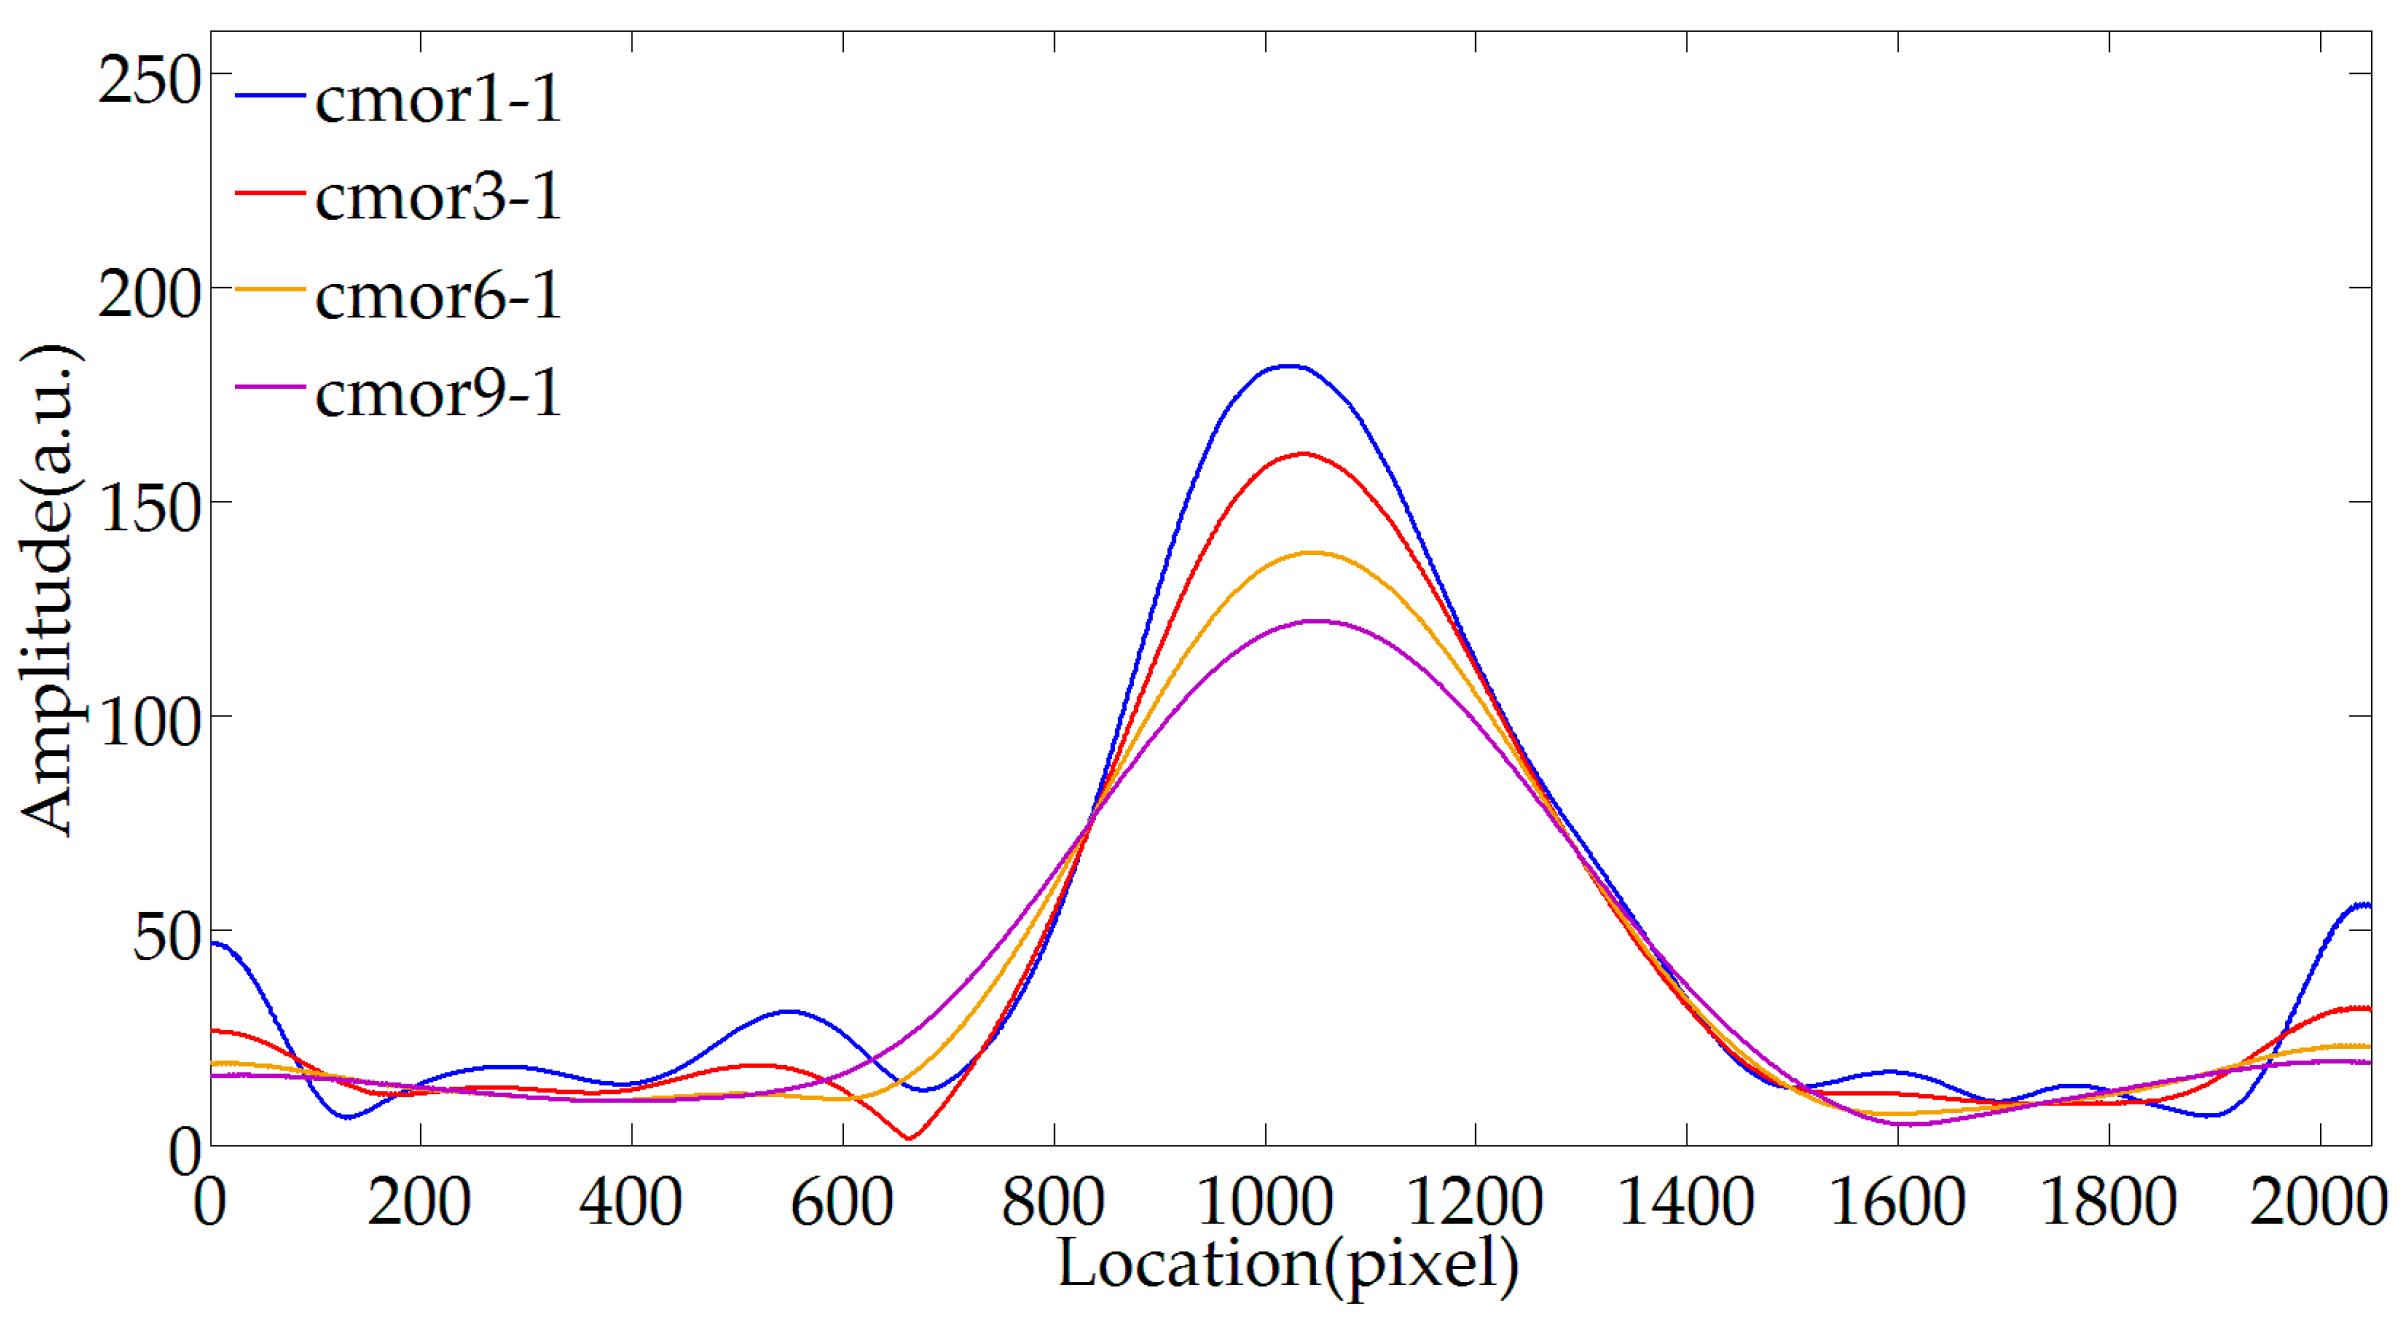
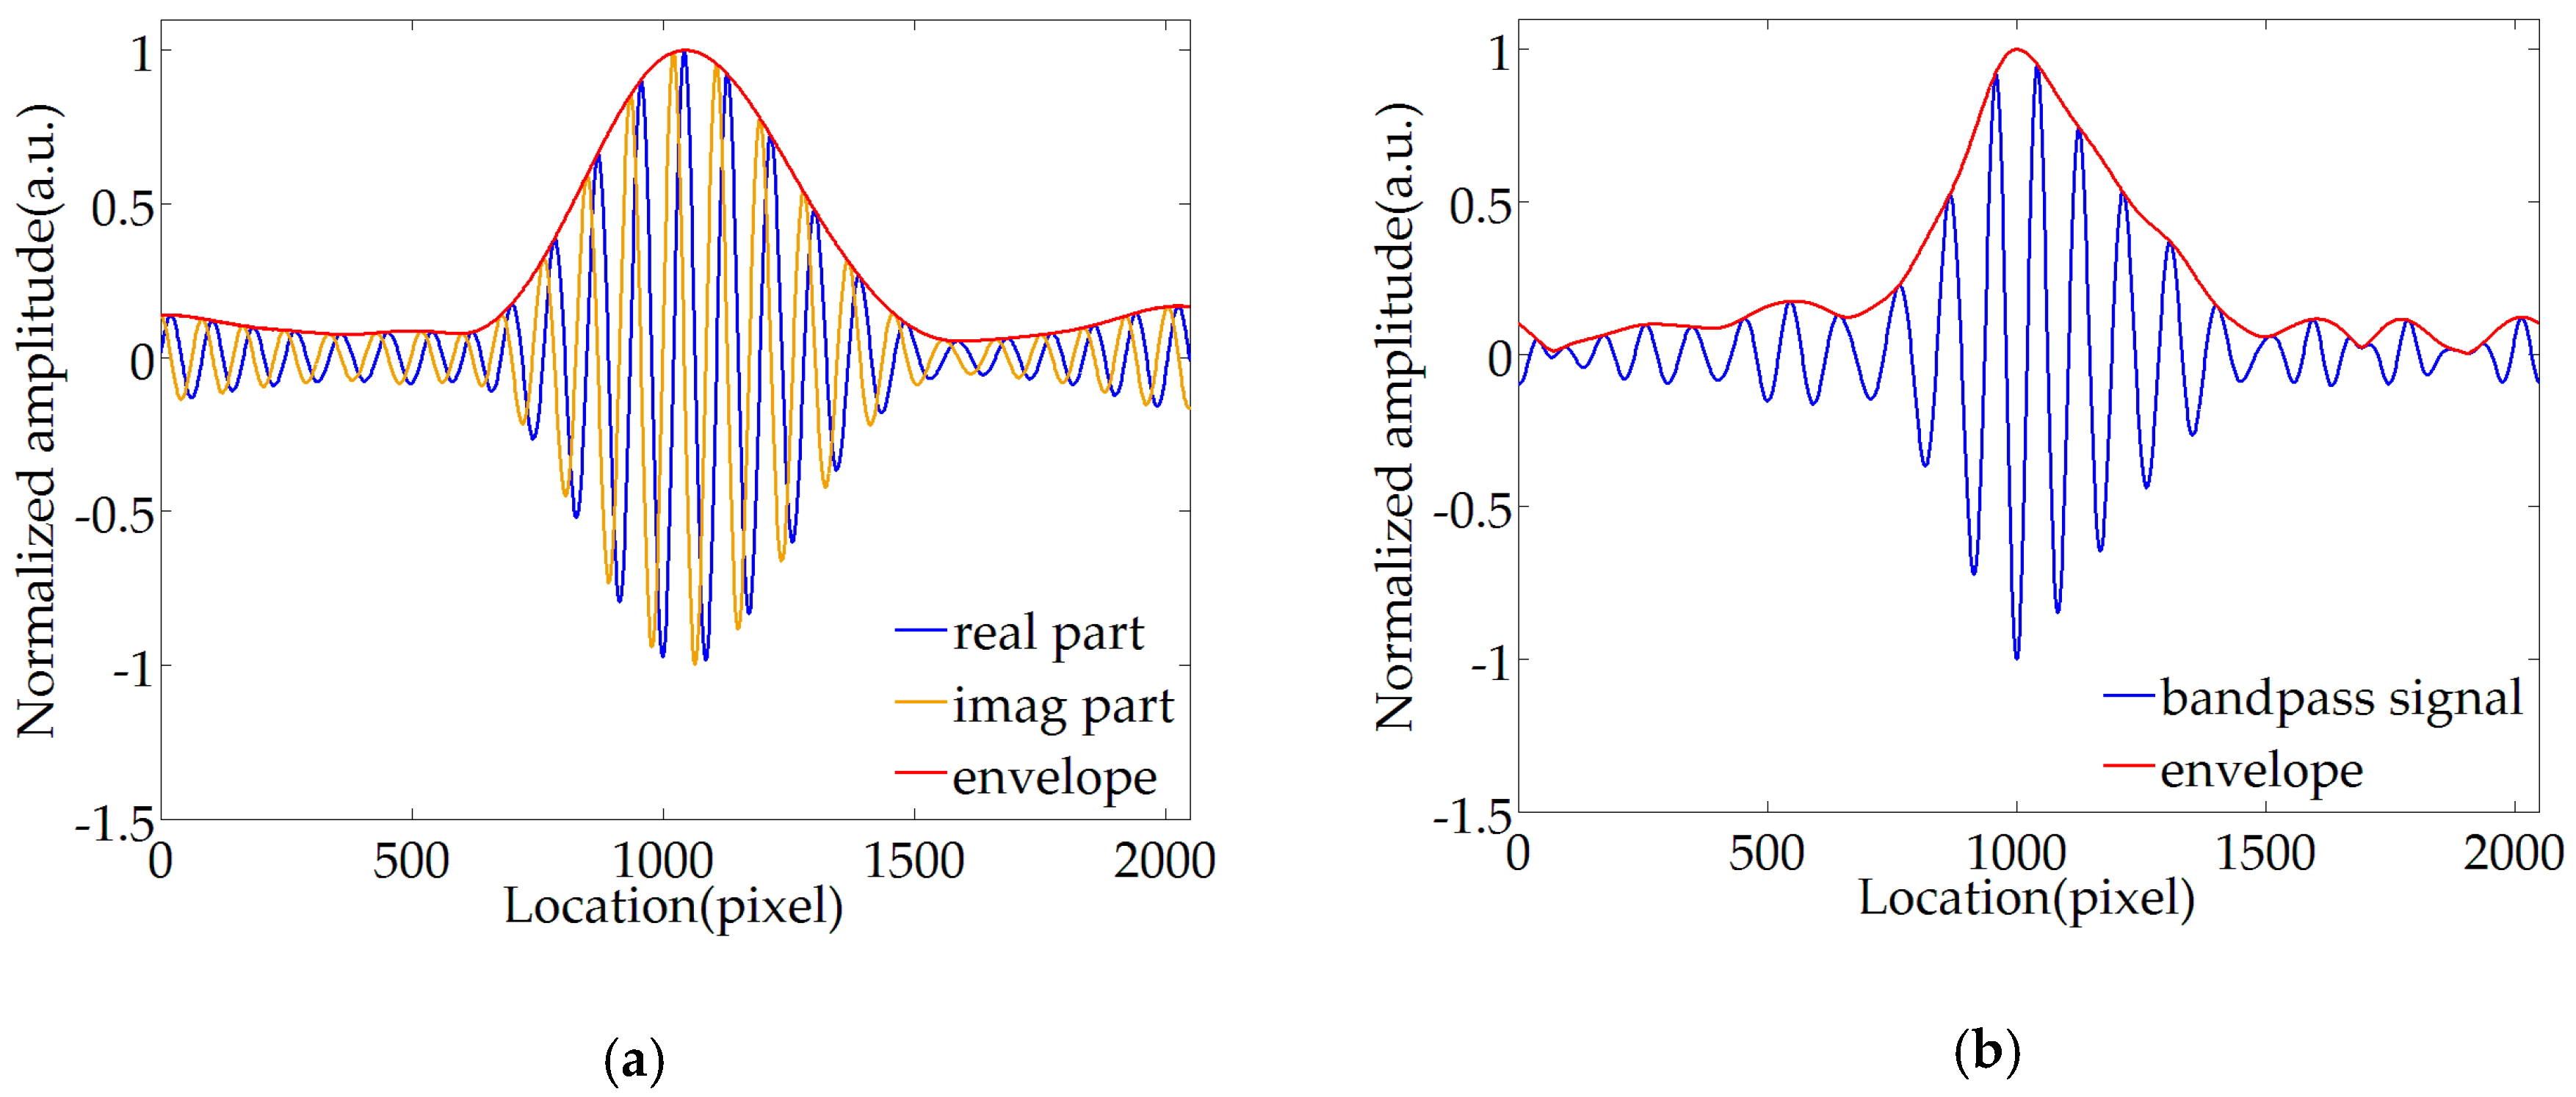
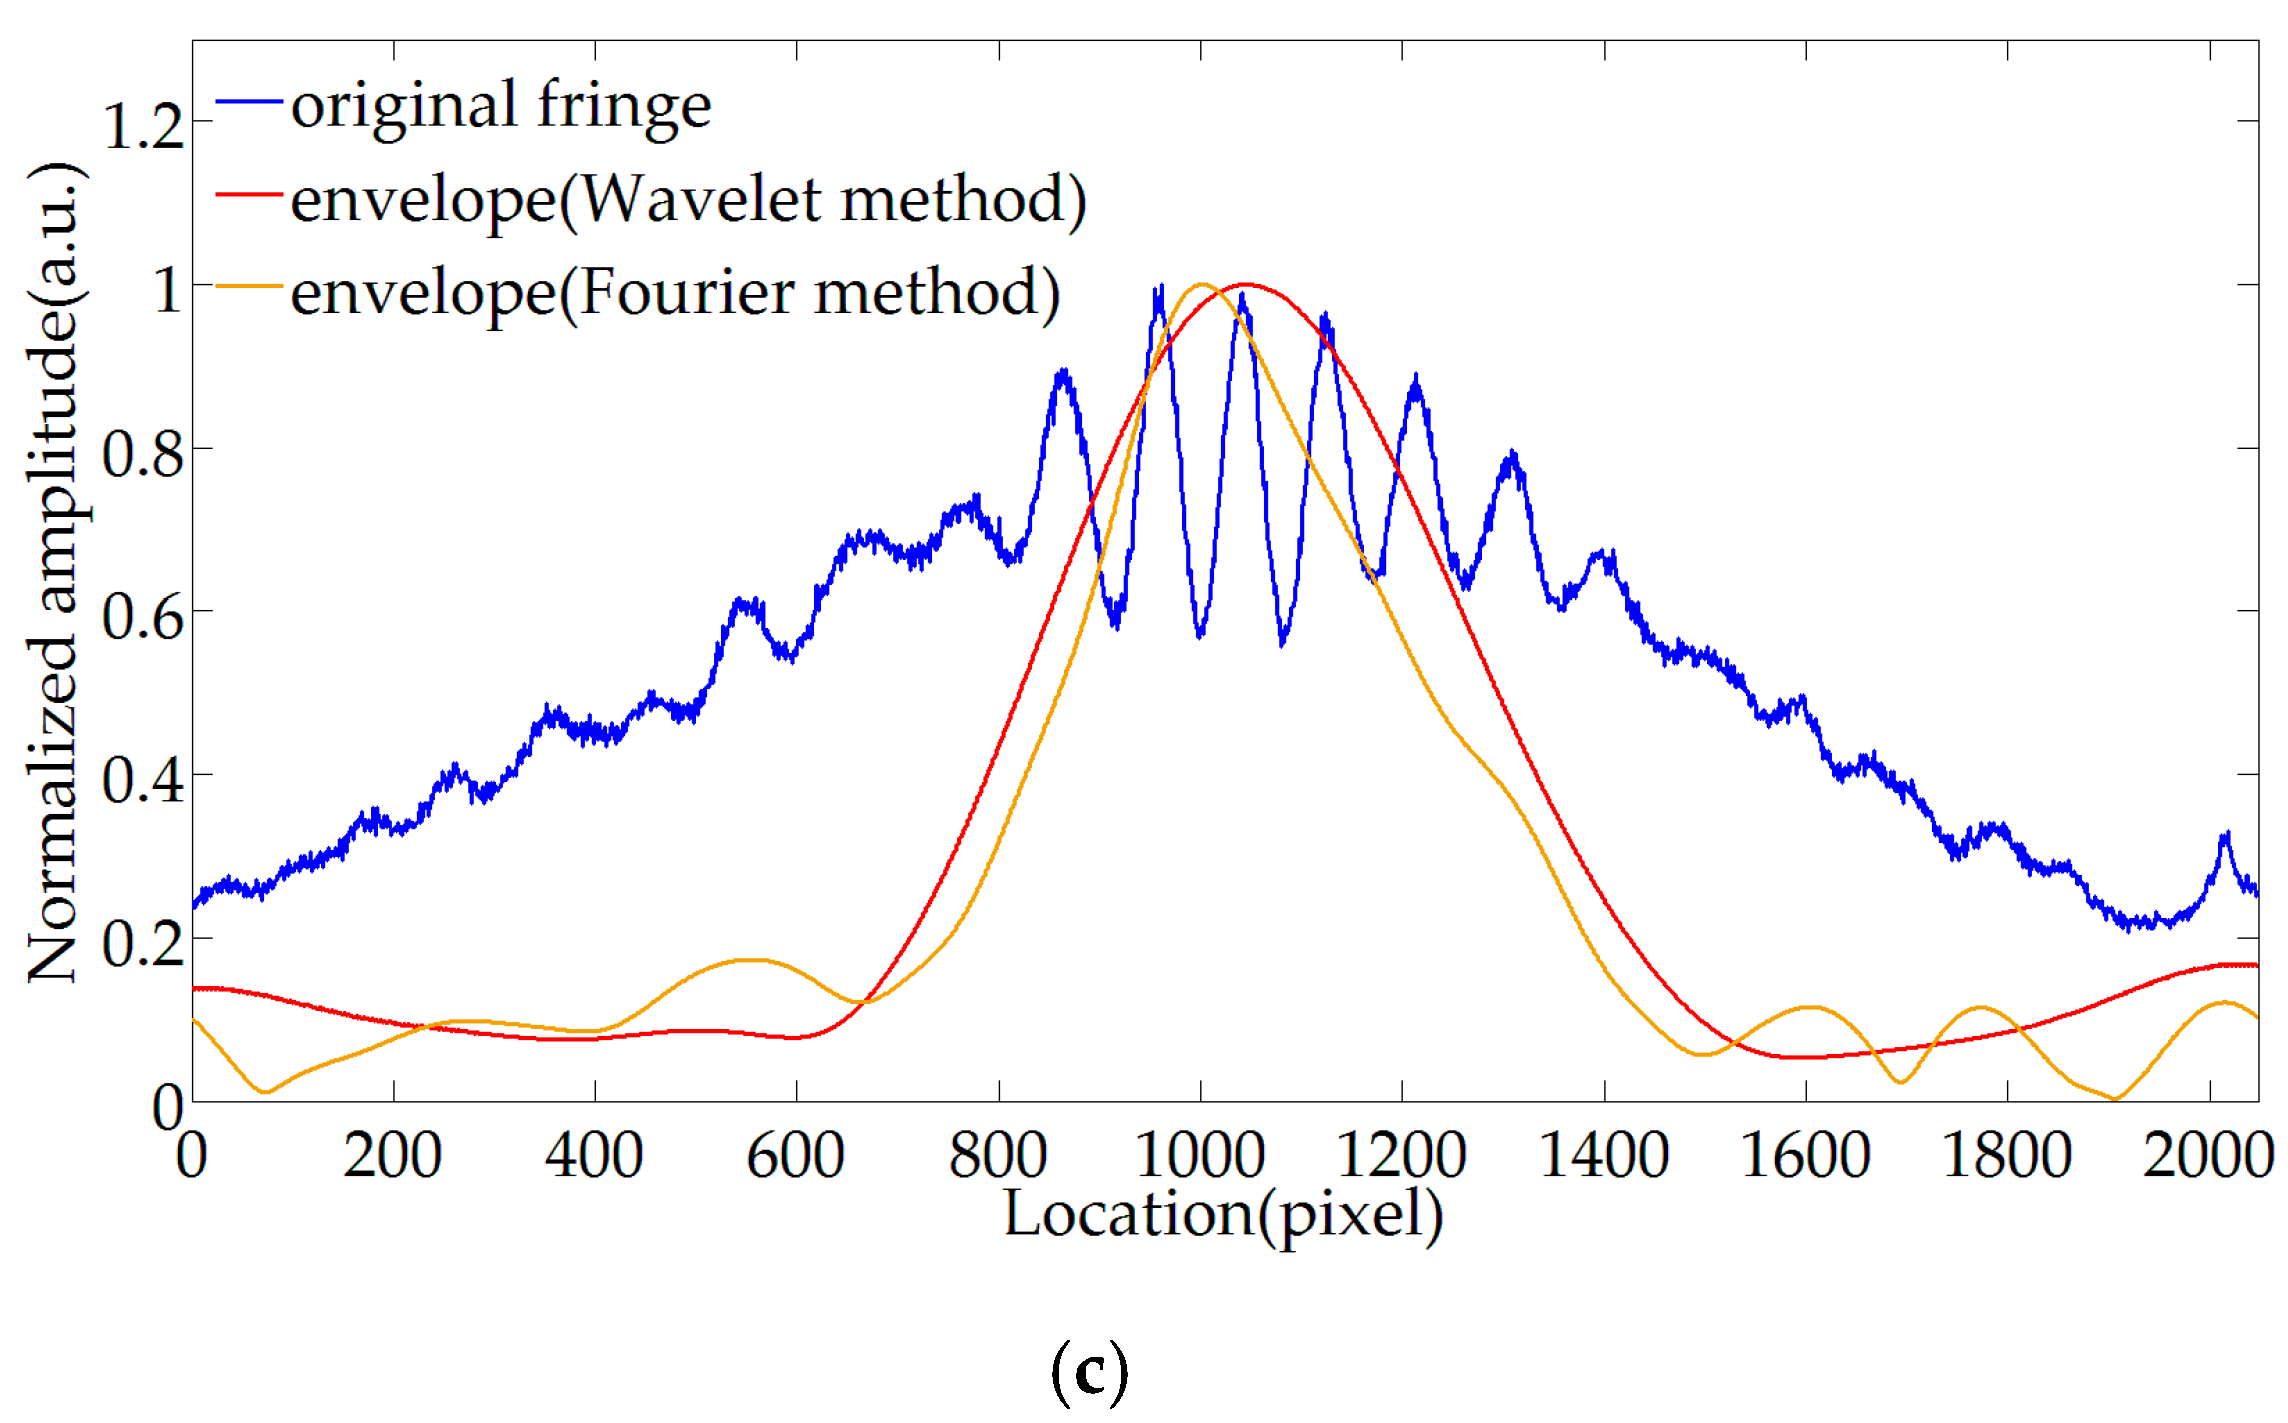
3.2. MWEE
3.3. Extremum Locations Tracking
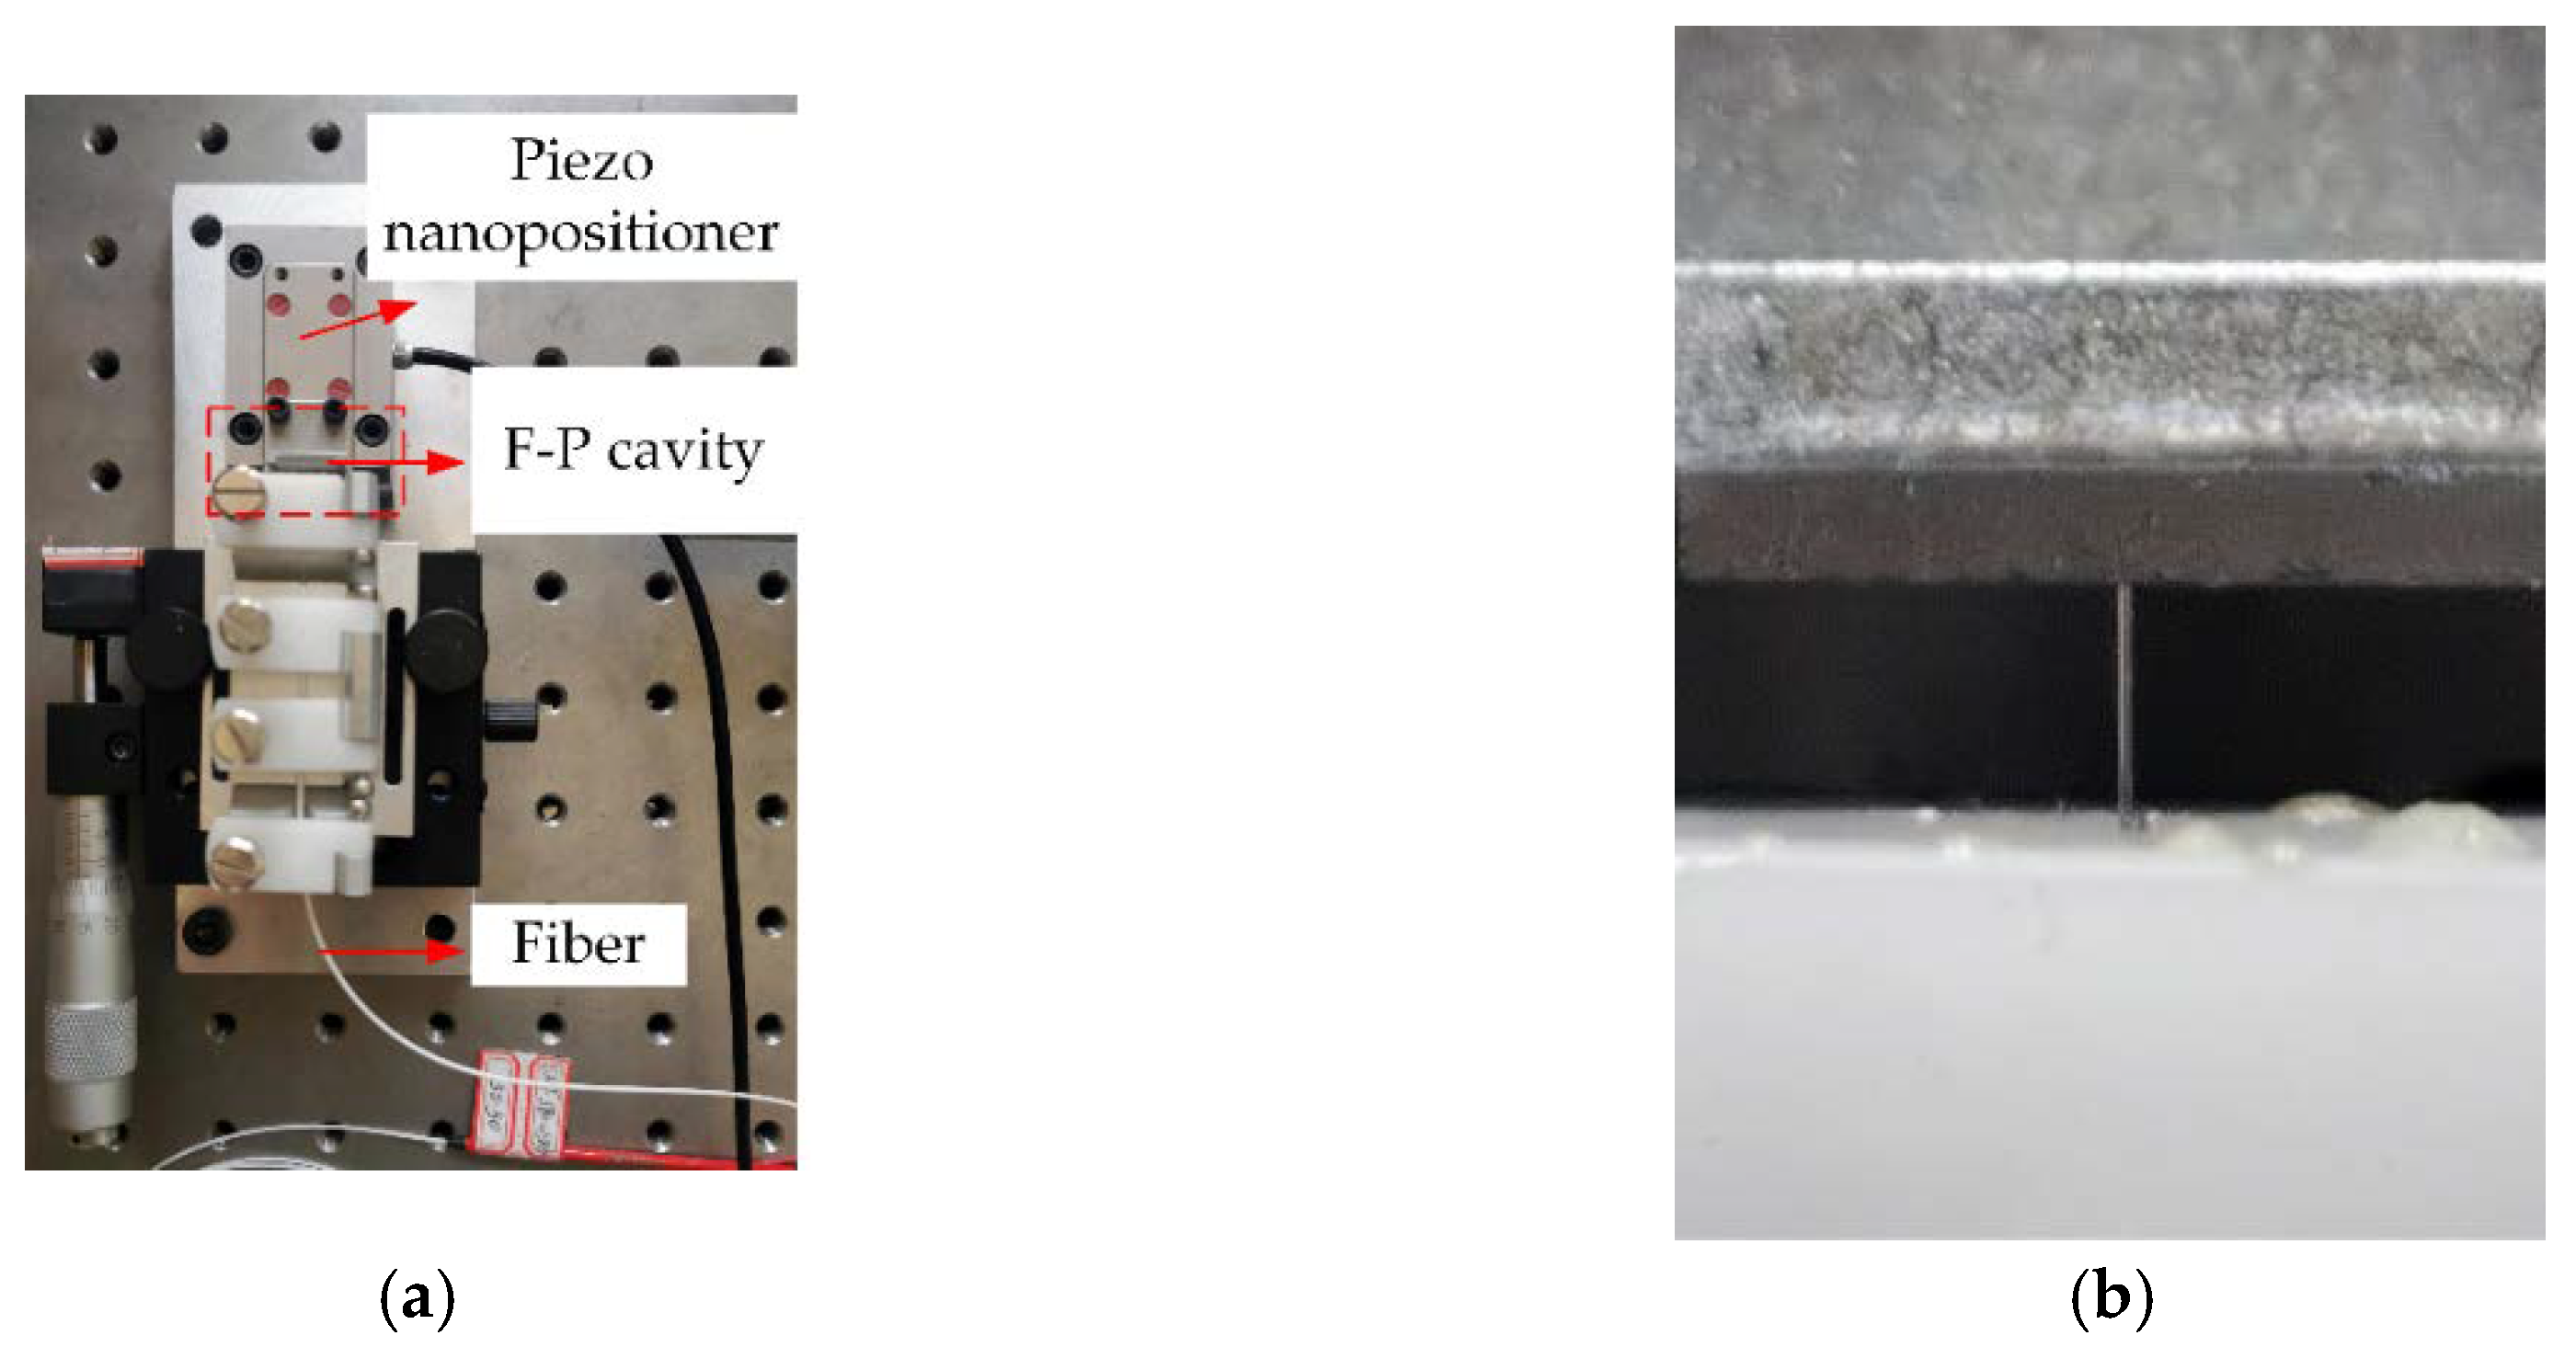
4. Experimental Results and Discussions
4.1. Calibration Work and Process Analysis
4.2. Repeatability Accuracy Test
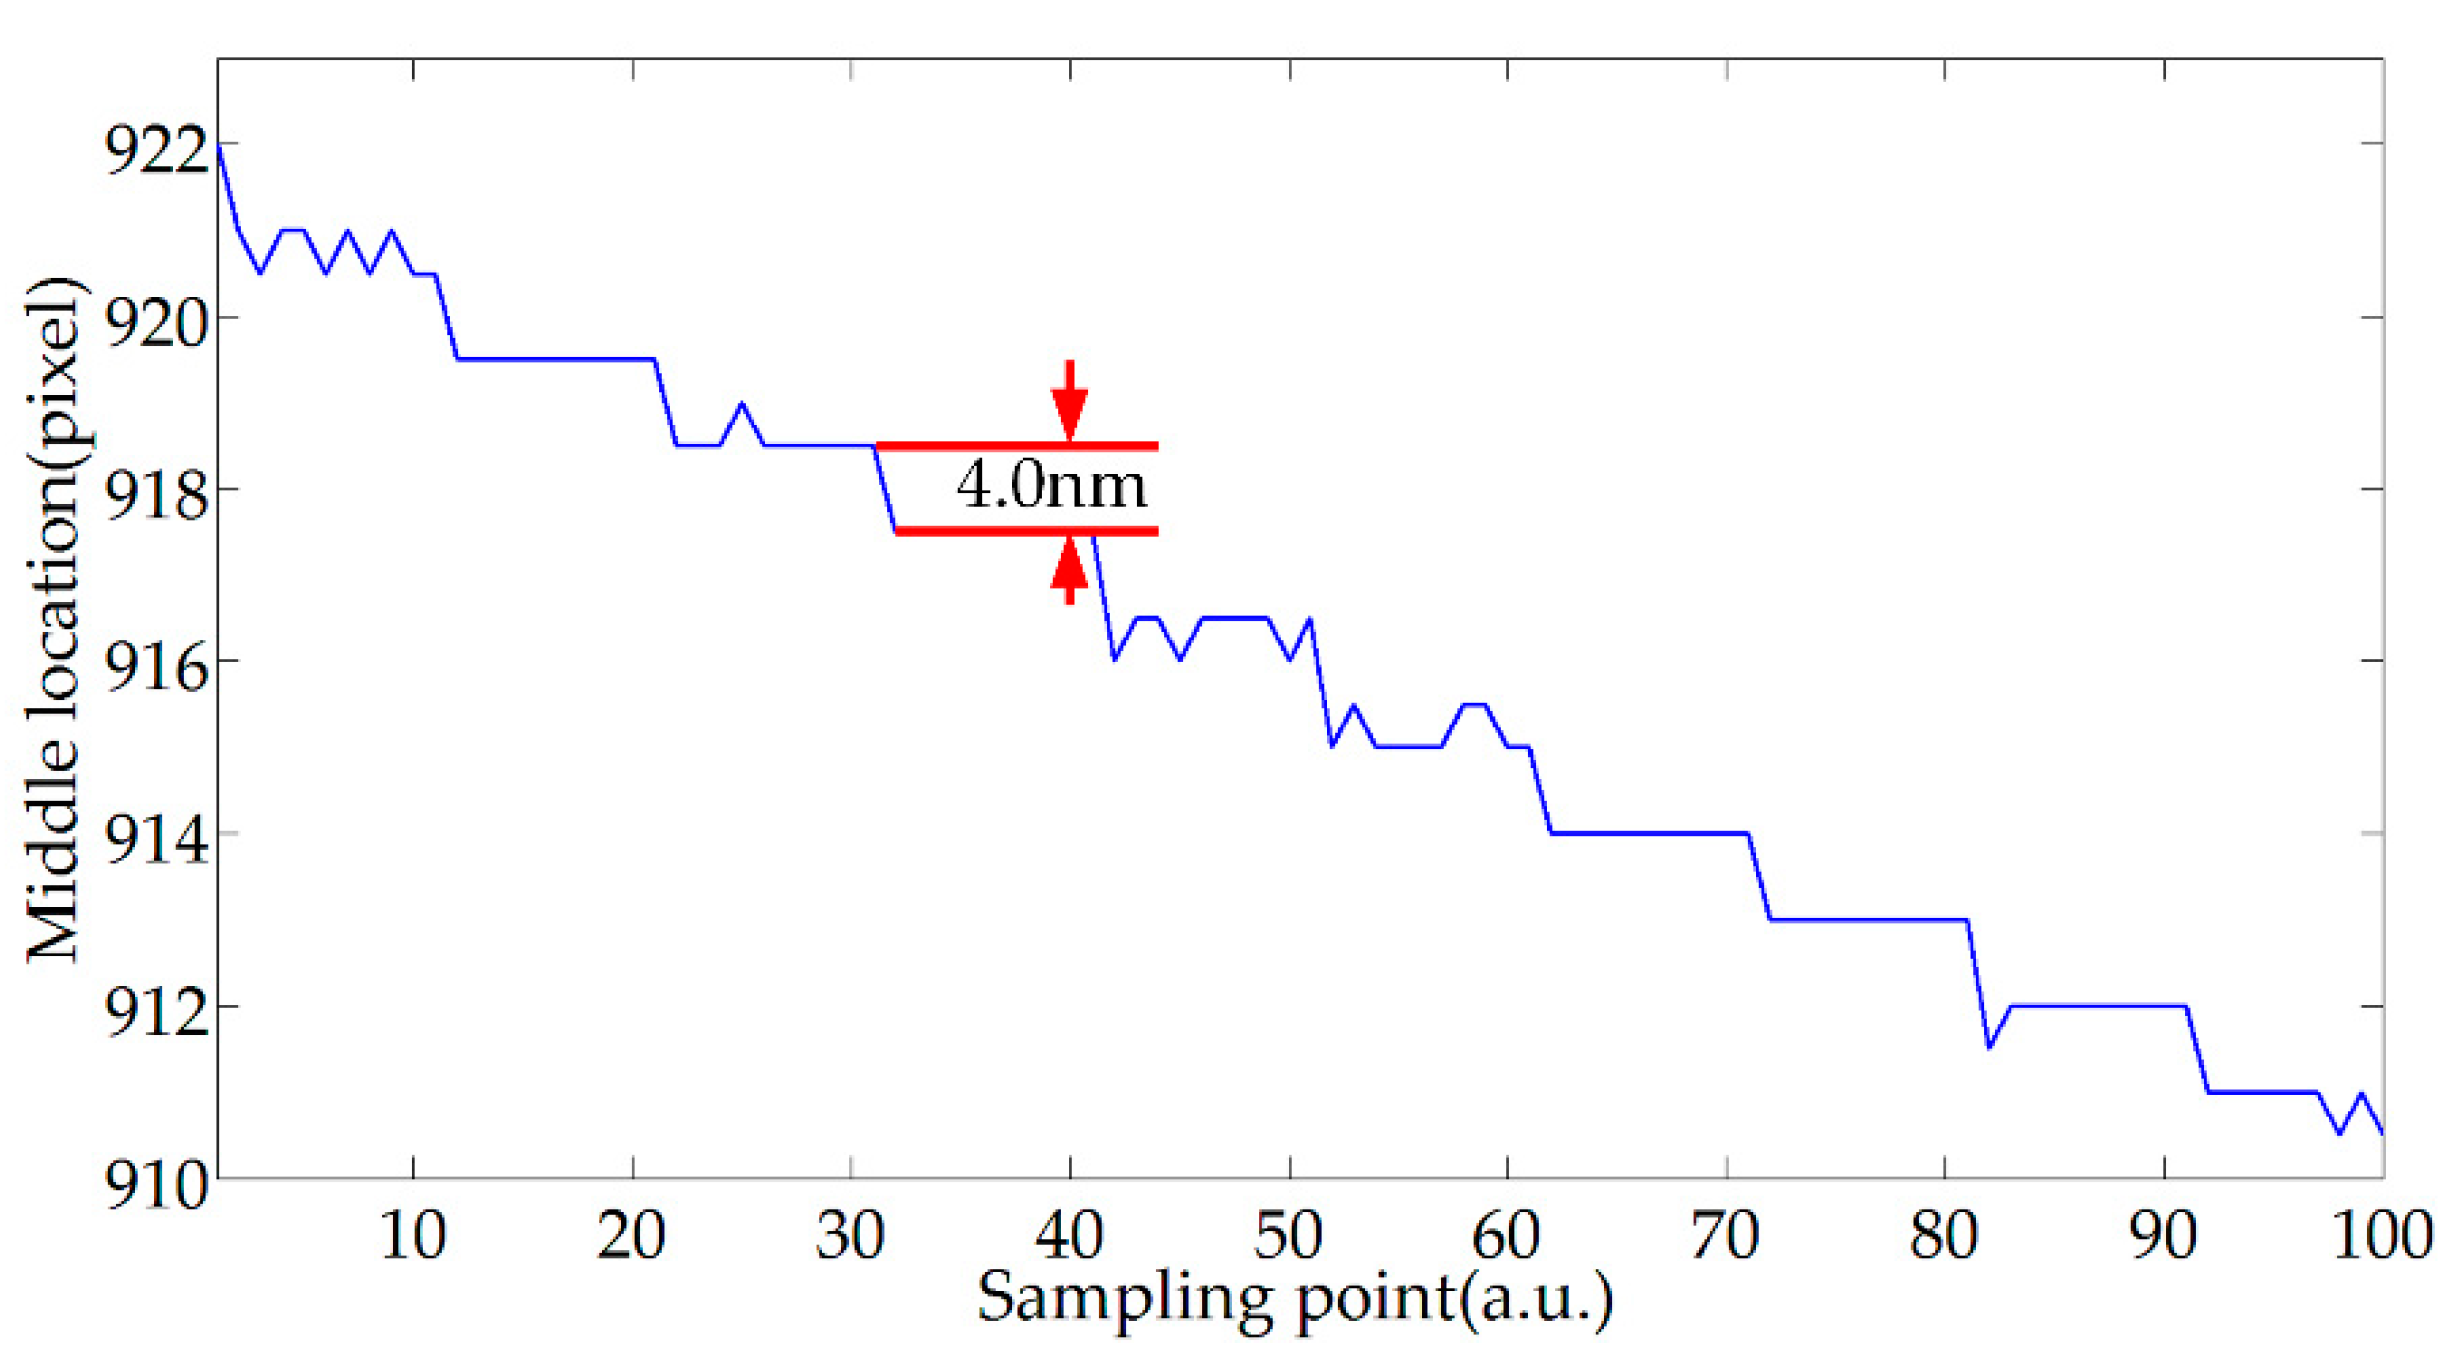
4.3. Resolution Test
5. Conclusions
Author Contributions
Funding
Conflicts of Interest
References
- Chen, J.H.; Huang, X.G.; Zhao, J.R.; Tao, J.; He, W.X.; Liu, S.H. Fabry–Perot interference-based fiber-optic sensor for small displacement measurement. Opt. Commun. 2010, 283, 3315–3319. [Google Scholar] [CrossRef]
- Zhu, T.; Ke, T.; Rao, Y.; Chiang, K.S. Fabry–Perot optical fiber tip sensor for high temperature measurement. Opt. Commun. 2010, 283, 3683–3685. [Google Scholar] [CrossRef]
- Wang, R.; Xie, X.; Xu, X.; Chen, X.; Xiao, L. Comparison of Measurements with Finite-Element Analysis of Silicon-Diaphragm-Based Fiber-Optic Fabry–Perot Temperature Sensors. Sensors 2019, 19, 4780. [Google Scholar] [CrossRef] [PubMed] [Green Version]
- Yu, H.; Wang, Y.; Ma, J.; Zheng, Z.; Luo, Z.; Zheng, Y. Fabry-Perot Interferometric High-Temperature Sensing Up to 1200 °C Based on a Silica Glass Photonic Crystal Fiber. Sensors 2018, 18, 273. [Google Scholar]
- Liang, H.; Jia, P.; Liu, J.; Fang, G.; Li, Z.; Hong, Y.; Liang, T.; Xiong, J. Diaphragm-Free Fiber-Optic Fabry-Perot Interferometric Gas Pressure Sensor for High Temperature Application. Sensors 2018, 18, 1011. [Google Scholar] [CrossRef] [PubMed] [Green Version]
- Mao, Y.; Tong, X.L. High precision optical fiber Fabry-Perot sensor for gas pressure detection. In Proceedings of the Fourth Asia Pacific Optical Sensors Conference, Wuhan, China, 15–18 October 2013. [Google Scholar]
- May, R.G.; Wang, A.; Xiao, H.; Deng, J.; Huo, W.; Wang, Z. SCIIB pressure sensors for oil extraction applications. In Proceedings of the Harsh Environment Sensors II, Boston, MA, USA, 8 December 1999. [Google Scholar]
- Liang, W.; Huang, Y.; Xu, Y.; Lee, R.K.; Yariv, A. Highly sensitive fiber Bragg grating refractive index sensors. Appl. Phys. Lett. 2005, 86, 151122. [Google Scholar] [CrossRef]
- Xu, J. High Temperature High Bandwidth Fiber Optic Pressure Sensors. Ph.D. Thesis, Virginia Polytechnic Institute and State University, Blacksburg, VA, USA, 2005. [Google Scholar]
- Jędrzejewska-Szczerska, M. Response of a New Low-Coherence Fabry-Perot Sensor to Hematocrit Levels in Human Blood. Sensors 2014, 14, 6965–6976. [Google Scholar] [CrossRef] [Green Version]
- Jinde, Y.; Tiegen, L.; Junfeng, J.; Kun, L.; Shuang, W.; Fan, W.; Zhenyang, D. Wavelength-division-multiplexing method of polarized low-coherence interferometry for fiber Fabry–Perot interferometric sensors. Opt. Lett. 2013, 38, 3751–3753. [Google Scholar]
- Chen, H.; Liu, J.; Zhang, X.; Wang, W.; Ma, Z.; Lv, W.; Guo, Z. High-Order Harmonic-Frequency Cross-Correlation Algorithm for Absolute Cavity Length Interrogation of White-Light Fiber-Optic Fabry-Perot Sensors. J. Lightwave Technol. 2020, 38, 953–960. [Google Scholar] [CrossRef]
- Belleville, C.; Duplain, G. White-light interferometric multimode fiber-optic strain sensor. Opt. Lett. 1993, 18, 78–80. [Google Scholar] [CrossRef]
- Wang, S.; Jiang, J.; Liu, T.; Liu, K.; Yin, J.; Meng, X.; Li, L. A simple and effective demodulation method for polarized low-coherence interferometry. IEEE Photonics Technol. Lett. 2012, 24, 1390–1392. [Google Scholar] [CrossRef]
- Ghosh, G. Dispersion-equation coefficients for the refractive index and birefringence of calcite and quartz crystals. Opt. Commun. 1999, 163, 95–102. [Google Scholar] [CrossRef]
- Wang, S.; Liu, T.; Jiang, J.; Liu, K.; Yin, J.; Wu, F. Birefringence dispersion compensation demodulation algorithm for polarized low-coherence interferometry. Opt. Lett. 2013, 38, 3169. [Google Scholar] [CrossRef] [PubMed]
- Wang, S.; Liu, T.; Jiang, J.; Liu, K.; Yin, J.; Qin, Z.; Zou, S. Zero-fringe demodulation method based on location-dependent birefringence dispersion in polarized low-coherence interferometry. Opt. Lett. 2014, 39, 1827–1830. [Google Scholar] [CrossRef] [PubMed]
- Zhang, X.; Huang, S.; Gao, N.; Zhang, Z. Fourier transform profilometry based on mean envelope extraction. In Proceedings of the Second International Conference on Photonics and Optical Engineering, Xi’an, China, 14–17 October 2016. [Google Scholar]
- Sandoz, P. Wavelet transform as a processing tool in white-light interferometry. Opt. Lett. 1997, 22, 1065–1067. [Google Scholar] [CrossRef]
- Cherbuliez, M.; Jacquot, P.M.; De Lega, X.C. Wavelet processing of interferometric signals and fringe patterns. In Proceedings of the SPIE’s International Symposium on Optical Science, Engineering, and Instrumentation, Denver, CO, USA, 18–23 July 1999. [Google Scholar]
- Xu, H.; Luo, H. Interference Signal Envelope Extraction Based on Wavelet Transform Method. Semicond. Optoelectron. 2017, 3, 21. [Google Scholar]
- Chin, K.K.; Sun, Y.; Feng, G.; Georgiou, G.E.; Guo, K.; Niver, E.; Roman, H.; Noe, K. Fabry-Perot diaphragm fiber-optic sensor. Appl. Opt. 2007, 46, 7614–7619. [Google Scholar] [CrossRef]
- Yuan, J.S.; Zhang, D.X.; Li, Z. Wavelet denoising algorithm based on improved thresholding method. J. North China Electr. Power Univ. 2010, 37, 92–97. [Google Scholar]
- Huimin, C.; Ruimei, Z.; Yanli, H. Improved threshold denoising method based on wavelet transform. Phys. Procedia 2012, 33, 1354–1359. [Google Scholar] [CrossRef] [Green Version]
- Lin, J.; Qu, L. Feature extraction based on complex Morlet wavelet and its application for mechanical fault diagnosis. J. Sound Vib. 2000, 234, 135–148. [Google Scholar] [CrossRef]
- Chun, L.C.; Zhengding, Q. A method based on complex Morlet wavelet for extracting vibration signal envelope. In Proceedings of the 2000 5th International Conference on Signal Processing Proceedings, 16th World Computer Congress 2000 (WCC 2000/ICSP 2000), Beijing, China, 21–25 August 2000; pp. 337–340. [Google Scholar]
- Zhang, J.F.; Yi, Q.W.; Li, J. Complex analytic wavelet transform and vibration signals envelope-demodulation analysis. Zhendong yu Chongji J. Vib. Shock. 2010, 29, 93–96. [Google Scholar]


| Point | Std | Point | Std | Point | Std | Point | Std | Point | Std |
|---|---|---|---|---|---|---|---|---|---|
| 1 | 0.00 | 21 | 0.55 | 41 | 0.55 | 61 | 0.38 | 81 | 0.38 |
| 2 | 0.38 | 22 | 0.39 | 42 | 0.55 | 62 | 0.39 | 82 | 0.39 |
| 3 | 0.55 | 23 | 0.47 | 43 | 0.40 | 63 | 0.32 | 83 | 0.32 |
| 4 | 0.51 | 24 | 0.34 | 44 | 0.44 | 44 | 0.44 | 84 | 0.44 |
| 5 | 0.42 | 25 | 0.32 | 45 | 0.44 | 65 | 0.45 | 85 | 0.45 |
| 6 | 0.56 | 26 | 0.47 | 46 | 0.47 | 66 | 0.51 | 86 | 0.51 |
| 7 | 0.52 | 27 | 0.34 | 47 | 0.50 | 67 | 0.32 | 87 | 0.32 |
| 8 | 0.45 | 28 | 0.40 | 48 | 0.49 | 68 | 0.42 | 88 | 0.42 |
| 9 | 0.56 | 29 | 0.39 | 49 | 0.42 | 69 | 0.52 | 89 | 0.52 |
| 10 | 0.39 | 30 | 0.32 | 50 | 0.23 | 70 | 0.34 | 90 | 0.34 |
| 11 | 0.25 | 31 | 0.47 | 51 | 0.46 | 71 | 0.56 | 91 | 0.56 |
| 12 | 0.39 | 32 | 0.39 | 52 | 0.35 | 72 | 0.45 | 92 | 0.45 |
| 13 | 0.34 | 33 | 0.47 | 53 | 0.34 | 73 | 0.42 | 93 | 0.42 |
| 14 | 0.34 | 34 | 0.56 | 54 | 0.40 | 74 | 0.51 | 94 | 0.51 |
| 15 | 0.52 | 35 | 0.34 | 55 | 0.41 | 75 | 0.39 | 95 | 0.39 |
| 16 | 0.52 | 36 | 0.45 | 56 | 0.25 | 76 | 0.40 | 96 | 0.40 |
| 17 | 0.42 | 37 | 0.39 | 57 | 0.60 | 77 | 0.63 | 97 | 0.63 |
| 18 | 0.42 | 38 | 0.34 | 58 | 0.71 | 78 | 0.42 | 98 | 0.42 |
| 19 | 0.42 | 39 | 0.34 | 59 | 0.47 | 79 | 0.39 | 99 | 0.39 |
| 20 | 0.26 | 40 | 0.38 | 60 | 0.38 | 80 | 0.45 | 100 | 0.45 |
© 2020 by the authors. Licensee MDPI, Basel, Switzerland. This article is an open access article distributed under the terms and conditions of the Creative Commons Attribution (CC BY) license (http://creativecommons.org/licenses/by/4.0/).
Share and Cite
Cui, J.; Niu, Y.; Dang, H.; Feng, K.; Sun, X.; Tan, J. Demodulation Method of F-P Sensor Based on Wavelet Transform and Polarization Low Coherence Interferometry. Sensors 2020, 20, 4249. https://doi.org/10.3390/s20154249
Cui J, Niu Y, Dang H, Feng K, Sun X, Tan J. Demodulation Method of F-P Sensor Based on Wavelet Transform and Polarization Low Coherence Interferometry. Sensors. 2020; 20(15):4249. https://doi.org/10.3390/s20154249
Chicago/Turabian StyleCui, Jiwen, Yizhao Niu, Hong Dang, Kunpeng Feng, Xun Sun, and Jiubin Tan. 2020. "Demodulation Method of F-P Sensor Based on Wavelet Transform and Polarization Low Coherence Interferometry" Sensors 20, no. 15: 4249. https://doi.org/10.3390/s20154249