Letter

Experimental Investigation of the Physical Properties and Microstructure of Slate under Wetting and Drying Cycles Using Micro-CT and Ultrasonic Wave Velocity Tests

1
Three Gorges Research Center for Geo-Hazards of the Ministry of Education, China University of Geosciences, Wuhan 430074, China
2
Faculty of Engineering, China University of Geosciences, Wuhan 430074, China
*
Author to whom correspondence should be addressed.
Sensors 2020, 20(17), 4853; https://doi.org/10.3390/s20174853
Submission received: 28 July 2020 / Revised: 20 August 2020 / Accepted: 25 August 2020 / Published: 27 August 2020
(This article belongs to the Special Issue Tomography Sensors)

Abstract

:
Cyclic wetting and drying processes have been considered as important factors that accelerate the weathering process and have deteriorative effects on rock properties. In the present study, a fully nondestructive and noninvasive testing approach utilizing micro-CT and ultrasonic wave velocity tests was employed to investigate the microstructure of slate under wetting and drying cycles. We studied variations in the physical properties, including the dry weight and the velocities of P- and S-waves versus the number of wetting and drying cycles. The internal microstructural distributions were visualized and quantified by the 3D reconstruction and hybrid image segmentation of CT images. The degree of deterioration caused by wetting and drying cycles was reflected by exponential decreases of physical properties, including dry weight and velocities of the P- and S-waves. Parameters relating to the microfracture diameter, volume, etc. were quantified. The nondestructive and noninvasive testing approach utilizing micro-CT and ultrasonic wave velocity tests has potential for the detection and visualization of the internal microstructure of rock under wetting and drying cycles.

1. Introduction

Understanding and characterizing rock properties is crucial for the safety evaluation of rock slopes and landslides [1]. In practical engineering scenarios, rock slopes and landslides are substantially affected by environmental effects and human activities [2,3], thus accelerating rock weathering processes [4]. Among various environmental effects, the cyclic actions of wetting and drying caused by humidity changes have been considered important factors [2,5]. Cyclic wetting and drying phenomena resulting from seasonal changes in the groundwater level and variability in temperatures and rainfall [6] alter the rock properties, which over the year can eventually result in the movement and failure of rock slopes, as well as landslides [1,4]. Therefore, it is important to investigate the evolution of rock properties during cyclic wetting and drying processes.
Recently, the effects of cyclic wetting and drying processes on properties of various rocks (e.g., sandstone, mudstone, and argillaceous rocks [1,2,4,6,7]) have been well investigated by using various testing methods, such as scanning electron microscopy (SEM) [4,8], uniaxial compression testing [6,9,10], triaxial compression testing [11], creep testing [12], Brazilian tensile testing [13], and wave velocity testing [4]. The evolution characteristics under wetting and drying cycles have been investigated by studying changes in physical and mechanical properties, including the bulk density, porosity, weight loss, water absorption, wave velocity [4], elastic modulus, shear strength [14], tensile strength [15], uniaxial compression strength [10,16,17], and triaxial compression strength.
Although the effects of cyclic wetting and drying processes on rock properties have been intensively studied, these studies have mostly focused on strength, deformability, and failure modes, and limited works have investigated the internal microstructure. The degree of deterioration under wetting and drying cycles is not clearly understood. Moreover, most of the utilized testing methods are destructive.
The X-ray computed tomography (CT) technique was first developed in 1973 by Godfrey Hounsfield [18], who was later awarded the Nobel Prize in 1979. CT is a nondestructive and noninvasive technique that provides quantitative detection of an object’s interior structure based on the attenuation coefficient of the X-ray electromagnetic wave. It has been widely applied in various fields, such as medical tests [19], safety inspections, and material porosity detection [20,21]. Micro-CT, also called microtomography or microcomputed tomography [22], is a specialized type of CT on a small scale, with a greatly increased resolution ranging from (sub)micrometers to millimeters [23]. It has been extensively used for the quantitative investigation of the interior 3D microstructure of different rocks, including granites, sandstones, schists, metamorphic rocks, carbonate rocks, and shale [22,24,25,26,27,28,29,30,31,32,33,34,35]. However, studies are still insufficient in terms of investigating the interior microstructure of rock under wetting and drying cycles.
Slate is a typical metamorphic rock that is strongly characterized by foliation planes with weaker strength, and is widely distributed in the Qinling Mountain area in northwest China. It is frequently encountered in various engineering applications, such as dam foundation, tunneling, slope engineering, and hydrogeology [36,37,38]. Due to highly seasonal rainfall, the rock properties are substantially affected by wetting and drying cycles. It is expected that the effects of cyclic wetting and drying processes on slate characteristics are not comparable between sandstone, mudstone, and argillaceous rocks [38]. It is highly desirable to investigate the properties of slate under wetting and drying cycles.
The main objective of the present study was to investigate the deteriorative effects of wetting and drying cycles on the physical properties and internal microstructure of slate. A nondestructive and noninvasive approach utilizing micro-CT and ultrasonic wave velocity tests was employed. The physical properties of slate subjected to different wetting and drying cycles were tested. The evolution characteristics of the physical properties under wetting and drying cycles were investigated. The internal microstructural distributions were visualized and quantified by a 3D reconstruction and hybrid image segmentation approach.

2. Materials and Methods

2.1. Micro-CT Test System

In the present study, a Phoenix V|tome|x S micro-CT system (GE Sensing & Inspection Technologies, Cincinnati, OH, USA) was employed for rock specimen scanning. This system is composed of an X-ray generator, a detector, a translation system, and a computer system for motion control and data acquisition. The samples used for scanning attenuate the passage of X-ray radiation as a function of the material composition, density, and thickness along the beam direction [22]. The Phoenix V|tome|x S micro-CT system is equipped with a 240 kV/320 W microfocus X-ray tube. More features of the Phoenix V|tome|x S micro-CT system are listed in Table 1.

2.2. Ultrasonic Wave Velocity Test

Ultrasonic wave velocity tests are a nondestructive technique for the measurement of the velocities of P- and S-waves. The velocities of P- and S-waves traveling in a rock sample are highly related to the density and elastic properties of the rock. Therefore, the ultrasonic wave velocity test has been widely used for rock property testing, and the velocities of P- and S-waves have been widely used as the most important indices of rock properties [39].
In the present study, a SonicViewer-SX (model-5251C) with a 200 kHz P-wave transducer and 100 kHz S-wave transducer (OYO Corporation, Japan) was employed for the ultrasonic wave velocity test. More features of the SonicViewer-SX (model-5251C) are listed in Table 1.

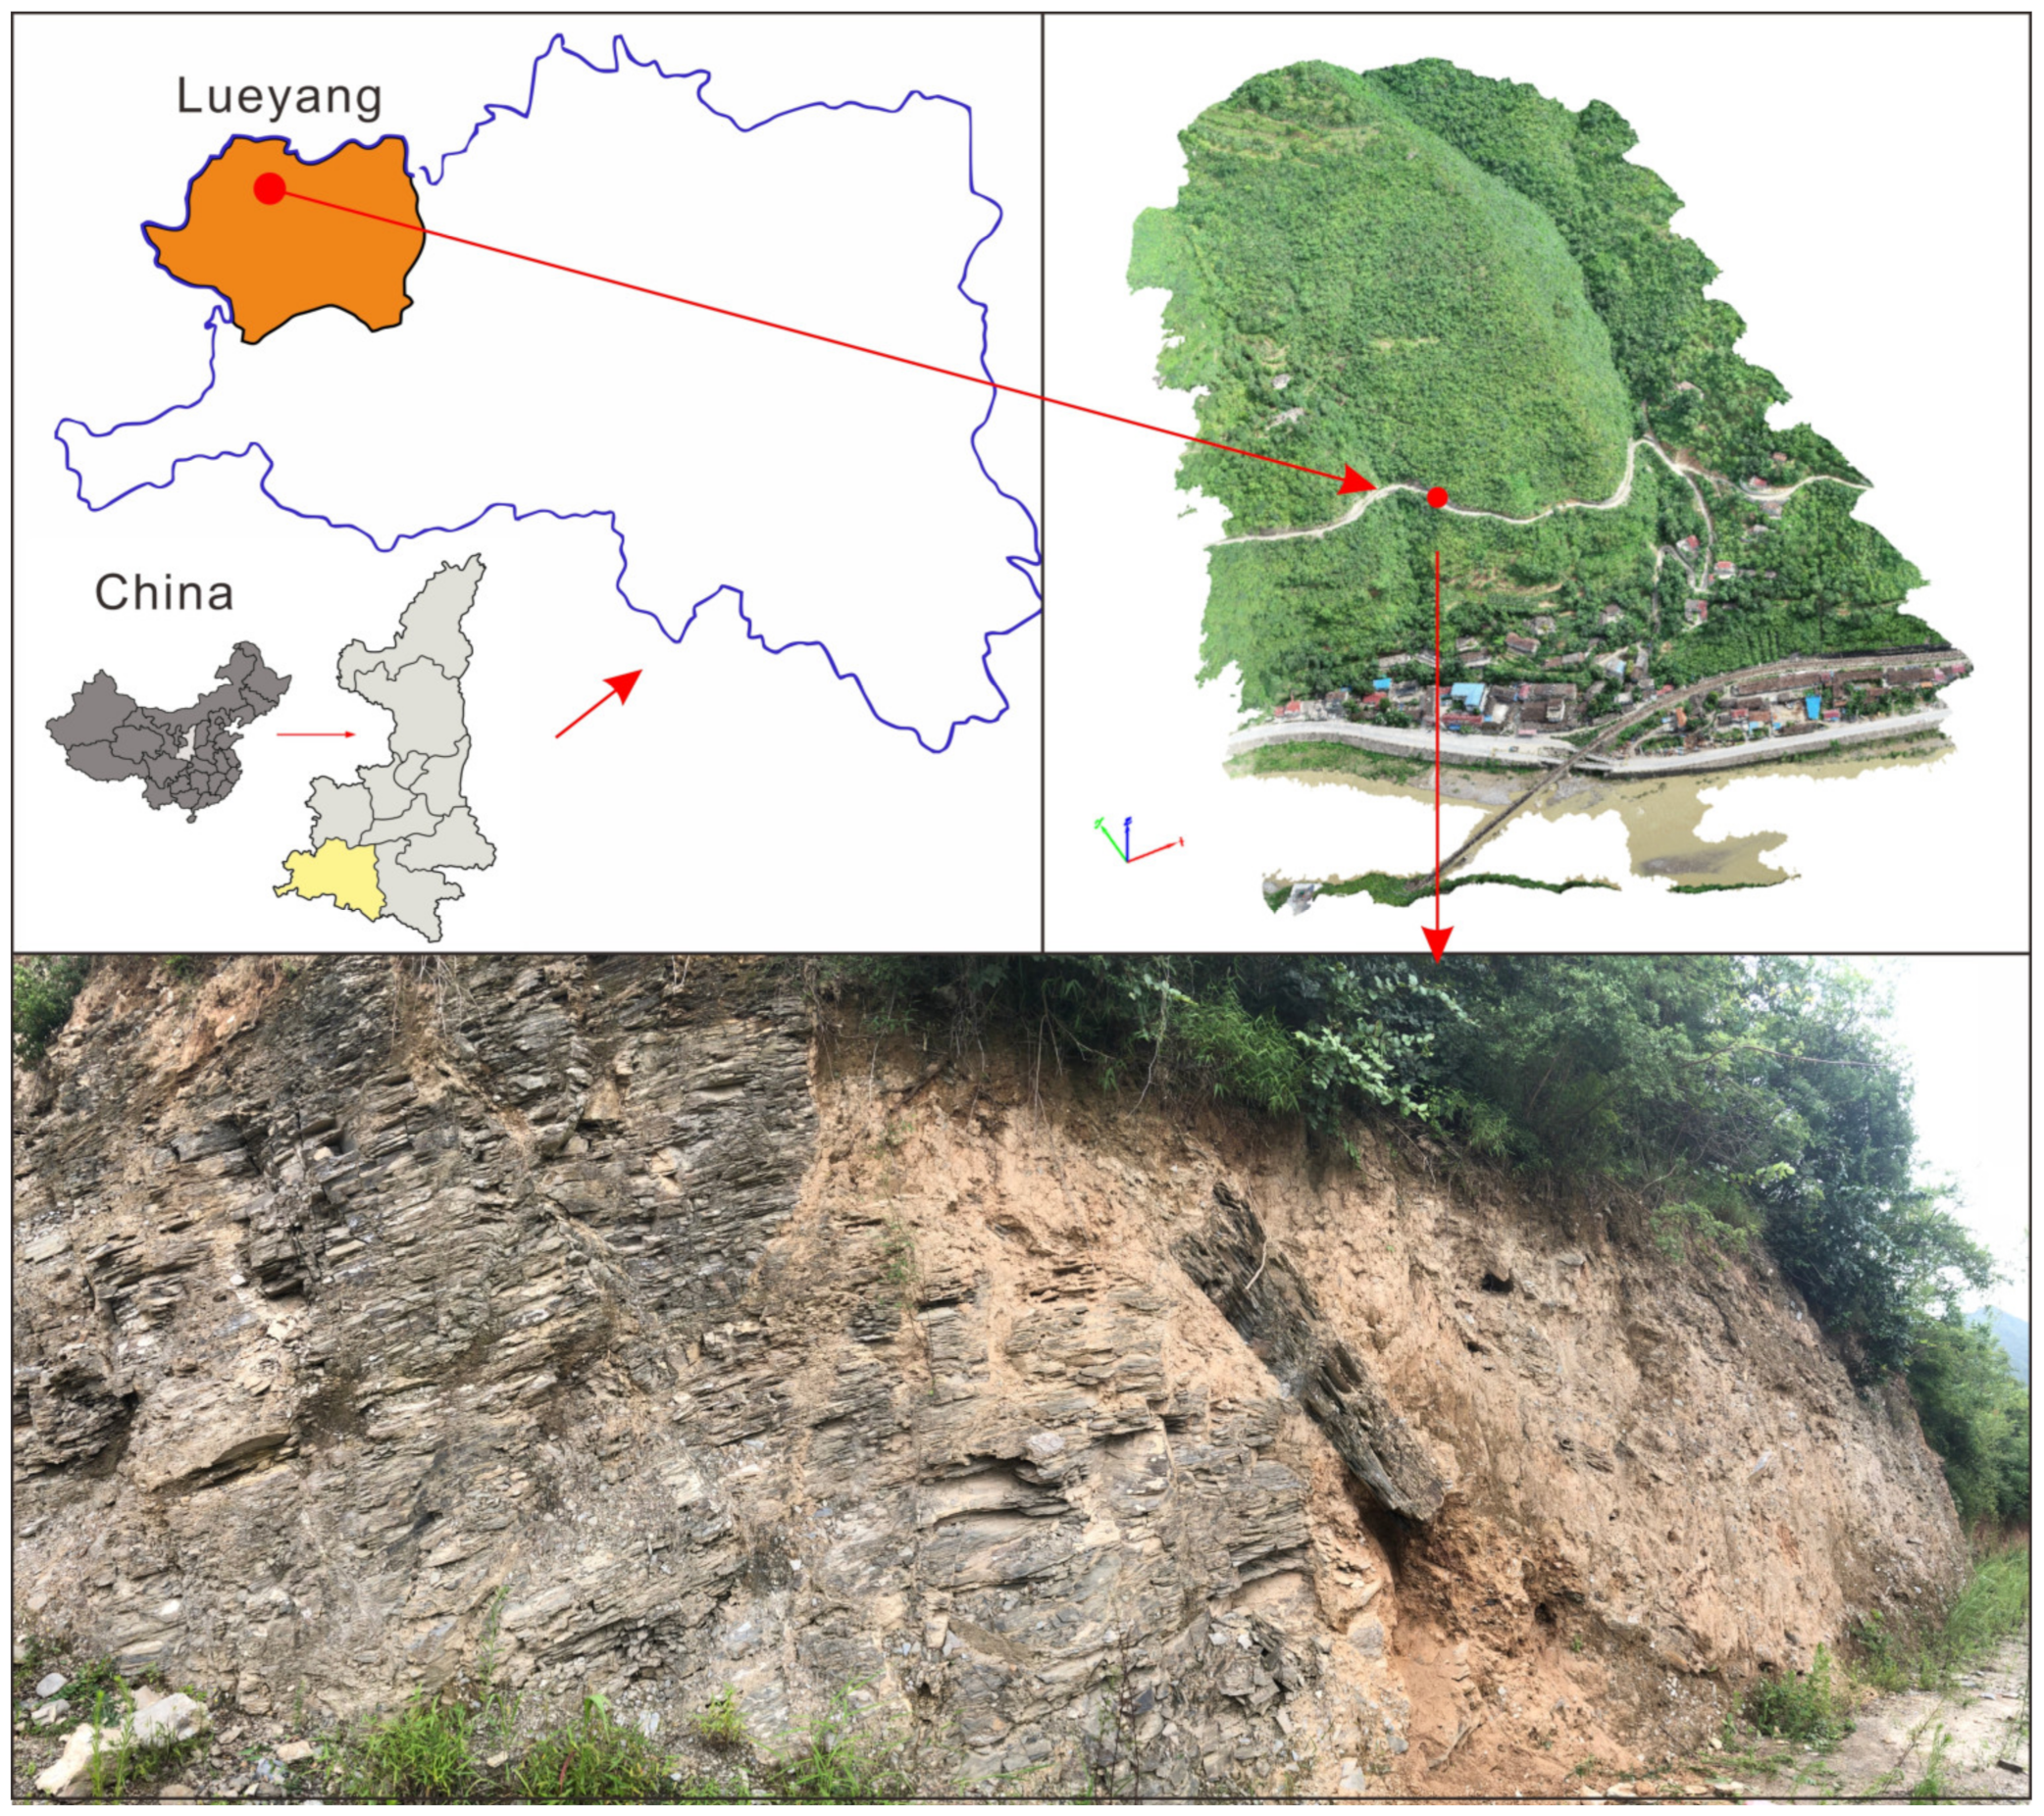
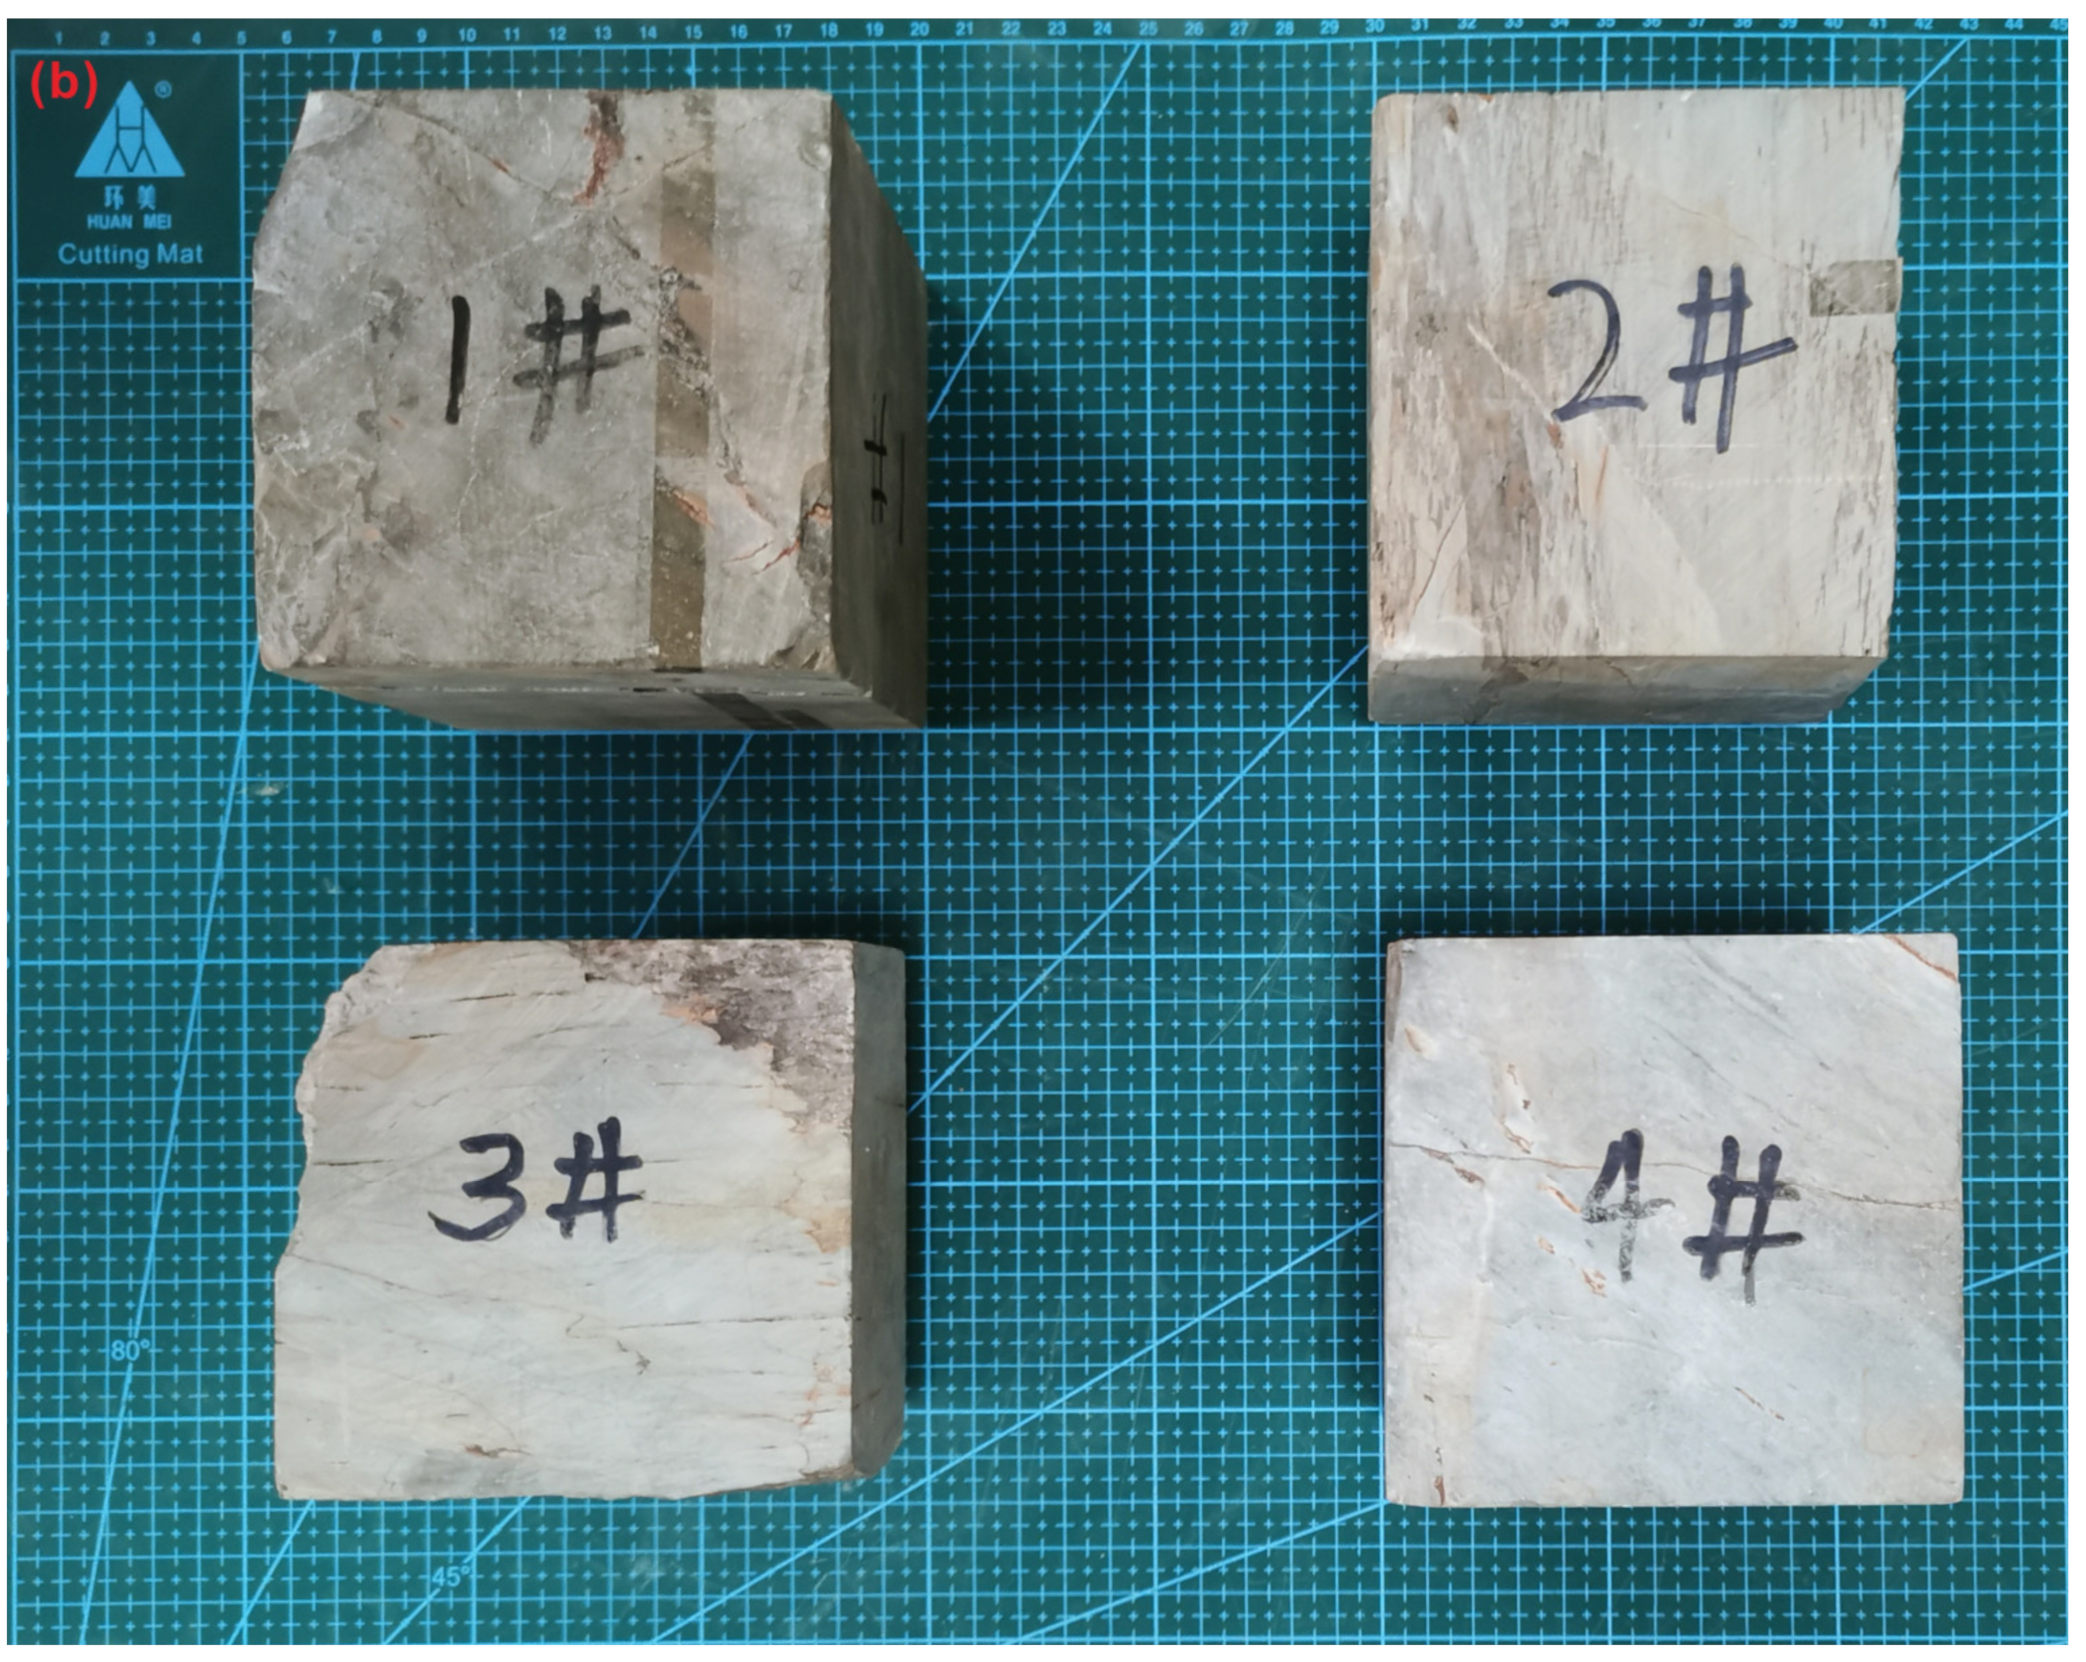
2.3. Preparation of the Rock Specimens and Experimental Procedure

The intact slate samples used for the wetting and drying experiments were collected from Lueyang County, Qinling Mountain area in Shaanxi Province, China (latitude and longitude coordinates: E 106°4′1.66″, N 33°34′39.8″, Figure 1). The slate is composed of minerals including quartz, muscovite, albite, chlorite, and illite. The average dry density and moisture contents are 2.45 g/cm3 and 2.83%, respectively. The raw slate samples were cut in the form of cubes with dimensions of 100 mm × 100 mm × 100 mm. Four intact specimens were chosen to investigate the microstructure under wetting and drying cycles. The wetting and drying treatment mainly consisted of two processes: saturation (from a dry state to a saturated state) and drying (from a saturated state to a dry state). In each saturation process, the specimens were submerged into distilled water for saturation for 24 h in a vacuum saturation apparatus. In each drying process, the saturated specimens were placed in an electro-thermostatic blast oven at 110 °C for 12 h and dried to a constant weight at 20 °C for 12 h (schematically illustrated in Figure 2a). In the present study, intact slate specimens without cyclic wetting and drying treatments were considered to undergo 0 wetting and drying cycles (n = 0). Six cycles of wetting and drying treatment (n = 6) were performed for each specimen. Figure 2b shows the rock samples after six cycles of wetting and drying treatments. The physical properties, including the dry weight and wave velocity, under each wetting and drying cycle (from 0 to 6) were tested (schematically illustrated in Figure 2a). After six cycles of the wetting and drying treatment, micro-CT scans were performed (schematically illustrated in Figure 2a) at the Faculty of Engineering, China University of Geosciences. The voltage and current of the X-ray tube for micro-CT scanning were set to 200 kV and 190 μA, respectively. A total of 1800 two-dimensional projection images with 2000 × 2000 pixels were obtained for each slate specimen. After scanning and reorientation of the samples, images with a voxel size of 80 μm × 80 μm × 80 μm were produced. More details of the parameter values of the micro-CT scanning configuration are listed in Table 2.

2.4. CT Image Processing

In the present study, raw projection images were processed by 3D reconstruction and hybrid image segmentation (schematically illustrated in Figure 3) in order to quantitatively analyze the internal microstructure. The 3D reconstruction of raw projection images and quantitative analysis were performed with the GE phoenix datos|x 2.5.2 software (GE Sensing and Inspection Technologies, Wunstorf, Germany) and VGSTUDIO MAX 3.3.0, respectively (Volume Graphics GmbH, Heidelberg, Germany). This process was based on practical experiences in the literature [40,41,42,43,44]. Thresholds for the segmentation were carefully set by observation of the grayscale histogram distribution of microstructure and rock fragments. After 3D rendering, a region of interest (ROI) was selected by the particle analysis tool in VGSTUDIO MAX for estimation of the microstructure. Characteristics including the diameter, volume, and area were obtained. Moreover, the microstructures were segmented through hybrid image segmentation following the processes of image resizing, Gaussian filtering, median and minimum filtering for background subtraction, building ROI using morphological processing of opening and closing operations, image binarization using Otsu thresholding, image segmentation using region growing method, merging similar regions by comparison of distance and grayscale, and removing small and nonlinearity region (Figure 3). The parameter settings for segmentation of the microstructure are listed in Table 3.

3. Results

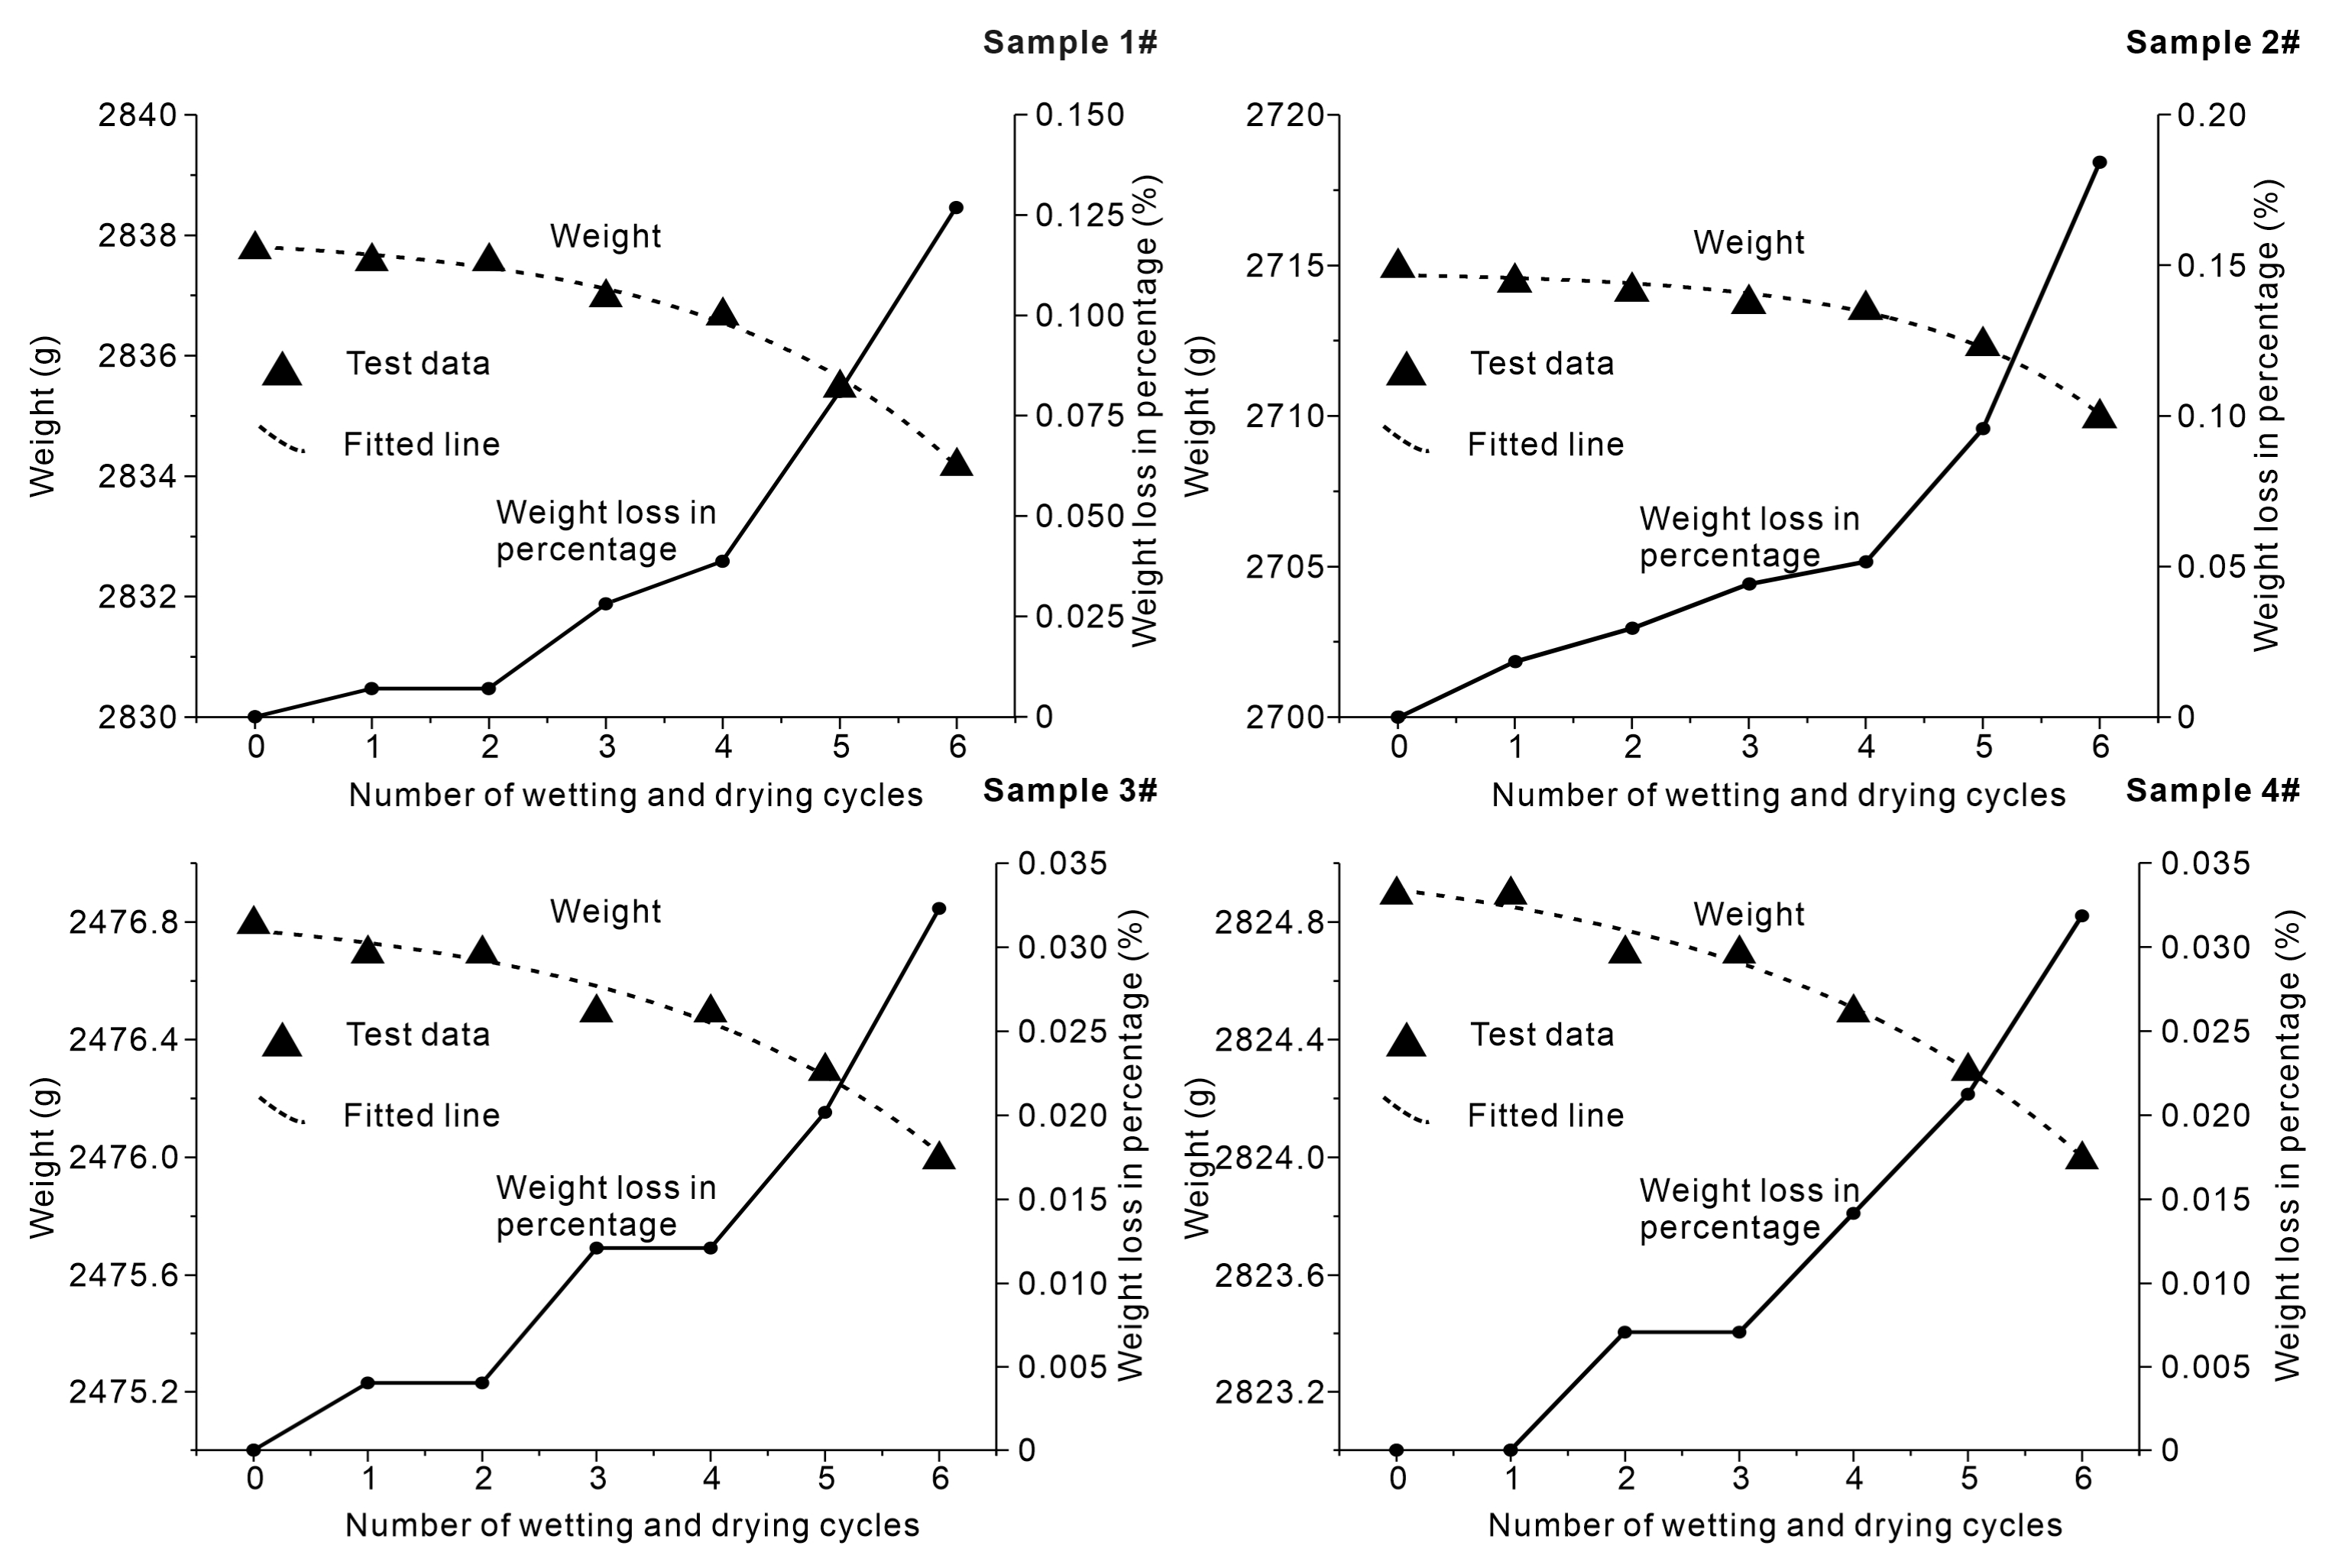
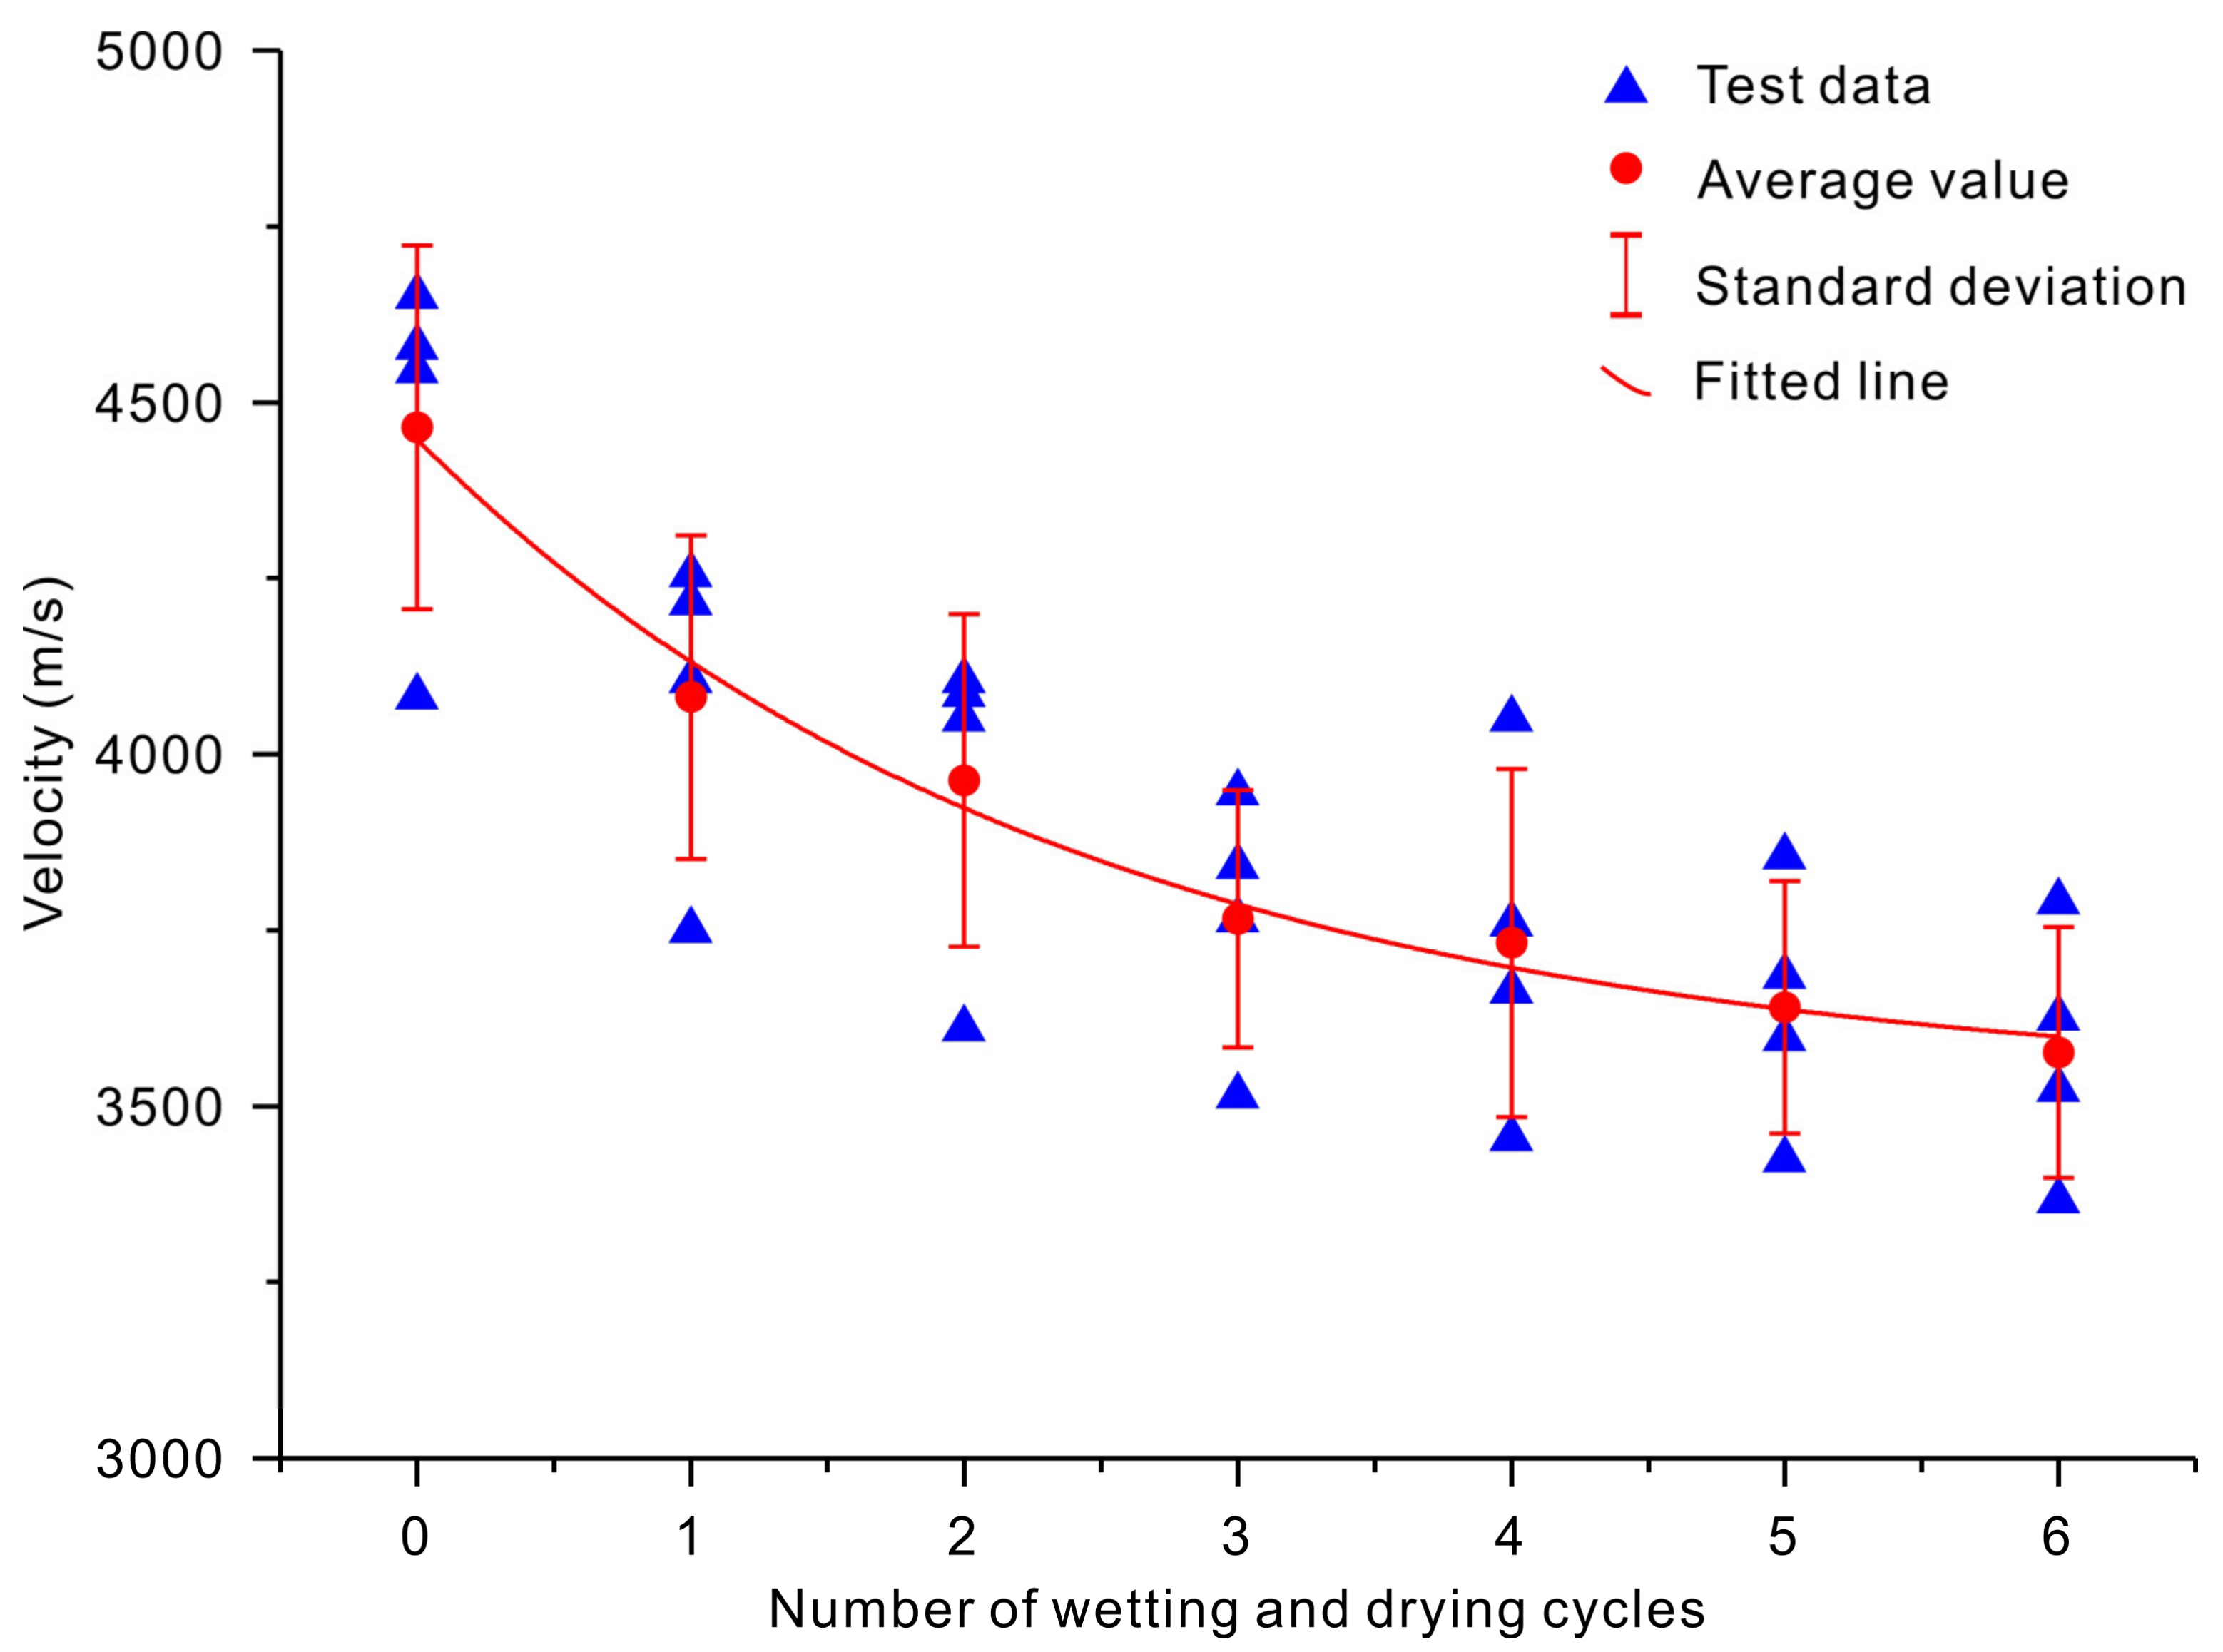
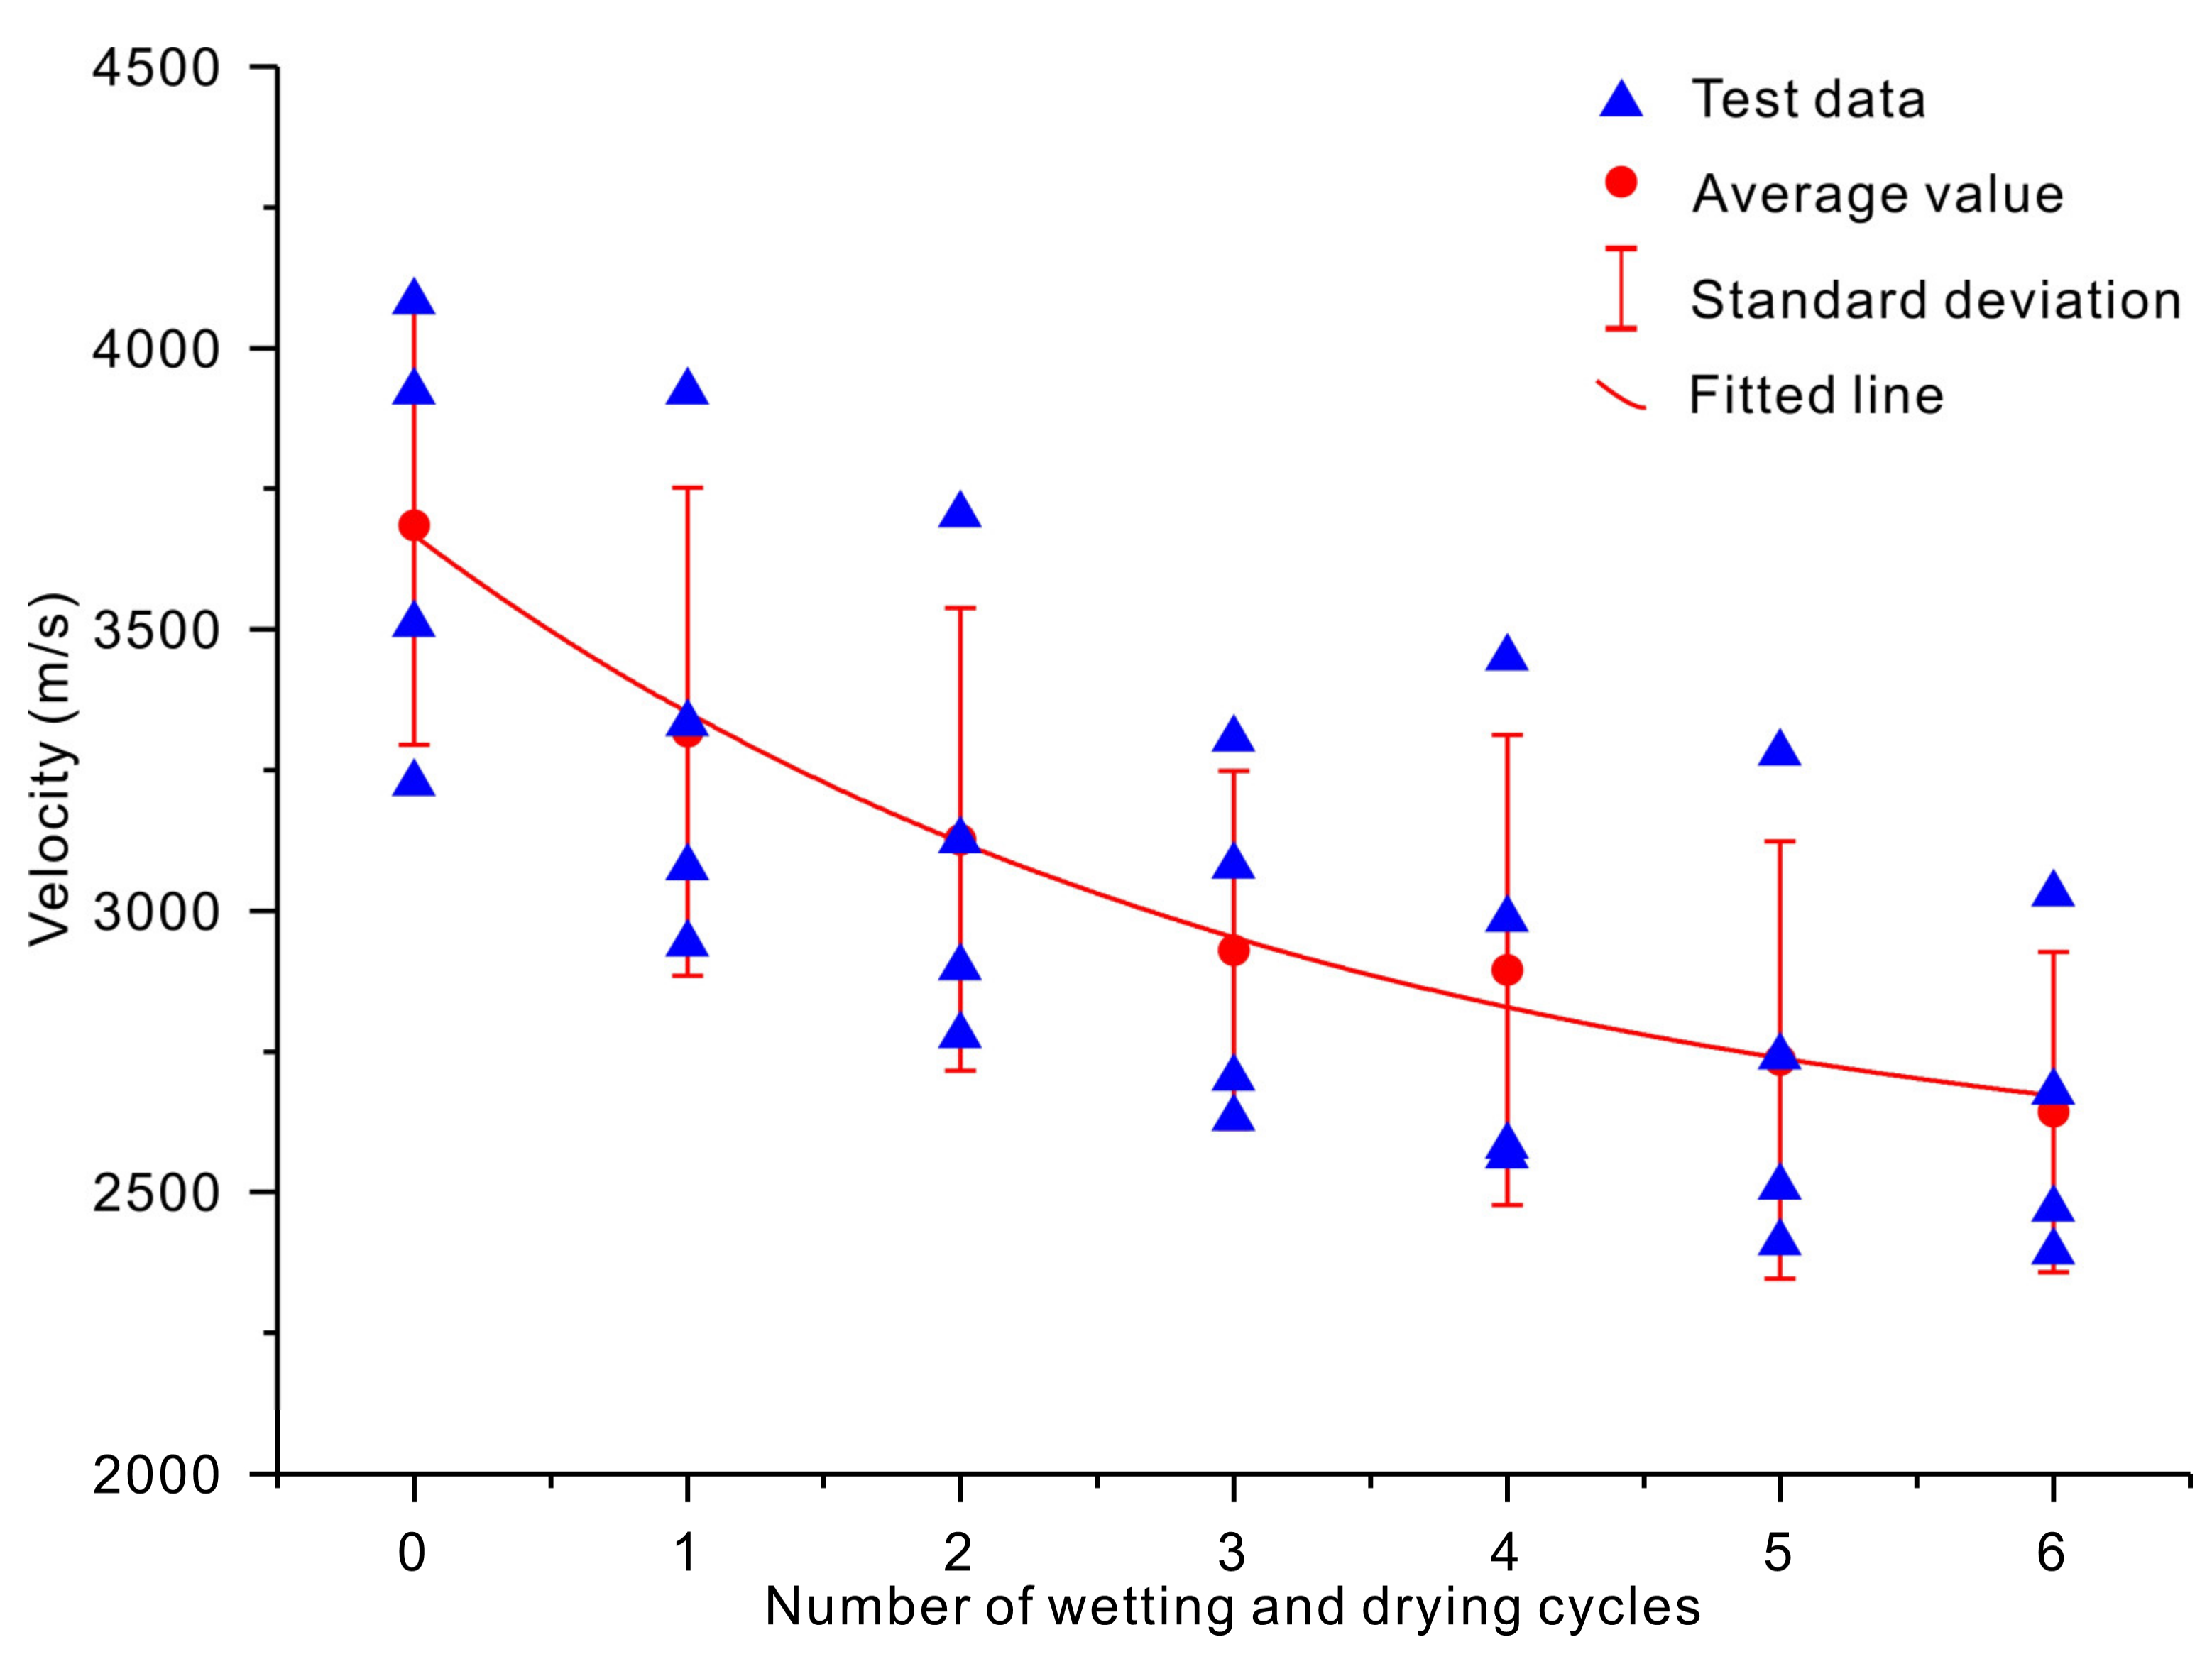
3.1. Physical Properties Subjected to Different Wetting and Drying Cycles

The dry weight of slate specimens under wetting and drying cycles is shown in Figure 4. The dry weight of slate specimens decreased with the increase in the number of wetting and drying cycles. After six cycles of wetting and drying treatments (n = 6), the sample dry weight was reduced by 3.6, 5, 0.8, and 0.9 g for the four samples. The widely used empirical exponential equation for describing rock characterization and damage [4,45,46,47] was chosen for experimental data fitting. The results show that the relationship between sample weight and the number of wetting and drying cycles could be described satisfactorily by an exponential equation. The best-fit lines are shown in Figure 4. The obtained equations are listed in Table 4. The obtained results show that the exponential equations were equally effective, with coefficients of determination of 0.99, 0.98, 0.97, and 0.98 for the four samples.
Figure 5 and Figure 6 show the variations in the velocities of P- and S-waves versus the number of wetting and drying cycles, respectively. Both the P- and S-wave velocities decreased with an increase in the number of wetting and drying cycles (Figure 5 and Figure 6). The initial (n = 0) P-wave velocities of the slate specimens were 4545, 4082, 4651, and 4578 m/s for the four samples. The initial (n = 0) S-wave velocities of the slate specimens were 3509, 3226, 4082, and 3922 m/s. After being subjected to six cycles of wetting and drying treatment (n = 6), the P-wave velocities were reduced by 20.24%, 17.56%, 18.51%, and 23.02%, respectively (Figure 5). The S-wave velocities were reduced by 29.61%, 25.79%, 25.77%, and 31.72%, respectively (Figure 6). Empirical exponential equations were applied to describe the relationship between the velocities of P- and S-waves and the number of wetting and drying cycles. The best-fit lines and obtained exponential equations are shown in Figure 5 and Figure 6 and listed in Table 4. The obtained results show that exponential regression satisfactorily presented the relationship between the velocities of P- and S-waves and the number of wetting and drying cycles, with coefficients of determination of 0.99 and 0.99, respectively.
Based on previous studies [8,48], we speculate that the decreasing trends for velocities of P- and S-waves could be explained by the increase in porosity and the degradation of rock materials caused by the combined effects of physical and chemical damage [1,49,50]. First, internal water within rock specimens has combined effects, including dissolution, erosion, and softening effects on rock minerals. Under these combined effects, the cementation between mineral grains deteriorates and does not recover, even though the saturated rock specimen is dried. Thus, the velocities of P- and S-waves are characteristic of an attenuation trend. Second, the water absorption and desorption of swelling clay minerals (e.g., smectite, illite, and kaolinite) within rock specimens would cause the loading and unloading of tensile stresses, accelerating the growth and propagation of internal microcracks. Therefore, with the increase in the number of wetting and drying cycles, the number of internal microfractures within the rock specimen increase. The increase in microfractures has a deteriorative effect on rock properties such as wave velocities mechanical properties.

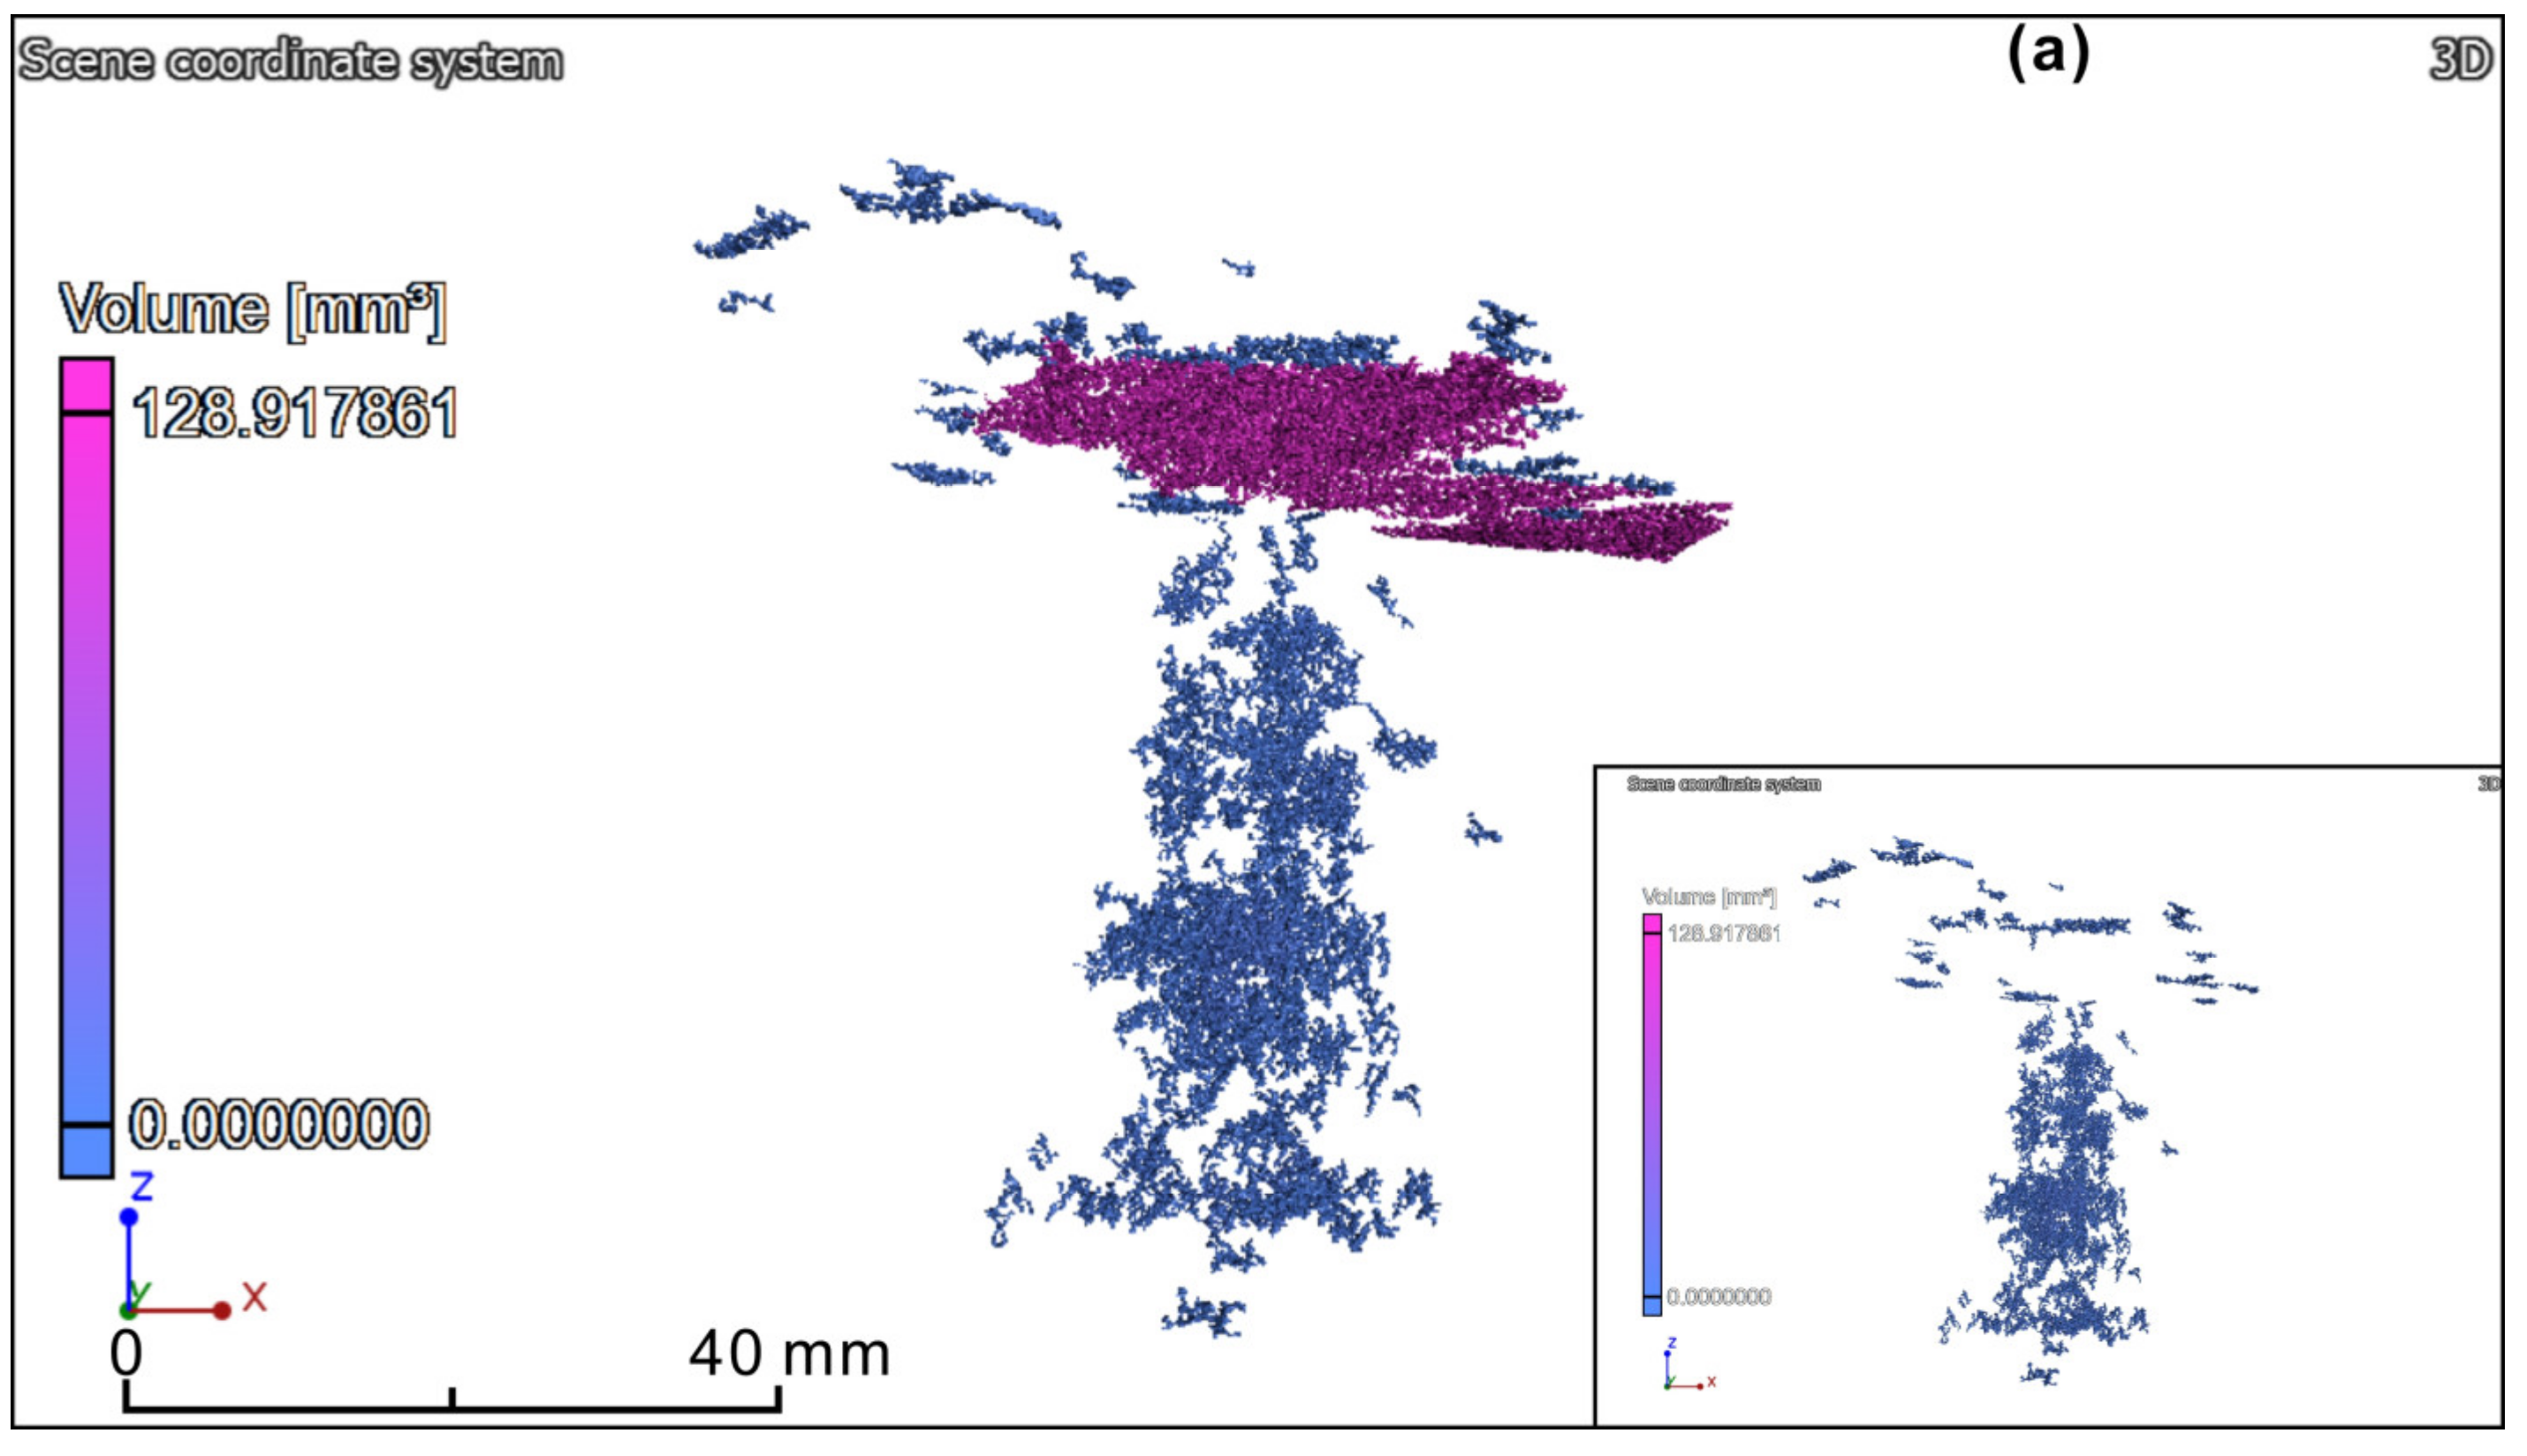
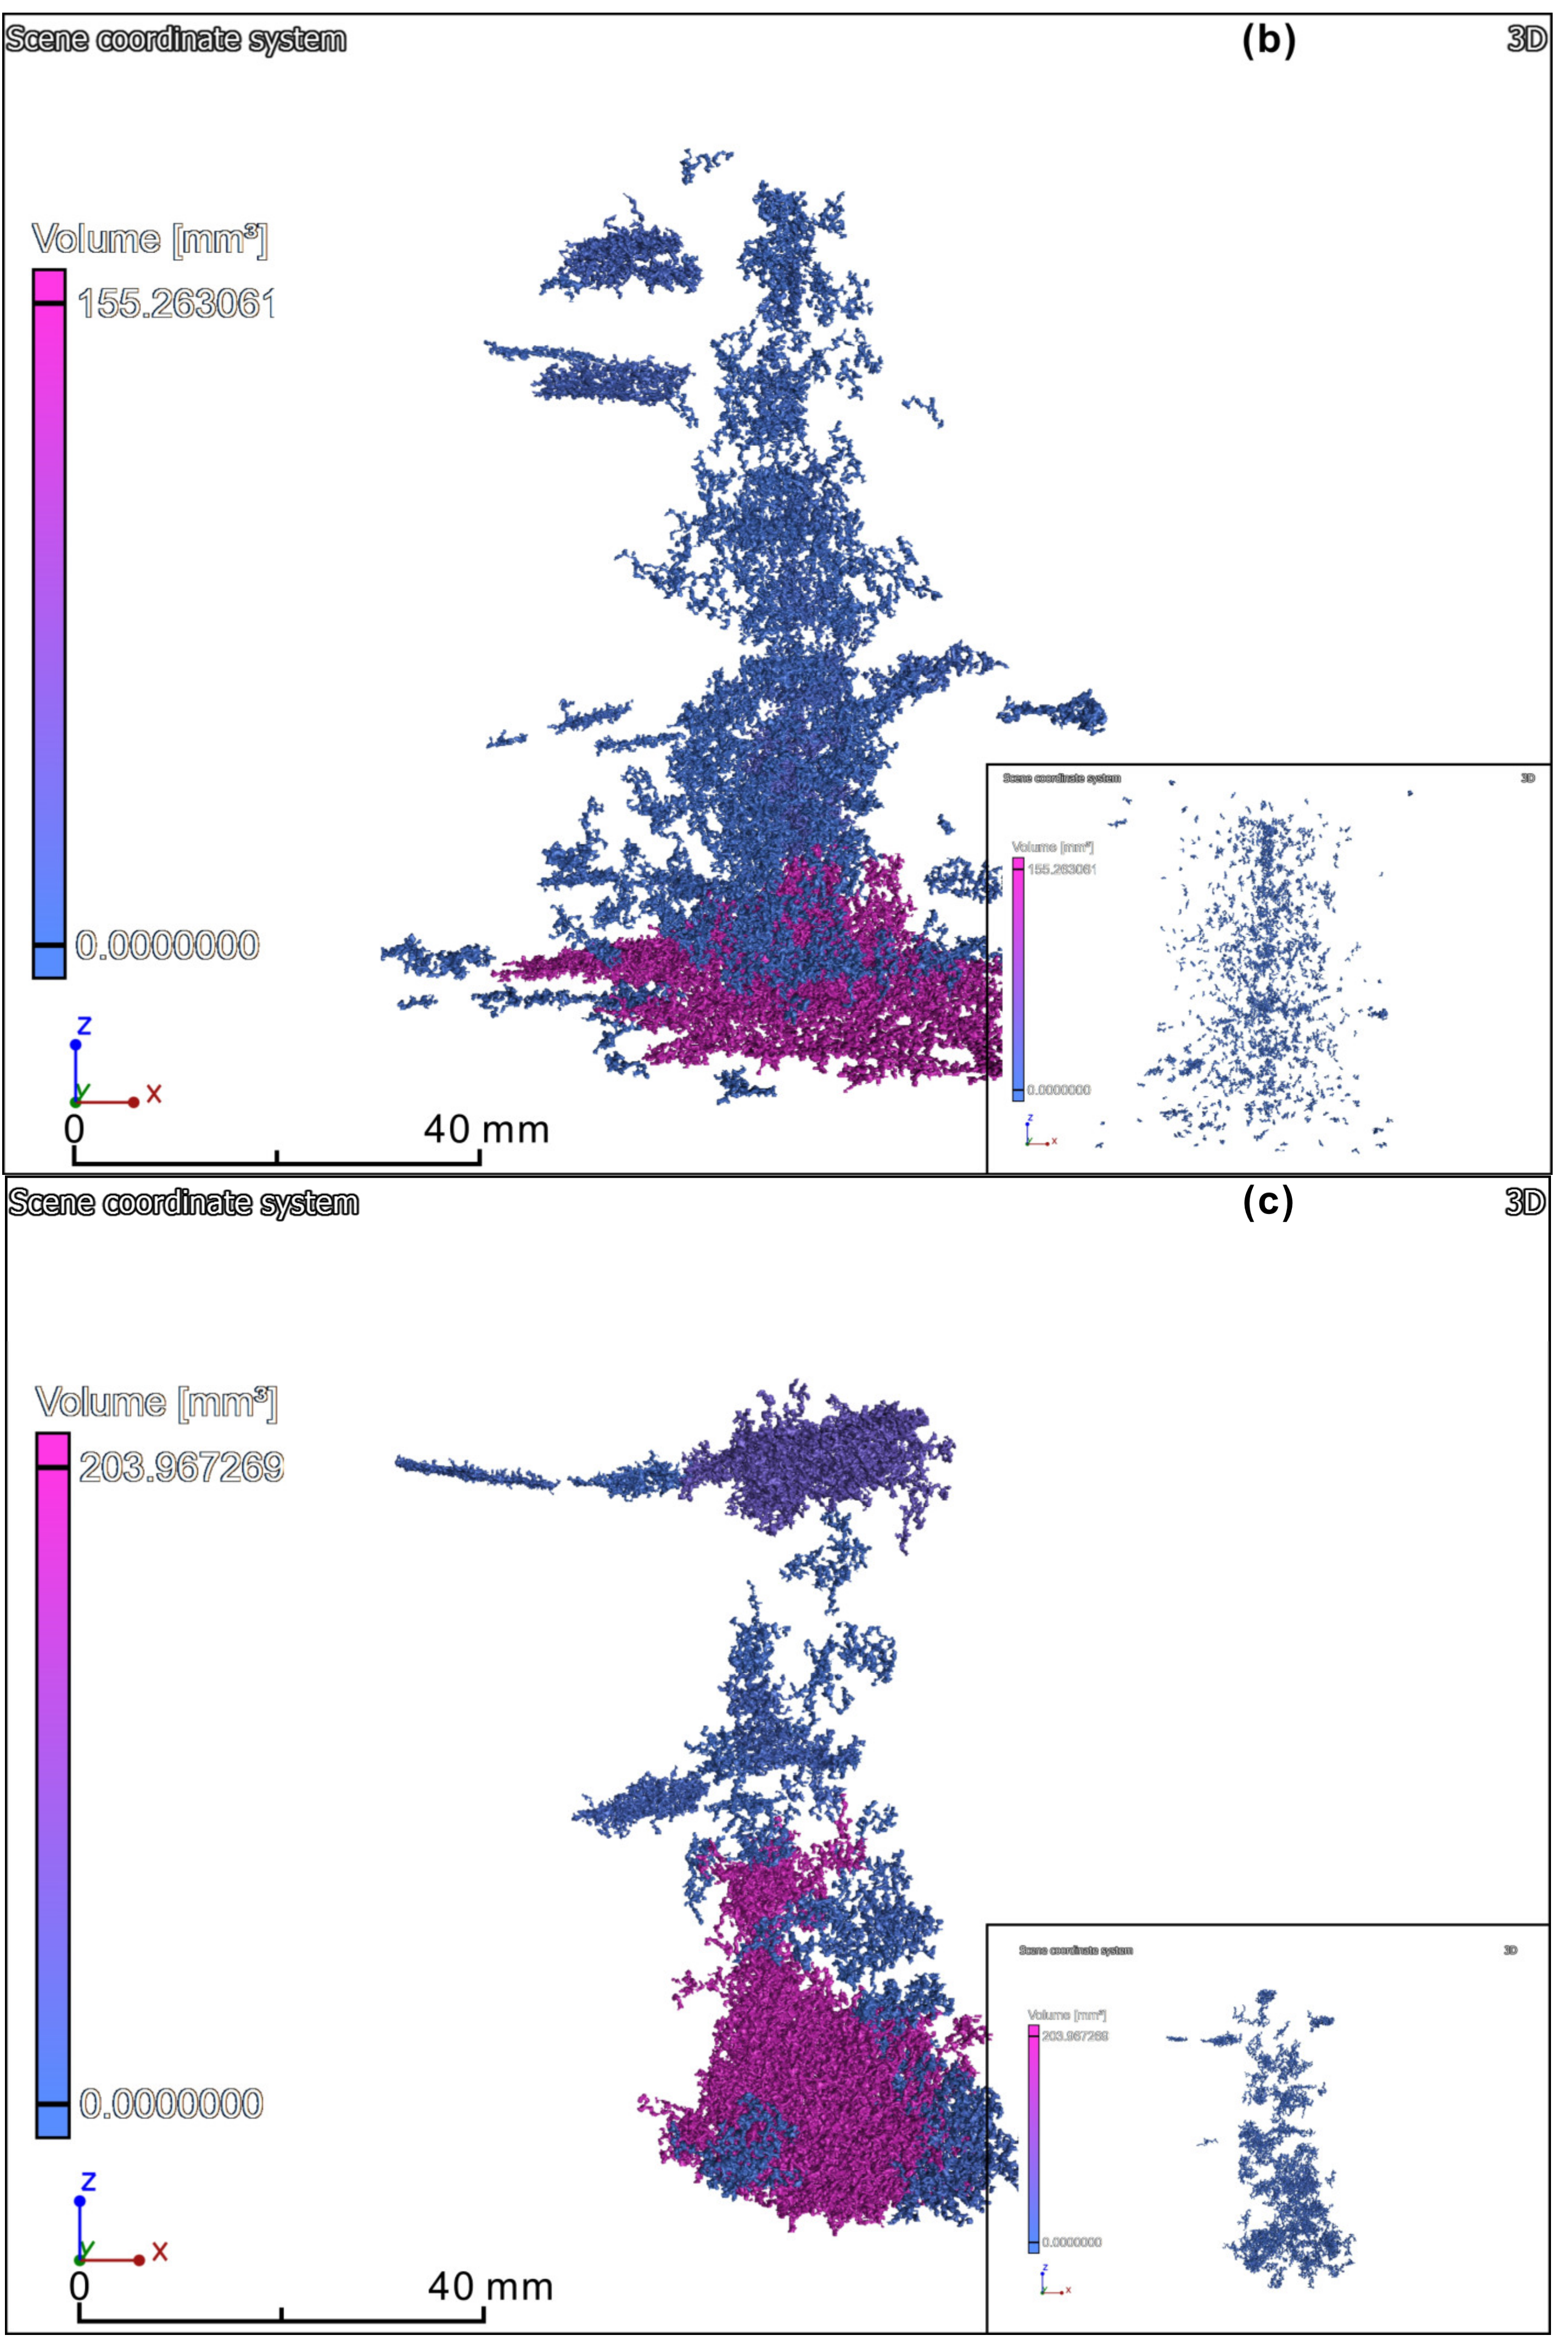
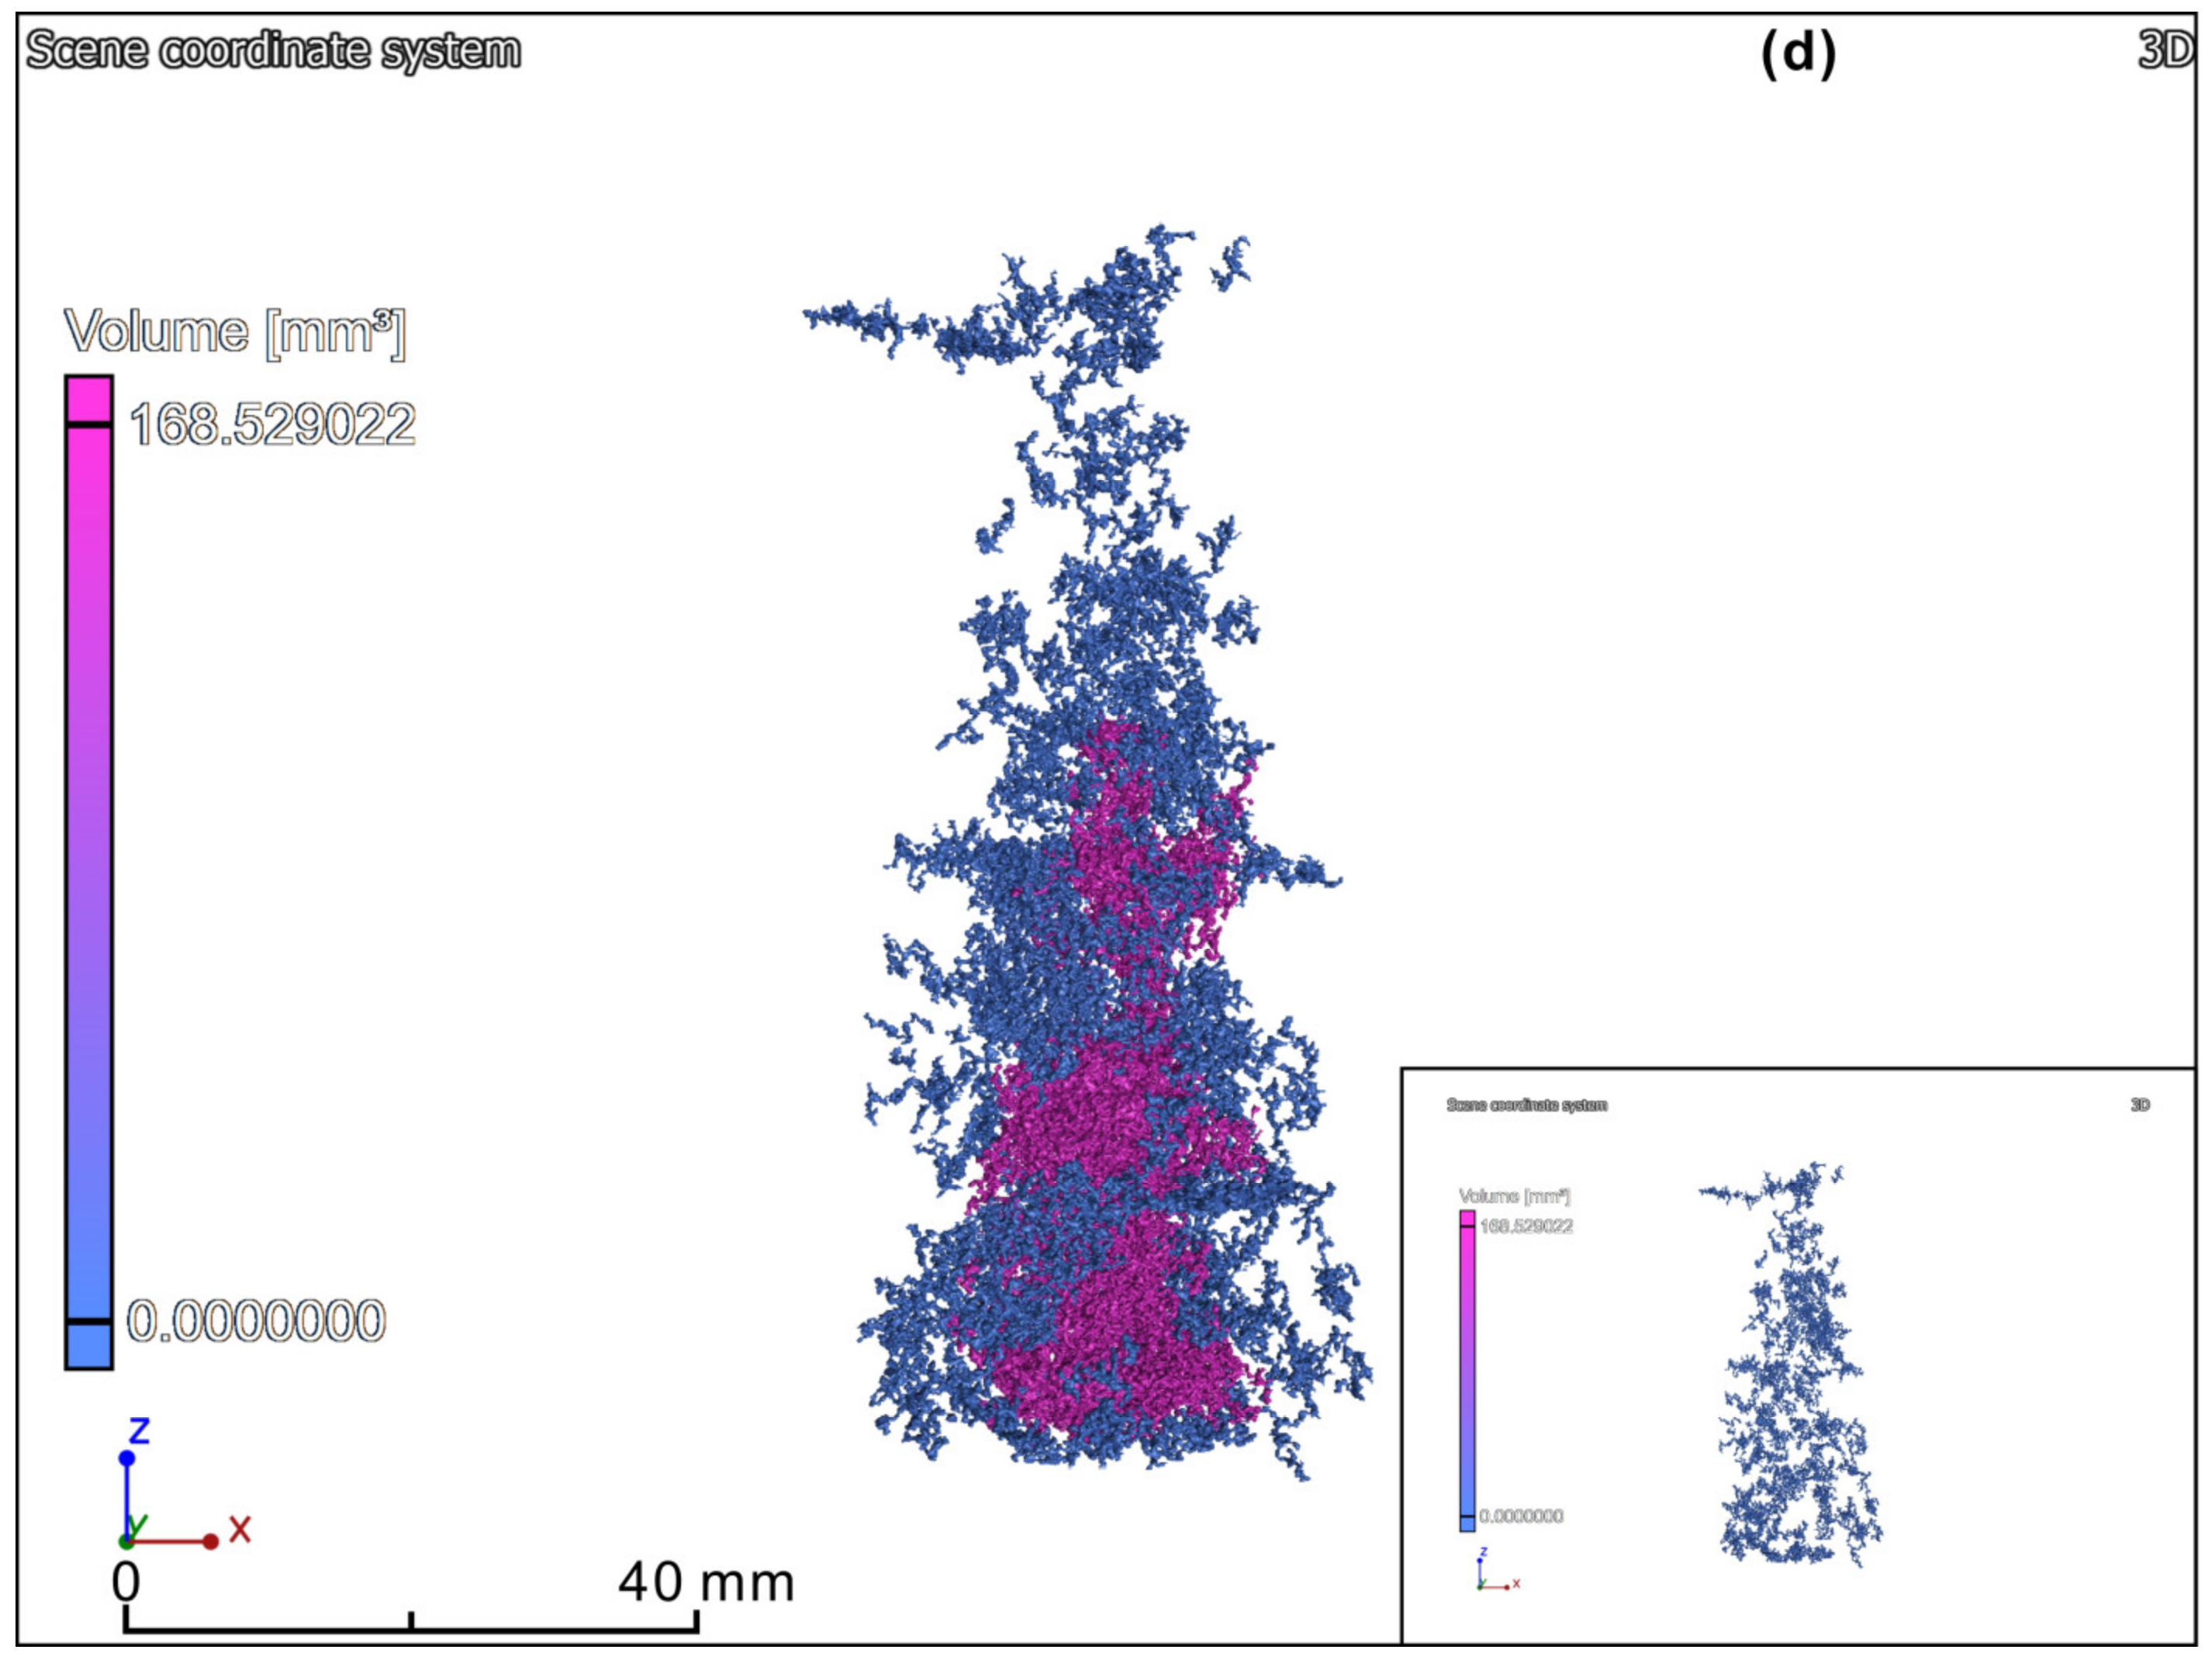
3.2. Visualization of Microfracture Clusters

The 3D distributions of microfractures within the specimens before and after wetting and drying treatments were reconstructed and visualized using gradient colormaps, which facilitate visualization of the complexity and interconnectivity of the microfracture clusters. As shown in Figure 7, before wetting and drying treatments, the microfractures within the specimens were not well developed, and only poorly connected microfractures could be observed. The defect microfracture volumes were 276.84, 427.82, 369.79, and 351.62 mm3, respectively (Table 5). The defect volume ratios were 0.12%, 0.09%, 0.12%, and 0.09%, respectively (Table 5).
A comparison of the images before wetting and drying treatments shows clearly that the latter contained more microfractures than the former. After subjected to six cycles of wetting and drying treatment (n = 6), the microfracture volumes and maximum pore equivalent diameter were significantly increased. The defect volume ratios significantly reached 0.22%, 0.34%, 0.30%, and 0.28% in the four samples. For example, one set of partially connected microfractures developed in the x–y plane within sample 1; the maximum pore equivalent diameter was 49.55 mm. The microfractures were mainly distributed in the x–y plane and oriented perpendicular to the direction of foliation planes. This can be explained as follows: due to the processes of metamorphism under high temperature and high pressure, slate is strongly characterized by foliation planes with weaker strength. The foliation planes are more prone to wetting and drying treatments. Therefore, the microfractures were mainly generated in the preferred direction along the foliation planes. This finding is consistent with previous observations from scanning electron microscopy images [33,51], which revealed that microcracks were generally controlled by the bulk rock mineral geometry.
To better visualize the interconnectivity of the microfractures after six wetting and drying cycles, fractures were segmented from the original CT image for sample 1. The result of the fracture segmentation is shown in Figure 8. The experimental results demonstrate that the proposed approach can segment the microfracture effectively. As shown, a partially connected microfracture was formed throughout sample 1. The connectivity length was at the centimeter scale.

4. Conclusions

This study, to the best of our knowledge, is the first attempt to investigate the physical properties and microstructure of slate under wetting and drying cycles using a fully nondestructive and noninvasive approach utilizing micro-CT and ultrasonic wave velocity tests. The following conclusions can be drawn:
Decreases of physical properties reflected the degree of deterioration. The experimental results show that with an increasing number of cycles, the specimen dry weight and velocities of the P- and S-waves decreased. Empirical exponential equations could satisfactorily represent those relationships, with coefficients of determination close to one.
3D reconstruction and the hybrid image segmentation approach provide a visual representation and quantitative analysis of the macropore distribution. Parameters relating to the microfracture diameter, volume, etc. were quantified.
Given the successful use of micro-CT and ultrasonic wave velocity tests, this nondestructive and noninvasive testing approach may be a promising method for detecting and visualizing the internal microstructure of rock samples under wetting and drying cycles.

Author Contributions

This work was carried out as a collaboration among all the authors. C.X., J.M., S.L., and H.T. acquired the funding and conceived and designed the experiment. S.L., X.N., D.X., and B.Z. performed the tests and analyzed the data. J.M. wrote the original draft and reviewed and edited the draft of the manuscript. All authors have read and agreed to the published version of the manuscript.

Funding

This research was funded by the National Key R&D Program of China (Grant No. 2017YFC1501305), the National Natural Science Foundation of China (Grant Nos. 41702328 and 41931295), the Hubei Provincial Natural Science Foundation of China (Grant No. 2019CFB585), and Science and technology projects of the Huaneng Lancang River Hydropower Co., Ltd. (Grant No. HNKJ18-H24). All support is gratefully acknowledged.

Acknowledgments

The authors would like to thank the editors and the anonymous reviewers for their helpful and constructive comments. All funding and grant support received is gratefully acknowledged.

Conflicts of Interest

The authors declare that there are no conflicts of interest.

References

  1. Hua, W.; Dong, S.; Li, Y.; Wang, Q. Effect of cyclic wetting and drying on the pure mode II fracture toughness of sandstone. Eng. Fract. Mech. 2016, 153, 143–150. [Google Scholar] [CrossRef]
  2. Wang, L.L.; Bornert, M.; Héripré, E.; Yang, D.S.; Chanchole, S. Irreversible deformation and damage in argillaceous rocks induced by wetting/drying. J. Appl. Geophys. 2014, 107, 108–118. [Google Scholar] [CrossRef]
  3. Ma, J.W.; Tang, H.M.; Hu, X.L.; Bobet, A.; Zhang, M.; Zhu, T.W.; Song, Y.J.; Ez Eldin, M.A.M. Identification of causal factors for the Majiagou landslide using modern data mining methods. Landslides 2017, 14, 311–322. [Google Scholar] [CrossRef]
  4. Zhou, Z.; Cai, X.; Chen, L.; Cao, W.; Zhao, Y.; Xiong, C. Influence of cyclic wetting and drying on physical and dynamic compressive properties of sandstone. Eng. Geol. 2017, 220, 1–12. [Google Scholar] [CrossRef]
  5. Tang, H.; Wasowski, J.; Juang, C.H. Geohazards in the three Gorges Reservoir Area, China—Lessons learned from decades of research. Eng. Geol. 2019, 261, 105267. [Google Scholar] [CrossRef]
  6. Huang, S.; Wang, J.; Qiu, Z.; Kang, K. Effects of Cyclic Wetting-Drying Conditions on Elastic Modulus and Compressive Strength of Sandstone and Mudstone. Processes 2018, 6, 234. [Google Scholar] [CrossRef] [Green Version]
  7. Sumner, P.D.; Loubser, M.J. Experimental sandstone weathering using different wetting and drying moisture amplitudes. Earth Surf. Proc. Land 2008, 33, 985–990. [Google Scholar] [CrossRef]
  8. Kassab, M.A.; Weller, A. Study on P-wave and S-wave velocity in dry and wet sandstones of Tushka region, Egypt. Egypt. J. Pet. 2015, 24, 1–11. [Google Scholar] [CrossRef] [Green Version]
  9. Lin, M.L.; Jeng, F.S.; Tsai, L.S.; Huang, T.H. Wetting weakening of tertiary sandstones—microscopic mechanism. Environ. Geol. 2005, 48, 265–275. [Google Scholar] [CrossRef]
  10. Khanlari, G.; Abdilor, Y. Influence of wet–dry, freeze–thaw, and heat–cool cycles on the physical and mechanical properties of Upper Red sandstones in central Iran. Bull. Eng. Geol. Environ. 2015, 74, 1287–1300. [Google Scholar] [CrossRef]
  11. Yao, H.Y.; Zhang, Z.H.; Zhu, C.H.; Shi, Y.C.; Li, Y. Experimental study of mechanical properties of sandstone under cyclic drying and wetting. Rock Soil Mech. 2010, 31, 3704–3708. [Google Scholar]
  12. Deng, H.F.; Zhou, M.L.; Li, J.L.; Sun, X.S.; Huang, Y.L. Creep degradation mechanism by water-rock interaction in the red-layer soft rock. Arab. J. Geosci. 2016, 9, 601. [Google Scholar] [CrossRef]
  13. Zhao, Z.; Yang, J.; Zhang, D.; Peng, H. Effects of Wetting and Cyclic Wetting–Drying on Tensile Strength of Sandstone with a Low Clay Mineral Content. Rock Mech. Rock Eng. 2017, 50, 485–491. [Google Scholar] [CrossRef]
  14. Zhang, B.Y.; Zhang, J.H.; Sun, G.L. Deformation and shear strength of rockfill materials composed of soft siltstones subjected to stress, cyclical drying/wetting and temperature variations. Eng. Geol. 2015, 190, 87–97. [Google Scholar] [CrossRef]
  15. Liu, X.; Wang, Z.; Fu, Y.; Yuan, W.; Miao, L. Macro/Microtesting and Damage and Degradation of Sandstones under Dry-Wet Cycles. Adv. Mater. Sci. Eng. 2016, 2016, 1–16. [Google Scholar] [CrossRef] [Green Version]
  16. Hale, P.A.; Shakoor, A. A Laboratory Investigation of the Effects of Cyclic Heating and Cooling, Wetting and Drying, and Freezing and Thawing on the Compressive Strength of Selected Sandstones. Environ. Eng. Geosci. Environ. Eng. Geosci. 2003, 9, 117–130. [Google Scholar] [CrossRef]
  17. Özbek, A. Investigation of the effects of wetting–drying and freezing–thawing cycles on some physical and mechanical properties of selected ignimbrites. Bull. Eng. Geol. Environ. 2014, 73, 595–609. [Google Scholar] [CrossRef]
  18. Hounsfield, G.N. Computerized transverse axial scanning (tomography): Part 1. Description of system. Br. J. Radiol. 1973, 46, 1016–1022. [Google Scholar] [CrossRef]
  19. Zander, V.; Chan, D.; Sadr, A. Microcomputed Tomography Evaluation of Root Dentin Caries Prevention by Topical Fluorides and Potassium Iodide. Sensors 2019, 19, 874. [Google Scholar] [CrossRef] [Green Version]
  20. Chiesura, G.; Luyckx, G.; Voet, E.; Lammens, N.; Van Paepegem, W.; Degrieck, J.; Dierick, M.; Van Hoorebeke, L.; Vanderniepen, P.; Sulejmani, S.; et al. A Micro-Computed Tomography Technique to Study the Quality of Fibre Optics Embedded in Composite Materials. Sensors 2015, 15, 10852–10871. [Google Scholar] [CrossRef]
  21. Katunin, A.; Wronkowicz-Katunin, A.; Dragan, K. Impact Damage Evaluation in Composite Structures Based on Fusion of Results of Ultrasonic Testing and X-ray Computed Tomography. Sensors 2020, 20, 1867. [Google Scholar] [CrossRef] [PubMed] [Green Version]
  22. Fusi, N.; Martinez-Martinez, J. Mercury porosimetry as a tool for improving quality of micro-CT images in low porosity carbonate rocks. Eng. Geol. 2013, 166, 272–282. [Google Scholar] [CrossRef]
  23. Hu, Z.; Klaver, J.; Schmatz, J.; Dewanckele, J.; Littke, R.; Krooss, B.M.; Amann-Hildenbrand, A. Stress sensitivity of porosity and permeability of Cobourg limestone. Eng. Geol. 2020, 273, 105632. [Google Scholar] [CrossRef]
  24. Liu, X.; Wang, J.; Ge, L.; Hu, F.; Li, C.; Li, X.; Yu, J.; Xu, H.; Lu, S.; Xue, Q. Pore-scale characterization of tight sandstone in Yanchang Formation Ordos Basin China using micro-CT and SEM imaging from nm- to cm-scale. Fuel 2017, 209, 254–264. [Google Scholar] [CrossRef]
  25. Kawaragi, C.; Yoneda, T.; Sato, T.; Kaneko, K. Microstructure of saturated bentonites characterized by X-ray CT observations. Eng. Geol. 2009, 106, 51–57. [Google Scholar] [CrossRef]
  26. Sarkar, G.; Siddiqua, S. Effect of fluid chemistry on the microstructure of light backfill: An X-ray CT investigation. Eng. Geol. 2016, 202, 153–162. [Google Scholar] [CrossRef]
  27. Meng, T.; Liu, R.; Meng, X.; Zhang, D.; Hu, Y. Evolution of the permeability and pore structure of transversely isotropic calcareous sediments subjected to triaxial pressure and high temperature. Eng. Geol. 2019, 253, 27–35. [Google Scholar] [CrossRef]
  28. Nakashima, Y.; Watanabe, Y. Estimate of transport properties of porous media by microfocus X-ray computed tomography and random walk simulation. Water Resour. Res. 2002, 38, 8-1–8-12. [Google Scholar] [CrossRef]
  29. Yao, Y.; Liu, D.; Che, Y.; Tang, D.; Tang, S.; Huang, W. Non-destructive characterization of coal samples from China using microfocus X-ray computed tomography. Int. J. Coal. Geol. 2009, 80, 113–123. [Google Scholar] [CrossRef]
  30. Appoloni, C.R.; Fernandes, C.P.; Rodrigues, C.R.O. X-ray microtomography study of a sandstone reservoir rock. Nucl. Instrum. Methods Phys. Res. Sect. A Accel. Spectrometers Detect. Assoc. Equip. 2007, 580, 629–632. [Google Scholar] [CrossRef]
  31. Ma, L.; Taylor, K.G.; Lee, P.D.; Dobson, K.J.; Dowey, P.J.; Courtois, L. Novel 3D centimetre-to nano-scale quantification of an organic-rich mudstone: The Carboniferous Bowland Shale, Northern England. Mar. Petrol. Geol. 2016, 72, 193–205. [Google Scholar] [CrossRef]
  32. Iacoviello, F.; Lu, X.; Mitchell, T.M.; Brett, D.J.L.; Shearing, P.R. The Imaging Resolution and Knudsen Effect on the Mass Transport of Shale Gas Assisted by Multi-length Scale X-Ray Computed Tomography. Sci. Rep. 2019, 9, 19465. [Google Scholar] [CrossRef] [PubMed]
  33. Backeberg, N.R.; Iacoviello, F.; Rittner, M.; Mitchell, T.M.; Jones, A.P.; Day, R.; Wheeler, J.; Shearing, P.R.; Vermeesch, P.; Striolo, A. Quantifying the anisotropy and tortuosity of permeable pathways in clay-rich mudstones using models based on X-ray tomography. Sci. Rep. 2017, 7, 14838. [Google Scholar] [CrossRef] [PubMed]
  34. Liu, Q.; Song, R.; Liu, J.; Lei, Y.; Zhu, X. Pore-scale visualization and quantitative analysis of the spontaneous imbibition based on experiments and micro-CT technology in low-permeability mixed-wettability rock. Energy Sci. Eng. 2020, 8, 1840–1856. [Google Scholar] [CrossRef]
  35. Koudelka, P.; Fila, T.; Rada, V.; Zlamal, P.; Sleichrt, J.; Vopalensky, M.; Kumpova, I.; Benes, P.; Vavrik, D.; Vavro, L.; et al. In-situ X-ray Differential Micro-tomography for Investigation of Water-weakening in Quasi-brittle Materials Subjected to Four-point Bending. Materials 2020, 13, 1405. [Google Scholar] [CrossRef] [Green Version]
  36. Ding, C.; Hu, D.; Zhou, H.; Lu, J.; Lv, T. Investigations of P-Wave velocity, mechanical behavior and thermal properties of anisotropic slate. Int. J. Rock Mech. Min. 2020, 127, 104176. [Google Scholar] [CrossRef]
  37. Hao, X.-J.; Yuan, L.; Zhao, Y.-X. Influence of initial microcrack on the physic-mechanical properties of rock with slaty cleavage. Geotech. Geol. Eng. 2017, 35, 2351–2360. [Google Scholar] [CrossRef]
  38. Meng, L.-B.; Li, T.-B.; Cai, G.-J. Temperature effects on the mechanical properties of slates in triaxial compression test. J. Mt. Sci. Engl. 2017, 14, 2581–2588. [Google Scholar] [CrossRef]
  39. Salehin, S. Investigation into engineering parameters of marls from Seydoon dam in Iran. J. Rock Mech. Geotech. Eng. 2017, 9, 912–923. [Google Scholar] [CrossRef]
  40. Meng, C.; Niu, J.; Li, X.; Luo, Z.; Du, X.; Du, J.; Lin, X.; Yu, X. Quantifying soil macropore networks in different forest communities using industrial computed tomography in a mountainous area of North China. J. Soils Sediments 2017, 17, 2357–2370. [Google Scholar] [CrossRef]
  41. Hu, X.; Li, Z.-C.; Li, X.-Y.; Liu, Y. Influence of shrub encroachment on CT-measured soil macropore characteristics in the Inner Mongolia grassland of northern China. Soil. Tillage Res. 2015, 150, 1–9. [Google Scholar] [CrossRef]
  42. Yang, B.; Xue, L.; Zhang, K. X-ray micro-computed tomography study of the propagation of cracks in shale during uniaxial compression. Environ. Earth Sci. 2018, 77, 652. [Google Scholar] [CrossRef]
  43. Kong, W.; Wei, Y.; Wang, S.; Chen, J.; Wang, Y. Research progress on cement-based materials by X-ray computed tomography. Int. J. Pavement Res. Technol. 2020, 13, 366–375. [Google Scholar] [CrossRef]
  44. Hu, X.; Li, Z.-C.; Li, X.-Y.; Liu, L.-Y. Quantification of soil macropores under alpine vegetation using computed tomography in the Qinghai Lake Watershed, NE Qinghai–Tibet Plateau. Geoderma 2016, 264, 244–251. [Google Scholar] [CrossRef]
  45. Zhao, B.; Liu, D.; Li, Z.; Huang, W.; Dong, Q. Mechanical Behavior of Shale Rock under Uniaxial Cyclic Loading and Unloading Condition. Adv. Civ. Eng. 2018, 2018, 9750480. [Google Scholar] [CrossRef] [Green Version]
  46. Ván, P.; Vásárhelyi, B. Relation of rock mass characterization and damage. In Rock Engineering in Difficult Ground Conditions—Soft Rocks and Karst; Vrkljan, I., Ed.; Taylor & Francis Group: London, UK, 2010. [Google Scholar]
  47. Zhou, J.; Wei, J.; Yang, T.; Zhu, W.; Li, L.; Zhang, P. Damage analysis of rock mass coupling joints, water and microseismicity. Tunn. Undergr. Space Technol. 2018, 71, 366–381. [Google Scholar] [CrossRef]
  48. Azimian, A.; Ajalloeian, R. Empirical correlation of physical and mechanical properties of marly rocks with P wave velocity. Arab. J. Geosci. 2015, 8, 2069–2079. [Google Scholar] [CrossRef]
  49. Zhou, Z.-L.; Cai, X.; Zhao, Y.; Chen, L.; Xiong, C.; Li, X.-B. Strength characteristics of dry and saturated rock at different strain rates. Trans. Nonferr. Metal. Soc. 2016, 26, 1919–1925. [Google Scholar] [CrossRef]
  50. Zhou, Z.; Cai, X.; Ma, D.; Chen, L.; Wang, S.; Tan, L. Dynamic tensile properties of sandstone subjected to wetting and drying cycles. Constr. Build. Mater. 2018, 182, 215–232. [Google Scholar] [CrossRef]
  51. Zhou, H.; Liu, H.; Hu, D.; Yang, F.; Lu, J.; Zhang, F. Anisotropies in Mechanical Behaviour, Thermal Expansion and P-Wave Velocity of Sandstone with Bedding Planes. Rock Mech. Rock Eng. 2016, 49, 4497–4504. [Google Scholar] [CrossRef]
Figure 1. Study site and sampling position.
Sensors 20 04853 g001
Figure 2. (a) Schematic of the experimental process of the cyclic wetting and drying treatment. (b) Slate specimens after six cycles of the wetting and drying treatment.
Sensors 20 04853 g002aSensors 20 04853 g002b
Figure 3. The workflow of the CT imaging analysis procedure.
Sensors 20 04853 g003
Figure 4. Variation in the sample weight versus the number of wetting and drying cycles.
Sensors 20 04853 g004
Figure 5. Variation in the P-wave velocity versus the number of wetting and drying cycles.
Sensors 20 04853 g005
Figure 6. Variation in the S-wave velocity versus the number of wetting and drying cycles.
Sensors 20 04853 g006
Figure 7. Reconstructed 3D distribution of microfracture clusters within sample specimens before (shown in insets) and after wetting and drying treatments. (a) Sample 1; (b) Sample 2; (c) Sample 3; (d) Sample 4.
Sensors 20 04853 g007aSensors 20 04853 g007bSensors 20 04853 g007c
Figure 8. Results of microfracture segmentation and the original CT (shown in insets) after six wetting and drying cycles for sample 1. (a) At the center (z = 0 mm) of the scene coordinate system. (b) At z = 10 mm of the scene coordinate system.
Sensors 20 04853 g008
Table 1. Main features of the Phoenix V|tome|x S and SonicViewer-SX (model-5251C).
Experimental EquipmentSpecifications
Phoenix V|tome|x SX-ray tube type: Open directional high-power microfocus X-ray tube, with a closed cooling water circuit
Max. voltage/power: 240 kV/320 W
Geometrical magnification (3D): 1.46× to 100× with a microfocus tube
Detail detectability: Down to <1 µm (microfocus tube);
Max. focus object distance: 545 mm (microfocus tube)
SonicViewer-SX (model-5251C)Output voltage: 500 V
Pulse width: 6 μs ± 2 μs
Input impedance: 1 MΩ
Gain: 1, 2, 5, 10, 20, 50, 100, 200
Frequency range: 10–1000 kHz
Low-pass filter: 200 kHz
A/D resolution: 12 bit
Sample rate: 50, 100, 200, 500, 1000, 2000 ns
Data length: 1024
P-wave transducer: 200 kHz
S-wave transducer: 100 kHz
Table 2. Micro-CT scanning configuration parameters.
ParametersValue
Magnetization2.50
Source to sample distance (FOD, mm)372.57
Source to detector distance (FDD, mm)931.43
Number of projections1800
Image width (pixel)2000
Image height (pixel)2000
Detector typeDXR-250
Acquisition time (ms)1000.10
Camera binning1
X-ray voltage (kV)200
X-ray current (μA)190
Voxel size (μm × μm × μm)80 × 80 × 80
Table 3. Parameter settings for the segmentation of the microstructure.
ProcessParameterProcessParameter
Image resizing256 × 256 pixelsGaussian filtering10 × 10 pixels
Median filtering10 × 10 pixelsMinimum filtering10 × 10 pixels
Morphological openingDisk, R = 3 pixelsMorphological closingDisk, R = 3 pixels
Region growingNormalized distance < 0.1Merging similar regionsDistance < 10
pixels and mean grayscale < 40
Removing small regions<200 pixelsRemoving nonlinearity regionsMajor axis length/Minor axis length < 3
Table 4. Relationships between the number of wetting and drying cycles and rock properties (n: number of wetting and drying cycles).
Measurement of PropertiesRelationship EquationsCoefficient of Determination (R2)
Dry weight (w)Sample 1#: w1 = 2838.02754 − 0.21754 × e0.47957n0.99
Sample 2#: w2 = 2714.78392 − 0.1083 × e0.62916n0.98
Sample 3#: w3 = 2476.86398 − 0.09339 × e0.36783n0.97
Sample 4#: w4 = 2825.05996 − 0.15042 × e0.32507n0.99
P-wave velocity (vP)vP = 3523.69446 + 923.46222 × e−0.41864n0.99
S-wave velocity (vS)vS = 2488.97977 + 1178.33291 × e−0.31083n0.99
Table 5. Measurement of the microfracture clusters obtained from CT scans for the four samples before (n = 0) and after (n = 6) wetting and drying treatments.
Sample 1Sample 2Sample 3Sample 4
ROI dimensions (mm × mm × mm)n = 050 × 50 × 50
n = 6
Maximum pore equivalent diameter (mm)n = 09.854.379.214.99
n = 649.5541.3927.6531.34
Average diameter (mm)n = 04.161.445.133.56
n = 64.434.359.284.05
Defect volume of microfractures (mm3)n = 0147.92116.51155.11115.42
n = 6276.84427.82369.79351.62
Total area of microfractures (mm2)n = 04084.233090.524311.45375.40
n = 66880.2711,258.719905.199664.15
Defect volume ratio (%)n = 00.120.090.120.09
n = 60.220.340.300.28

