VI-Net—View-Invariant Quality of Human Movement Assessment


Abstract
:1. Introduction
2. Related Work
3. Datasets
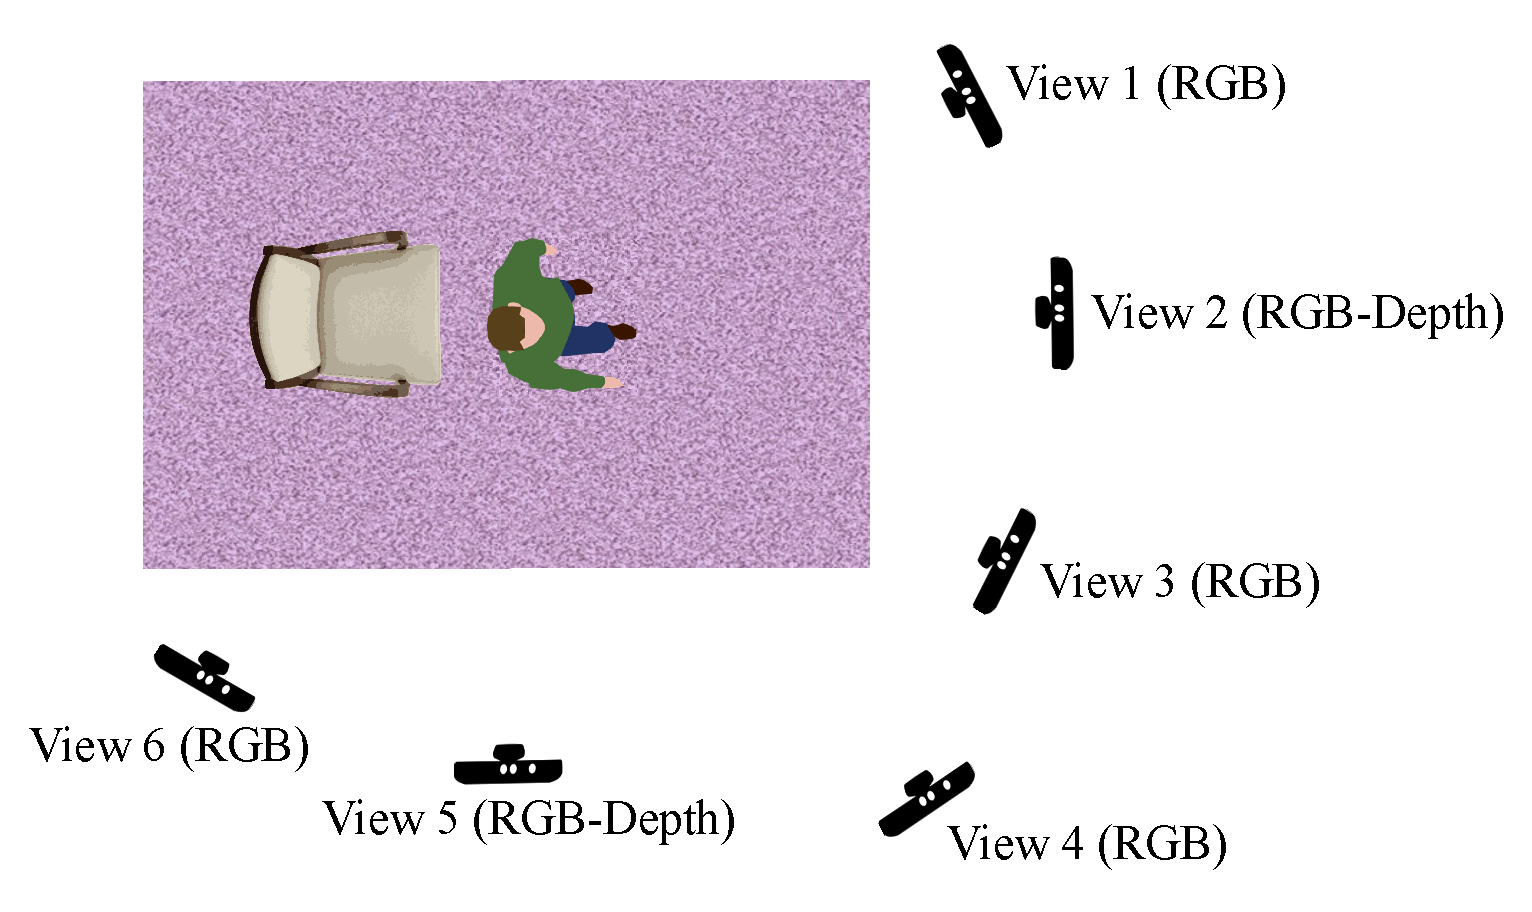
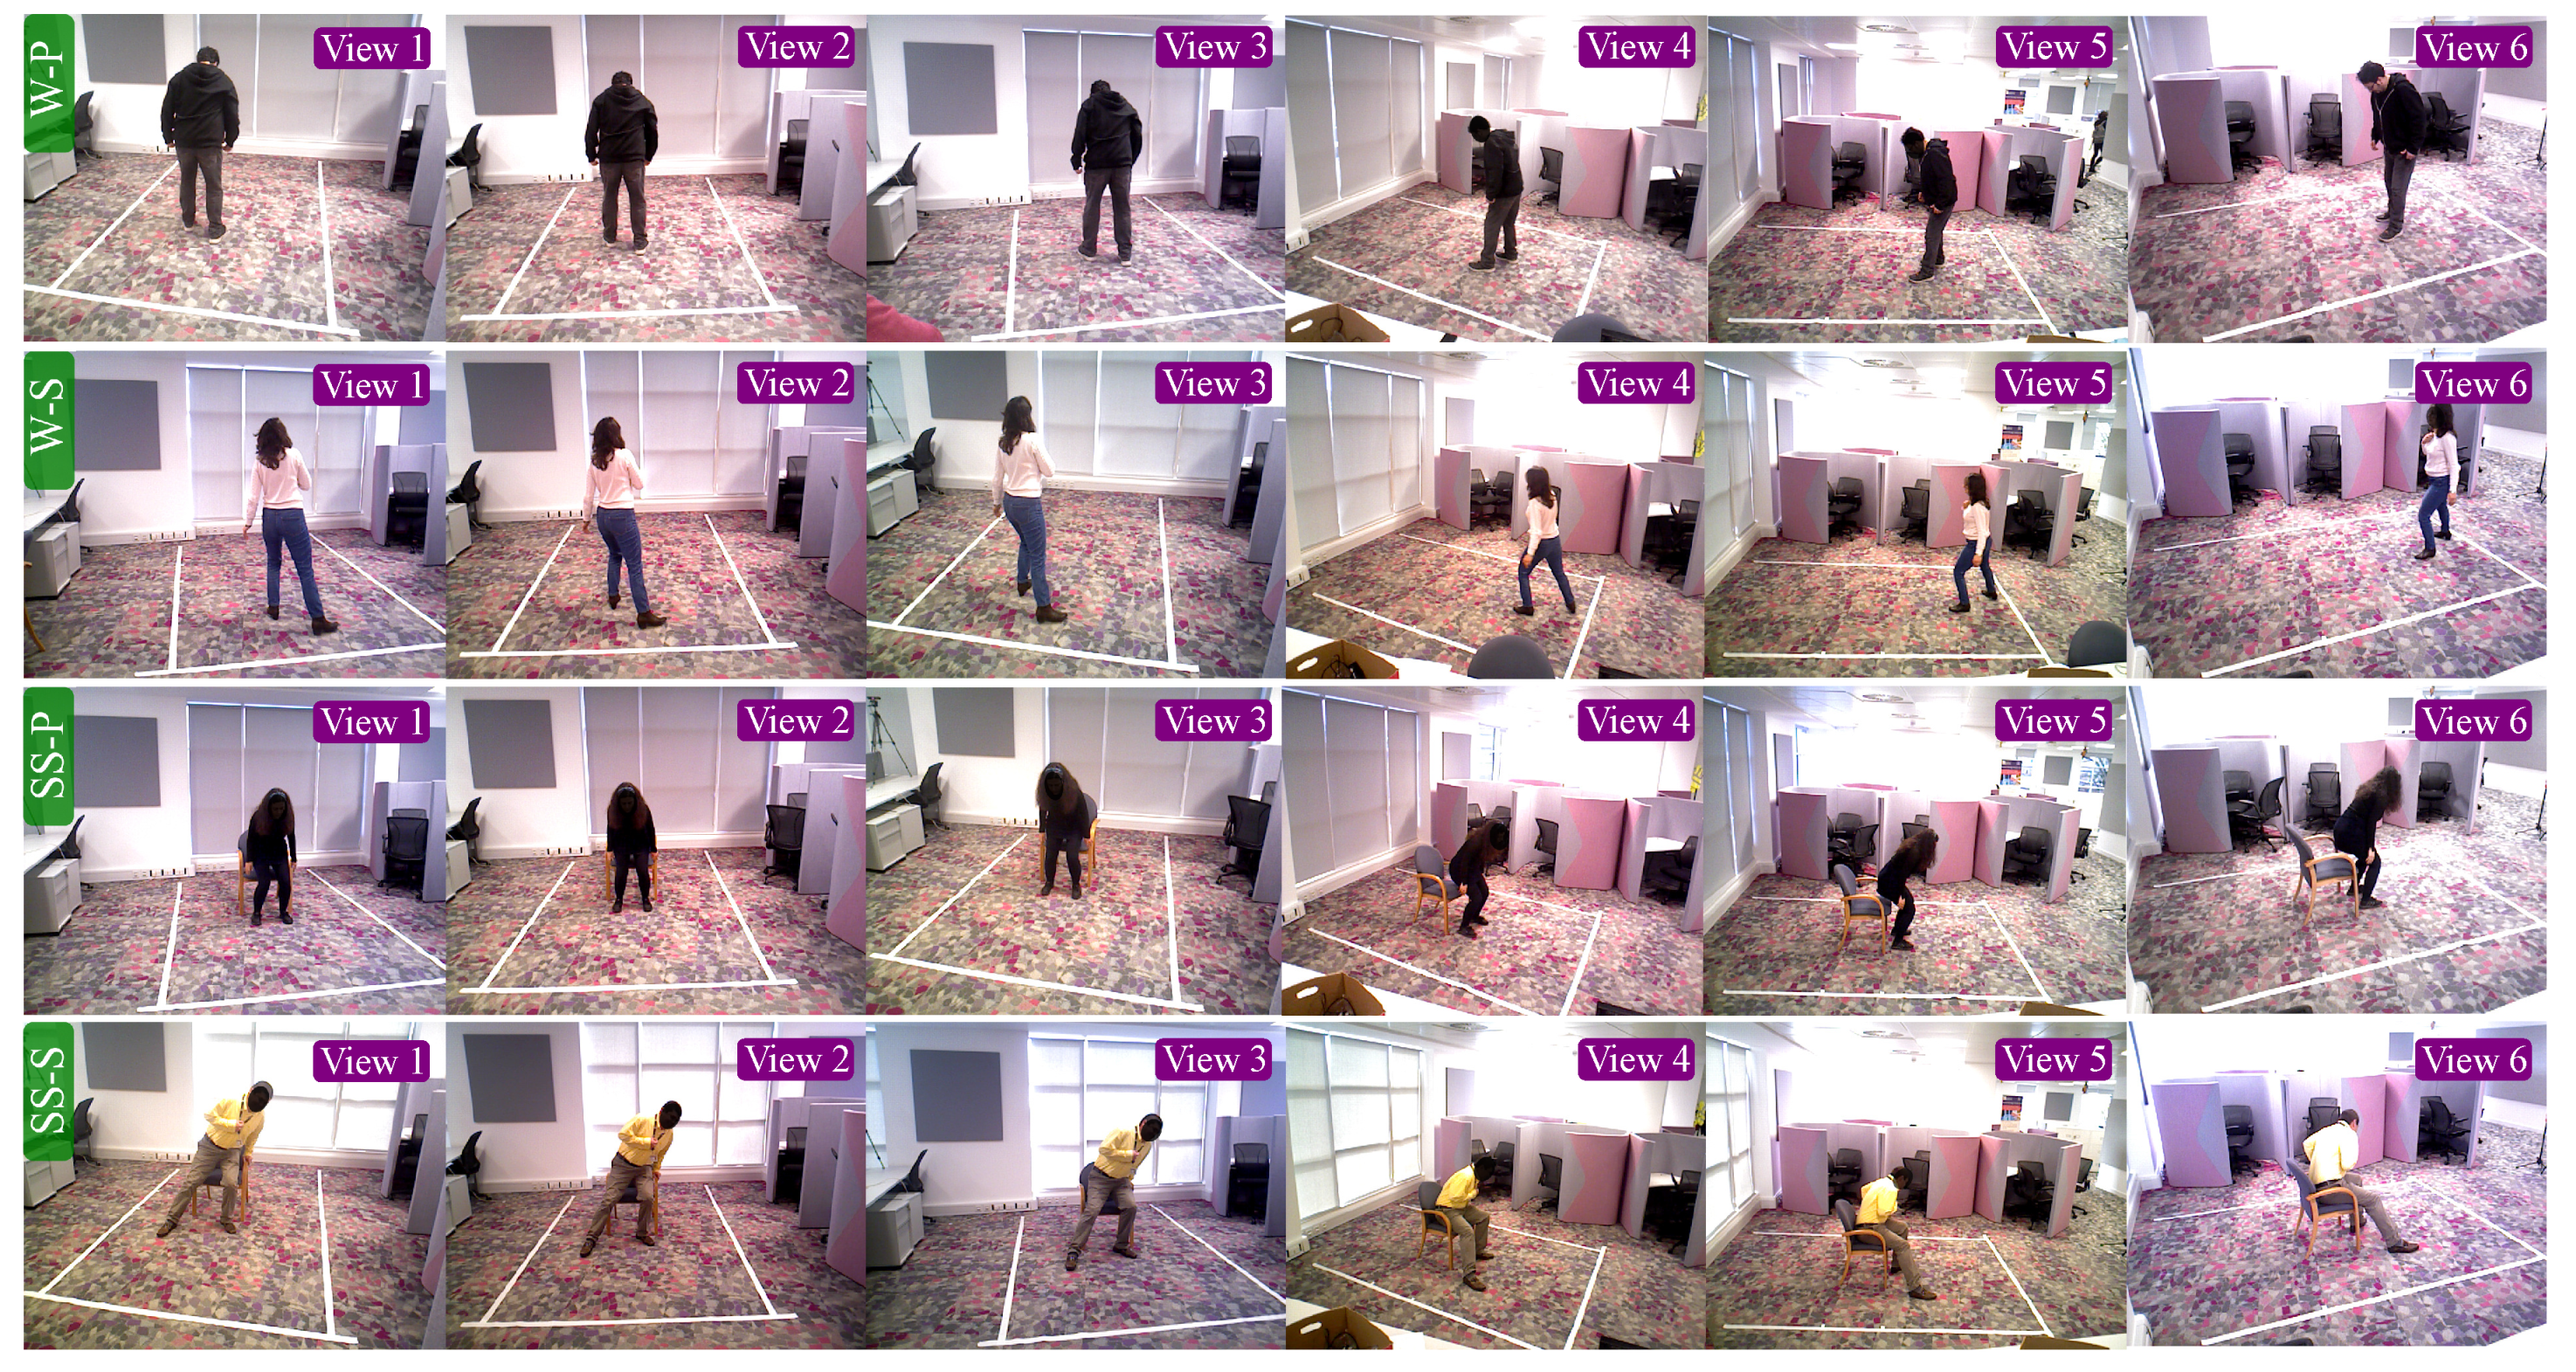
3.1. QMAR
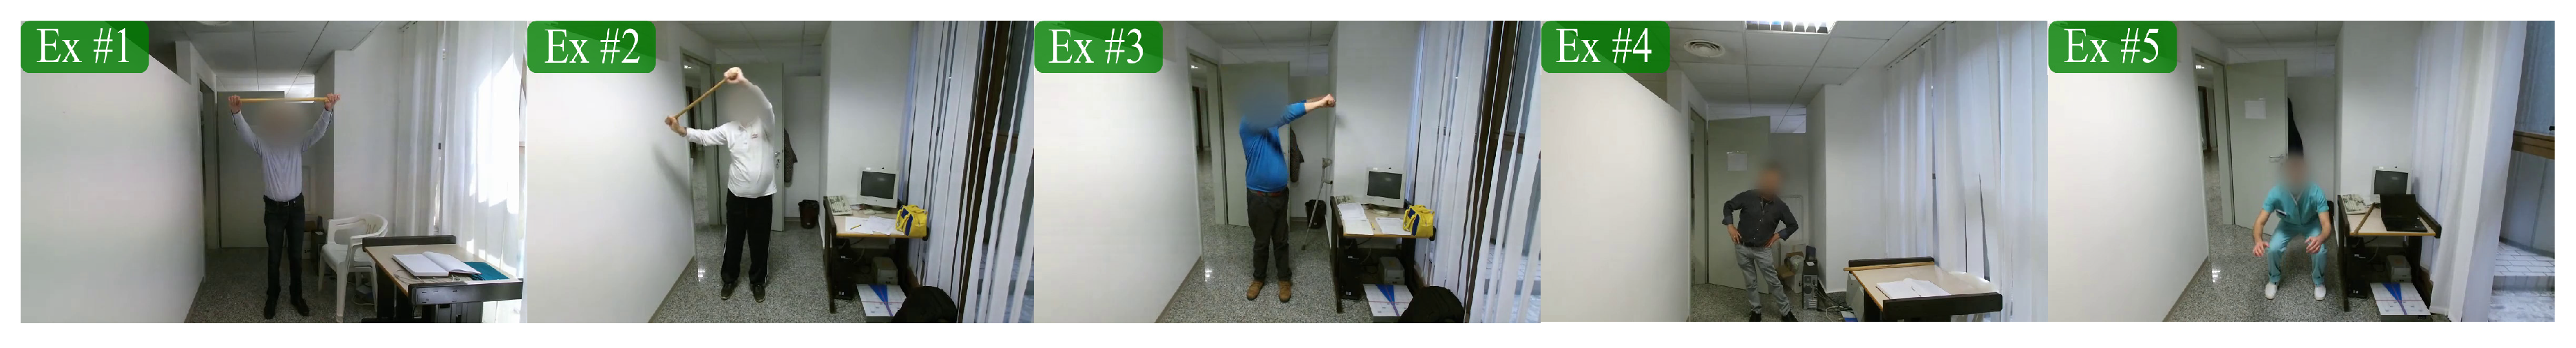
3.2. KIMORE
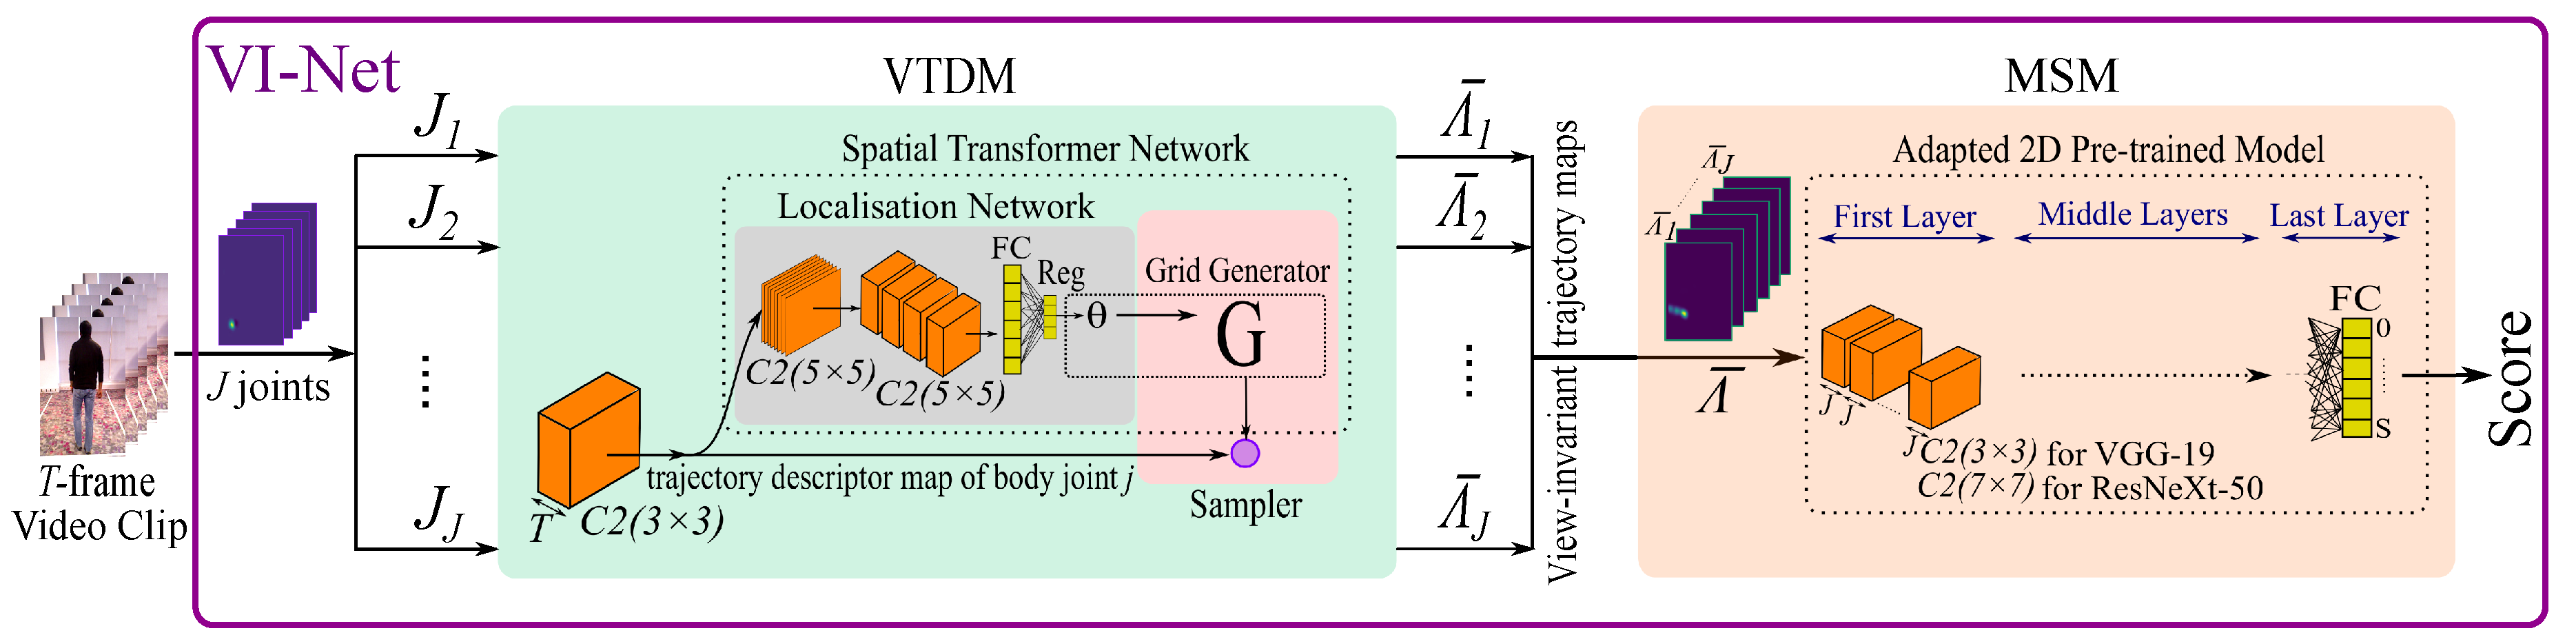
4. Proposed Method
5. Experiments and Results
5.1. Cross-Subject Quality of Movement Analysis
5.2. Cross-View Quality of Movement Analysis
5.3. Single-View Quality of Movement Analysis
6. Conclusions
Author Contributions
Funding
Acknowledgments
Conflicts of Interest
References
- Li, Y.; Chai, X.; Chen, X. End-to-End Learning for Action Quality Assessment. In Proceedings of the Pacific Rim Conference on Multimedia, Hefei, China, 21–22 September 2018; pp. 125–134. [Google Scholar]
- Parmar, P.; Tran Morris, B. Learning to Score Olympic Events. In Proceedings of the IEEE Conference on Computer Vision and Pattern Recognition Workshop, Honolulu, HI, USA, 21–26 July 2017; pp. 20–28. [Google Scholar]
- Parmar, P.; Morris, B.T. What and How Well You Performed? A Multitask Learning Approach to Action Quality Assessment. In Proceedings of the IEEE Conference on Computer Vision and Pattern Recognition, Long Beach, CA, USA, 16–20 June 2019; pp. 304–313. [Google Scholar]
- Pan, J.H.; Gao, J.; Zheng, W.S. Action Assessment by Joint Relation Graphs. In Proceedings of the IEEE International Conference on Computer Vision, Seoul, Korea, 27 October–2 November 2019; pp. 6331–6340. [Google Scholar]
- Fard, M.J.; Ameri, S.; Darin Ellis, R.; Chinnam, R.B.; Pandya, A.K.; Klein, M.D. Automated Robot-Assisted Surgical Skill Evaluation: Predictive Analytics Approach. Int. J. Med. Robot. Comput. Assist. Surg. 2018, 14, 1850. [Google Scholar] [CrossRef] [PubMed]
- Doughty, H.; Mayol-Cuevas, W.; Damen, D. The Pros and Cons: Rank-Aware Temporal Attention for Skill Determination in Long Videos. In Proceedings of the IEEE Conference on Computer Vision and Pattern Recognition, Long Beach, CA, USA, 16–20 June 2019; pp. 7862–7871. [Google Scholar]
- Sardari, F.; Paiement, A.; Mirmehdi, M. View-Invariant Pose Analysis for Human Movement Assessment from RGB Data. In Proceedings of the International Conference on Image Analysis and Processing, Trento, Italy, 9–13 September 2019; pp. 237–248. [Google Scholar]
- Liao, Y.; Vakanski, A.; Xian, M. A Deep Learning Framework for Assessing Physical Rehabilitation Exercises. IEEE Trans. Neural Syst. Rehabil. Eng. 2019, 28, 468–477. [Google Scholar] [CrossRef] [PubMed]
- Crabbe, B.; Paiement, A.; Hannuna, S.; Mirmehdi, M. Skeleton-free Body Pose Estimation from Depth Images for Movement Analysis. In Proceedings of the IEEE International Conference on Computer Vision Workshop, Santiago, Chile, 7–13 December 2015; pp. 70–78. [Google Scholar]
- Khokhlova, M.; Migniot, C.; Morozov, A.; Sushkova, O.; Dipanda, A. Normal and Pathological Gait Classification LSTM Model. Artif. Intell. Med. 2019, 94, 54–66. [Google Scholar] [CrossRef] [PubMed]
- Antunes, J.; Bernardino, A.; Smailagic, A.; Siewiorek, D.P. AHA-3D: A Labelled Dataset for Senior Fitness Exercise Recognition and Segmentation from 3D Skeletal Data. In Proceedings of the British Machine Vision Conference, Newcastle, UK, 3–6 September 2018; p. 332. [Google Scholar]
- Blanchard, N.; Skinner, K.; Kemp, A.; Scheirer, W.; Flynn, P. “Keep Me In, Coach!”: A Computer Vision Perspective on Assessing ACL Injury Risk in Female Athletes. In Proceedings of the IEEE Winter Conference on Applications of Computer Vision, Waikoloa Village, HI, USA, 7–11 January 2019; pp. 1366–1374. [Google Scholar]
- Lei, Q.; Du, J.X.; Zhang, H.B.; Ye, S.; Chen, D.S. A Survey of Vision-Based Human Action Evaluation Methods. Sensors 2019, 19, 4129. [Google Scholar] [CrossRef] [PubMed] [Green Version]
- Wandt, B.; Rosenhahn, B. RepNet: Weakly Supervised Training of an Adversarial Reprojection Network for 3D Human Pose Estimation. In Proceedings of the IEEE Conference on Computer Vision and Pattern Recognition, Long Beach, CA, USA, 16–20 June 2019. [Google Scholar]
- Zhao, L.; Peng, X.; Tian, Y.; Kapadia, M.; Metaxas, D.N. Semantic Graph Convolutional Networks for 3D Human Pose Regression. In Proceedings of the IEEE Conference on Computer Vision and Pattern Recognition, Long Beach, CA, USA, 16–20 June 2019. [Google Scholar]
- Zhou, K.; Han, X.; Jiang, N.; Jia, K.; Lu, J. HEMlets Pose: Learning Part-Centric Heatmap Triplets for Accurate 3D Human Pose Estimation. In Proceedings of the IEEE International Conference on Computer Vision, Seoul, Korea, 27 October–2 November 2019. [Google Scholar]
- Kolotouros, N.; Pavlakos, G.; Black, M.J.; Daniilidis, K. Learning to Reconstruct 3D Human Pose and Shape via Model-Fitting in the Loop. In Proceedings of the IEEE International Conference on Computer Vision, Long Beach, CA, USA, 16–20 June 2019; pp. 2252–2261. [Google Scholar]
- Kocabas, M.; Athanasiou, N.; Black, M.J. VIBE: Video Inference for Human Body Pose and Shape Estimation. In Proceedings of the IEEE Conference on Computer Vision and Pattern Recognition, Seattle, WA, USA, 14–19 June 2020; pp. 5253–5263. [Google Scholar]
- Qiu, H.; Wang, C.; Wang, J.; Wang, N.; Zeng, W. Cross view fusion for 3d human pose estimation. In Proceedings of the IEEE International Conference on Computer Vision, Long Beach, CA, USA, 16–20 June 2019; pp. 4342–4351. [Google Scholar]
- Remelli, E.; Han, S.; Honari, S.; Fua, P.; Wang, R. Lightweight Multi-View 3D Pose Estimation through Camera-Disentangled Representation. In Proceedings of the IEEE Conference on Computer Vision and Pattern Recognition, Seattle, WA, USA, 14–19 June 2020; pp. 6040–6049. [Google Scholar]
- Cao, Z.; Simon, T.; Wei, S.E.; Sheikh, Y. Realtime Multi-Person 2D Pose Estimation Using Part Affinity Fields. In Proceedings of the IEEE Conference on Computer Vision and Pattern Recognition, Honolulu, HI, USA, 21–26 July 2017; pp. 7291–7299. [Google Scholar]
- Jaderberg, M.; Simonyan, K.; Zisserman, A.; Kavukcuoglu, K. Spatial Transformer Networks. In Proceedings of the Advances in Neural Information Processing Systems, Montreal, QC, Canada, 7–12 December 2015; pp. 2017–2025. [Google Scholar]
- Simonyan, K.; Zisserman, A. Very Deep Convolutional Networks for Large-Scale Image Recognition. arXiv 2014, arXiv:1409.1556. [Google Scholar]
- Xie, S.; Girshick, R.; Dollár, P.; Tu, Z.; He, K. Aggregated Residual Transformations for Deep Neural Networks. In Proceedings of the IEEE Conference on Computer Vision and Pattern Recognition, Honolulu, HI, USA, 21–26 July 2017; pp. 1492–1500. [Google Scholar]
- Wang, D.; Ouyang, W.; Li, W.; Xu, D. Dividing and Aggregating Network for Multi-View Action Recognition. In Proceedings of the European Conference on Computer Vision, Munich, Germany, 8–14 September 2018; pp. 451–467. [Google Scholar]
- Li, J.; Wong, Y.; Zhao, Q.; Kankanhalli, M. Unsupervised Learning of View-Invariant Action Representations. In Proceedings of the Advances in Neural Information Processing Systems, Montreal, OC, Canada, 3–8 December 2018; pp. 1254–1264. [Google Scholar]
- Lakhal, M.I.; Lanz, O.; Cavallaro, A. View-LSTM: Novel-View Video Synthesis Through View Decomposition. In Proceedings of the IEEE International Conference on Computer Vision, Seoul, Korea, 27 October–2 November 2019; pp. 7577–7587. [Google Scholar]
- Li, W.; Xu, Z.; Xu, D.; Dai, D.; Van Gool, L. Domain Generalization and Adaptation Using Low Rank Exemplar SVMs. IEEE Trans. Pattern Anal. Mach. Intell. 2017, 40, 1114–1127. [Google Scholar] [CrossRef] [PubMed]
- Varol, G.; Laptev, I.; Schmid, C.; Zisserman, A. Synthetic Humans for Action Recognition from Unseen Viewpoints. arXiv 2019, arXiv:1912.04070. [Google Scholar]
- Capecci, M.; Ceravolo, M.G.; Ferracuti, F.; Iarlori, S.; Monteriù, A.; Romeo, L.; Verdini, F. The KIMORE Dataset: Kinematic Assessment of Movement and Clinical Scores for Remote Monitoring of Physical Rehabilitation. IEEE Trans. Neural Syst. Rehabil. Eng. 2019, 27, 1436–1448. [Google Scholar] [CrossRef] [PubMed]
- Pirsiavash, H.; Vondrick, C.; Torralba, A. Assessing The Quality of Actions. In Proceedings of the European Conference on Computer Vision, Zurich, Switzerland, 6–12 September 2014; pp. 556–571. [Google Scholar]
- Xiang, X.; Tian, Y.; Reiter, A.; Hager, G.D.; Tran, T.D. S3D: Stacking Segmental P3D for Action Quality Assessment. In Proceedings of the IEEE International Conference on Image Processing, Athens, Greece, 7–10 October 2018; pp. 928–932. [Google Scholar]
- Tang, Y.; Ni, Z.; Zhou, J.; Zhang, D.; Lu, J.; Wu, Y.; Zhou, J. Uncertainty-aware Score Distribution Learning for Action Quality Assessment. In Proceedings of the IEEE Conference on Computer Vision and Pattern Recognition, Seattle, WA, USA, 13–19 June 2020; pp. 9839–9848. [Google Scholar]
- Tran, D.; Bourdev, L.; Fergus, R.; Torresani, L.; Paluri, M. Learning Spatiotemporal Features With 3D Convolutional Networks. In Proceedings of the IEEE International Conference on Computer Vision, Santiago, Chile, 7–13 December 2015; pp. 4489–4497. [Google Scholar]
- Carreira, J.; Zisserman, A. Quo Vadis, Action Recognition? a New Model and the Kinetics Dataset. In Proceedings of the IEEE Conference on Computer Vision and Pattern Recognition, Honolulu, HI, USA, 21–26 July 2017; pp. 6299–6308. [Google Scholar]
- Tao, L.; Paiement, A.; Damen, D.; Mirmehdi, M.; Hannuna, S.; Camplani, M.; Burghardt, T.; Craddock, I. A Comparative Study of Pose Representation and Dynamics Modelling for Online Motion Quality Assessment. Comput. Vis. Image Underst. 2016, 148, 136–152. [Google Scholar] [CrossRef] [Green Version]
- Elkholy, A.; Hussein, M.; Gomaa, W.; Damen, D.; Saba, E. Efficient and Robust Skeleton-Based Quality Assessment and Abnormality Detection in Human Action Performance. IEEE J. Biomed. Health Inform. 2019, 24, 208–291. [Google Scholar] [CrossRef]
- Rahmani, H.; Mian, A.; Shah, M. Learning a Deep Model for Human Action Recognition from Novel Viewpoints. IEEE Trans. Pattern Anal. Mach. Intell. 2018, 40, 667–681. [Google Scholar] [CrossRef] [Green Version]
- Feichtenhofer, C.; Fan, H.; Malik, J.; He, K. Slowfast Networks for Video Recognition. In Proceedings of the IEEE International Conference on Computer Vision, Seoul, Korea, 27 October–2 November 2019; pp. 6202–6211. [Google Scholar]
- Hara, K.; Kataoka, H.; Satoh, Y. Can Spatiotemporal 3D CNNs Retrace the History of 2D CNNs and Imagenet? In Proceedings of the IEEE Conference on Computer Vision and Pattern Recognition, Salt Lake City, UT, USA, 18–23 June 2018; pp. 6546–6555. [Google Scholar]
- Lin, J.; Gan, C.; Han, S. Tsm: Temporal Shift Module for Efficient Video Understanding. In Proceedings of the IEEE International Conference on Computer Vision, Seoul, Korea, 27 October–2 November 2019; pp. 7083–7093. [Google Scholar]
- Ke, Q.; Bennamoun, M.; An, S.; Sohel, F.; Boussaid, F. A New Representation of Skeleton Sequences for 3D Action Recognition. In Proceedings of the IEEE Conference on Computer Vision and Pattern Recognition, Honolulu, HI, USA, 21–26 July 2017; pp. 3288–3297. [Google Scholar]
- Liu, M.; Liu, H.; Chen, C. Enhanced Skeleton Visualization for View Invariant Human Action Recognition. Pattern Recog. 2017, 68, 346–362. [Google Scholar] [CrossRef]
- Zhang, P.; Lan, C.; Xing, J.; Zeng, W.; Xue, J.; Zheng, N. View Adaptive Neural Networks for High Performance Skeleton-Based Human Action Recognition. IEEE Trans. Pattern Anal. Mach. Intell. 2019, 41, 1963–1978. [Google Scholar] [CrossRef] [Green Version]
- Liu, M.; Yuan, J. Recognizing Human Actions as the Evolution of Pose Estimation Maps. In Proceedings of the IEEE Conference on Computer Vision and Pattern Recognition, Salt Lake City, UT, USA, 18–23 June 2018; pp. 1159–1168. [Google Scholar]
- Ji, Y.; Xu, F.; Yang, Y.; Shen, F.; Shen, H.T.; Zheng, W.S. A Large-Scale RGB-D Database for Arbitrary-View Human Action Recognition. In Proceedings of the ACM International Conference on Multimedia, Seoul, Korea, 22 – 26 October 2018; pp. 1510–1518. [Google Scholar]
- Paiement, A.; Tao, L.; Hannuna, S.; Camplani, M.; Damen, D.; Mirmehdi, M. Online Quality Assessment of Human Movement from Skeleton Data. In Proceedings of the British Machine Vision Conference, Nottingham, UK, 1–5 September 2014; pp. 153–166. [Google Scholar]
- Vakanski, A.; Jun, H.p.; Paul, D.; Baker, R. A Data Set of Human Body Movements for Physical Rehabilitation Exercises. Data 2018, 3, 2. [Google Scholar] [CrossRef] [Green Version]
- Kocabas, M.; Karagoz, S.; Akbas, E. Self-supervised Learning of 3D Human Pose Using Multi-view Geometry. In Proceedings of the IEEE Conference on Computer Vision and Pattern Recognition, Long Beach, CA, USA, 16–20 June 2019; pp. 1077–1086. [Google Scholar]
- Dai, J.; Qi, H.; Xiong, Y.; Li, Y.; Zhang, G.; Hu, H.; Wei, Y. Deformable Convolutional Networks. In Proceedings of the IEEE International Conference on Computer Vision, Venice, Italy, 22–29 October 2017; pp. 764–773. [Google Scholar]
- Zhu, X.; Hu, H.; Lin, S.; Dai, J. Deformable Convnets v2: More Deformable, Better Results. In Proceedings of the IEEE Conference on Computer Vision and Pattern Recognition, Long Beach, CA, USA, 16–20 June 2019; pp. 9308–9316. [Google Scholar]
- Tai, K.S.; Bailis, P.; Valiant, G. Equivariant Transformer Networks. In Proceedings of the International Conference on Machine Learning, Long Beach, CA, USA, 10–15 June 2019. [Google Scholar]


| Action | Quality Score | # Sequences | #Frames/Video Min-Max | Total Frames | |
|---|---|---|---|---|---|
| W | Normal | 0 | 41 | 62–179 | 12,672 |
| W-P | Abnormal | 1–4 | 40 | 93–441 | 33618 |
| W-S | Abnormal | 1–5 | 68 | 104–500 | 57,498 |
| SS | Normal | 0 | 42 | 28–132 | 9250 |
| SS-P | Abnormal | 1–12 | 41 | 96–558 | 41,808 |
| SS-S | Abnormal | 1–5 | 74 | 51–580 | 47,954 |
| Score | #1 | #2 | #3 | #4 | #5 | #6 | #7 | #8 | #9 | #10 | #11 | #12 | |
|---|---|---|---|---|---|---|---|---|---|---|---|---|---|
| Action | |||||||||||||
| W-P | 4 | 8 | 16 | 12 | - | - | - | - | - | - | - | - | |
| W-S | 10 | 14 | 19 | 15 | 10 | - | - | - | - | - | - | - | |
| SS-P | 1 | 1 | 6 | 8 | 4 | 4 | 4 | 3 | 3 | 1 | 2 | 4 | |
| SS-S | 3 | 19 | 19 | 13 | 20 | - | - | - | - | - | - | - | |
| VTDM | MSM (Adapted VGG-19 or ResNeXt-50) | |
|---|---|---|
| VI-Net | 1st layer:, BN, ReLU | 1st layer VGG-19: , BN, ReLU |
| Localisation Network: | 1st layer ResNeXt-50: | |
| ,, ReLU, | , , ReLU | |
| ,, ReLU, | Middle layers: As in VGG-19/ResNeXt-50 | |
| , ReLU, | Last layer: |
| Action | W-P | W-S | SS-P | SS-S | Avg | ||
|---|---|---|---|---|---|---|---|
| Method | |||||||
| Custom-trained C3D (after Reference [3]) | 0.50 | 0.37 | 0.25 | 0.54 | 0.41 | ||
| Pre-trained I3D | 0.79 | 0.47 | 0.54 | 0.55 | 0.58 | ||
| VI-Net | VTDM+MSM (VGG-19) | w/o STN | 0.81 | 0.49 | 0.57 | 0.74 | 0.65 |
| w STN | 0.82 | 0.52 | 0.55 | 0.73 | 0.65 | ||
| VTDM+MSM (ResNeXt-50) | w/o STN | 0.87 | 0.56 | 0.48 | 0.72 | 0.65 | |
| w STN | 0.87 | 0.52 | 0.58 | 0.69 | 0.66 | ||
| View | VTDM+MSM (VGG-19) | VTDM+MSM (ResNeXt-50) | View | VTDM+MSM (VGG-19) | VTDM+MSM (ResNeXt-50) | ||||||
|---|---|---|---|---|---|---|---|---|---|---|---|
| w/o STN | w STN | w/o STN | w STN | w/o STN | w STN | w/o STN | w STN | ||||
| W-P | 1 | 0.51 | 0.67 | 0.64 | 0.67 | W-S | 1 | 0.51 | 0.43 | 0.60 | 0.64 |
| 2 | 0.69 | 0.66 | 0.58 | 0.72 | 2 | 0.47 | 0.54 | 0.55 | 0.62 | ||
| 3 | 0.62 | 0.66 | 0.63 | 0.70 | 3 | 0.64 | 0.56 | 0.61 | 0.59 | ||
| 4 | 0.67 | 0.64 | 0.72 | 0.72 | 4 | 0.60 | 0.59 | 0.60 | 0.66 | ||
| 5 | 0.67 | 0.67 | 0.68 | 0.71 | 5 | 0.62 | 0.60 | 0.62 | 0.63 | ||
| 6 | 0.69 | 0.72 | 0.69 | 0.73 | 6 | 0.46 | 0.40 | 0.53 | 0.60 | ||
| Avg | 0.64 | 0.67 | 0.65 | 0.70 | Avg | 0.55 | 0.52 | 0.58 | 0.62 | ||
| SS-P | 1 | 0.30 | 0.32 | 0.25 | 0.25 | SS-S | 1 | 0.36 | 0.49 | 0.44 | 0.45 |
| 2 | 0.27 | 0.31 | 0.31 | 0.32 | 2 | 0.47 | 0.40 | 0.56 | 0.56 | ||
| 3 | 0.16 | 0.23 | 0.36 | 0.43 | 3 | 0.37 | 0.52 | 0.38 | 0.43 | ||
| 4 | 0.10 | 0.34 | 0.44 | 0.49 | 4 | 0.38 | 0.34 | 0.41 | 0.54 | ||
| 5 | 0.50 | 0.52 | 0.43 | 0.45 | 5 | 0.26 | 0.50 | 0.50 | 0.48 | ||
| 6 | 0.41 | 0.24 | 0.48 | 0.44 | 6 | 0.21 | 0.28 | 0.13 | 0.16 | ||
| Avg | 0.29 | 0.32 | 0.37 | 0.39 | Avg | 0.34 | 0.42 | 0.40 | 0.43 | ||
| View | VTDM+MSM (VGG-19) | VTDM+MSM (ResNeXt-50) | View | VTDM+MSM (VGG-19) | VTDM+MSM (ResNeXt-50) | ||||||
|---|---|---|---|---|---|---|---|---|---|---|---|
| w/o STN | w STN | w/o STN | w STN | w/o STN | w STN | w/o STN | w STN | ||||
| W-P | 2,4 | 0.77 | 0.81 | 0.87 | 0.89 | W-S | 2,4 | 0.58 | 0.72 | 0.81 | 0.73 |
| 2,5 | 0.72 | 0.75 | 0.90 | 0.92 | 2,5 | 0.74 | 0.74 | 0.80 | 0.81 | ||
| 2,6 | 0.75 | 0.76 | 0.73 | 0.77 | 2,6 | 0.64 | 0.67 | 0.74 | 0.68 | ||
| 1,5 | 0.70 | 0.76 | 0.80 | 0.75 | 1,5 | 0.70 | 0.68 | 0.83 | 0.81 | ||
| 3,5 | 0.73 | 0.79 | 0.87 | 0.84 | 3,5 | 0.66 | 0.66 | 0.82 | 0.79 | ||
| Avg | 0.73 | 0.77 | 0.83 | 0.83 | Avg | 0.66 | 0.69 | 0.80 | 0.76 | ||
| SS-P | 2,4 | 0.55 | 0.52 | 0.41 | 0.46 | SS-S | 2,4 | 0.57 | 0.64 | 0.54 | 0.64 |
| 2,5 | 0.60 | 0.53 | 0.49 | 0.46 | 2,5 | 0.62 | 0.56 | 0.63 | 0.61 | ||
| 2,6 | 0.48 | 0.35 | 0.36 | 0.42 | 2,6 | 0.50 | 0.62 | 0.48 | 0.46 | ||
| 1,5 | 0.46 | 0.55 | 039 | 0.52 | 1,5 | 0.64 | 0.53 | 0.48 | 0.58 | ||
| 3,5 | 0.61 | 0.40 | 0.43 | 0.47 | 3,5 | 0.62 | 0.60 | 0.63 | 0.67 | ||
| Avg | 0.54 | 0.47 | 0.41 | 0.46 | Avg | 0.59 | 0.59 | 0.55 | 0.58 | ||
| Action | Ex #1 | Ex #2 | Ex #3 | Ex #4 | Ex #5 | Average | ||
|---|---|---|---|---|---|---|---|---|
| Method | ||||||||
| Custom-trained C3D (after Reference [3]) | 0.66 | 0.64 | 0.63 | 0.59 | 0.60 | 0.62 | ||
| Pre-trained I3D | 0.45 | 0.56 | 0.57 | 0.64 | 0.58 | 0.56 | ||
| VI-Net | VTDM+MSM (VGG-19) | w/o STN | 0.63 | 0.50 | 0.55 | 0.80 | 0.76 | 0.64 |
| w STN | 0.79 | 0.69 | 0.57 | 0.59 | 0.70 | 0.66 | ||
| VTDM+MSM (ResNeXt-50) | w/o STN | 0.55 | 0.42 | 0.33 | 0.62 | 0.57 | 0.49 | |
| w STN | 0.55 | 0.62 | 0.36 | 0.58 | 0.67 | 0.55 | ||
© 2020 by the authors. Licensee MDPI, Basel, Switzerland. This article is an open access article distributed under the terms and conditions of the Creative Commons Attribution (CC BY) license (http://creativecommons.org/licenses/by/4.0/).
Share and Cite
Sardari, F.; Paiement, A.; Hannuna, S.; Mirmehdi, M. VI-Net—View-Invariant Quality of Human Movement Assessment. Sensors 2020, 20, 5258. https://doi.org/10.3390/s20185258
Sardari F, Paiement A, Hannuna S, Mirmehdi M. VI-Net—View-Invariant Quality of Human Movement Assessment. Sensors. 2020; 20(18):5258. https://doi.org/10.3390/s20185258
Chicago/Turabian StyleSardari, Faegheh, Adeline Paiement, Sion Hannuna, and Majid Mirmehdi. 2020. "VI-Net—View-Invariant Quality of Human Movement Assessment" Sensors 20, no. 18: 5258. https://doi.org/10.3390/s20185258