Functionalized Fluorescent Silica Nanoparticles for Bioimaging of Cancer Cells

 ,
,  ,
,
Abstract
1. Introduction
2. Materials and Methods
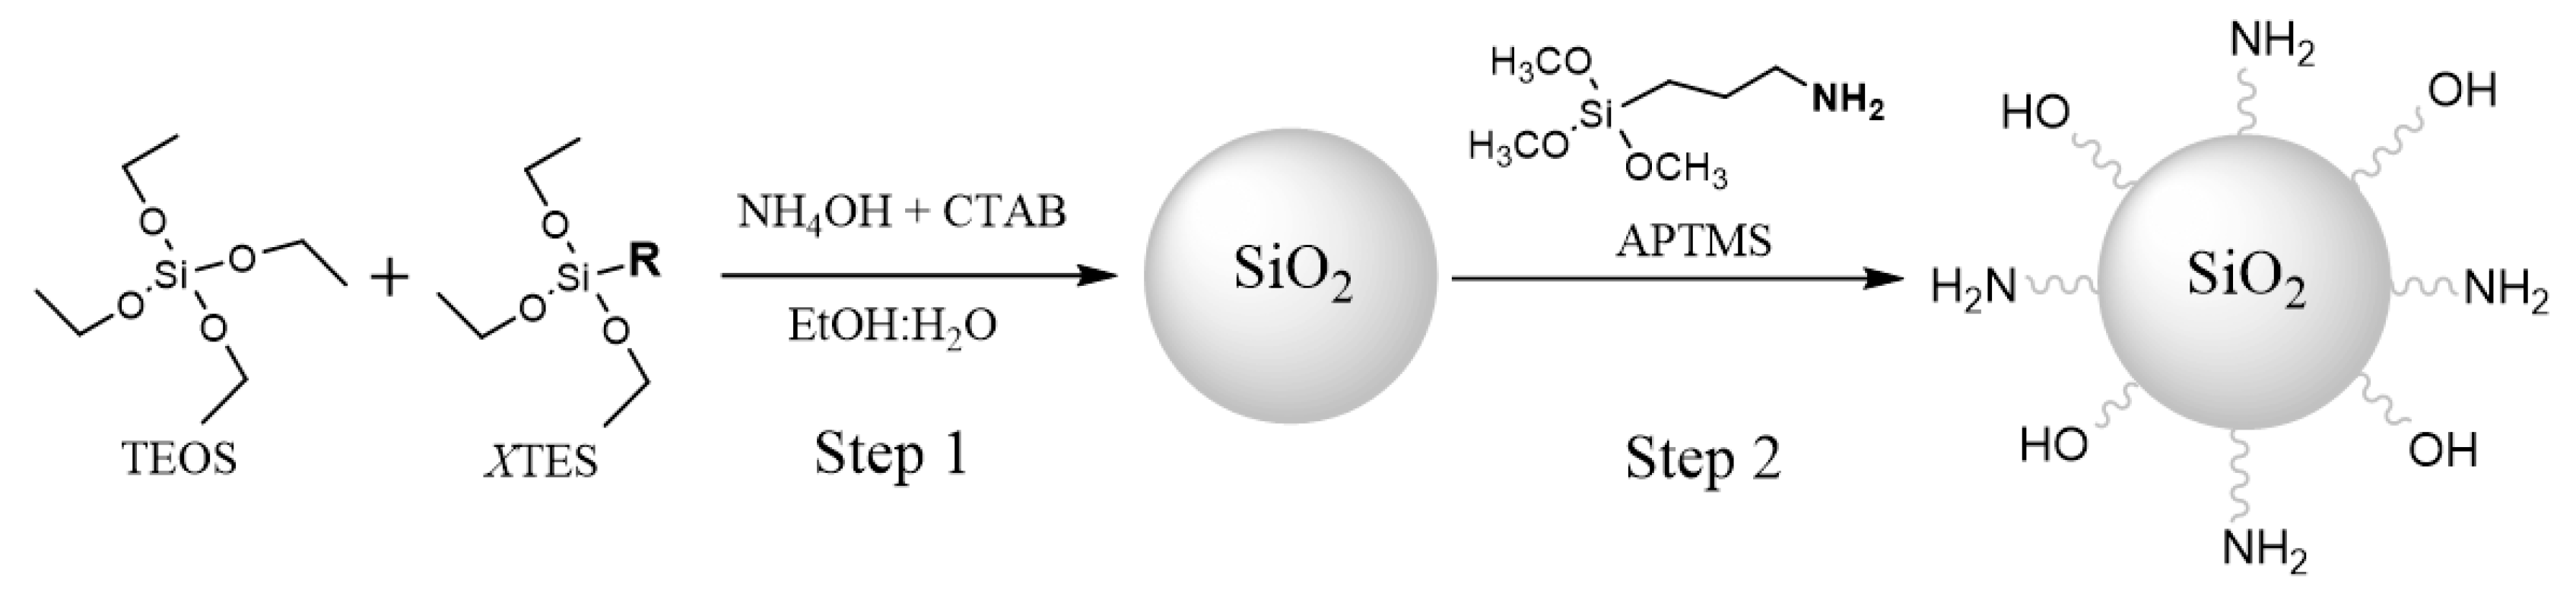
2.1. Synthesis of the Core-Shell Nanoparticles
2.2. Dye Encapsulation within the NP Core
2.3. Grafting of Molecules on NP Surface
2.4. Characterization
2.5. In Vitro Assays
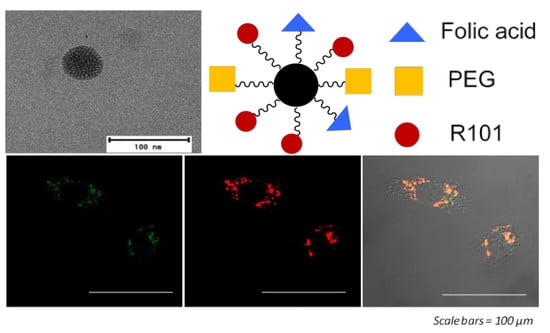
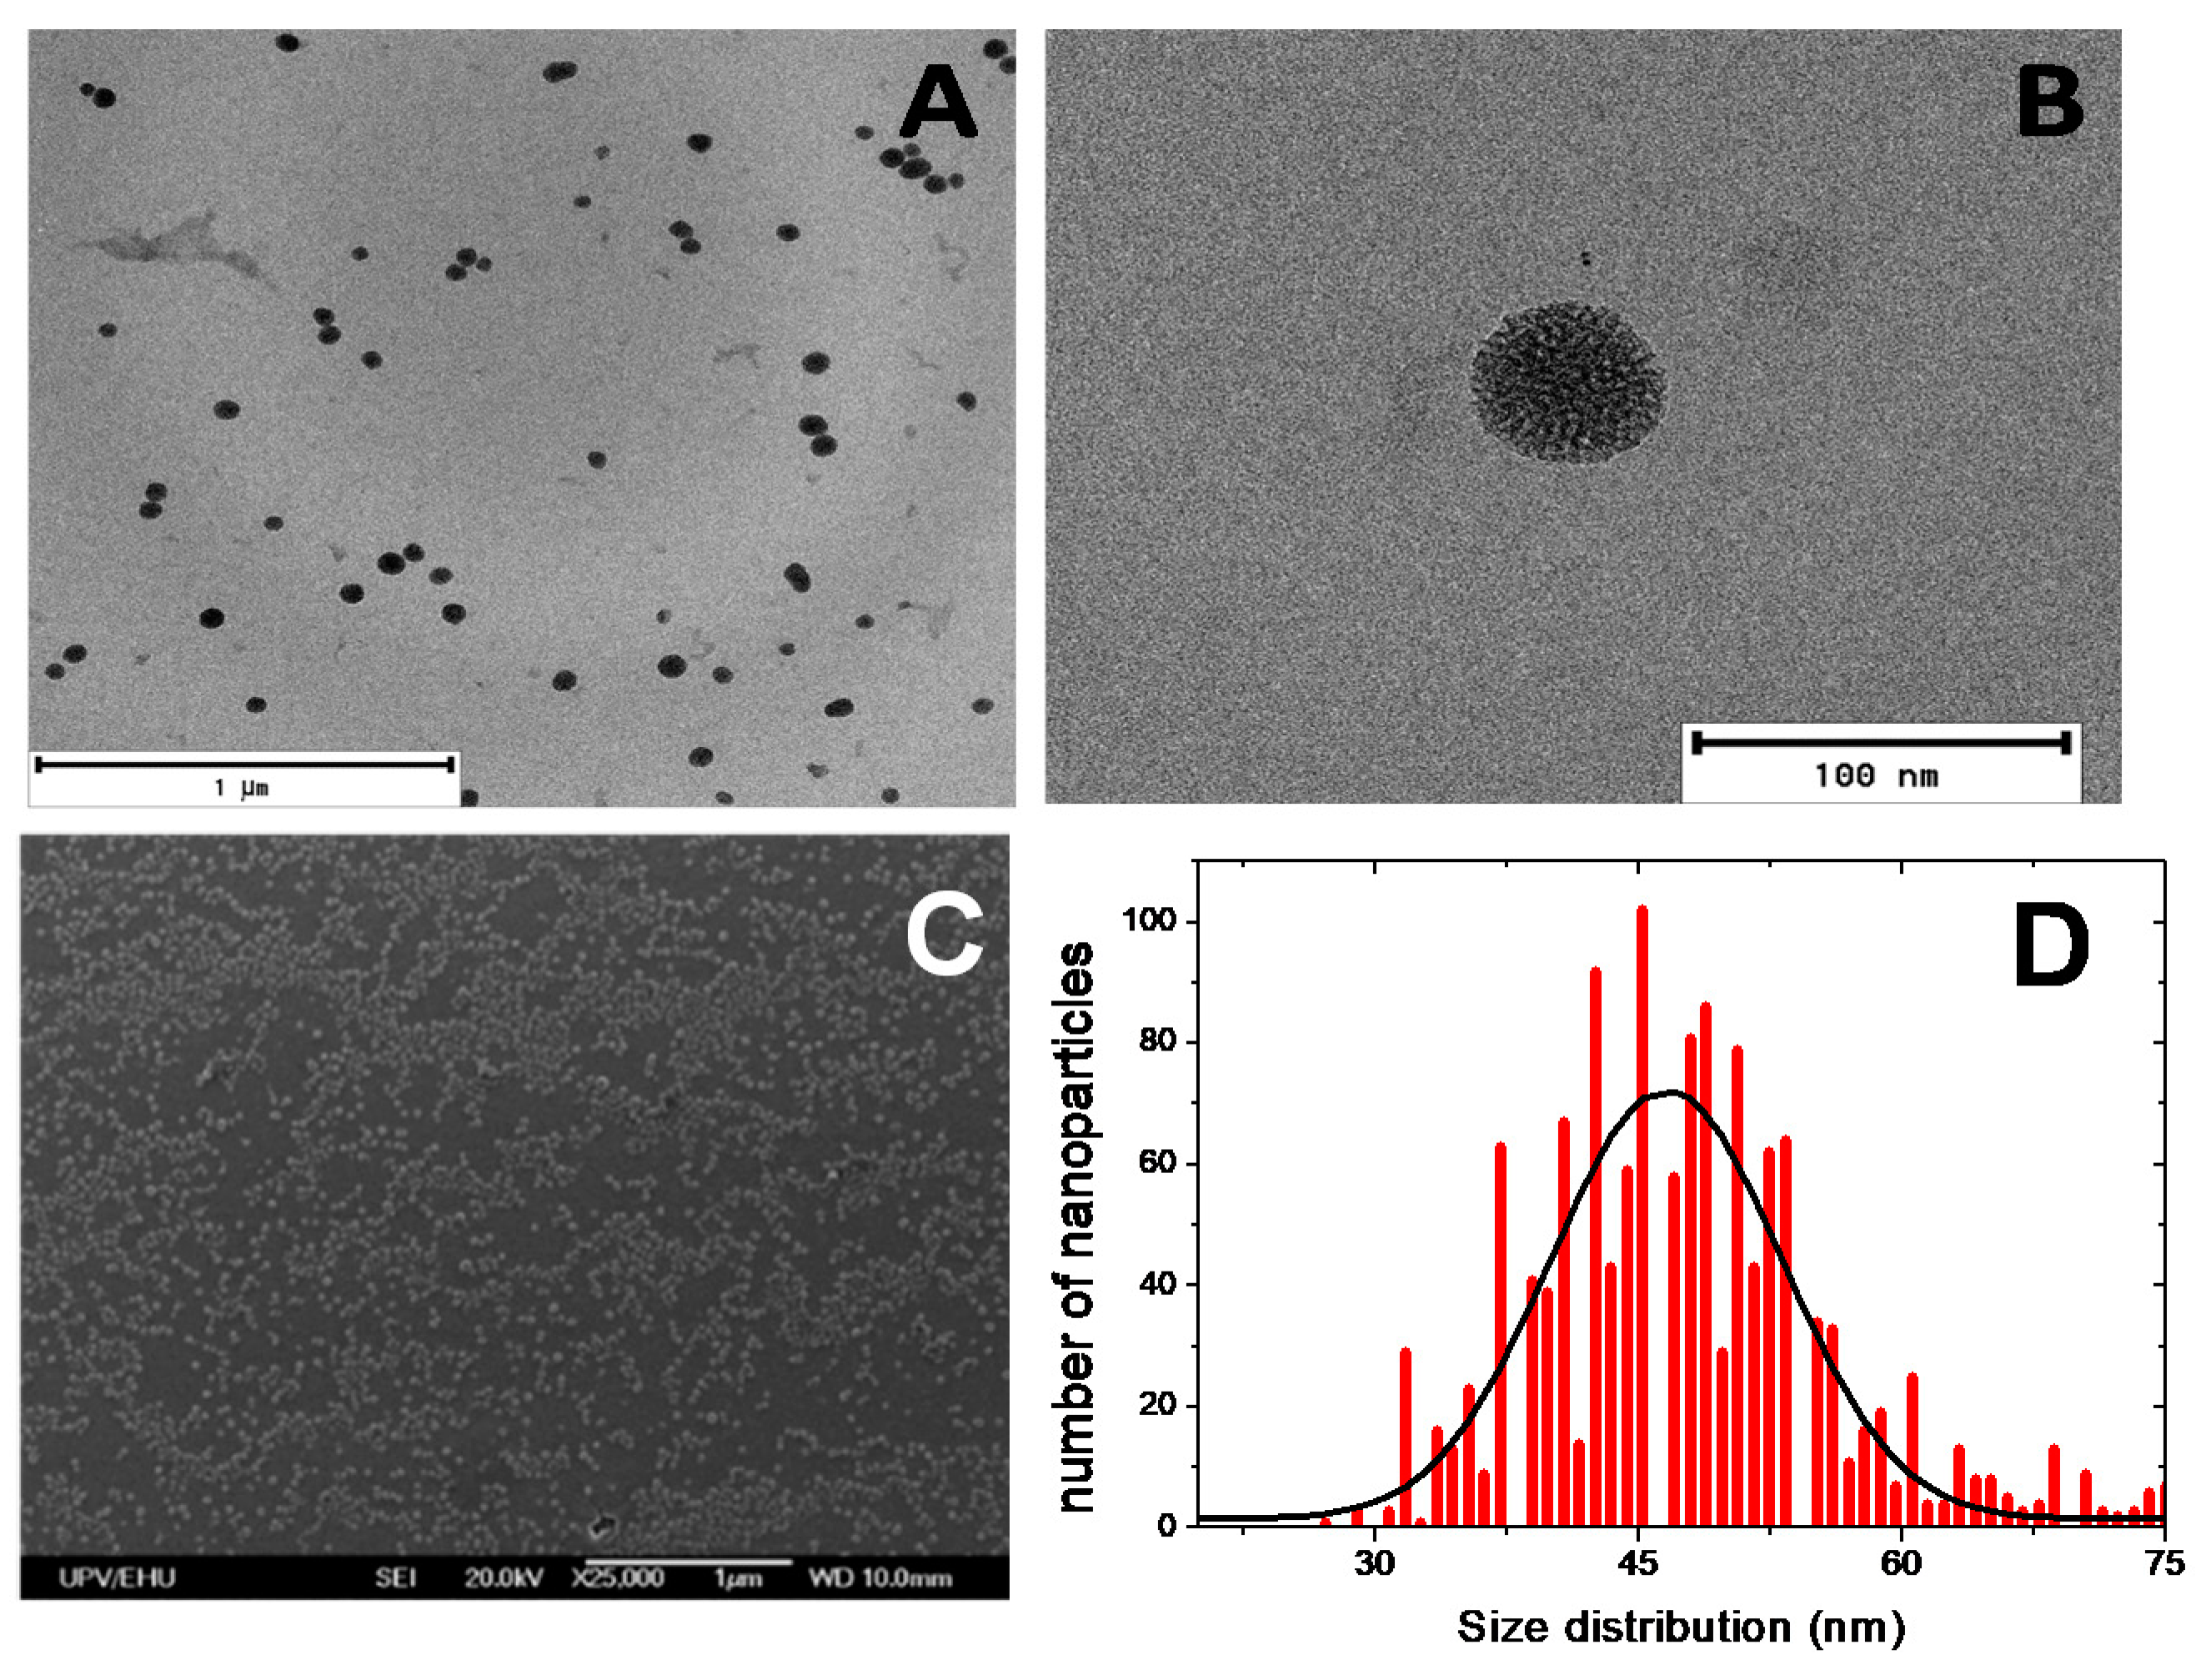
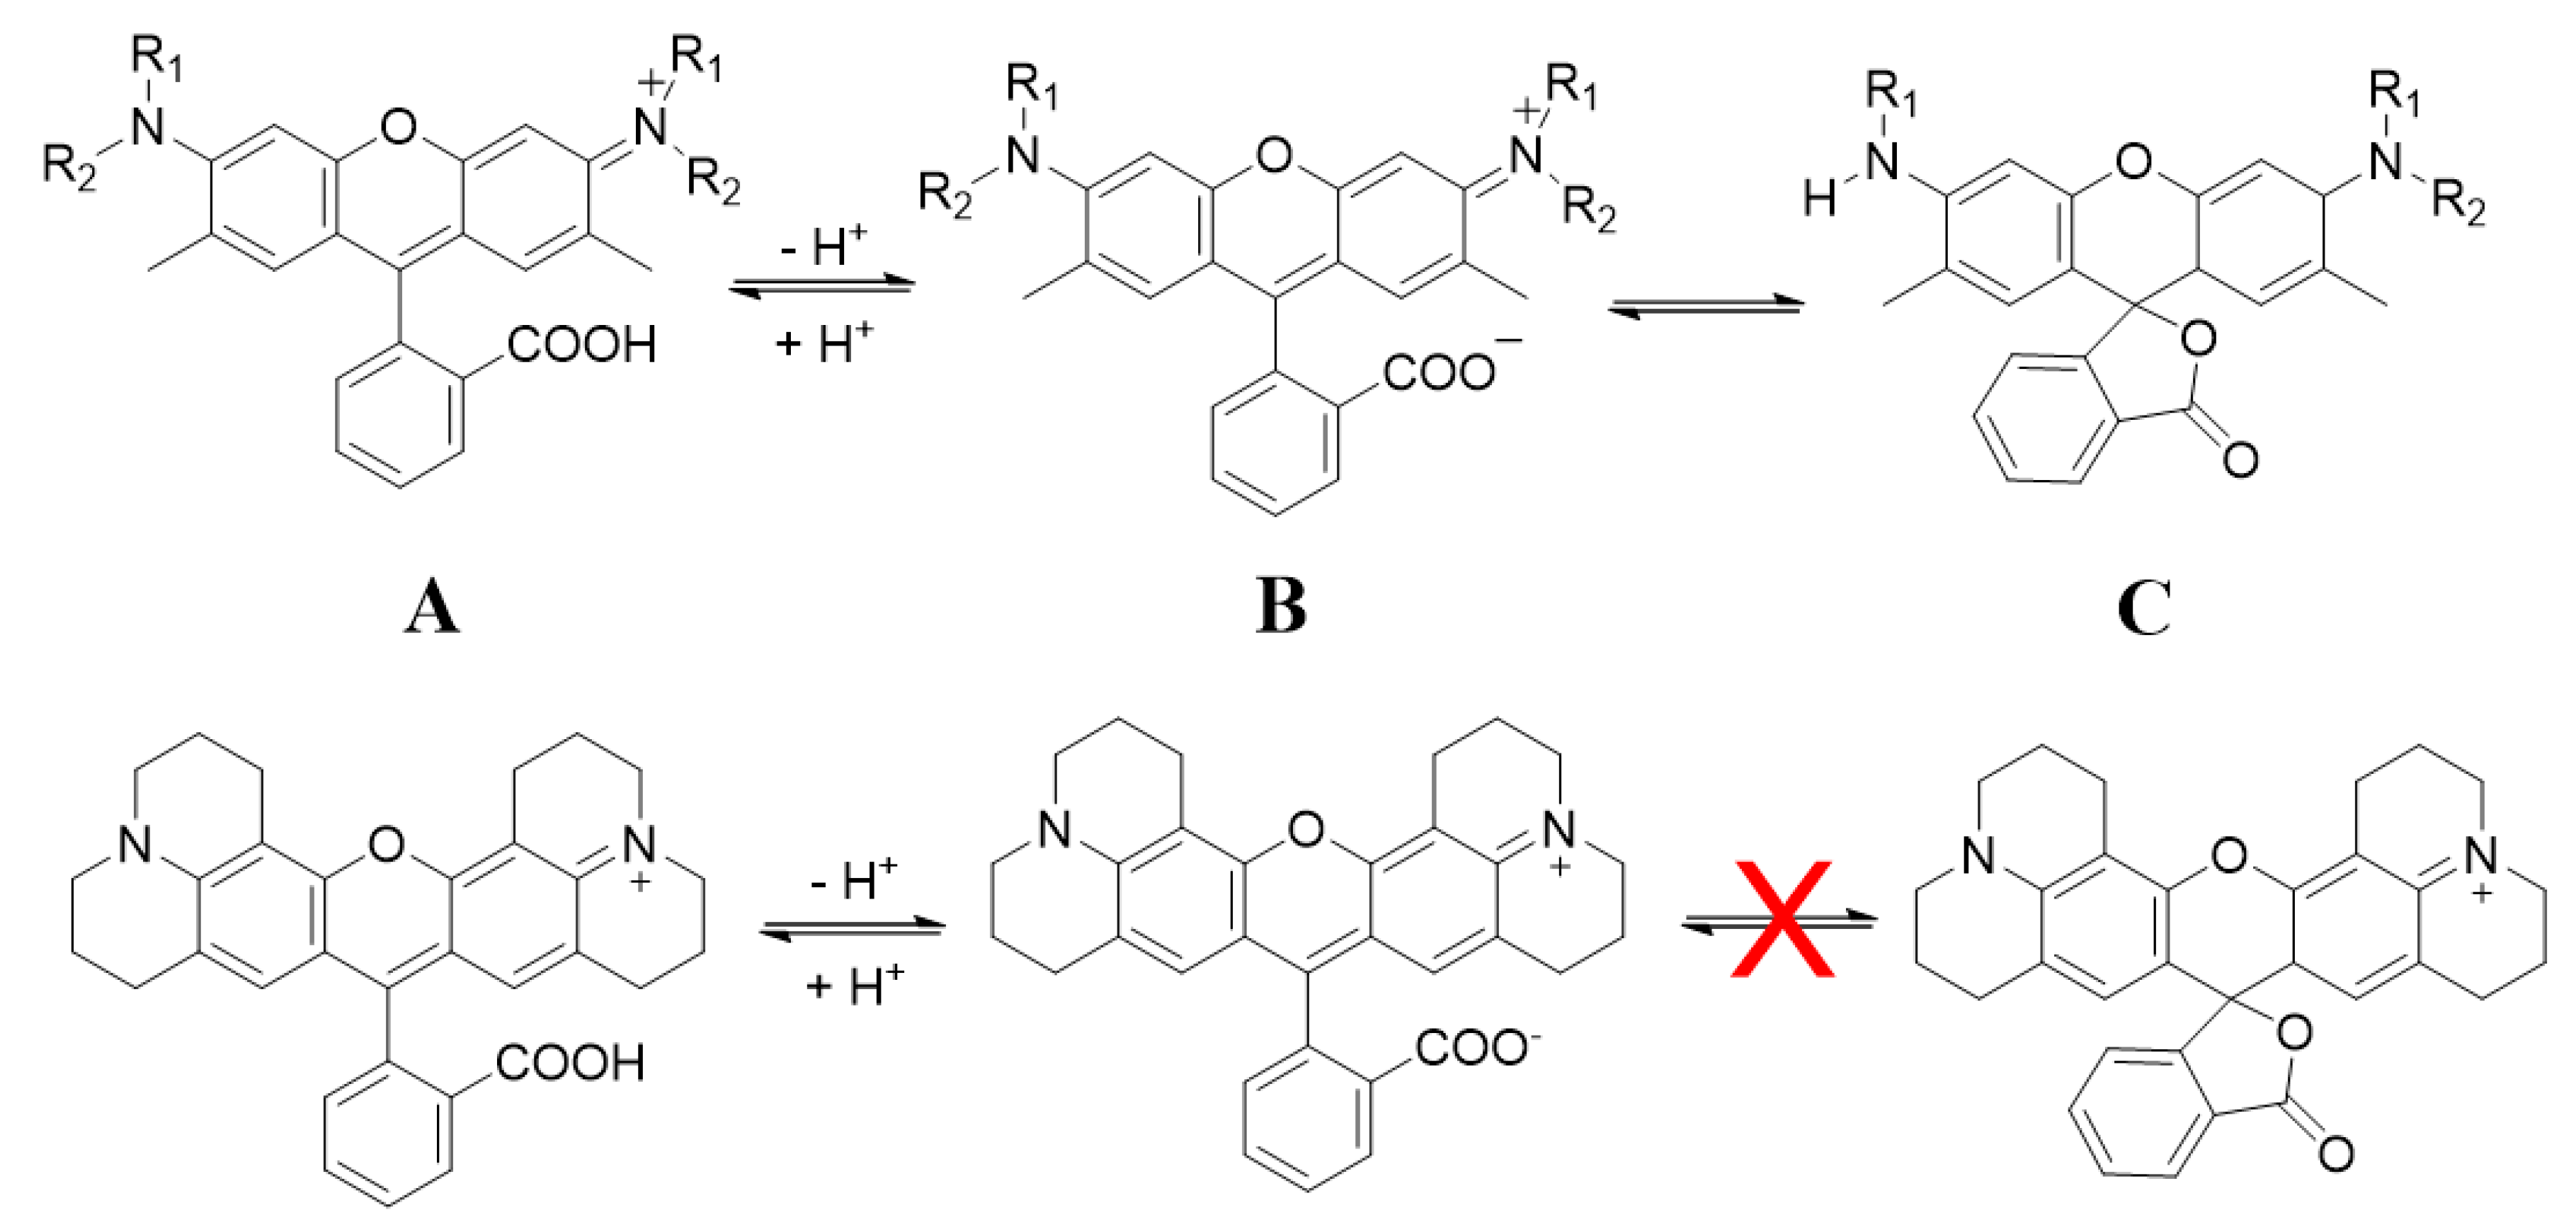
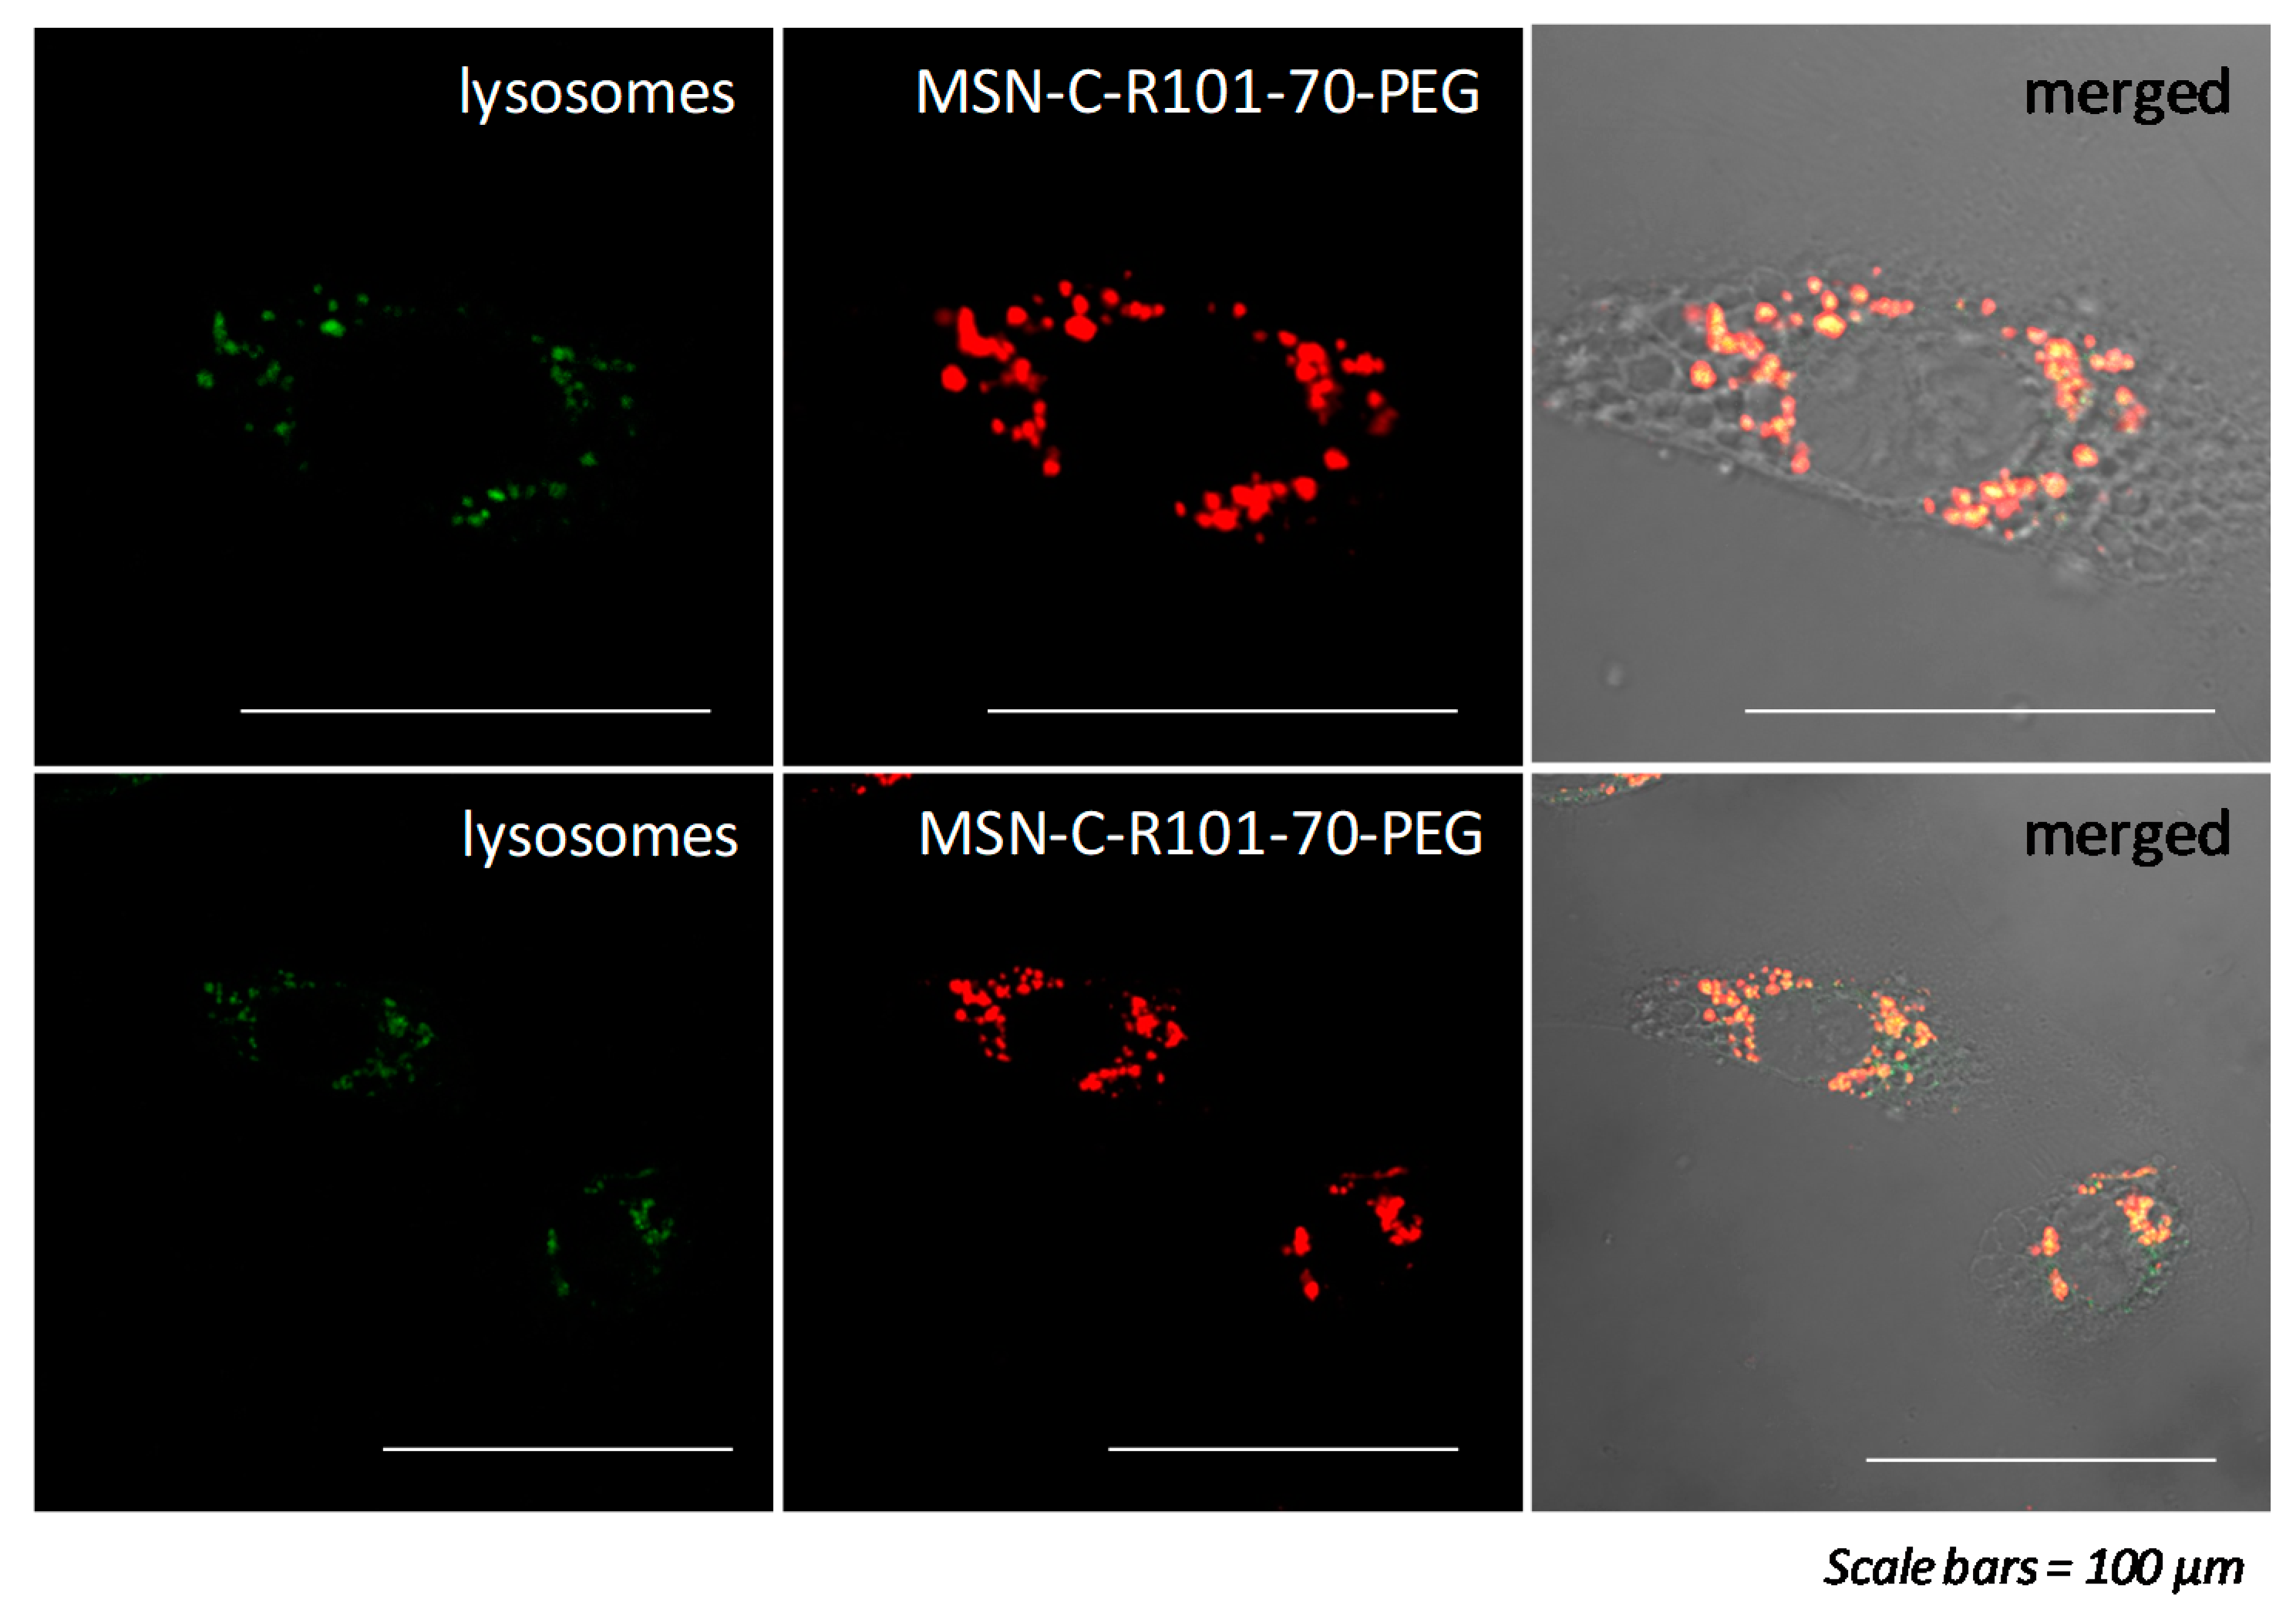
3. Results and Discussion
4. Conclusions
Supplementary Materials
Author Contributions
Funding
Acknowledgments
Conflicts of Interest
References
- Shewach, D.S.; Kuchta, R.D. Introduction to cancer chemotherapeutics. Chem. Rev. 2009, 109, 2859–2861. [Google Scholar] [CrossRef] [PubMed]
- Pérez-Herrero, E.; Fernández-Medarde, A. Advanced targeted therapies in cancer: Drug nanocarriers, the future of chemotherapy. Eur. J. Pharm. Biopharm. 2015, 93, 52–79. [Google Scholar] [CrossRef] [PubMed]
- Hassanpour, S.H.; Dehghani, M. Review of cancer from perspective of molecular. J. Cancer Res. Pract. 2017, 4, 127–129. [Google Scholar] [CrossRef]
- Chaturvedi, V.K.; Singh, A.; Singh, V.K.; Singh, M.P. Cancer Nanotechnology: A New Revolution for Cancer Diagnosis and Therapy. Curr. Drug Metab. 2018, 20, 416–429. [Google Scholar] [CrossRef]
- Eftekhari, A.; Hasanzadeh, M.; Sharifi, S.; Dizaj, S.M.; Khalilov, R.; Ahmadian, E. Bioassay of saliva proteins: The best alternative for conventional methods in non-invasive diagnosis of cancer. Int. J. Biol. Macromol. 2019, 124, 1246–1255. [Google Scholar] [CrossRef]
- Majer, M.; Knežević, Ž.; Popić, J.; Hršak, H.; Miljanić, S. Organ doses and associated cancer risks for computed tomography examinations of the thoracic region. Nucl. Technol. Radiat. Prot. 2018, 33, 100–105. [Google Scholar] [CrossRef]
- Singh, J.; Daftary, A. Iodinated contrast media and their adverse reactions. J. Nucl. Med. Technol. 2008, 36, 69–74. [Google Scholar] [CrossRef]
- Gauden, A.J.; Phal, P.M.; Drummond, K.J. MRI safety; Nephrogenic systemic fibrosis and other risks. J. Clin. Neurosci. 2010, 17, 1097–1104. [Google Scholar] [CrossRef]
- Marshall, J.; Martin, T.; Downie, J.; Malisza, K. A comprehensive analysis of MRI research risks: In support of full disclosure. Can. J. Neurol. Sci. 2007, 34, 11–17. [Google Scholar] [CrossRef]
- Robertson, T.; Bunel, F.; Roberts, M. Fluorescein Derivatives in Intravital Fluorescence Imaging. Cells 2013, 2, 591–606. [Google Scholar] [CrossRef] [PubMed]
- Singh, K.; Rotaru, A.M.; Beharry, A.A. Fluorescent Chemosensors as Future Tools for Cancer Biology. ACS Chem. Biol. 2018, 13, 1785–1798. [Google Scholar] [CrossRef] [PubMed]
- Zhu, S.; Tian, R.; Antaris, A.L.; Chen, X.; Dai, H. Near-Infrared-II Molecular Dyes for Cancer Imaging and Surgery. Adv. Mater. 2019, 31, 1–25. [Google Scholar] [CrossRef] [PubMed]
- Bui, H.T.; Mai, D.K.; Kim, B.; Choi, K.-H.; Park, B.J.; Kim, H.-J.; Cho, S. Effect of Substituents on the Photophysical Properties and Bioimaging Application of BODIPY Derivatives with Triphenylamine Substituents. J. Phys. Chem. B 2019, 123, 5601–5607. [Google Scholar] [CrossRef] [PubMed]
- Kolmakov, K.; Belov, V.N.; Bierwagen, J.; Ringemann, C.; Müller, V.; Eggeling, C.; Hell, S.W. Red-emitting rhodamine dyes for fluorescence microscopy and nanoscopy. Chem. A Eur. J. 2010, 16, 158–166. [Google Scholar] [CrossRef]
- Kalepu, S.; Nekkanti, V. Insoluble drug delivery strategies: Review of recent advances and business prospects. Acta Pharm. Sin. B 2015, 5, 442–453. [Google Scholar] [CrossRef]
- Mariam, J.; Sivakami, S.; Dongre, P.M. Albumin corona on nanoparticles–a strategic approach in drug delivery. Drug Deliv. 2016, 23, 2668–2676. [Google Scholar] [CrossRef]
- Manzano, M.; Vallet-Regí, M. Mesoporous silica nanoparticles in nanomedicine applications. J. Mater. Sci. Mater. Med. 2018, 29. [Google Scholar] [CrossRef]
- Blanco, E.; Shen, H.; Ferrari, M. Principles of nanoparticle design for overcoming biological barriers to drug delivery. Nat. Biotechnol. 2015, 33, 941–951. [Google Scholar] [CrossRef]
- Mirabello, V.; Calatayud, D.G.; Arrowsmith, R.L.; Ge, H.; Pascu, S.I. Metallic nanoparticles as synthetic building blocks for cancer diagnostics: From materials design to molecular imaging applications. J. Mater. Chem. B 2015, 3, 5657–5672. [Google Scholar] [CrossRef]
- Bobo, D.; Robinson, K.J.; Islam, J.; Thurecht, K.J.; Corrie, S.R. Nanoparticle-Based Medicines: A Review of FDA-Approved Materials and Clinical Trials to Date. Pharm. Res. 2016, 33, 2373–2387. [Google Scholar] [CrossRef]
- Zhuang, Y.; Zhao, L.; Zheng, L.; Hu, Y.; Ding, L.; Li, X.; Liu, C.; Zhao, J.; Shi, X.; Guo, R. LAPONITE-Polyethylenimine Based Theranostic Nanoplatform for Tumor-Targeting CT Imaging and Chemotherapy. ACS Biomater. Sci. Eng. 2017, 3, 431–442. [Google Scholar] [CrossRef]
- Alexis, F.; Pridgen, E.; Molnar, L.K.; Farokhzad, O.C. Factors affecting the clearance and biodistribution of polymeric nanoparticles. Mol. Pharm. 2008, 5, 505–515. [Google Scholar] [CrossRef] [PubMed]
- Mousa, M.; Evans, N.D.; Oreffo, R.O.C.; Dawson, J.I. Clay nanoparticles for regenerative medicine and biomaterial design: A review of clay bioactivity. Biomaterials 2018, 159, 204–214. [Google Scholar] [CrossRef] [PubMed]
- Rudramurthy, G.R.; Swamy, M.K. Potential applications of engineered nanoparticles in medicine and biology: An update. JBIC J. Biol. Inorg. Chem. 2018, 23, 1185–1204. [Google Scholar] [CrossRef]
- Conde, J.; Dias, J.T.; Grazú, V.; Moros, M.; Baptista, P.V.; de la Fuente, J.M. Revisiting 30 years of biofunctionalization and surface chemistry of inorganic nanoparticles for nanomedicine. Front. Chem. 2014, 2, 48. [Google Scholar] [CrossRef]
- Adumeau, L.; Genevois, C.; Roudier, L.; Schatz, C.; Couillaud, F.; Mornet, S. Impact of surface grafting density of PEG macromolecules on dually fluorescent silica nanoparticles used for the in vivo imaging of subcutaneous tumors. Biochim. Biophys. Acta Gen. Subj. 2017, 1861, 1587–1596. [Google Scholar] [CrossRef]
- Dawidczyk, C.M.; Kim, C.; Park, J.H.; Russell, L.M.; Lee, K.H.; Pomper, M.G.; Searson, P.C. State-of-the-art in design rules for drug delivery platforms: Lessons learned from FDA-approved nanomedicines. J. Control. Release 2014, 187, 133–144. [Google Scholar] [CrossRef]
- Ribeiro, T.; Prazeres, T.J.V.; Moffitt, M.; Farinha, J.P.S. Enhanced Photoluminescence from Micellar Assemblies of Cadmium Sulfide Quantum Dots and Gold Nanoparticles. J. Phys. Chem. C 2013, 117, 3122–3133. [Google Scholar] [CrossRef]
- Pérez, N.; Ruiz-Rubio, L.; Vilas, J.L.; Rodríguez, M.; Martinez-Martinez, V.; León, L.M. Synthesis and characterization of near-infrared fluorescent and magnetic iron zero-valent nanoparticles. J. Photochem. Photobiol. A Chem. 2016, 315, 1–7. [Google Scholar] [CrossRef]
- Jeevanandam, J.; Barhoum, A.; Chan, Y.S.; Dufresne, A.; Danquah, M.K. Review on nanoparticles and nanostructured materials: History, sources, toxicity and regulations. Beilstein J. Nanotechnol. 2018, 9, 1050–1074. [Google Scholar] [CrossRef]
- Malvindi, M.A.; Brunetti, V.; Vecchio, G.; Galeone, A.; Cingolani, R.; Pompa, P.P. SiO2 nanoparticles biocompatibility and their potential for gene delivery and silencing. Nanoscale 2012, 4, 486. [Google Scholar] [CrossRef] [PubMed]
- Wheeler, P.A.; Wang, J.; Baker, J.; Mathias, L.J. Synthesis and characterization of covalently functionalized laponite clay. Chem. Mater. 2005, 17, 3012–3018. [Google Scholar] [CrossRef]
- Epelde-Elezcano, N.; Prieto-Montero, R.; Martínez-Martínez, V.; Ortiz, M.J.; Prieto-Castañeda, A.; Peña-Cabrera, E.; Belmonte-Vázquez, J.L.; López-Arbeloa, I.; Brown, R.; Lacombe, S. Adapting BODIPYs to singlet oxygen production on silica nanoparticles. Phys. Chem. Chem. Phys. 2017, 19, 13746–13755. [Google Scholar] [CrossRef]
- Martins Estevão, B.; Miletto, I.; Marchese, L.; Gianotti, E. Optimized Rhodamine B labeled mesoporous silica nanoparticles as fluorescent scaffolds for the immobilization of photosensitizers: A theranostic platform for optical imaging and photodynamic therapy. Phys. Chem. Chem. Phys. 2016, 18, 9042–9052. [Google Scholar] [CrossRef]
- Ribeiro, T.; Raja, S.; Rodrigues, A.S.; Fernandes, F.; Farinha, J.P.S.; Baleizão, C. High performance NIR fluorescent silica nanoparticles for bioimaging. RSC Adv. 2013, 3, 9171. [Google Scholar] [CrossRef]
- Burns, A.; Ow, H.; Wiesner, U. Fluorescent core-shell silica nanoparticles: Towards “Lab on a Particle” architectures for nanobiotechnology. Chem. Soc. Rev. 2006, 35, 1028–1042. [Google Scholar] [CrossRef]
- Burns, A.A.; Vider, J.; Ow, H.; Here, E.; Oula, P.M.; Baumgart, M.; Larson, S.M.; Wiesner, U.; Bradbury, M. Fluorescent silica nanoparticles with efficient urinary excretion for nanomedicine. Nano Lett. 2009, 9, 442–448. [Google Scholar] [CrossRef]
- Tapec, R.; Zhao, X.J.; Tan, W. Development of Organic Dye-Doped Silica Nanoparticles for Bioanalysis and Biosensors. J. Nanosci. Nanotechnol. 2002, 2, 405–409. [Google Scholar] [CrossRef]
- Tavernaro, I.; Cavelius, C.; Peuschel, H.; Kraegeloh, A. Bright fluorescent silica-nanoparticle probes for high-resolution STED and confocal microscopy. Beilstein J. Nanotechnol. 2017, 8, 1283–1296. [Google Scholar] [CrossRef]
- Gubala, V.; Giovannini, G.; Kunc, F.; Monopoli, M.P.; Moore, C.J. Cancer Nanotechnology; Springer Vienna: Viena, Austria, 2020; pp. 1–43. [Google Scholar]
- Sokolov, I.; Naik, S. Novel fluorescent silica nanoparticles: Towards ultrabright silica nanoparticles. Small 2008, 4, 934–939. [Google Scholar] [CrossRef]
- Bonacchi, S.; Genovese, D.; Juris, R.; Montalti, M.; Prodi, L.; Rampazzo, E.; Zaccheroni, N. Luminescent silica nanoparticles: Extending the frontiers of brightness. Angew. Chemie Int. Ed. 2011, 50, 4056–4066. [Google Scholar] [CrossRef] [PubMed]
- Zhang, W.H.; Hu, X.X.; Zhang, X.B. Dye-doped fluorescent silica nanoparticles for live cell and in vivo bioimaging. Nanomaterials 2016, 6, 81. [Google Scholar] [CrossRef] [PubMed]
- Rampazzo, E.; Voltan, R.; Petrizza, L.; Zaccheroni, N.; Prodi, L.; Casciano, F.; Zauli, G.; Secchiero, P. Proper design of silica nanoparticles combines high brightness, lack of cytotoxicity and efficient cell endocytosis. Nanoscale 2013, 5, 7897–7905. [Google Scholar] [CrossRef] [PubMed]
- Jiao, L.; Song, F.; Zhang, B.; Ning, H.; Cui, J.; Peng, X. Improving the brightness and photostability of NIR fluorescent silica nanoparticles through rational fine-tuning of the covalent encapsulation methods. J. Mater. Chem. B 2017, 5, 5278–5283. [Google Scholar] [CrossRef]
- Ow, H.; Larson, D.R.; Srivastava, M.; Baird, B. a.; Webb, W.W.; Wiesnert, U. Bright and stable core-shell fluorescent silica nanoparticles. Nano Lett. 2005, 5, 113–117. [Google Scholar] [CrossRef]
- Gianotti, E.; MartinsEstevão, B.; Cucinotta, F.; Hioka, N.; Rizzi, M.; Renò, F.; Marchese, L. An efficient rose bengal based nanoplatform for photodynamic therapy. Chem. A Eur. J. 2014, 10921–10925. [Google Scholar] [CrossRef]
- Deng, T.; Li, J.S.; Jiang, J.H.; Shen, G.L.; Yu, R.Q. Preparation of near-IR fluorescent nanoparticles for fluorescence- anisotropy-based immunoagglutination assay in whole blood. Adv. Funct. Mater. 2006, 16, 2147–2155. [Google Scholar] [CrossRef]
- Shahabi, S.; Treccani, L.; Rezwan, K. A comparative study of three different synthesis routes for hydrophilic fluorophore-doped silica nanoparticles. J. Nanoparticle Res. 2016, 18, 1–13. [Google Scholar] [CrossRef]
- Auger, A.; Samuel, J.; Poncelet, O.; Raccurt, O. A comparative study of non-covalent encapsulation methods for organic dyes into silica nanoparticles. Nanoscale Res. Lett. 2011, 6, 328. [Google Scholar] [CrossRef]
- Wang, L.; Du, W.; Hu, Z.; Uvdal, K.; Li, L.; Huang, W. Hybrid Rhodamine Fluorophores in the Visible/NIR Region for Biological Imaging. Angew. Chemie Int. Ed. 2019, 58, 14026–14043. [Google Scholar] [CrossRef]
- Manzano, M.; Vallet-Regí, M. Mesoporous Silica Nanoparticles for Drug Delivery. Adv. Funct. Mater. 2020, 30, 1902634. [Google Scholar] [CrossRef]
- Santiago, A.M.; Ribeiro, T.; Rodrigues, A.S.; Ribeiro, B.; Frade, R.F.M.; Baleizão, C.; Farinha, J.P.S. Multifunctional Hybrid Silica Nanoparticles with a Fluorescent Core and Active Targeting Shell for Fluorescence Imaging Biodiagnostic Applications. Eur. J. Inorg. Chem. 2015, 2015, 4579–4587. [Google Scholar] [CrossRef]
- Peerzade, S.A.M.A.; Qin, X.; Laroche, F.J.F.; Palantavida, S.; Dokukin, M.; Peng, B.; Feng, H.; Sokolov, I. Ultrabright fluorescent silica nanoparticles for: In vivo targeting of xenografted human tumors and cancer cells in zebrafish. Nanoscale 2019, 11, 22316–22327. [Google Scholar] [CrossRef]
- Ma, K.; Zhang, D.; Cong, Y.; Wiesner, U. Elucidating the Mechanism of Silica Nanoparticle PEGylation Processes Using Fluorescence Correlation Spectroscopies. Chem. Mater. 2016, 28, 1537–1545. [Google Scholar] [CrossRef]
- Vijay Fernández, M.; Javaida, F.; Chudasama, V. Advances in targeting the folate receptor in thetreatment/imaging of cancers. Chem. Sci. 2018, 9, 790–810. [Google Scholar] [CrossRef]
- Stallivieri, A.; Baros, F.; Jetpisbayeva, G.; Myrzakhmetov, B.; Frochot, C. The Interest of Folic Acid in Targeted Photodynamic Therapy. Curr. Med. Chem. 2015, 22, 3185–3207. [Google Scholar] [CrossRef]
- Yang, H.; Lou, C.; Xu, M.; Wu, C.; Miyoshi, H.; Liu, Y. Investigation of folate-conjugated fluorescent silica nanoparticles for targeting delivery to folate receptor-positive tumors and their internalization mechanism. Int. J. Nanomedicine 2011, 6, 2023–2032. [Google Scholar] [CrossRef]
- Mamaeva, V.; Sahlgren, C.; Lindén, M. Mesoporous silica nanoparticles in medicine-Recent advances. Adv. Drug Deliv. Rev. 2013, 65, 689–702. [Google Scholar] [CrossRef]
- Yoo, J.; Park, C.; Yi, G.; Lee, D.; Koo, H. Active targeting strategies using biological ligands for nanoparticle drug delivery systems. Cancers 2019, 11, 640. [Google Scholar] [CrossRef]
- Qian, J.; Li, X.; Wei, M.; Gao, X.; Xu, Z.; He, S. Bio-molecule-conjugated fluorescent organically modified silica nanoparticles as optical probes for cancer cell imaging. Opt. Express 2008, 16, 19568–19578. [Google Scholar] [CrossRef]
- Lu, J.; Liong, M.; Li, Z.; Zink, J.I.; Tamanoi, F. Biocompatibility, biodistribution, and drug-delivery efficiency of mesoporous silica nanoparticles for cancer therapy in animals. Small 2010, 6, 1794–1805. [Google Scholar] [CrossRef]
- Liong, M.; Lu, J.; Kovochich, M.; Xia, T.; Ruehm, S.G.; Nel, A.E.; Tamanoi, F.; Zink, J.I. Multifunctional inorganic nanoparticles for imaging, targeting, and drug delivery. ACS Nano 2008, 2, 889–896. [Google Scholar] [CrossRef] [PubMed]
- Cotí, K.K.; Belowich, M.E.; Liong, M.; Ambrogio, M.W.; Lau, Y.A.; Khatib, H.A.; Zink, J.I.; Khashab, N.M.; Stoddart, J.F. Mechanised nanoparticles for drug delivery. Nanoscale 2009, 1, 16–39. [Google Scholar] [CrossRef] [PubMed]
- Castillo, R.R.; Vallet-Regí, M. Functional mesoporous silica nanocomposites: Biomedical applications and biosafety. Int. J. Mol. Sci. 2019, 20, 929. [Google Scholar] [CrossRef] [PubMed]
- Son, J.; Yang, S.M.; Yi, G.; Roh, Y.J.; Park, H.; Park, J.M.; Choi, M.; Koo, H. Folate-modified PLGA nanoparticles for tumor-targeted delivery of pheophorbide a in vivo. Biochem. Biophys. Res. Commun. 2018, 498, 523–528. [Google Scholar] [CrossRef]
- Vallet-Regí, M.; Colilla, M.; Izquierdo-Barba, I.; Manzano, M. Mesoporous silica nanoparticles for drug delivery: Current insights. Molecules 2018, 23, 47. [Google Scholar] [CrossRef]
- Cheng, S.-H.; Lee, C.-H.; Yang, C.-S.; Tseng, F.-G.; Mou, C.-Y.; Lo, L.-W. Mesoporous silica nanoparticles functionalized with an oxygen-sensing probe for cell photodynamic therapy: Potential cancer theranostics. J. Mater. Chem. 2009, 19, 1252. [Google Scholar] [CrossRef]
- Lin, Y.; Haynes, C.L. Impacts of Mesoporous Silica Nanoparticle Size, Pore Ordering, and Pore Integrity on Hemolytic Activity. J. Am. Chem. Soc. 2010, 132, 4834–4842. [Google Scholar] [CrossRef]
- Stöber, W.; Fink, A.; Bohn, E. Controlled growth of monodisperse silica spheres in the micron size range. J. Colloid Interface Sci. 1968, 26, 62–69. [Google Scholar] [CrossRef]
- Mai, W.X.; Meng, H. Mesoporous silica nanoparticles: A multifunctional nano therapeutic system. Integr. Biol. 2013, 5, 19–28. [Google Scholar] [CrossRef]
- Zhang, X.F.; Zhang, Y.; Liu, L. Fluorescence lifetimes and quantum yields of ten rhodamine derivatives: Structural effect on emission mechanism in different solvents. J. Lumin. 2014, 145, 448–453. [Google Scholar] [CrossRef]
- Magde, D.; Rojas, G.E.; Seybold, P.G. Solvent dependence of the fluorescence lifetimes of xanthene dyes. Photochem. Photobiol. 1999, 70, 737–744. [Google Scholar] [CrossRef]
- López Arbeloa, T.; López Arbeloa, F.; Hernández Bartolomé, P.; López Arbeloa, I. On the mechanism of radiationless deactivation of rhodamines. Chem. Phys. 1992, 160, 123–130. [Google Scholar] [CrossRef]
- Cazade, P.A.; Bordat, P.; Blanc, S.; Baraille, I.; Brown, R. Possible artifacts of fluorescence of dyes in concentrated materials: Comment on “highly fluorescent rhodamine B nanoparticles entrapped in hybrid glasses”. Langmuir 2008, 24, 2252–2257. [Google Scholar] [CrossRef]
- Cho, E.B.; Volkov, D.O.; Sokolov, I. Ultrabright fluorescent silica mesoporous silica nanoparticles: Control of particle size and dye loading. Adv. Funct. Mater. 2011, 21, 3129–3135. [Google Scholar] [CrossRef]
- Medintz, I.L.; Uyeda, H.T.; Goldman, E.R.; Mattoussi, H. Quantum dot bioconjugates for imaging, labelling and sensing. Nat. Mater. 2005, 4, 435–446. [Google Scholar] [CrossRef]
- Resch-Genger, U.; Grabolle, M.; Cavaliere-Jaricot, S.; Nitschke, R.; Nann, T. Quantum dots versus organic dyes as fluorescent labels. Nat. Methods 2008, 5, 763–775. [Google Scholar] [CrossRef]
- Vlachy, N.; Touraud, D.; Heilmann, J.; Kunz, W. Determining the cytotoxicity of catanionic surfactant mixtures on HeLa cells. Colloids Surfaces B Biointerfaces 2009, 70, 278–280. [Google Scholar] [CrossRef]
- Hwang, T.L.; Sung, C.T.; Aljuffali, I.A.; Chang, Y.T.; Fang, J.Y. Cationic surfactants in the form of nanoparticles and micelles elicit different human neutrophil responses: A toxicological study. Colloids Surfaces B Biointerfaces 2014, 114, 334–341. [Google Scholar] [CrossRef]
- Connor, E.E.; Mwamuka, J.; Gole, A.; Murphy, C.J.; Wyatt, M.D. Gold nanoparticles are taken up by human cells but do not cause acute cytotoxicity. Small 2005, 1, 325–327. [Google Scholar] [CrossRef]
- Jafari, S.; Derakhshankhah, H.; Alaei, L.; Fattahi, A.; Varnamkhasti, B.S.; Saboury, A.A. Mesoporous silica nanoparticles for therapeutic/diagnostic applications. Biomed. Pharmacother. 2019, 109, 1100–1111. [Google Scholar] [CrossRef]
- Bakhshian Nik, A.; Zare, H.; Razavi, S.; Mohammadi, H.; Torab Ahmadi, P.; Yazdani, N.; Bayandori, M.; Rabiee, N.; Izadi Mobarakeh, J. Smart drug delivery: Capping strategies for mesoporous silica nanoparticles. Microporous Mesoporous Mater. 2020, 299, 110115. [Google Scholar] [CrossRef]
- Off, M.K.; Steindal, A.E.; Porojnicu, A.C.; Juzeniene, A.; Vorobey, A.; Johnsson, A.; Moan, J. Ultraviolet photodegradation of folic acid. J. Photochem. Photobiol. B Biol. 2005, 80, 47–55. [Google Scholar] [CrossRef]
- Kruger, C.A.; Abrahamse, H. Utilisation of targeted nanoparticle photosensitiser drug delivery systems for the enhancement of photodynamic therapy. Molecules 2018, 23, 2628. [Google Scholar] [CrossRef]
- Salazar, M.D.A.; Ratnam, M. The folate receptor: What does it promise in tissue-targeted therapeutics? Cancer Metastasis Rev. 2007, 26, 141–152. [Google Scholar] [CrossRef]
- Kamen, B.A.; Capdevila, A. Receptor-mediated folate accumulation is regulated by the cellular folate content. Proc. Natl. Acad. Sci. USA 1986, 83, 5983–5987. [Google Scholar] [CrossRef]
- Luhrs, C.A.; Slomiany, B.L. A human membrane-associated folate binding protein is anchored by a glycosyl-phosphatidylinositol tail. J. Biol. Chem. 1989, 264, 21446–21449. [Google Scholar]
- Hilgenbrink, A.R.; Low, P.S. Folate receptor-mediated drug targeting: From therapeutics to diagnostics. J. Pharm. Sci. 2005, 94, 2135–2146. [Google Scholar] [CrossRef]


| Name | Silica Source | Size (nm) |
|---|---|---|
| MSN | TEOS | 47 ± 10 |
| M1-ONP | TEOS:MTES (1:0.1) | 44 ± 16 |
| M2-ONP | TEOS:MTES (1:0.5) | 38 ± 7 |
| M3-ONP | TEOS:MTES (1:1) | 39 ± 18 |
| V1-ONP | TEOS:VTES (1:0.1) | 42 ± 7 |
| V2-ONP | TEOS:VTES (1:1) | 40 ± 9 |
| P1-ONP | TEOS:PTES (1:0.1) | 47 ± 10 |
| P2-ONP | TEOS:PTES (1:1) | 49 ± 18 |
| O1-ONP | TEOS:OTES (1:0.1) | - |
| O2-ONP | TEOS:OTES (1:1) | - |
| Sample | Mixture | Ratio | T (°C) | [Dye]0 (M) | Size (nm) | Dye (μmol/g) |
|---|---|---|---|---|---|---|
| MSN-C-R101-60 | TEOS | 1:0 | 60 | 5·10−4 | 47 ± 9 | 0.56 |
| M-ONP-R101-60 | TEOS:MTES | 1:1 | 60 | 5·10−4 | 54 ± 8 | 0.81 |
| V-ONP-R101-60 | TEOS:VTES | 1:1 | 60 | 5·10−4 | 29 ± 5 | 0.96 |
| P-ONP-R101-60 | TEOS:PTES | 1:1 | 60 | 5·10−4 | 39 ± 7 | 0.94 |
| MSN-C-R101-70 | TEOS | 1:0 | 70 | 2.5·10−3 | 60 ± 9 | 9.98 |
| M-ONP-R101-70 | TEOS:MTES | 1:1 | 70 | 2.5·10−3 | 58 ± 11 | 7.54 |
| V-ONP-R101-70 | TEOS:VTES | 1:1 | 70 | 2.5·10−3 | 63 ± 14 | 4.21 |
| MSN-C-R101-80 | TEOS | 1:0 | 80 | 5·10−3 | 541 ± 73 | 11.4 |
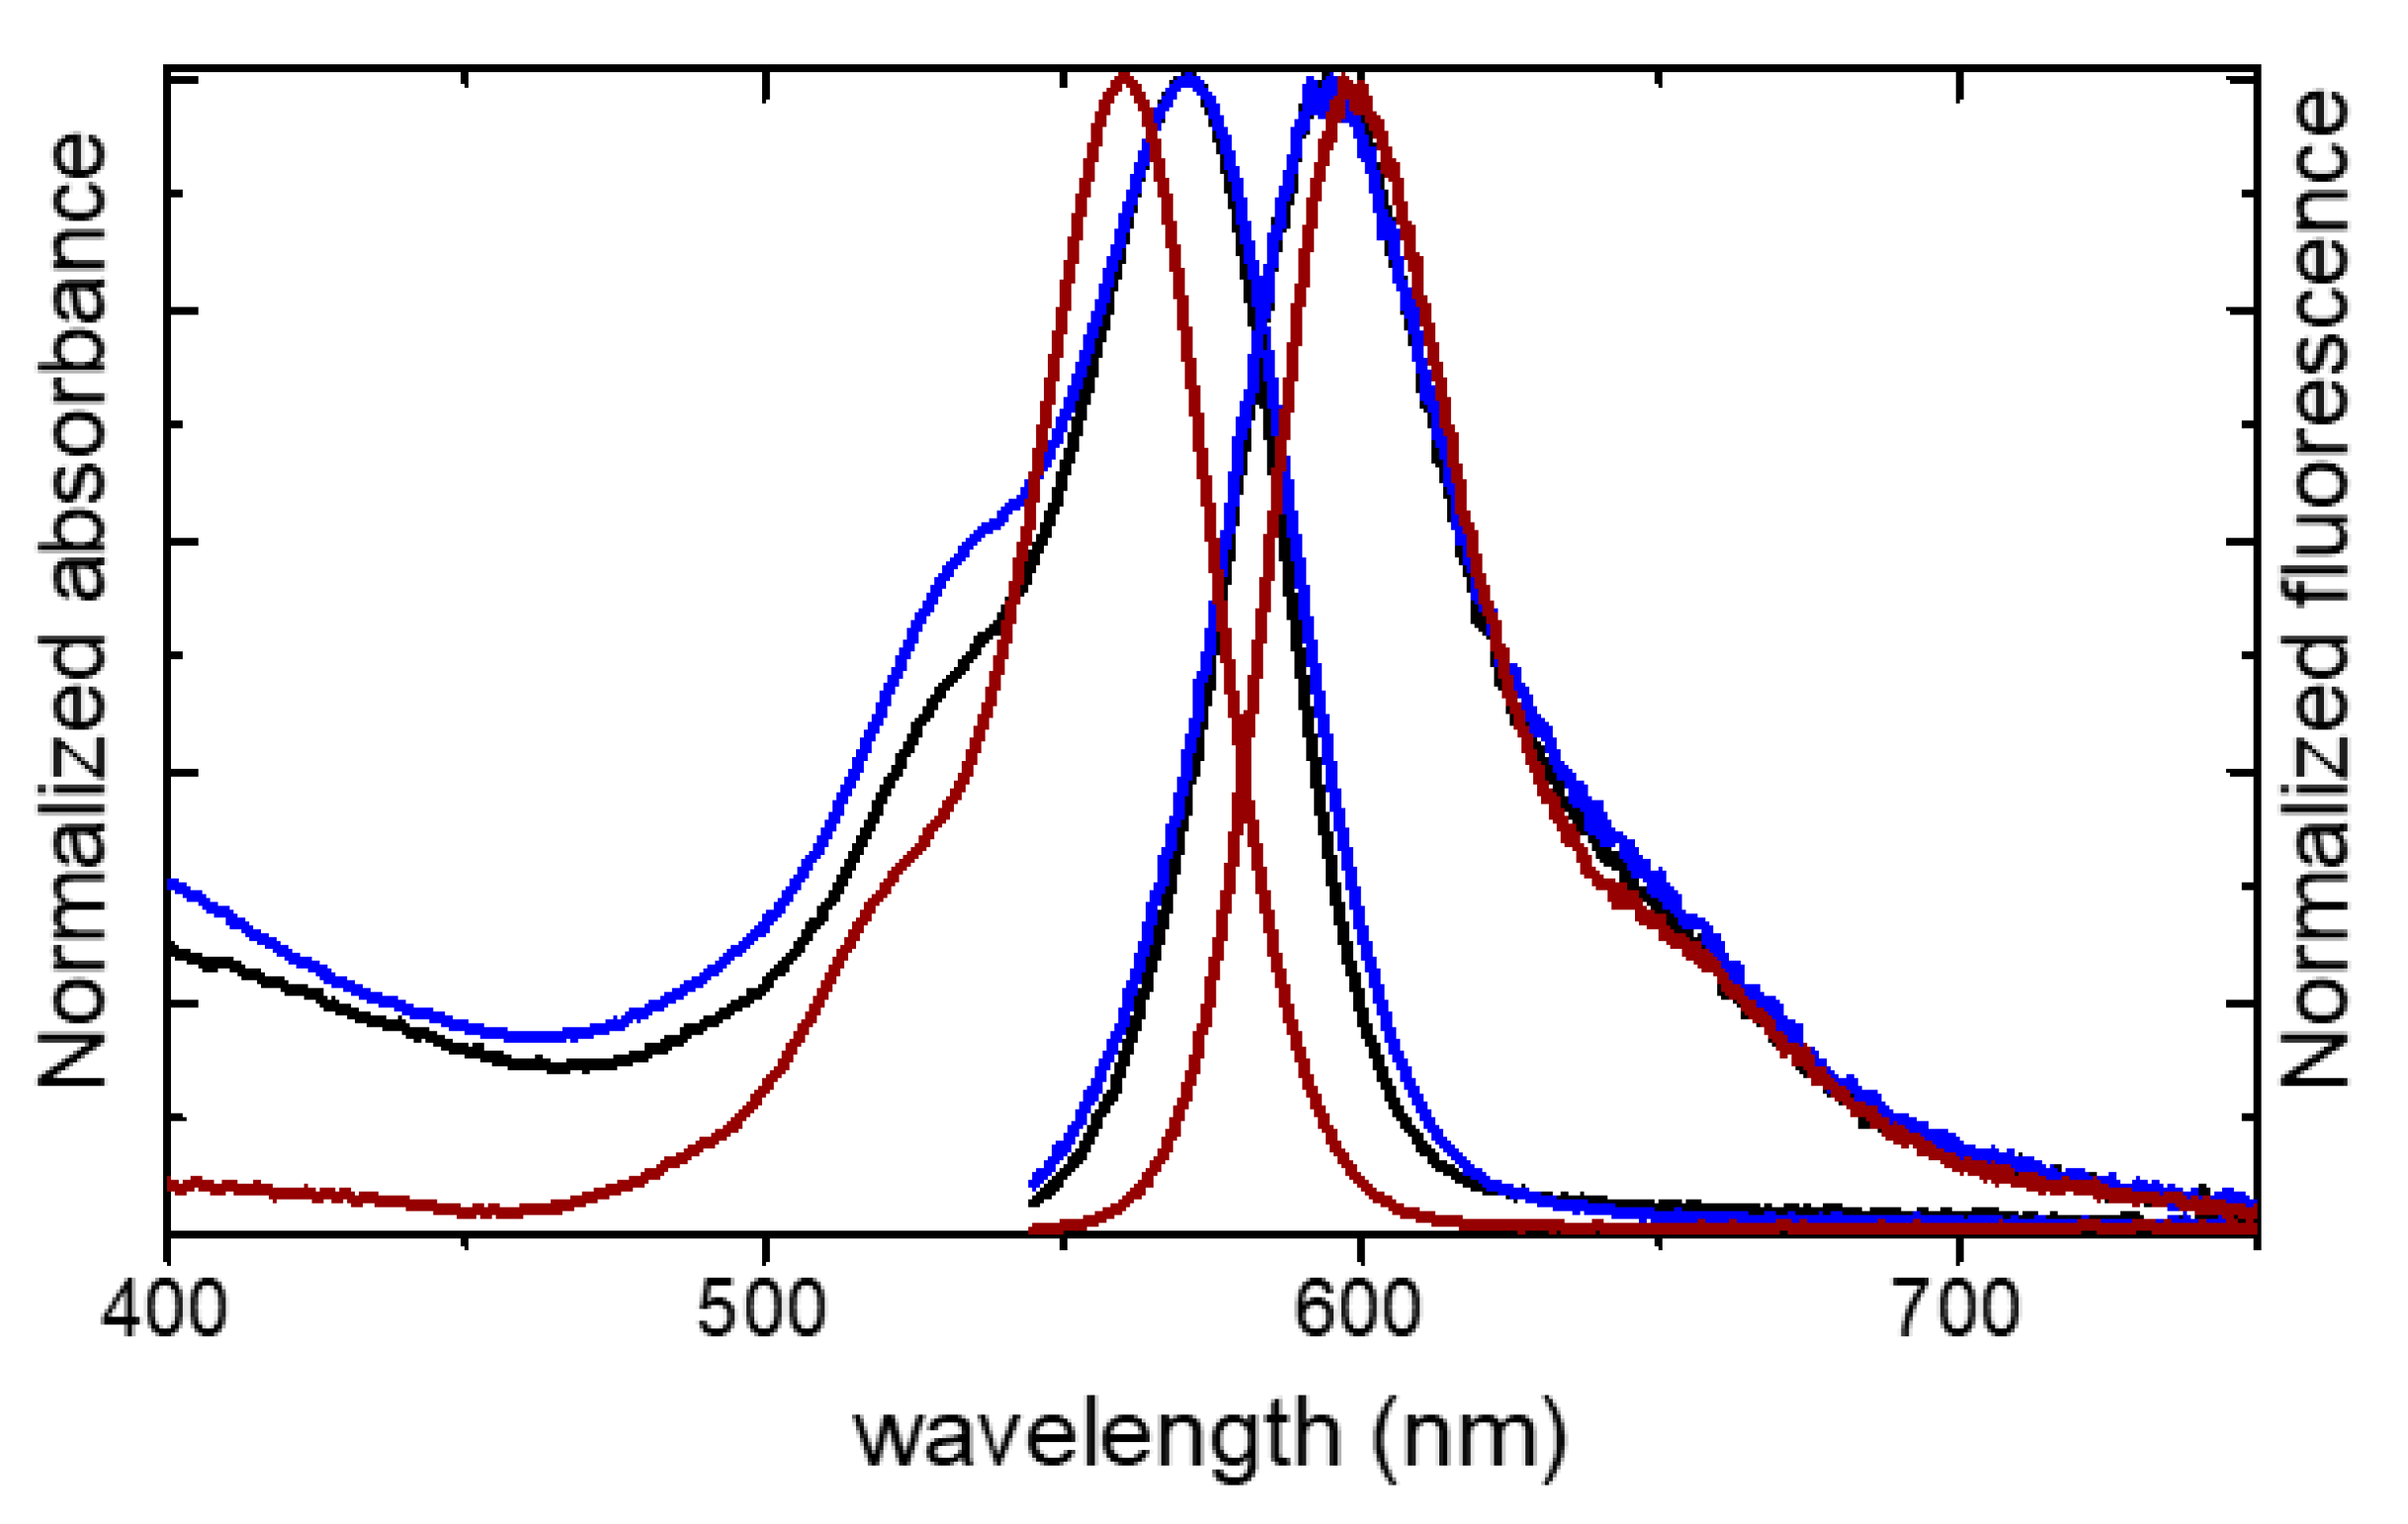
| Sample | DLS (nm) | Zpot (mV) | λab | λfl | Φfl | Brightness |
|---|---|---|---|---|---|---|
| MSN-C-R101-70 | 60 | −4.0 | - | - | - | - |
| MSN-C-R101-70-PEG | 69 | −21.0 | 572.0 | 594.0 | 0.51 | 230 |
| MSN-S-R101-60-PEG | 64 | −23.0 | 571.0 | 595.0 | 0.25 | 260 |
| R101 in water | - | - | 560.0 | 597.0 | 0.77 | 1 |
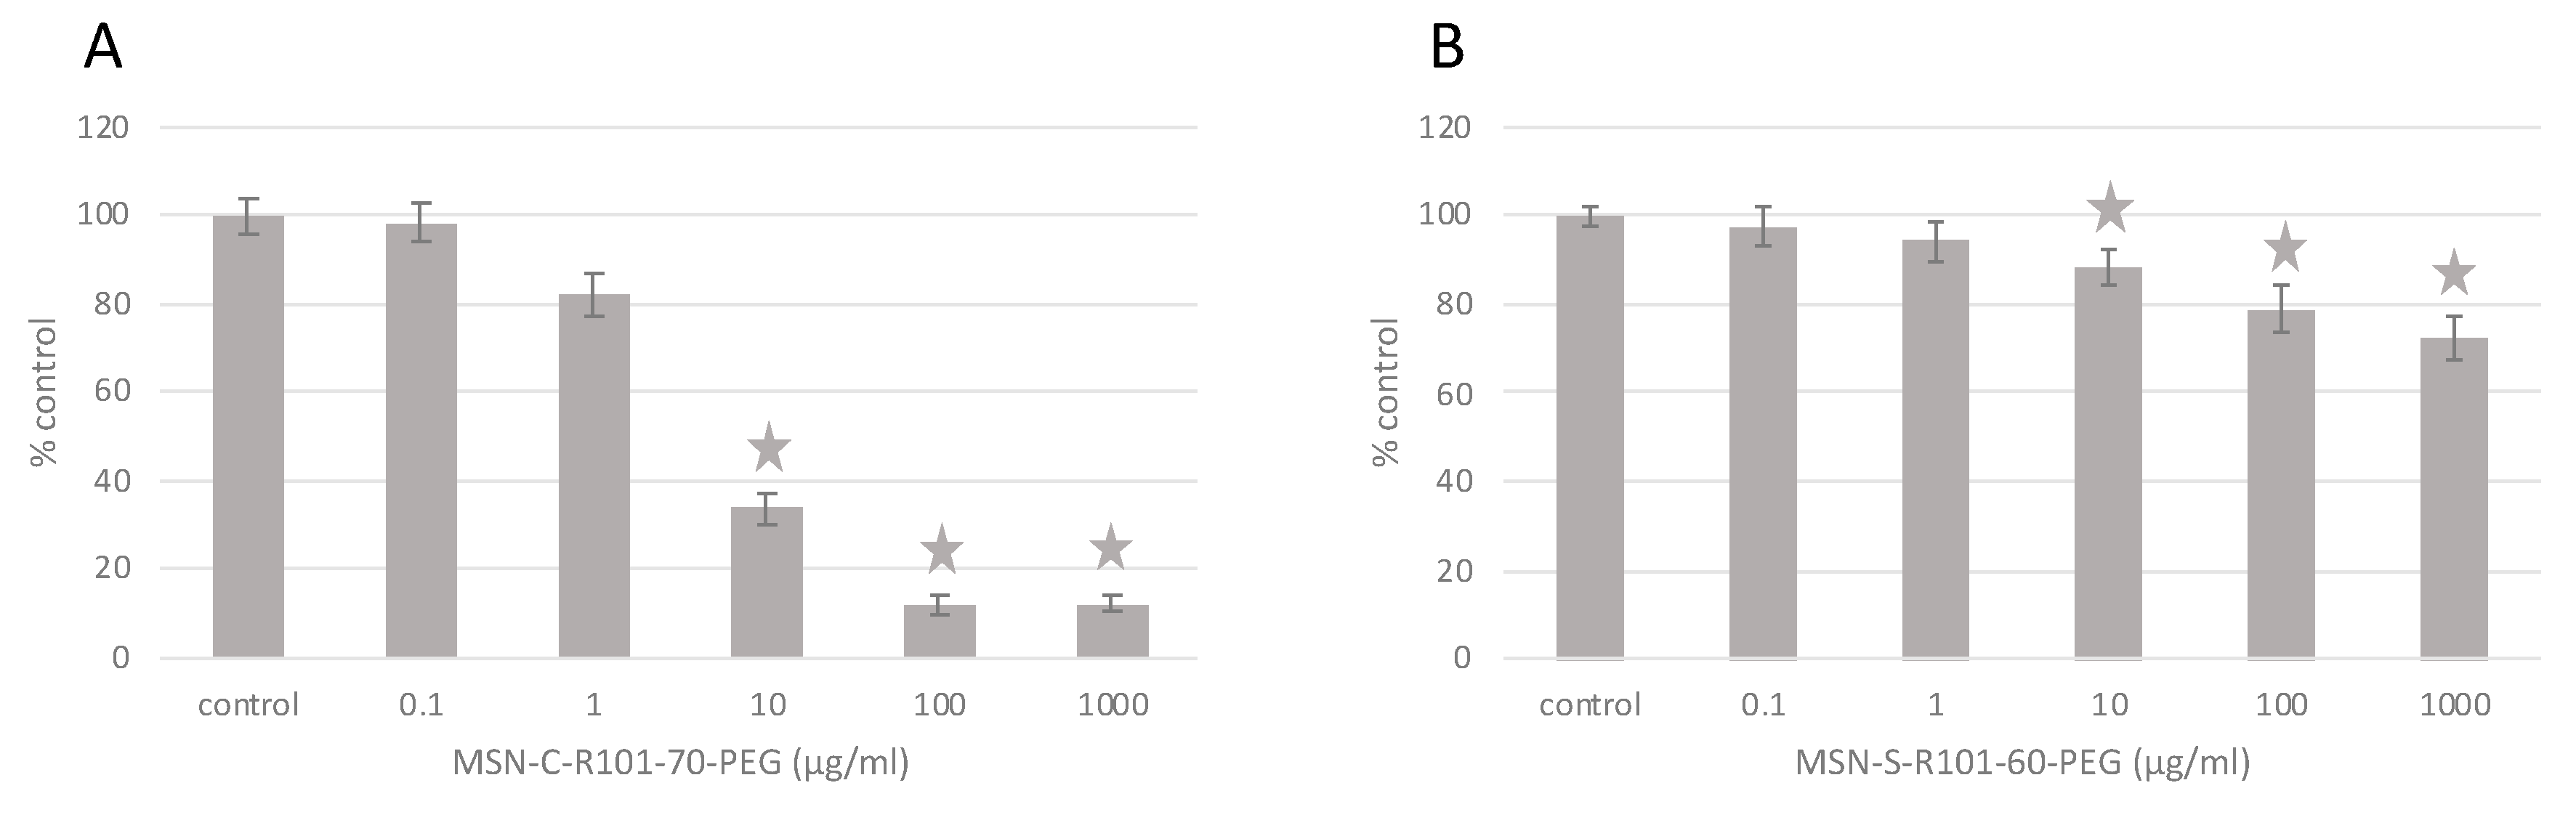
| MSN Samples | Control | 0.1 | 1 |
|---|---|---|---|
| (µg/mL) | (µg/mL) | (µg/mL) | |
| MSN-S-R101-60-PEG | 0 ± 0.0008 a | 0.355 ± 0.029 b | 0.491 ± 0.017 d |
| MSN-S-R101-60-PEG-FA | 0 ± 0.0005 a | 0.406 ± 0.033 c | 0.616 ± 0.023 e |
© 2020 by the authors. Licensee MDPI, Basel, Switzerland. This article is an open access article distributed under the terms and conditions of the Creative Commons Attribution (CC BY) license (http://creativecommons.org/licenses/by/4.0/).
Share and Cite
Prieto-Montero, R.; Katsumiti, A.; Cajaraville, M.P.; López-Arbeloa, I.; Martínez-Martínez, V. Functionalized Fluorescent Silica Nanoparticles for Bioimaging of Cancer Cells. Sensors 2020, 20, 5590. https://doi.org/10.3390/s20195590
Prieto-Montero R, Katsumiti A, Cajaraville MP, López-Arbeloa I, Martínez-Martínez V. Functionalized Fluorescent Silica Nanoparticles for Bioimaging of Cancer Cells. Sensors. 2020; 20(19):5590. https://doi.org/10.3390/s20195590
Chicago/Turabian StylePrieto-Montero, Ruth, Alberto Katsumiti, Miren Pilare Cajaraville, Iñigo López-Arbeloa, and Virginia Martínez-Martínez. 2020. "Functionalized Fluorescent Silica Nanoparticles for Bioimaging of Cancer Cells" Sensors 20, no. 19: 5590. https://doi.org/10.3390/s20195590
APA StylePrieto-Montero, R., Katsumiti, A., Cajaraville, M. P., López-Arbeloa, I., & Martínez-Martínez, V. (2020). Functionalized Fluorescent Silica Nanoparticles for Bioimaging of Cancer Cells. Sensors, 20(19), 5590. https://doi.org/10.3390/s20195590