Abstract
In this study, composite devices were fabricated using ferromagnetic FeSiB-based alloys (Metglas) and ferroelectric ceramics, and their magnetic field sensitivity was evaluated. Sintered 0.95Pb(Zr0.52Ti0.48)O3-0.05Pb(Mn1/3Sb2/3)O3 (PZT-PMS) ceramic exhibited a very dense microstructure with a large piezoelectric voltage coefficient (g31 = −16.8 × 10⁻³ VmN−1) and mechanical quality factor (Qm > 1600). Owing to these excellent electromechanical properties of the PZT-PMS, the laminate composite with a Metglas/PZT-PMS/Metglas sandwich structure exhibited large magnetoelectric voltage coefficients (αME) in both off-resonance and resonance modes. When the length-to-width aspect ratio (l/w) of the composite was controlled, αME slightly varied in the off-resonance mode, resulting in similar sensitivity values ranging from 129.9 to 146.81 VT−1. Whereas in the resonance mode, the composite with small l/w exhibited a large reduction of αME and sensitivity values. When controlling the thickness of the PZT-PMS (t), the αME of the composite showed the largest value when t was the smallest in the off-resonance mode, while αME was the largest when t is the largest in the resonance mode. The control of t slightly affected the sensitivity in the off-resonance mode, however, higher sensitivity was obtained as t increased in the resonance mode. The results demonstrate that the sensitivity, varying with the dimensional control of the composite, is related to the mechanical loss of the sensor. The composite sensor with the PZT-PMS layer exhibited excellent magnetic field sensitivity of 1.49 × 10⁵ VT−1 with a sub-nT sensing limit, indicating its potential for application in high-performance magnetoelectric sensor devices.
1. Introduction
Magnetoelectric (ME) composites comprising ferroelectric (FE) and ferromagnetic (FM) materials have the advantageous property of being capable of converting magnetic fields into electric fields and vice versa [1,2,3]. This field conversion, known as the ME effect, is possible through a strain coupling between the FE and FM constituents of the composites. For the direct ME effect, the FM material generates a mechanical strain when an external magnetic field varies (by magnetostriction, converse piezomagnetic effect), and the strain is transferred to the poled FE material at the FM/FE interface, thus generating a potential difference (by a direct piezoelectric effect). Strain-mediated coupling in a composite depends on the interfacial coupling between the two ferroic phases of the composite and can be optimized via microstructural designs [4] as well as controlling the physical properties of interfacial bonding materials [5,6]. Based on the ME effect, various electronic device applications, such as magnetic field sensors, current sensors, gyrators, position sensors, energy harvesters, resonators, and filters, have been proposed [1,7,8,9,10,11].
Research on ME composites for magnetic field sensors is of technological importance because ME composites have a simple structure and require a facile fabrication process despite their good field conversion performance. The magnetic field to electric field conversion performance is usually evaluated via the ME voltage coefficient (αME), which can be given by the following expression:
where EAC is the output electric field, HAC is the input magnetic field strength, VAC is the output potential difference, and tp is the distance between the two electrodes of the FE phase. The term dVAC/dHAC in Equation (1) determines the magnetic field sensitivity and reflects the precision with which a magnetic field change can be detected using a voltmeter. Therefore, it is important to enhance the magnitude of αME as much as possible to obtain a high magnetic field sensitivity.
As the ME effect in ME composites is a product property of the FM and FE phases, αME is represented by the following equation, which is based on the inherent material properties of the individual FM and FE phases [11,12,13]:
where n is the volume fraction of the FM phase; q is the piezomagnetic coefficient of the FM phase; g and k are the piezoelectric voltage coefficient and electromechanical coupling coefficient of the FE phase, respectively; SE and SH are the elastic compliances of the FE and FM phases, respectively; tan δ is the dielectric loss; tan θ is the piezoelectric loss; C is the capacitance at a given frequency; Cf is the free capacitance. Therefore, the selection of an FE material with a large g value and small tan δ value and an FM material having a large q value is favorable for realizing a large αME. Moreover, a high mechanical quality factor (Qm) of the FE phase is important for enhancing the αME in the resonance mode of ME devices [14,15,16].
ME magnetic field sensors that comprise FM single crystals have been investigated owing to their excellent piezoelectric properties, demonstrating nT- to fT-level sensing limits [17,18,19]. These encouraging results demonstrate the feasibility of implementing small and efficient ME magnetic field sensor devices, which are comparable to conventional search coil and superconducting quantum interference device sensors [20] but do not require complicated fabrication processes or special equipment. However, the application of polycrystalline FE ceramics fabricated via an economical ceramic process would be more desirable from an industrial viewpoint, i.e., for mass production and to realize inexpensive sensor devices.
In this study, we employed polycrystalline FE materials to evaluate the magnetic field sensing performance of an ME composite comprising polycrystalline FE materials. A 0.25 wt% PbO-added 0.95Pb(Zr0.52Ti0.48)O3-0.05Pb(Mn1/3Sb2/3)O3 (PZT-PMS) ceramic was synthesized, and a commercial PZT5A ceramic was prepared for comparison. An FeSiB-based amorphous alloy (Metglas) was selected as the FM material. First, the electromechanical characteristics of the FE materials and the αME values of the FM/FE/FM laminate composites were measured and analyzed. The magnetic field sensitivity and sensing limit of the ME composites were then evaluated. We demonstrate that the sensitivity is related to the piezoelectric voltage coefficient of the FE layer in the off-resonance mode, while the sensitivity of the resonance mode is predominantly affected by the mechanical quality factor of the composite sensor. Furthermore, we discuss the effect of dimensional control of the FE layer on the magnetic field sensing performance of the PZT-PMS sensors.
2. Materials and Methods
Reagent-grade raw powders of PbO, ZrO2, TiO2, MnO2, and Sb2O3 (all from Kojundo Chemical Lab. Co., Sakado, Japan) were mixed in accordance with the stoichiometric composition of the PZT-PMS and ball-milled with ethyl alcohol and yttria-stabilized zirconia balls in a polyethylene jar for 24 h. The powder mixture was dried at 80 °C for 24 h and subsequently calcined at 850 °C for 2 h in air. The calcined PZT-PMS powder was ball-milled again for 24 h with 0.25 wt% PbO powder and dried at 80 °C for 24 h. The dried powder was unidirectionally pressed into a rectangular-shaped compact under 100 MPa, and the powder compact was sintered at 1240 °C for 8 h in air. The sintered PZT-PMS samples were cut into 31-mode rectangular plates of (10.5, 12.0, 13.5 mm) (l) × 3.0 mm (w) × (0.5, 1.0, 1.5 mm) (t). A silver electrode was deposited at the top and bottom surfaces of the PZT-PMS plates and the poling process was performed by applying an electric field of 3 kVmm−1 for 5 min at 120 °C in silicone oil. For performance comparison, a commercial PZT5A (PSI-5A4E, Piezo Systems, Inc., Cambridge, MA, USA) ceramic plate of 13.5 mm (l) × 3.0 mm (w) × 1.0 mm (t) was prepared. The microstructure and phase formation of the sintered PZT-PMS sample were examined by scanning electron microscopy (SEM) (JSM-6500F, JEOL, Ltd., Akishima, Tokyo, Japan), energy-dispersive X-ray spectroscopy (EDS) (XFlash 630, Bruker Nano GmbH, Berlin, Germany), and X-ray diffraction (XRD) (D-MAX/2500, Rigaku Co., Tokyo, Japan). The bulk density of the polished 31-mode samples was measured employing the Archimedes method. The impedance and phase angle spectra and piezoelectric and dielectric properties of the pooled samples were measured using an impedance analyzer (IM3570, Hioki EE Co., Nagano, Japan).
The FM/FE/FM laminate composites were fabricated by attaching 90 μm-thick Metglas sheets (2605SA1, Metglas Inc., Conway, SC, USA) at the top and bottom surfaces of the poled PZT-PMS plates and PZT5A plate using an epoxy adhesive (DP460, 3M Company, St. Paul, MN, USA). The ME voltage coefficient as a function of the DC magnetic field strength (HDC) and HAC frequency of the laminate composites were measured using a Helmholtz coil, electromagnet, and lock-in amplifier (SR860, Stanford Research Systems, Sunny-vale, USA) [13]. To evaluate the magnetic field sensitivity and sensing limit of the laminate composites, the output voltage was monitored as a function of the HAC. The HAC was controlled by the Helmholtz coil, and the output voltage from the laminate composite was measured using a lock-in amplifier.
3. Results and Discussion
Figure 1a confirms that a perovskite phase was well-formed (JCPDS 01-070-4265) without secondary phases in a 0.25 wt% PbO-added PZT-PMS ceramic sample sintered at 1240 °C for 8 h in air. The sintered PZT-PMS sample exhibited a very dense microstructure comprising faceted grains with an average grain size of 4 μm, as presented in the inset image of Figure 1. The bulk density of the PZT-PMS sample was measured as 7.931 gcm−3, which is almost 99% of the theoretical density. The EDS result in Figure 1b shows that the elemental composition of the sintered PZT-PMS is closed to the nominal stoichiometric composition.
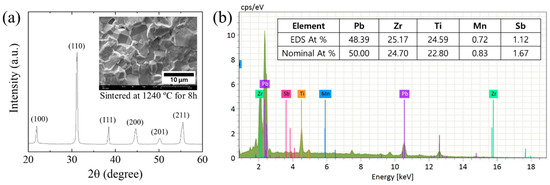
Figure 1.
(a) XRD pattern of PZT-PMS ceramic sample sintered at 1240 °C for 8 h. Inset image presents an SEM microstructure image of the sintered PZT-PMS sample. (b) Energy-dispersive X-ray spectroscopy (EDS) result of the sintered PZT-PMS ceramic sample.
Figure 2 presents the impedance and phase angle spectra of the poled PZT-PMS and PZT5A samples with 31-mode dimensions (13.5 mm (l) × 3.0 mm (w) × 1.0 mm (t)). The elastic moduli of the PZT-PMS and PZT5A samples were calculated as 100 and 65 GPa, respectively, which resulted in a higher resonance frequency range for the PZT-PMS despite the same dimensions of the two samples. The piezoelectric charge coefficient (d31), electromechanical coupling coefficient (k31), and dielectric constant (ε33T/ε0) of the PZT5A were greater than those of the PZT-PMS, as shown in Table 1, however, the piezoelectric voltage coefficient (g31) was larger in the PZT-PMS owing to much smaller ε33T/ε0 value of the PZT-PMS. As observed from Figure 2, the peaks for the resonance frequency (fr) and anti-resonance frequency (fa) of PZT-PMS are much sharper than those of PZT5A, and the slope of the phase angle change at fr and fa is greater in PZT-PMS. This indicates that the mechanical loss by power consumption is greater in PZT5A than in the case of PZT-PMS. Accordingly, the mechanical quality factors (Qm, the inverse of mechanical loss) obtained at both fr and fa demonstrated a large difference between the two samples, as shown in Table 1.
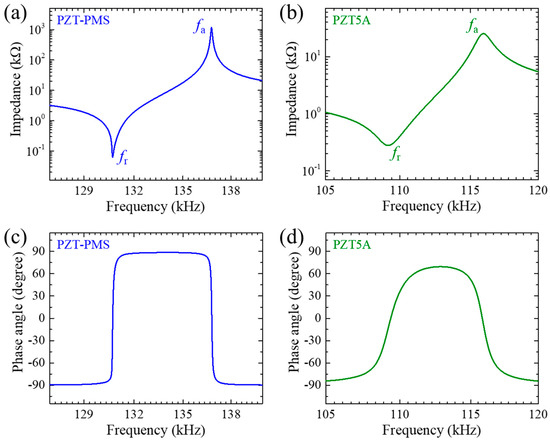
Figure 2.
Impedance spectra of 31-mode piezoelectric samples: (a) PZT-PMS and (b) PZT5A. Phase angle spectra of 31-mode piezoelectric samples: (c) PZT-PMS and (d) PZT5A.

Table 1.
Piezoelectric charge coefficient (d31), piezoelectric voltage coefficient (g31), electromechanical coupling coefficient (k31), mechanical quality factors at the resonance frequency (Qm at fr) and anti-resonance frequency (Qm at fa), dielectric constant (ε33T/ε0), and dissipation factor (tan δ) of 31-mode PZT-PMS and PZT5A ceramics.
In the direct ME effect, the αME value is enhanced at fa of the laminate composite system, and the degree of enhancement is dependent on the Qm value of the system [14,15,21]. The fa obtained from the composite system is close to that obtained from the FE material when the thickness fraction of the FE layer is sufficiently large [15]. From Equation (2) and the data in Table 1 (g31, Qm at fa, and tan δ), it was clearly expected that the αME value of the laminate composite with PZT-PMS (PZT-PMS sensor) would be superior to that of the laminate composite with PZT5A (PZT5A sensor) both in the resonance and off-resonance modes. As shown in Figure 3a, the composite sensor devices (FE dimensions: 13.5 mm (l) × 3.0 mm (w) × 1.0 mm (t)) exhibited typical αME versus HDC curves at a 1 kHz HAC, with maximum αME values of 0.147 and 0.096 Vcm−1Oe−1 for the PZT-PMS and PZT5A sensors, respectively. When the HAC frequency was tuned to the anti-resonance frequency of the sensors, αME was significantly enhanced, as shown in Figure 3b. For the PZT5A sensor, an αME of 30.1 Vcm−1Oe−1 (314 times greater than that at 1 kHz) was obtained. The PZT-PMS sensor exhibited a large αME of 87.6 Vcm−1Oe−1, which is 596 times greater than that at 1 kHz.
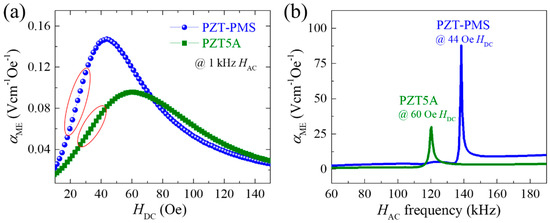
Figure 3.
(a) Magnetoelectric voltage coefficient of PZT-PMS and PZT5A sensors measured at 1 kHz as a function of HDC. (b) Magnetoelectric voltage coefficient spectra of PZT-PMS and PZT5A sensors as a function of HAC frequency. (FE dimensions: 13.5 mm (l) × 3.0 mm (w) × 1.0 mm (t)).
The ME laminate composite can be used as a DC magnetic field sensor if the section in which αME changes sensitively and linearly according to the change in HDC (e.g., the regions indicated in red in Figure 3a) is well defined. The length-to-width aspect ratio (l/w) of the FM layers can be controlled to adjust the HDC of the maximum αME [22], i.e., to adjust the slope of the linear section and the magnetic field range to be detected. Furthermore, the ME laminate composite generates a voltage (VAC) under the HAC (Equation (1)), and the VAC is proportional to the HAC (i.e., linearly varies with the proportional constant tpαME). Therefore, the ME laminate composite can be used as an AC magnetic field sensor as well. The HAC frequency of the sensor at which the enhanced αME is observed can be controlled by simply adjusting the length l of the sensor (i.e., adjusting the fa of the sensor), and thereby, a highly sensitive AC field sensor for the desired frequencies can be implemented.
Figure 4 presents the VAC versus HAC curves of the PZT-PMS and PZT5A sensors (FE dimensions: 13.5 mm (l) × 3.0 mm (w) × 1.0 mm (t)) obtained at 1 kHz and fa of the sensors for evaluating the performance of the AC magnetic field sensors in the off-resonance and resonance modes, respectively. At 1 kHz, the PZT-PMS sensor displayed a linear relationship between the VAC and HAC at a HAC greater than 390 nT, as shown in Figure 4a. At a HAC less than 390 nT, the VAC fluctuated so severely that it could not be measured as a constant value, indicating that the sensing limit of the PZT-PMS sensor was approximately 390 nT. The sensing limit of the PZT5A sensor was slightly larger than that of the PZT-PMS sensor. The magnetic field sensitivity (dV/dH, the slope of the linear section) of the PZT-PMS sensor (146.81 VT−1) was 1.5 times greater than that of the PZT5A sensor mainly owing to the greater g31 of the PZT-PMS. Meanwhile, in the resonance mode in Figure 4b, the sensing limit of the sensors was greatly improved: approximately 0.387 and 6.11 nT for the PZT-PMS and PZT5A sensors, respectively. Furthermore, the PZT-PMS sensor exhibited a significantly large sensitivity of 8.76 × 10⁴ VT−1, which is 2.9 times greater than that of the PZT5A sensor. This large difference in sensitivity values emphasizes the importance of the Qm of the FE material when the sensor is operated in the resonance mode.
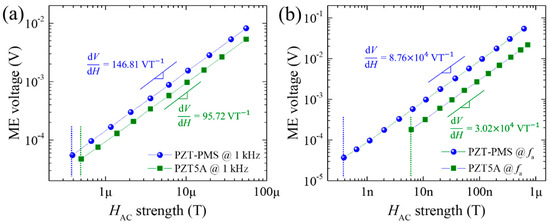
Figure 4.
Magnetoelectric voltage output as a function of HAC of PZT-PMS and PZT5A sensors (FE dimensions: 13.5 mm (l) × 3.0 mm (w) × 1.0 mm (t)): (a) measured at 1 kHz and (b) measured at an anti-resonance frequency of the sensors. Slope values and dashed lines indicate magnetic field sensitivities and observed sensing limits, respectively.
As mentioned earlier, the length-to-width aspect ratio (l/w) of the FM layers can be controlled to adjust the HDC of the maximum αME. Figure 5a shows αME versus HDC curves for the PZT-PMS sensors with various lengths and fixed width and thickness ((i.e., different l/w) measured at 1 kHz HAC. The HDC of the maximum αME gradually increased with decreasing sensor length, resulting in a decrease in the slope of the linear section. The maximum αME also decreased slightly with decreasing sensor length, indicating that magnetostriction in the longitudinal direction of the FM layers became difficult due to the reduced l/w. In the resonance mode, the HAC frequency of the maximum αME increased with decreasing sensor length, accompanied by a large reduction of the maximum αME, as shown in Figure 5b. From these large reductions of the maximum αME in the resonance mode, it can be deduced that a small l/w causes a large mechanical loss in the FE layer.
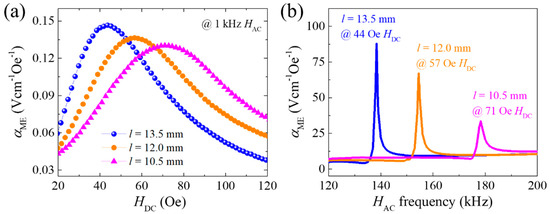
Figure 5.
(a) Magnetoelectric voltage coefficient of PZT-PMS sensors with different lengths measured at 1 kHz as a function of HDC. (b) Magnetoelectric voltage coefficient spectra of the PZT-PMS sensors as a function of HAC frequency. (FE cross-sectional dimensions: 3.0 mm (w) × 1.0 mm (t)).
The magnetic field sensitivity and sensing limit of the PZT-PMS sensors with different sensor lengths are displayed in Figure 6. Both in the off-resonance (1 kHz) and resonance (fa) modes, magnetic field sensitivity exhibited the same trend as the maximum αME observed in Figure 5, and the sensing limit was slightly increased with decreasing sensor length. Therefore, it is clear that a larger l/w is advantageous to obtain higher sensitivity and lower sensing limit under the fixed condition of the sensor thickness.
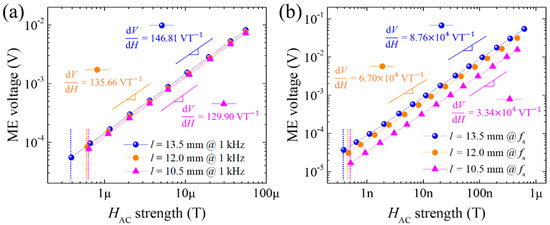
Figure 6.
Magnetoelectric voltage output as a function of HAC of PZT-PMS sensors with different lengths (FE cross-sectional dimensions: 3.0 mm (w) × 1.0 mm (t)): (a) measured at 1 kHz and (b) measured at an anti-resonance frequency of the sensors. Slope values and dashed lines indicate magnetic field sensitivities and observed sensing limits, respectively.
Next, we investigated the effect of FE layer thickness (t) on the ME characteristics and magnetic field sensing performance. Figure 7a shows αME versus HDC curves of the PZT-PMS sensors with various FE layer thicknesses, under fixed l and w conditions, measured at 1 kHz HAC. The Metglas FM layers of identical dimensions were applied to the PZT-PMS sensors; therefore, the αME values of the sensors were maximized at similar HDC values. The maximum αME was greatly enhanced with decreasing t, exhibiting 0.236 Vcm−1Oe−1 when t = 0.5 mm, while it decreased to 0.084 Vcm−1Oe−1 as t increased to 1.5 mm. However, the maximum αME in the resonance mode exhibited a tendency opposite to that in the off-resonant mode, as shown in Figure 7b. The largest αME of 99.2 Vcm−1Oe−1 was obtained when t = 1.5 mm, and the sensor with t = 0.5 mm showed a reduced αME of 65.5 Vcm−1Oe−1.
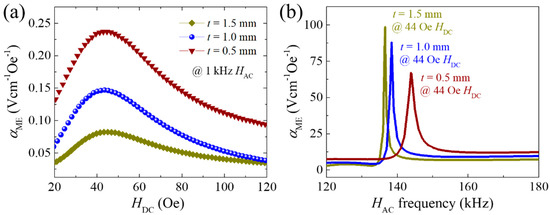
Figure 7.
(a) Magnetoelectric voltage coefficient of PZT-PMS sensors with different FE layer thicknesses measured at 1 kHz as a function of HDC. (b) Magnetoelectric voltage coefficient spectra of the PZT-PMS sensors as a function of HAC frequency. (FE areal dimensions: 13.5 mm (l) × 3.0 mm (w)).
The results in Figure 7 signify that the high thickness fraction of the FM layers are advantageous in the off-resonance mode, but is disadvantageous in the resonance mode for achieving high αME. When t is small, magnetostriction of the FM layers can be readily generated, and the strain is effectively transferred to the FE layer. However, the electromechanical resonance of the FE layer is affected by structural damping, i.e., the resonance is attenuated if the motion of the FE layer is disturbed by the FM layers. Thus, a small t (or high thickness fraction of the FM layers) could lead to a large mechanical loss of the FE layer in the resonance mode.
Although the maximum αME values differed greatly as the t of the PZT-PMS sensors was changed (Figure 7a), sensors exhibited no significant difference in magnetic field sensitivity and sensing limit in the off-resonance mode, as shown in Figure 8a. When voltage monitoring is the basic sensing process of the magnetic field sensor system, the change in output voltage, not the αME value, should be high to increase the sensitivity. If magnetostriction strain of the same magnitude is transferred to the FE layer, the FE layer with larger t should generate a higher output voltage. However, the sensors with different t values exhibited similar sensitivities (or similar output voltages), implying that the magnetostriction of the FM layers decreased as t increased.
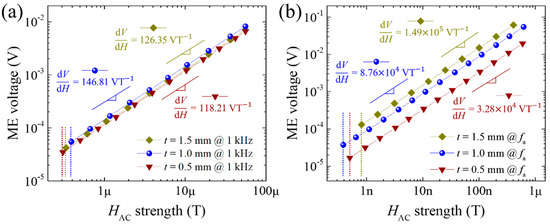
Figure 8.
Magnetoelectric voltage output as a function of HAC of PZT-PMS sensors with different FE layer thicknesses (FE areal dimensions: 13.5 mm (l) × 3.0 mm (w)): (a) measured at 1 kHz and (b) measured at an anti-resonance frequency of the sensors. Slope values and dashed lines indicate magnetic field sensitivities and observed sensing limits, respectively.
Unlike the off-resonance case, sensitivity showed a remarkable difference depending on the t of the sensor in the resonance mode, as shown in Figure 8b. Despite the smallest magnetostriction of the FM layers, the sensor with t = 1.5 mm exhibited the highest sensitivity of 1.49 × 10⁵ VT−1, whereas the sensitivity of the sensor with t = 0.5 mm, which is believed to generate the highest magnetostriction, was 4.5 times lower than t = 1.5 mm case. This result confirms that the Qm at fa (Qm,fa) of the sensor system predominates the magnetic field sensing performance in the resonance mode. The Qm,fa values of the PZT-PMS sensors with t = 0.5, 1.0, and 1.5 mm were measured to be 71.4, 190.5, and 259.6, respectively. Even the Qm,fa of the sensor with t = 1.5 mm was much smaller than that of the PZT-PMS material itself (Qm,fa = 1783), indicating a large mechanical loss in the FE layer caused by the FM and bonding layers. This inevitable mechanical loss can be more serious when the sensor size is reduced, thus, the Qm of the FE material should be as high as possible to achieve high sensitivity in the resonance mode. The PZT-PMS sensors with different t values exhibited very low sensing limits ranging from 0.387 to 0.816 nT at their fa.
The αME, magnetic field sensitivity and sensing limit values of the ME composite sensors are summarized in Table 2. The data in Table 2 were obtained in the air at room temperature without using special shielding instruments. Nevertheless, the simple laminate composite with polycrystalline PZT-PMS ceramics exhibited a high sensitivity of 105 VT−1 with a sub-nT sensing limit, thus demonstrating its feasibility as a small and cost-effective magnetic field sensor device.
Table 2.
Magnetoelectric voltage coefficient (αME), magnetic field sensitivity, and sensing limit of PZT5A and PZT-PMS sensors.
4. Conclusions
In this study, the magnetic field sensing performances of FM/FE/FM laminate composites fabricated using PZT5A and PZT-PMS polycrystalline FE ceramics were evaluated and compared. The g31 of the FE layer affected the ME and magnetic field sensing performances of the laminate composites in the off-resonance mode. More importantly, the laminate composite sensor comprising the FE material with a high Qm exhibited a large αME in the resonance regime, which resulted in a large magnetic field sensitivity in the sub-nT-level field range. The large length-to-width aspect ratio of the composite sensor was found to be desirable to reduce the mechanical loss in the FE layer. Furthermore, it was demonstrated that the higher the thickness fraction of the FE layer, the less mechanical loss of the sensor. The results of this study provide design guidelines for implementing high-sensitivity ME sensor devices from a material and device structure perspective.
Author Contributions
Conceptualization, K.-H.C. and J.-Y.S.; methodology, Y.-W.L. and I.-R.Y.; validation, Y.-W.L., J.-Y.S., and I.-R.Y.; writing—original draft preparation, K.-H.C. and J.C.; writing—review and editing, C.-W.A., J.-J.C., B.-D.H., and K.-H.C.; supervision, K.-H.C. and J.C.; funding acquisition, K.-H.C. and J.C. All authors have read and agreed to the published version of the manuscript.
Funding
This work was supported by the National Research Foundation (NRF) of Korea funded by the Ministry of Education (NRF-2019R1I1A3A01058105 and NRF-2018R1A6A1A03025761), the Fundamental Research Program of the Korea Institute of Materials Science (PNK6030), and the Grand Information Technology Research Center Program through the Institute of Information & Communications Technology and Planning & Evaluation funded by the Ministry of Science and ICT (MSIT) of Korea (IITP-2020-2020-0-01612).
Conflicts of Interest
The authors declare no conflict of interest.
References
- Nan, C.-W.; Bichurin, M.I.; Dong, S.; Viehland, D.; Srinivasan, G. Multiferroic magnetoelectric composites: Historical perspective, status, and future directions. J. Appl. Phys. 2008, 103, 031101. [Google Scholar]
- Srinivasan, G. Magnetoelectric composites. Annu. Rev. Mater. Res. 2010, 40, 153–178. [Google Scholar]
- Fiebig, M. Revival of the magnetoelectric effect. J. Phys. D Appl. Phys. 2005, 38, R123–R152. [Google Scholar]
- Sarkar, T.; Muscas, G.; Barucca, G.; Locardi, F.; Varvaro, G.; Peddis, D.; Mathieu, R. Tunable single-phase magnetic behavior in chemically synthesized AFeO3–MFe2O4 (A = Bi or La, M = Co or Ni) nanocomposites. Nanoscale 2018, 10, 22990. [Google Scholar] [PubMed]
- Wang, Y.; Gray, D.; Berry, D.; Li, M.; Gao, J.; Li, J.; Viehland, D. Influence of interfacial bonding condition on magnetoelectric properties in piezofiber/Metglas heterostructures. J. Alloys Compd. 2012, 513, 242–244. [Google Scholar]
- Cho, K.-H.; Yan, Y.; Folgar, C.; Priya, S. Zigzag-shaped piezoelectric based high performance magnetoelectric laminate composite. Appl. Phys. Lett. 2014, 104, 222901. [Google Scholar]
- Pavel, R.; Alois, T. (Eds.) Modern Sensors Handbook; ISTE Ltd.: Hoboken, NJ, USA, 2007; 518p. [Google Scholar]
- Ortega, N.; Kumar, A.; Scott, J.F.; Katiyar, R.S. Multifunctional magnetoelectric materials for device applications. J. Phys. Condens. Matter 2015, 27, 504002. [Google Scholar]
- Paluszek, M.; Avirovik, D.; Zhou, Y.; Kundu, S.; Chopra, A.; Montague, R.; Priya, S. Magnetoelectric composites for medical application. In Composite Magnetoelectrics; Srinivasan, G., Priya, S., Sun, N.X., Eds.; Woodhead Publishing: Cambridge, UK, 2015; pp. 297–327. [Google Scholar]
- Petrov, R.; Leontiev, V.; Sokolov, O.; Bichurin, M.; Bozhkov, S.; Milenov, I.; Bozhkov, P. A Magnetoelectric Automotive Crankshaft Position Sensor. Sensors 2020, 20, 5494. [Google Scholar]
- Annapureddy, V.; Kim, M.; Palneedi, H.; Lee, H.-Y.; Choi, S.-Y.; Yoon, W.-H.; Park, D.-S.; Choi, J.-J.; Hahn, B.-D.; Ahn, C.-W.; et al. Low-Loss piezoelectric single-crystal fibers for enhanced magnetic energy harvesting with magnetoelectric composite. Adv. Energy Mater. 2016, 6, 1601244. [Google Scholar]
- Cho, K.-H.; Park, C.S.; Priya, S. Effect of intensive and extensive loss factors on the dynamic response of magnetoelectric laminates. Appl. Phys. Lett. 2010, 97, 182902. [Google Scholar]
- Yoo, I.-R.; Ahn, C.-W.; Cho, K.-H. 15-Mode piezoelectric composite and its application in a magnetoelectric laminate structure. J. Alloys Compd. 2018, 767, 61–67. [Google Scholar]
- Cho, K.-H.; Priya, S. Direct and converse effect in magnetoelectric laminate composites. Appl. Phys. Lett. 2011, 98, 232904. [Google Scholar]
- Cho, K.-H. Effect of structural control on the magnetoelectric characteristics of piezoelectric–magnetostrictive laminate composite in resonance and off‑resonance modes. Electron. Mater. Lett. 2019, 15, 555–561. [Google Scholar]
- Bichurin, M.I.; Petrov, V.M. Magnetoelectric effect in magnetostriction-piezoelectric multiferroics. Low Temp. Phys. 2010, 36, 544–549. [Google Scholar]
- Wang, Y.J.; Gray, D.; Berry, D.; Gao, J.Q.; Li, M.H.; Li, J.F.; Viehland, D. An extremely low equivalent magnetic noise magnetoelectric sensor. Adv. Mater. 2011, 23, 4111–4114. [Google Scholar] [PubMed]
- Park, S.; Peddigari, M.; Hwang, G.-T.; Yoon, W.-H.; Kumar, A.; Ryu, J. Face-shear 36-mode magnetoelectric composites with piezoelectric single crystal and Metglas Laminate. Appl. Phys. Lett. 2019, 115, 102901. [Google Scholar]
- Turutin, A.V.; Vidal, J.V.; Kubasov, I.V.; Kislyuk, A.M.; Malinkovich, M.D.; Parkhomenko, Y.N.; Kobeleva, S.P.; Pakhomov, O.V.; Kholkin, A.L.; Sobolev, N.A. Magnetoelectric metglas/bidomain y+140°-cut lithium niobate composite for sensing fT magnetic fields. Appl. Phys. Lett. 2018, 112, 262906. [Google Scholar]
- Djamal, M.; Ramli, R. Giant magnetoresistance sensors based on ferrite material and its applications. In Magnetic Sensors: Development Trends and Applications; Asfour, A., Ed.; IntechOpen, Ltd.: London, UK, 2017. [Google Scholar]
- Deka, B.; Lee, Y.-W.; Yoo, I.-R.; Gwak, D.-W.; Cho, J.; Song, H.-C.; Choi, J.-J.; Hahn, B.-D.; Ahn, C.-W.; Cho, K.-H. Designing ferroelectric/ferromagnetic composite with giant self-biased magnetoelectric effect. Appl. Phys. Lett. 2019, 115, 192901. [Google Scholar]
- Cho, K.-H. Effect of dimension control of piezoelectric layer on the performance of magnetoelectric laminate composite. Korean J. Mater. Res. 2018, 28, 611–614. [Google Scholar]


Publisher’s Note: MDPI stays neutral with regard to jurisdictional claims in published maps and institutional affiliations. |
© 2020 by the authors. Licensee MDPI, Basel, Switzerland. This article is an open access article distributed under the terms and conditions of the Creative Commons Attribution (CC BY) license (http://creativecommons.org/licenses/by/4.0/).