High-Precision Acceleration Measurement System Based on Tunnel Magneto-Resistance Effect †


Abstract
:1. Introduction
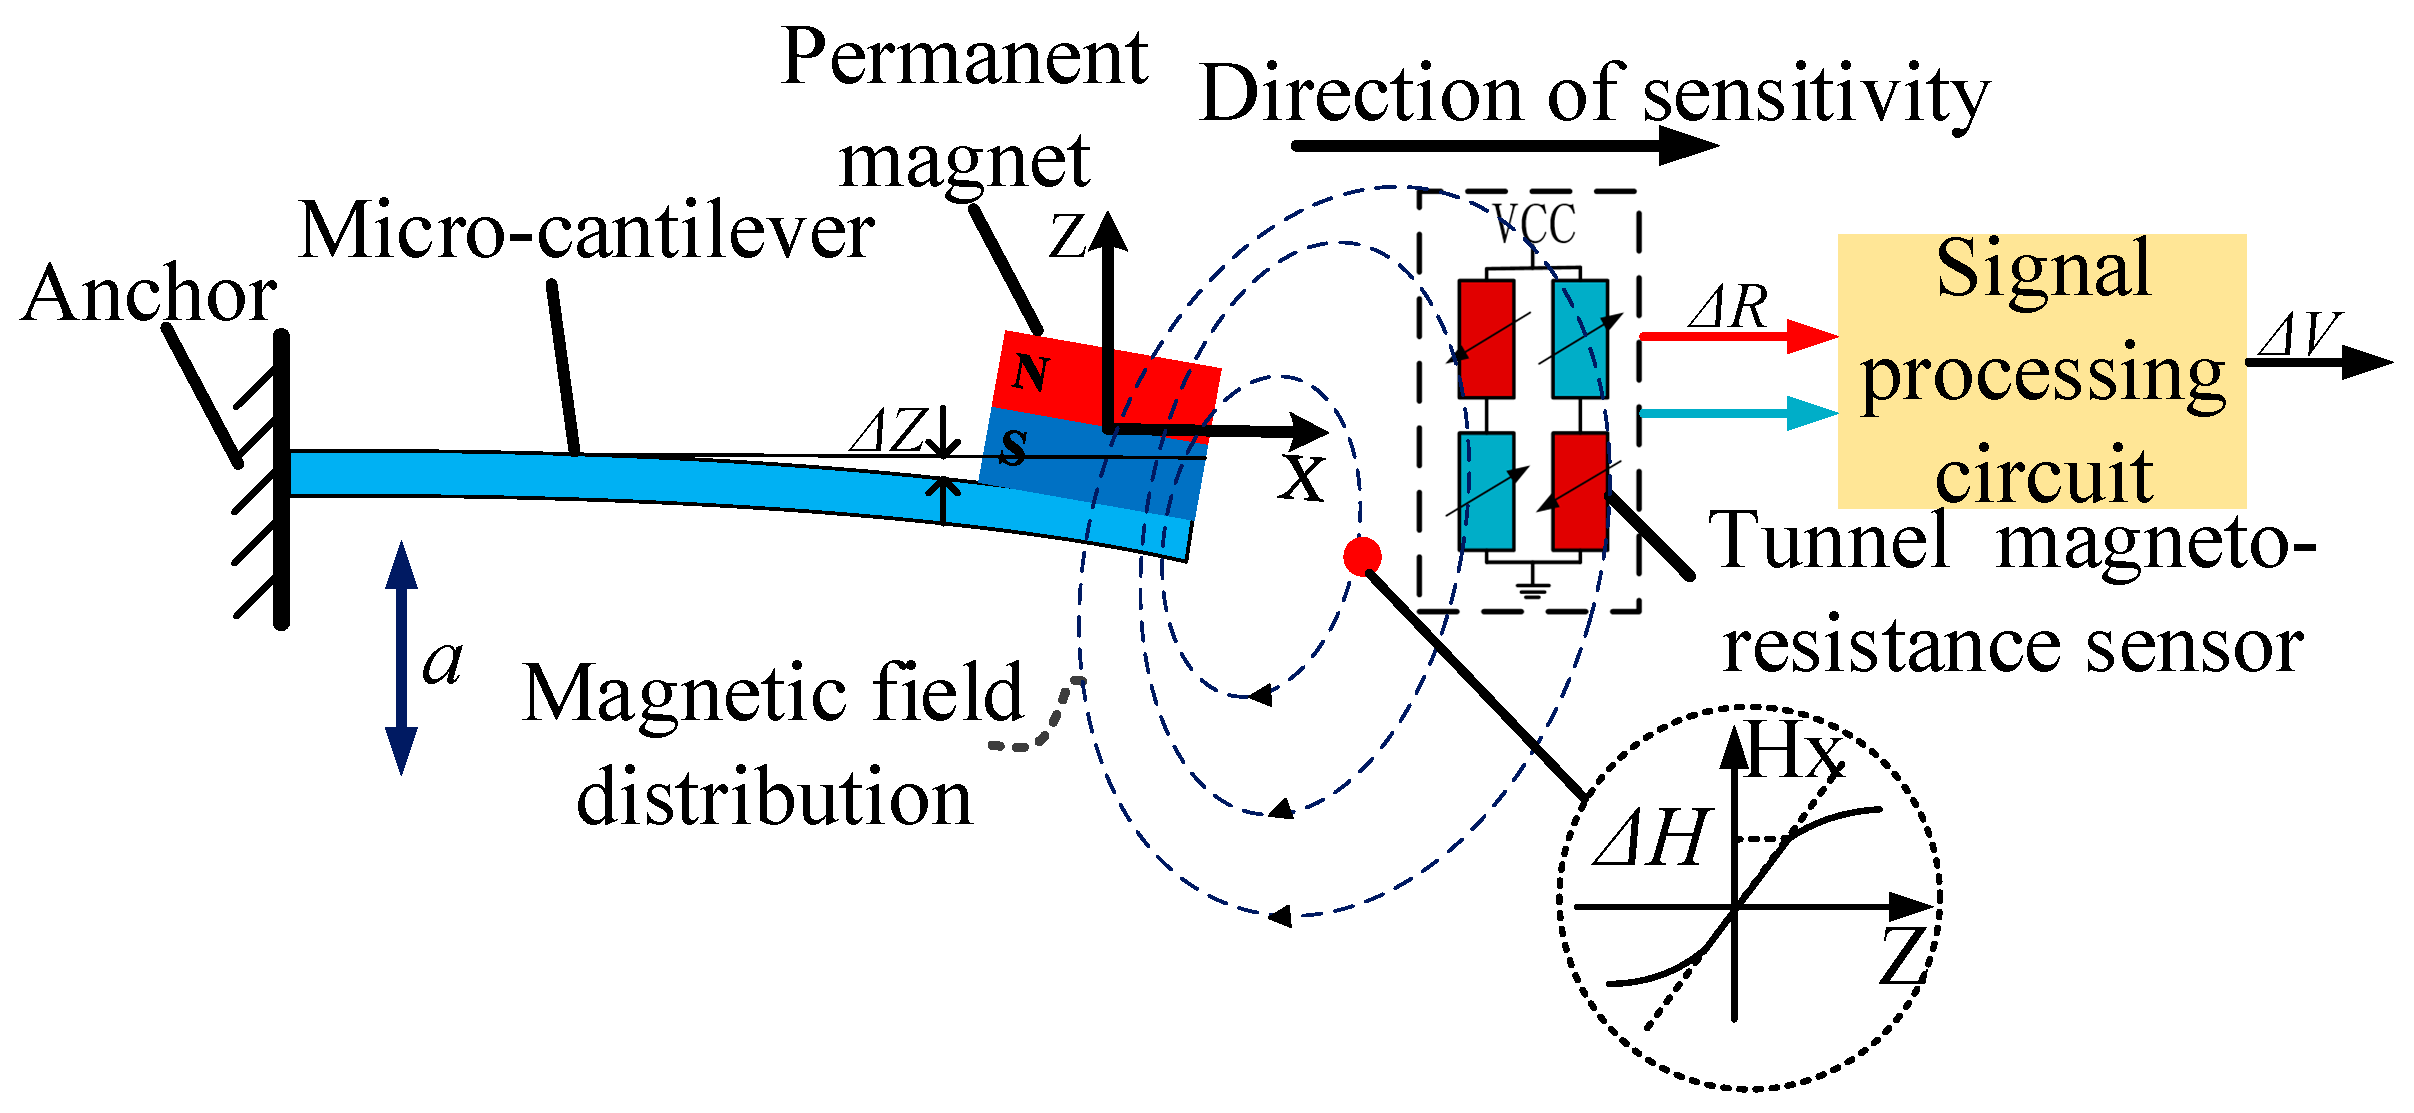
2. Design of the Acceleration Measurement System
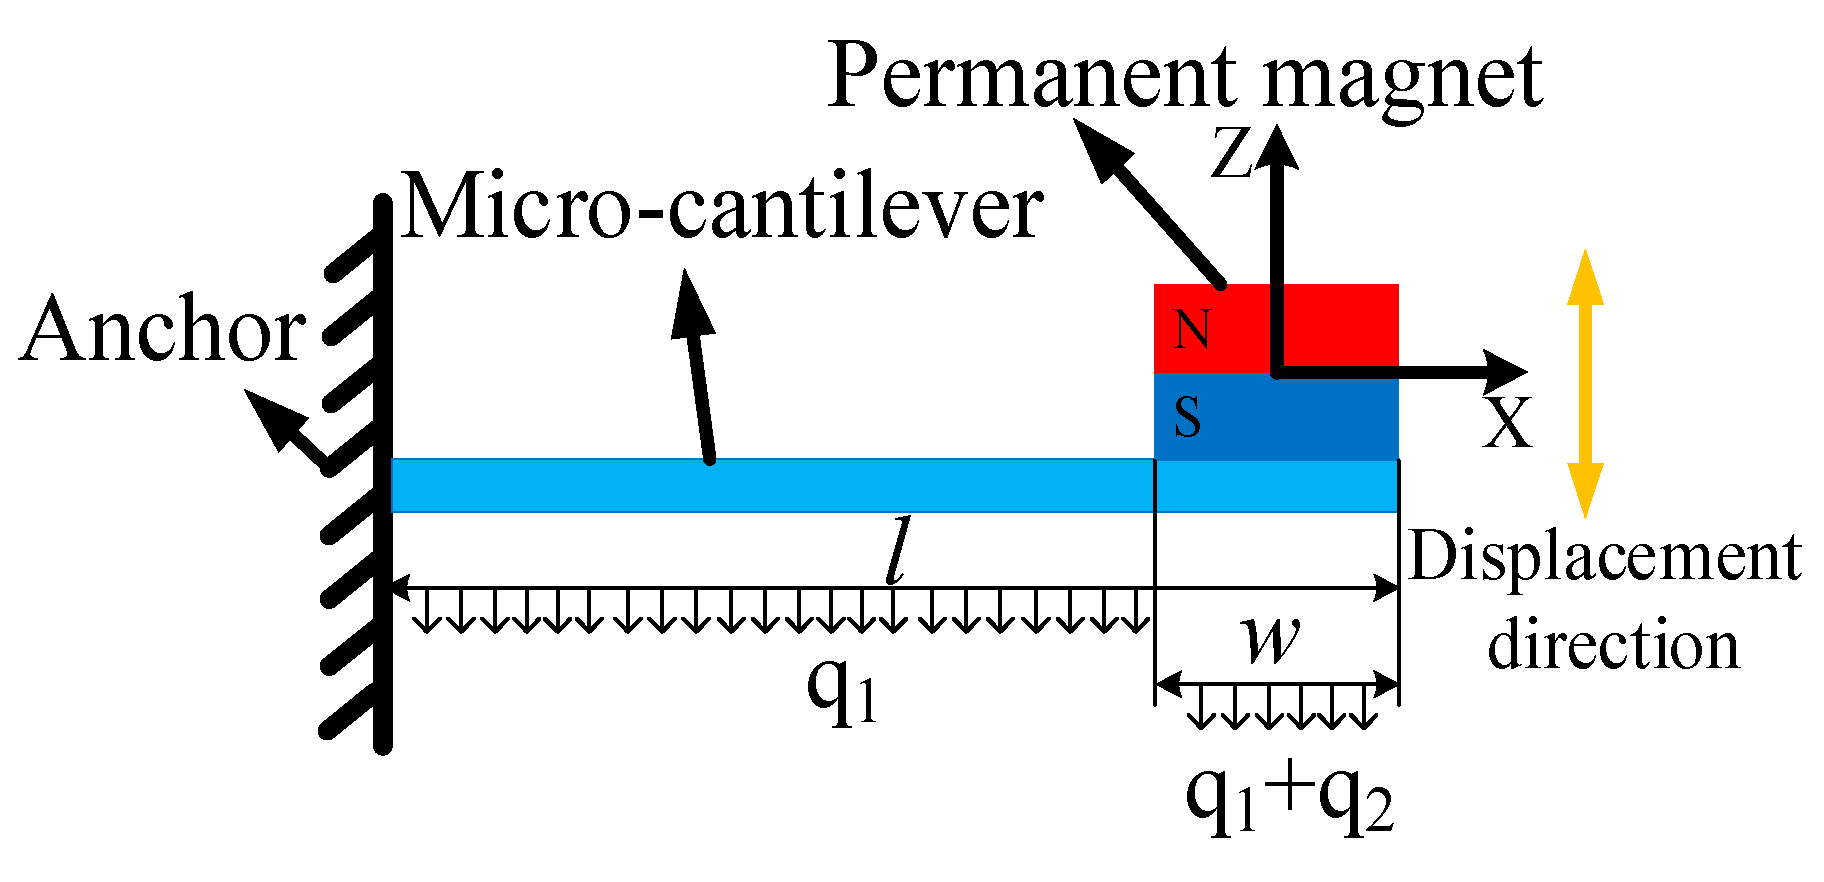
2.1. Design of Force Field Coupling Structure
2.2. Design of Magnetic Field Source
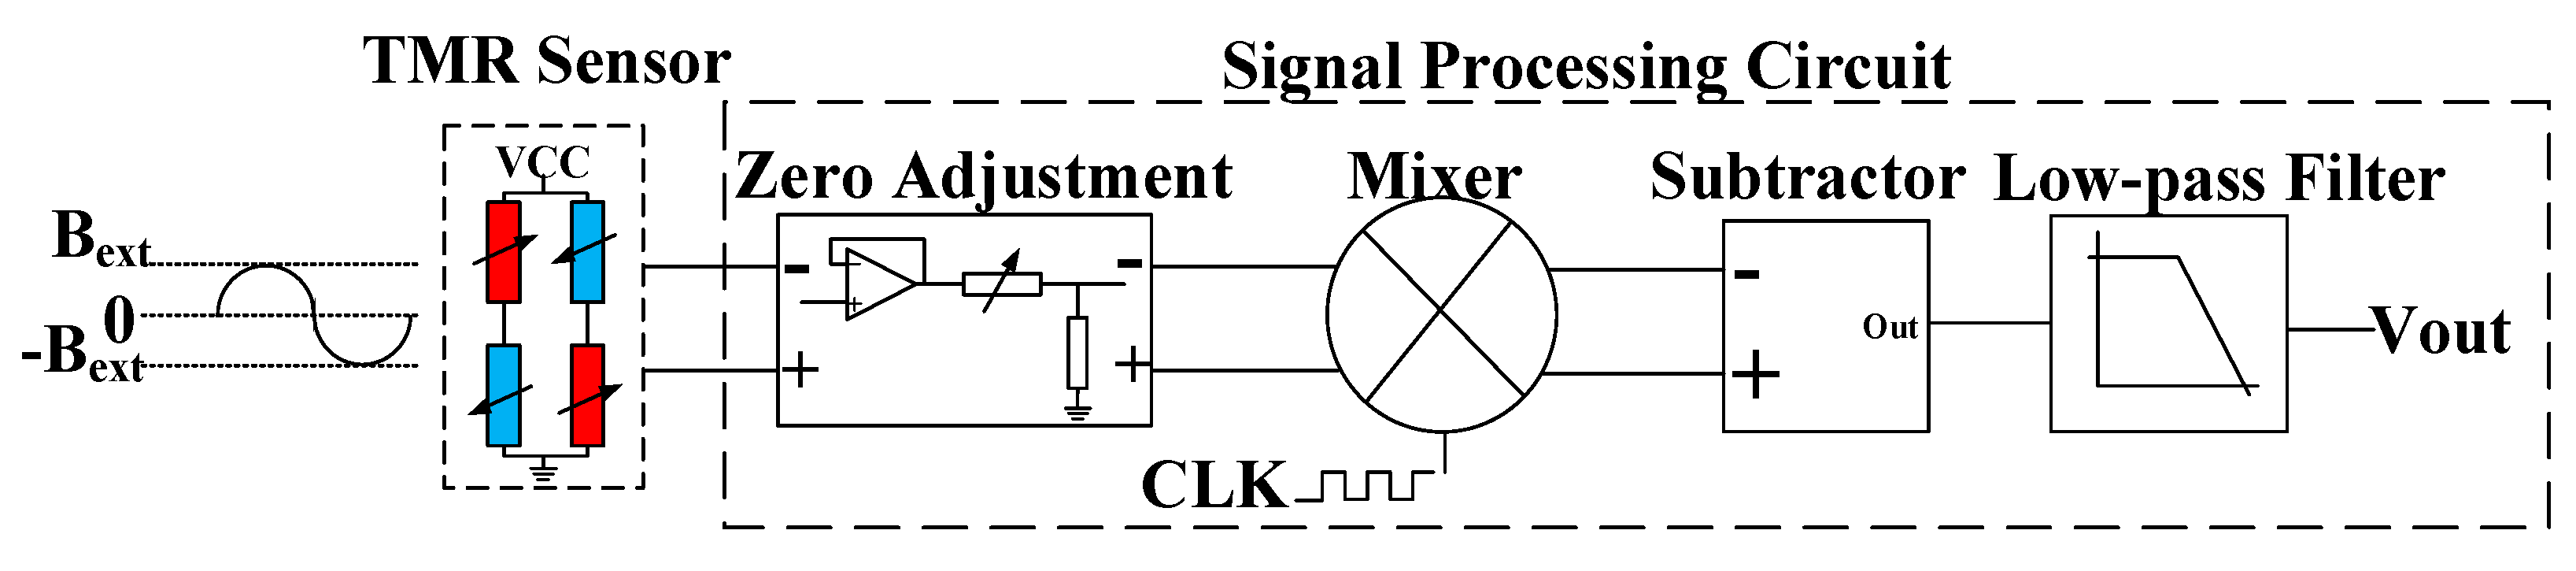
2.3. Design of Signal Processing Circuit
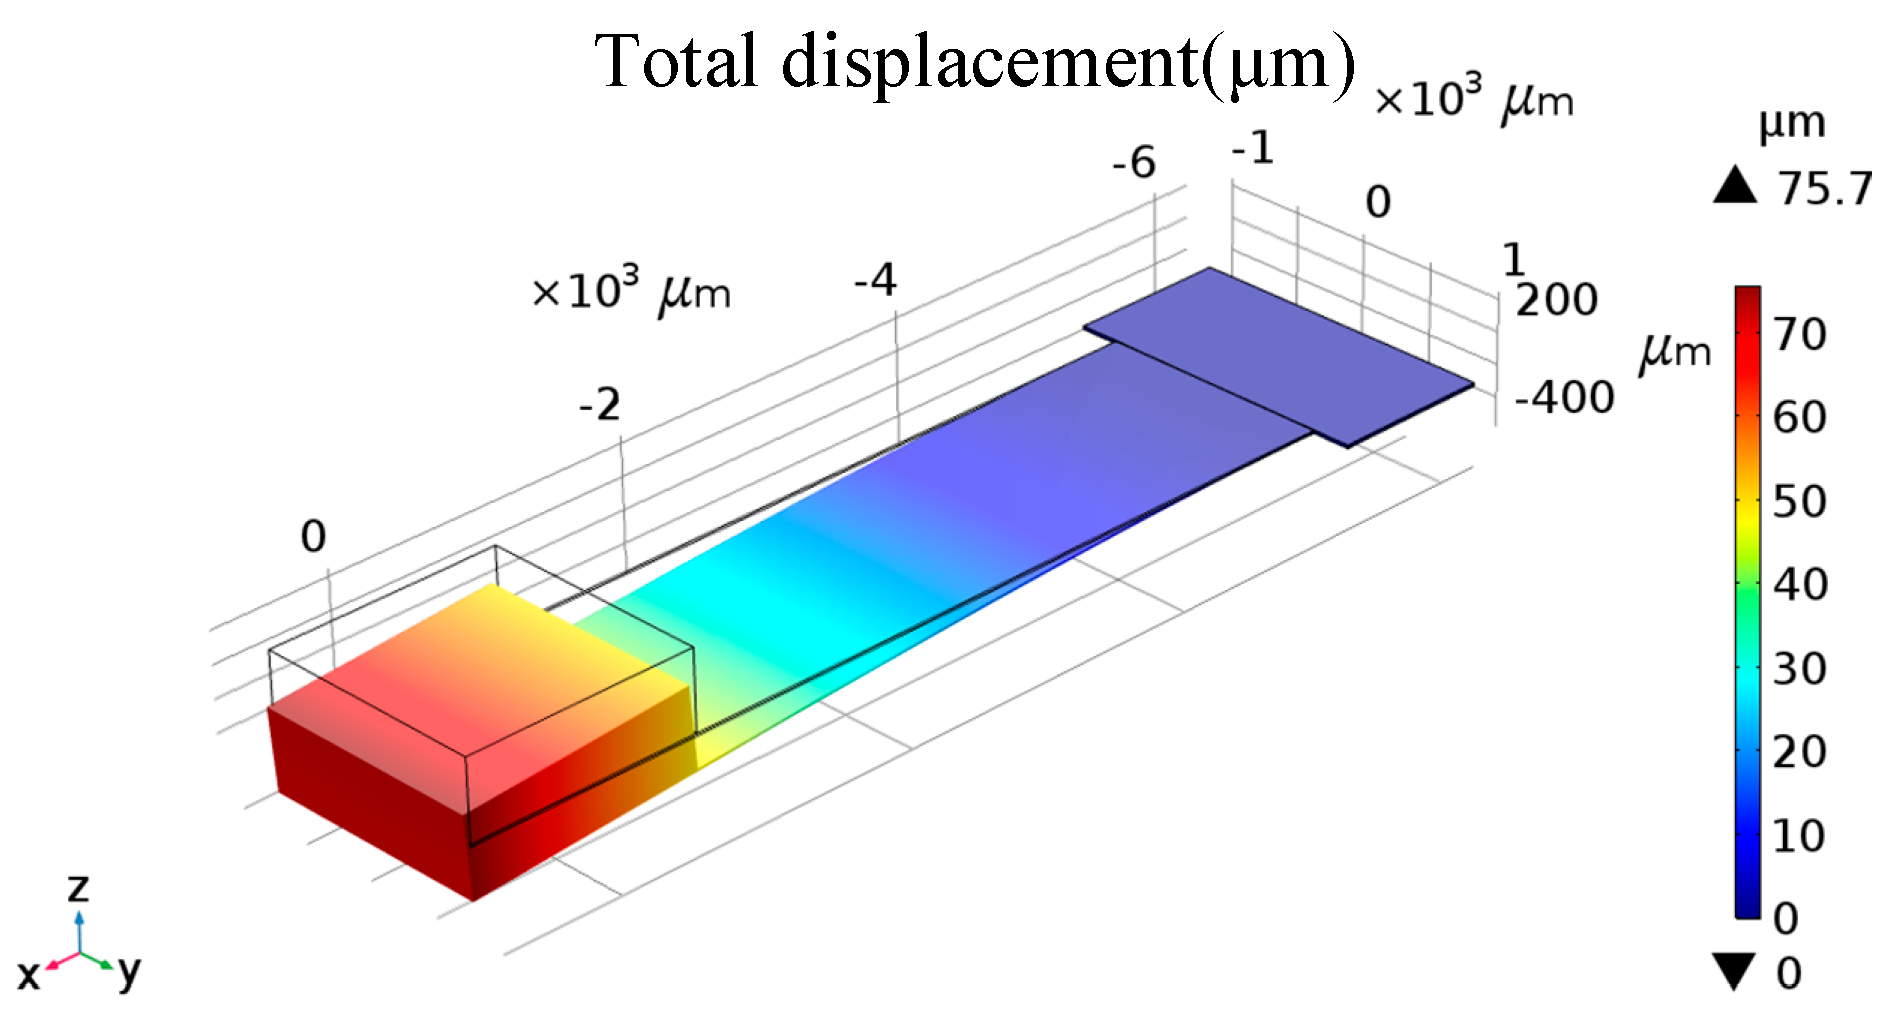
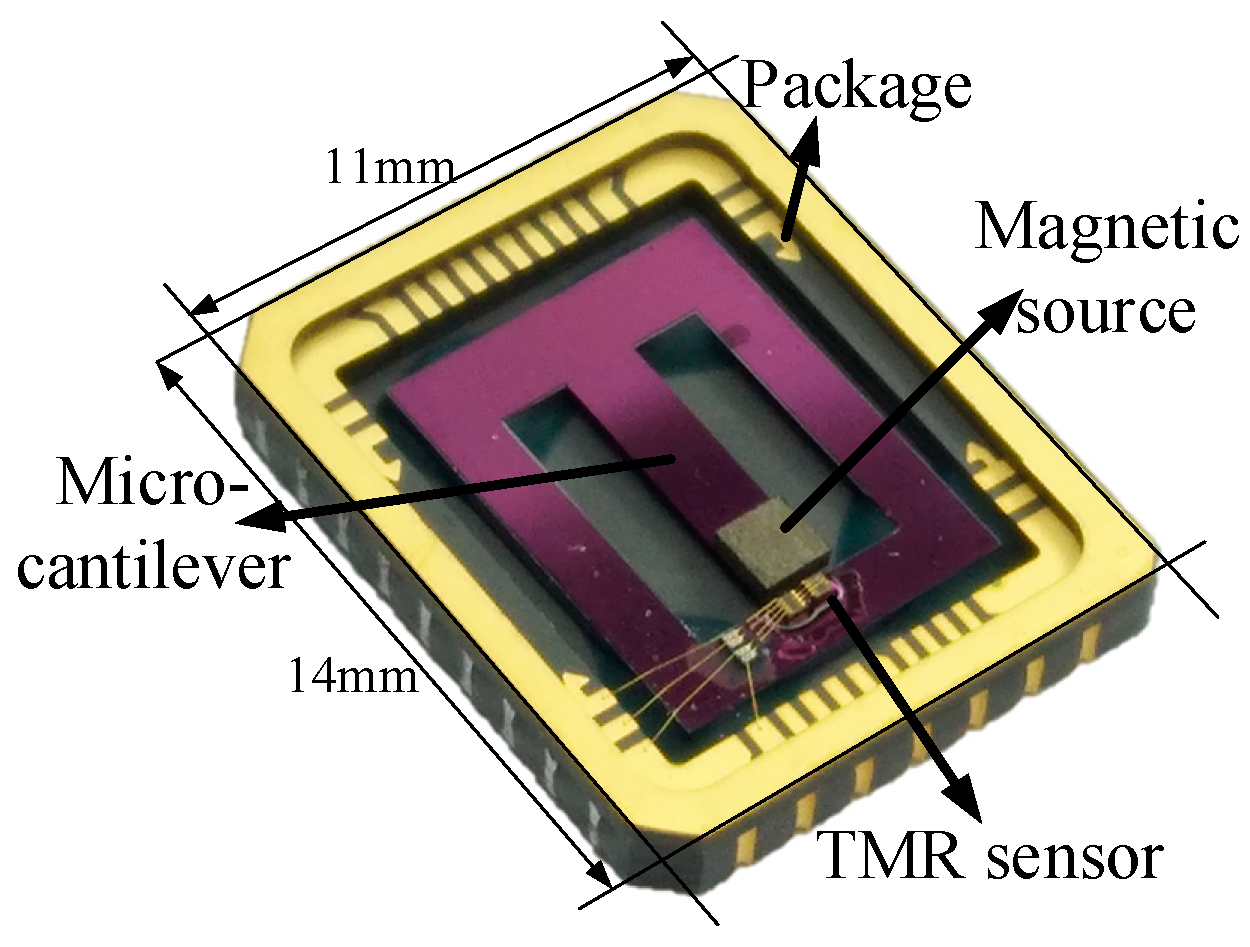
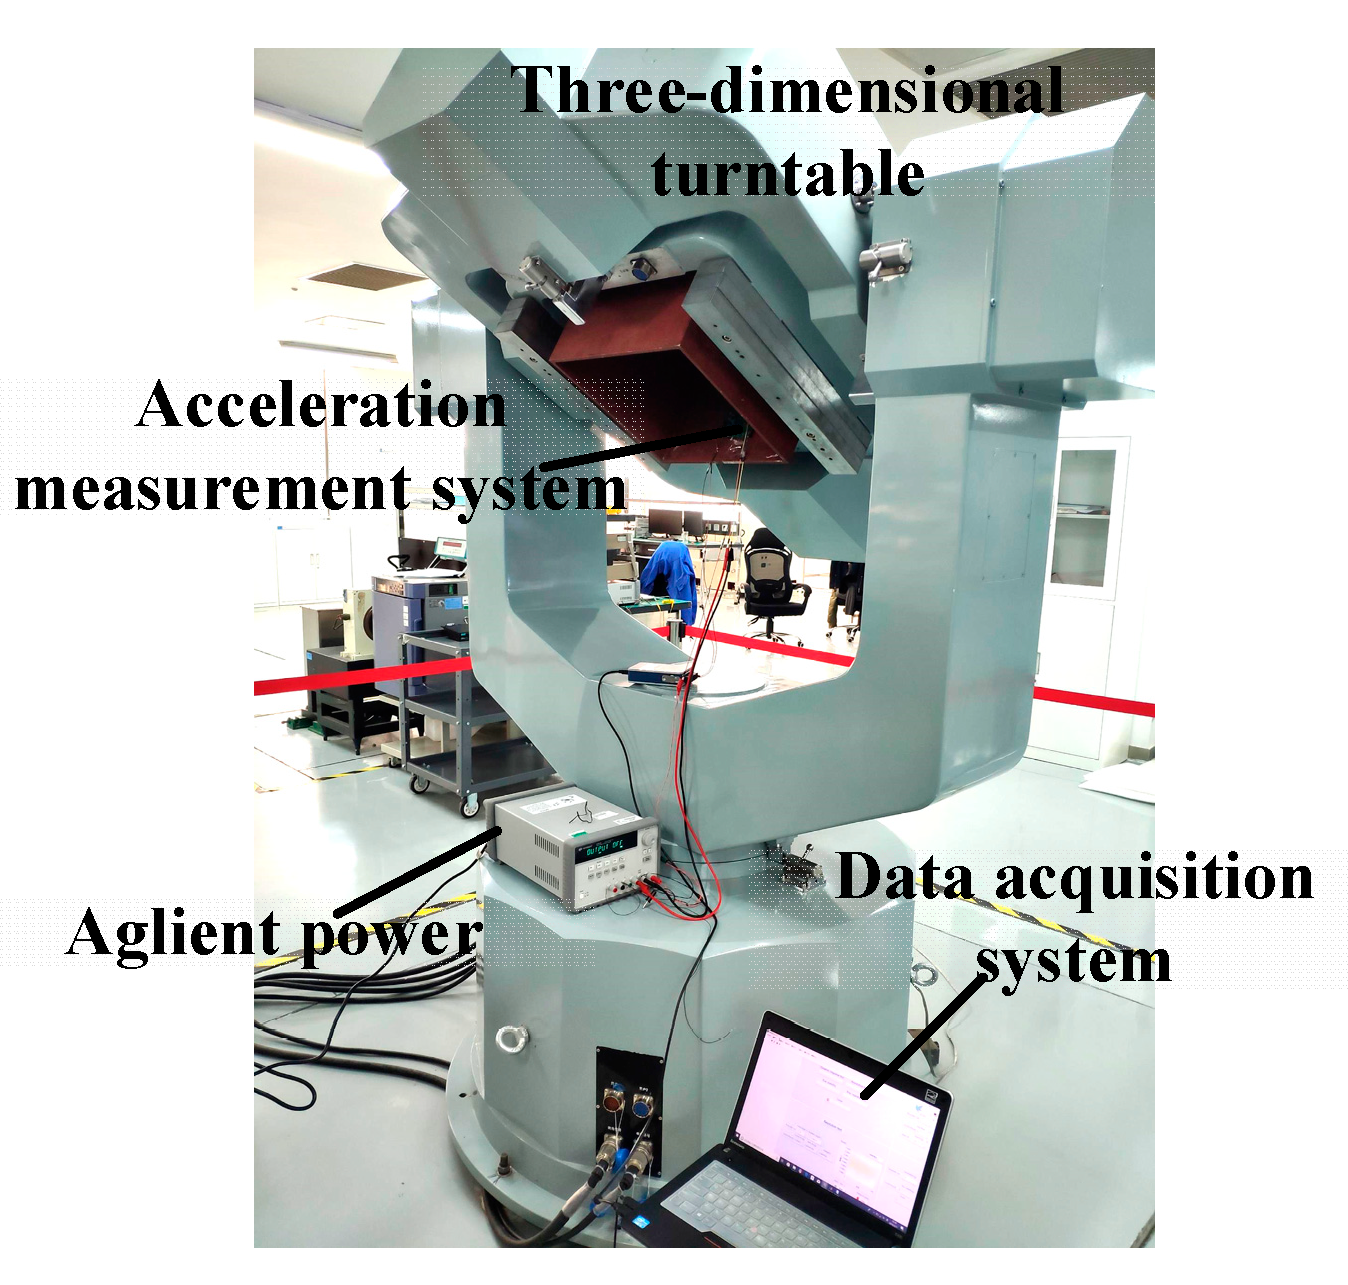
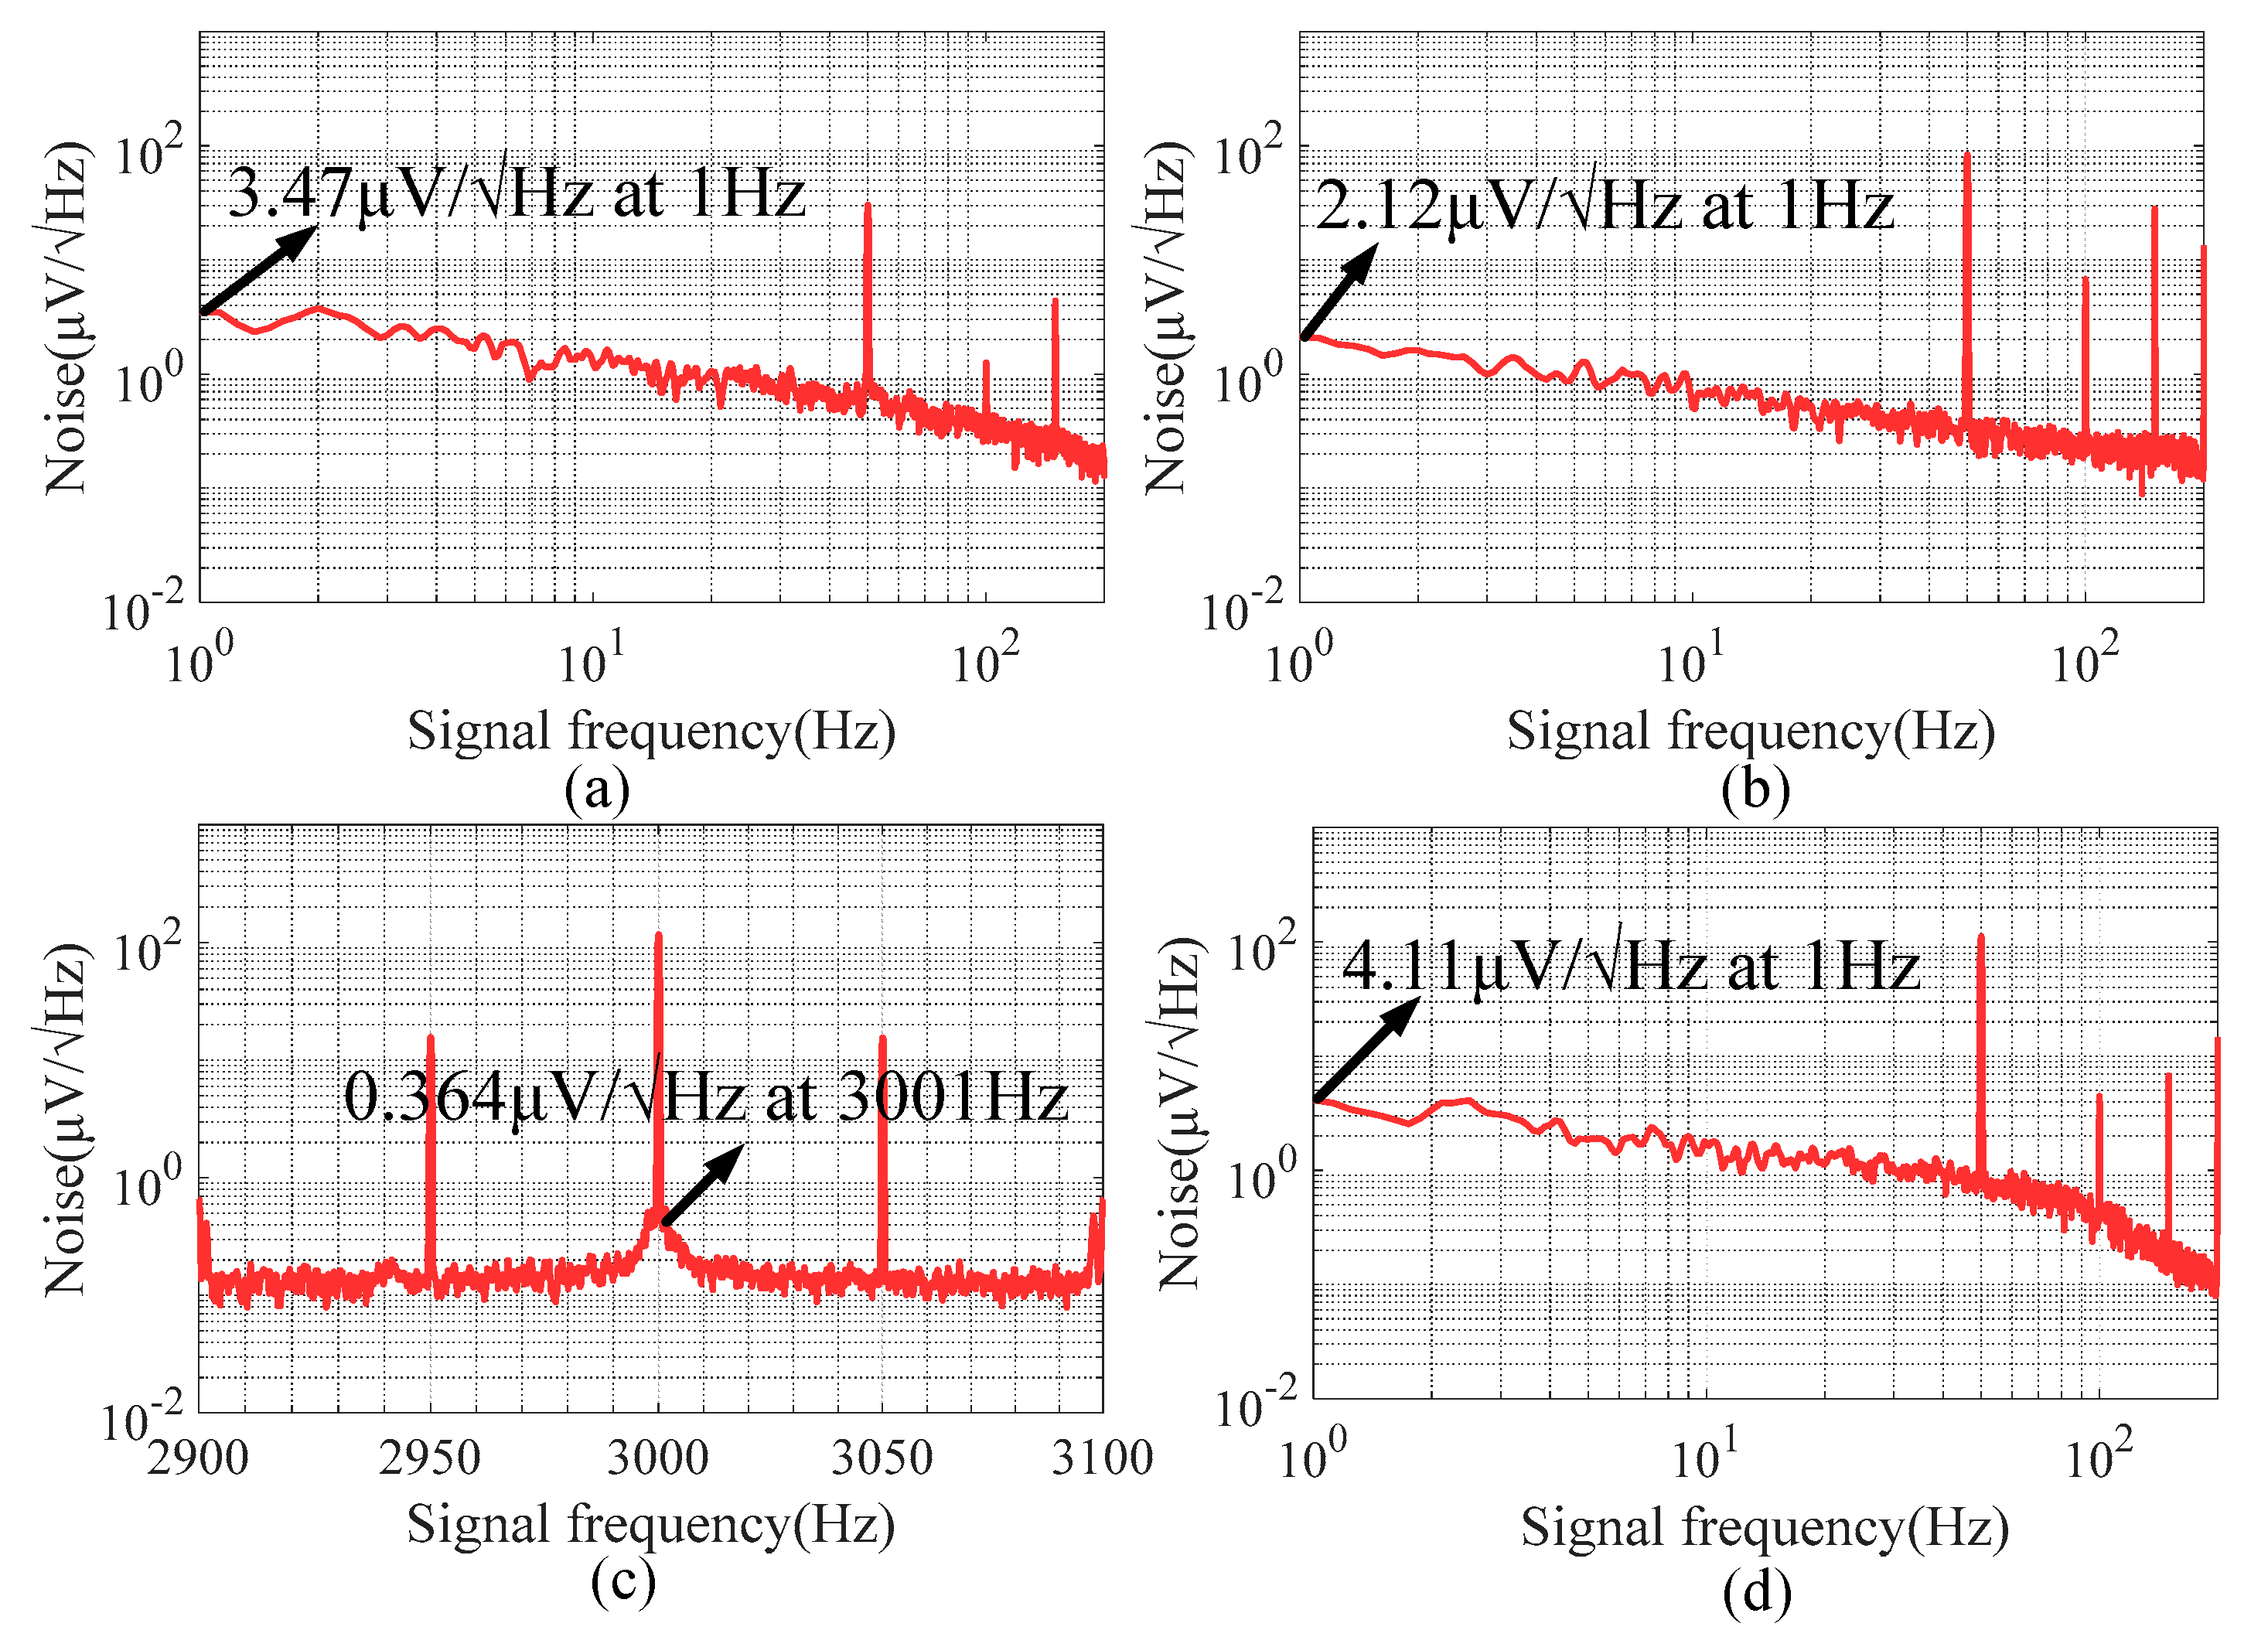
3. Results and Discussion
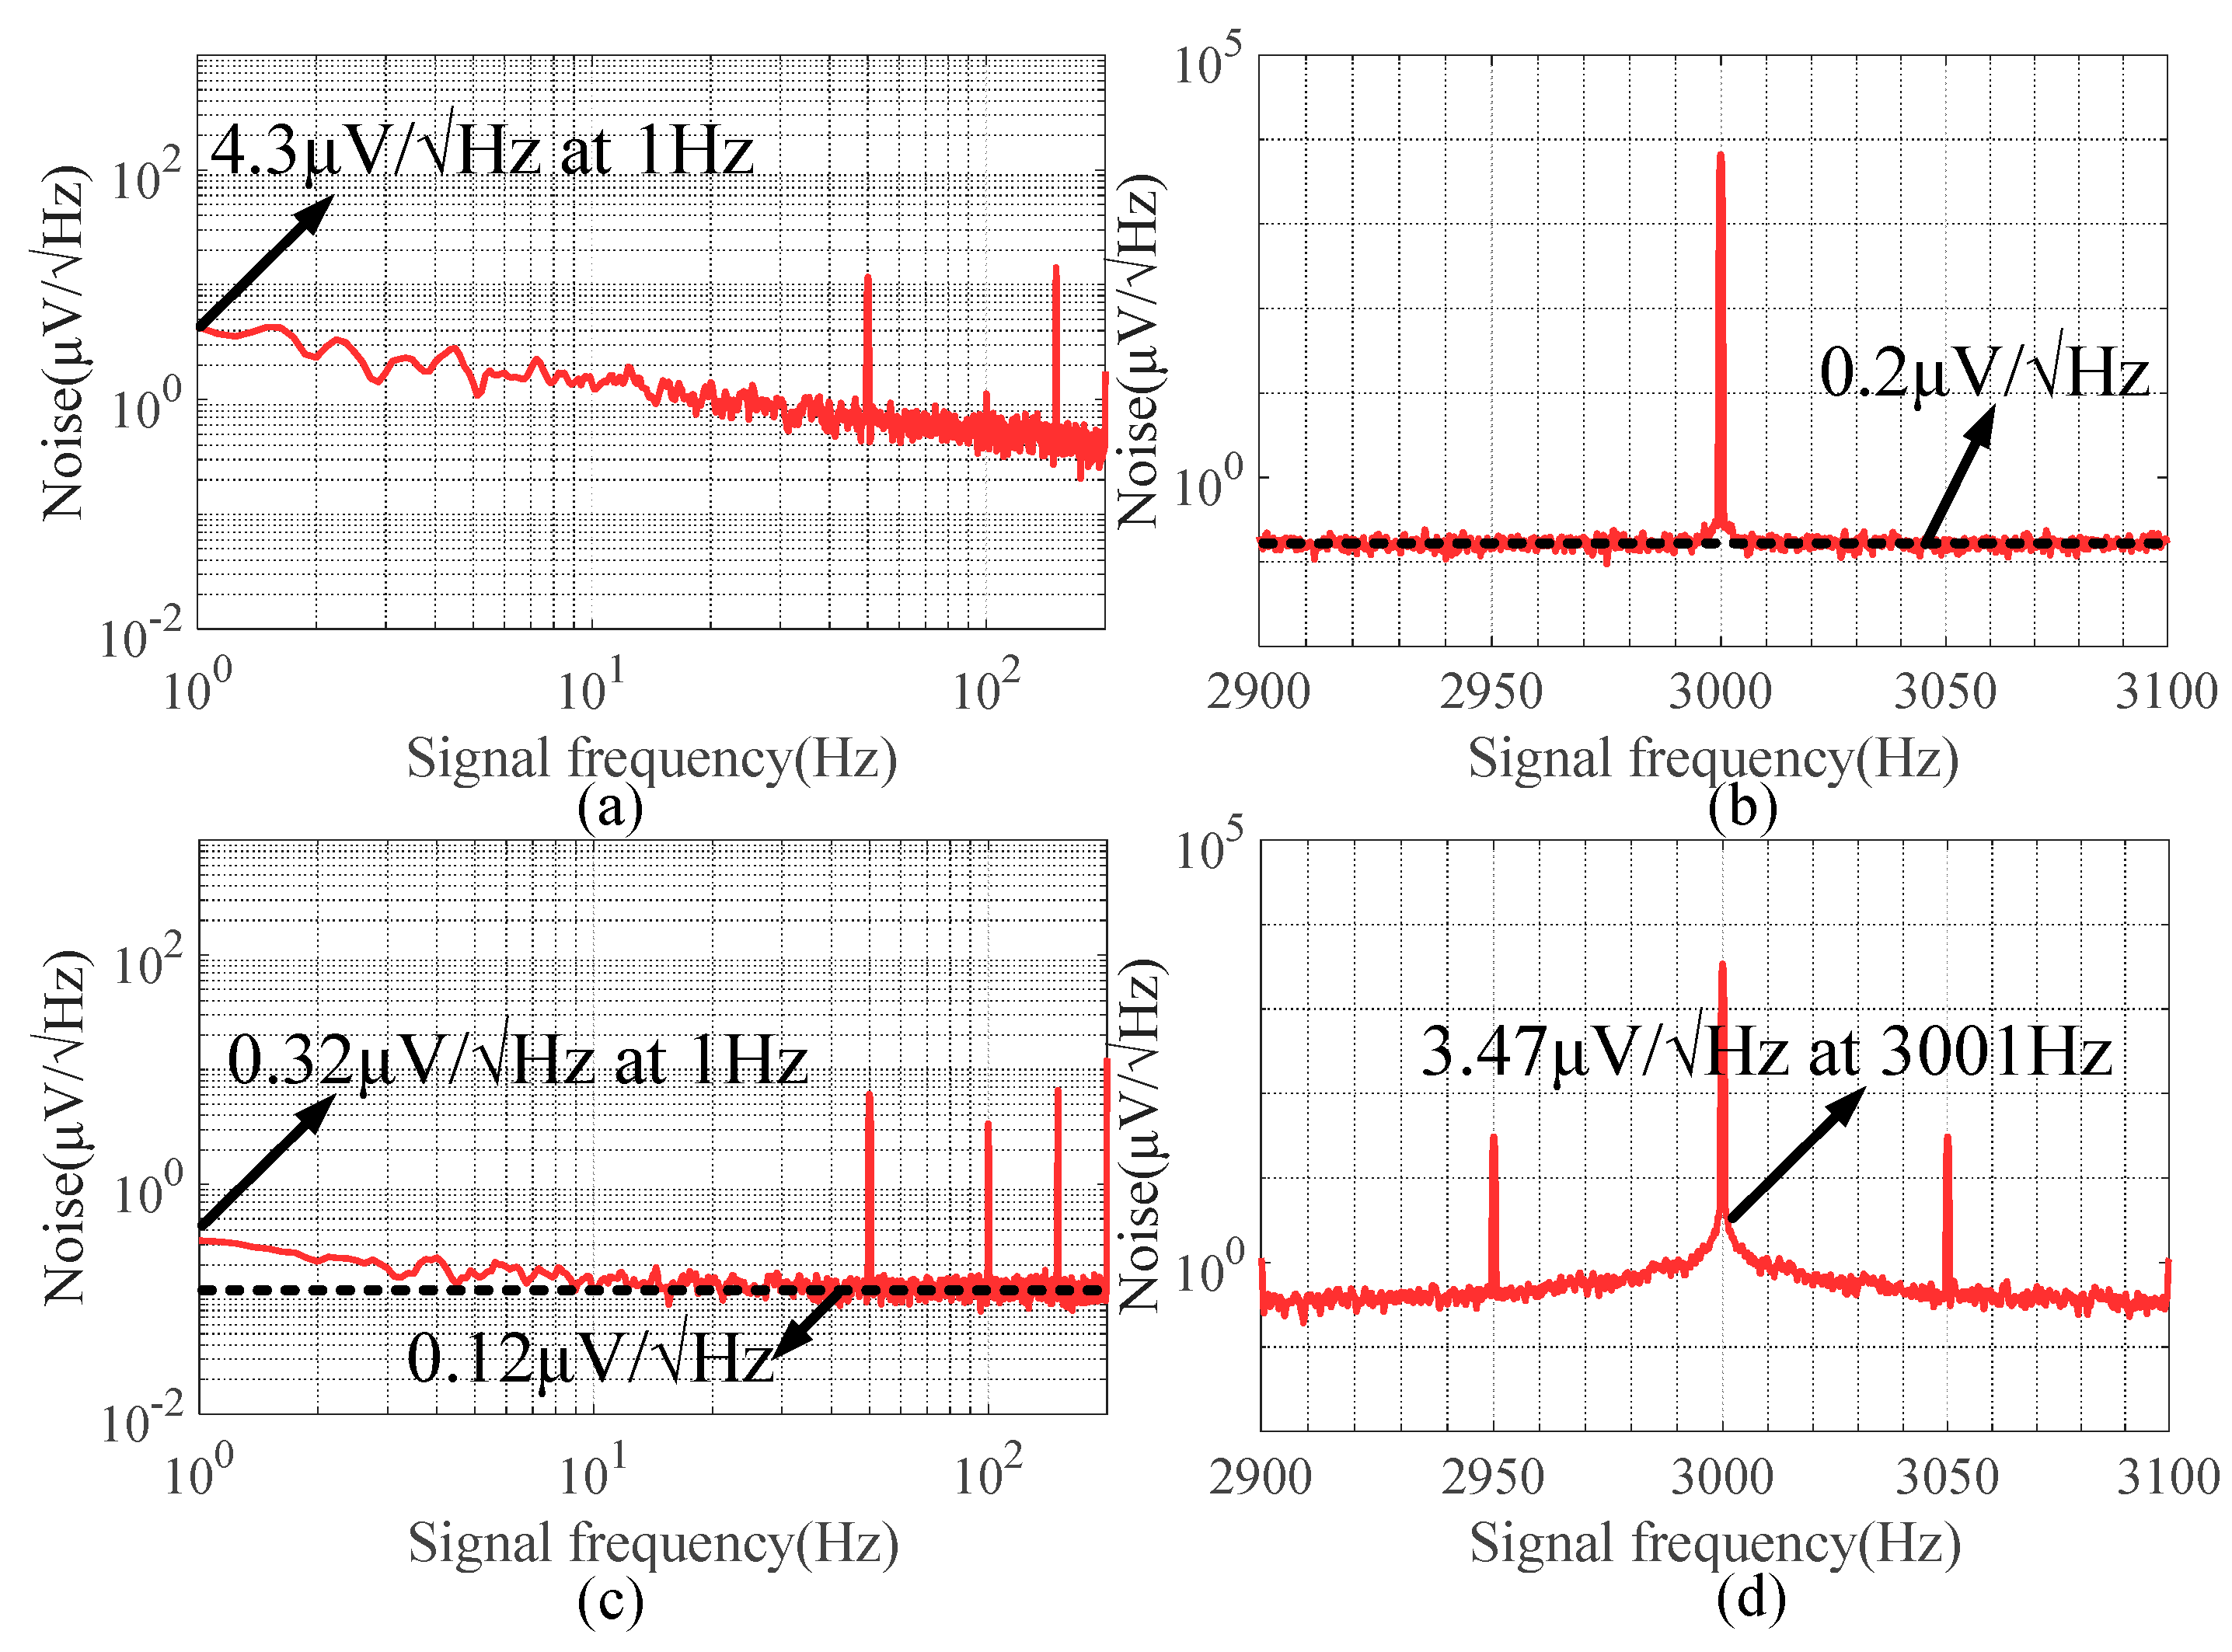
4. System Noise Suppression
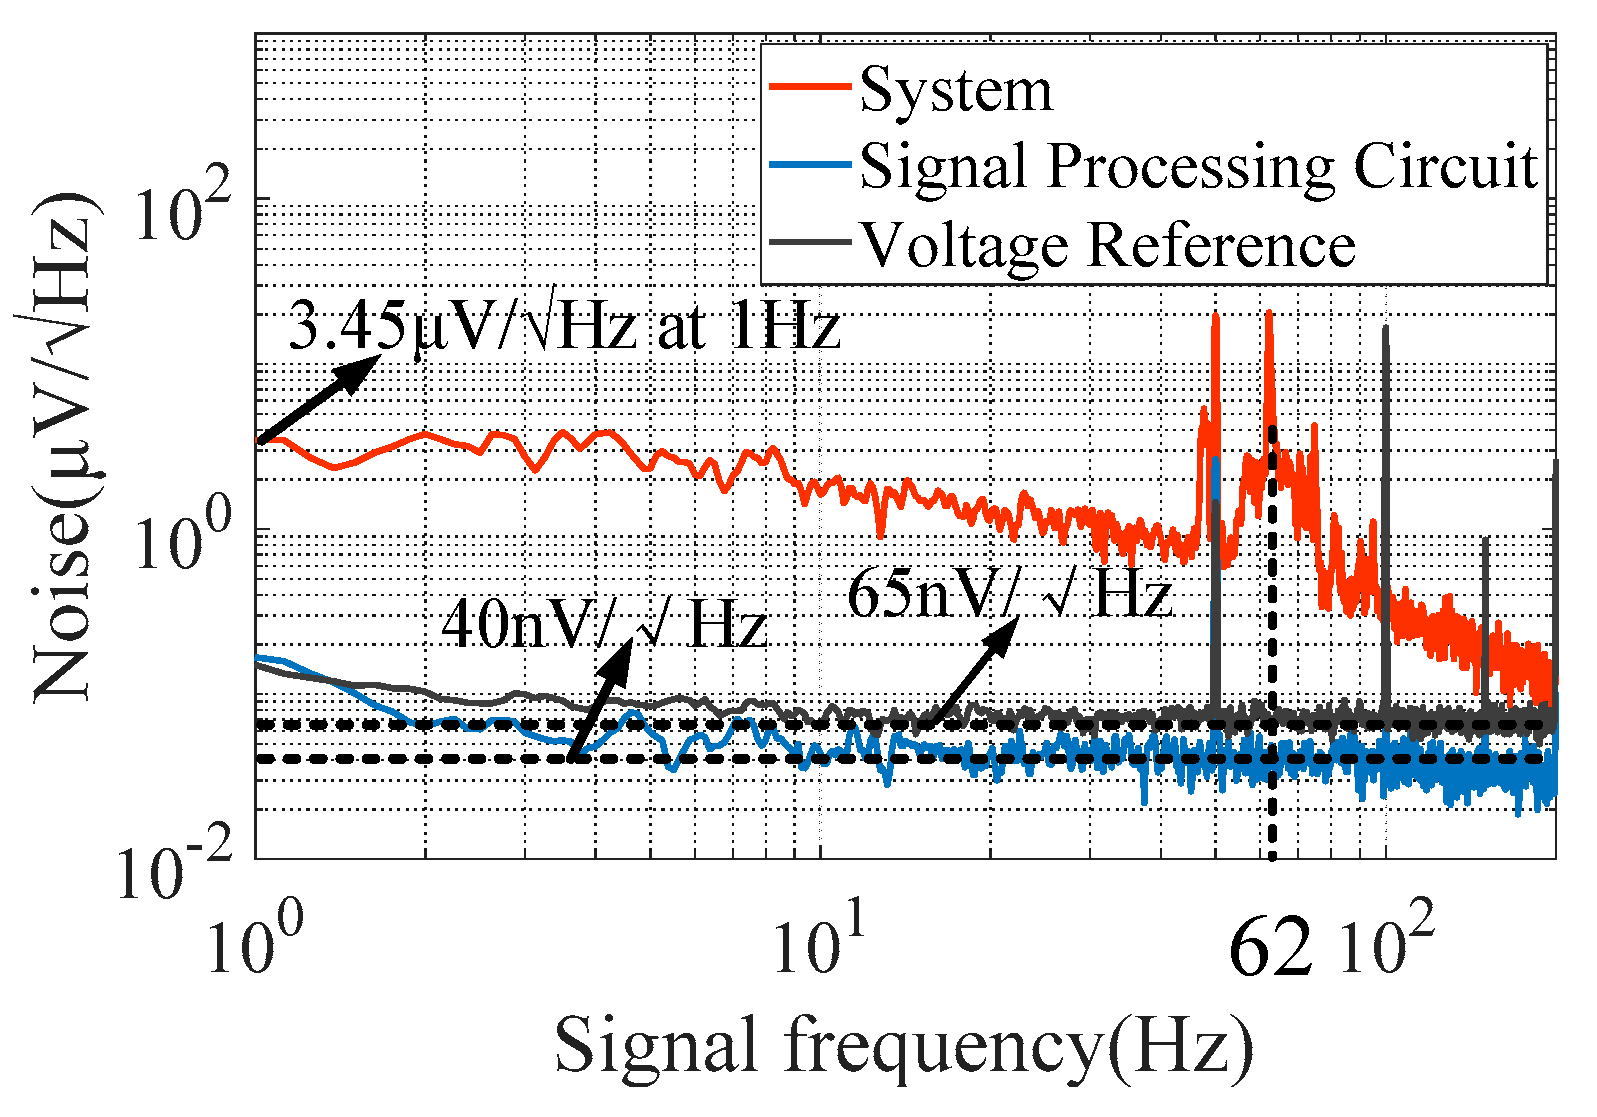
4.1. Analysis of System Noise
4.2. Modulation of Driving Source of TMR
4.3. Modulation of Sensitive Source of TMR
5. Conclusions
Author Contributions
Funding
Acknowledgments
Conflicts of Interest
References
- Middlemiss, R.; Samarelli, A.; Paul, D.; Hough, J.; Rowan, S.; Hammond, G. Measurement of the Earth tides with a MEMS gravimeter. Nature 2016, 531, 614–617. [Google Scholar] [CrossRef] [PubMed] [Green Version]
- Wang, B.; Deng, Z.; Liu, C.; Xia, Y.; Fu, M. Estimation of Information Sharing Error by Dynamic Deformation Between Inertial Navigation Systems. IEEE Trans. Ind. Electron. 2013, 61, 2015–2023. [Google Scholar] [CrossRef]
- Shao, H.; Miao, L.; Gao, W.; Shen, J. Ensemble Particle Filter Based on KLD and Its Application to Initial Alignment of the SINS in Large Misalignment Angles. IEEE Trans. Ind. Electron. 2018, 65, 8946–8955. [Google Scholar] [CrossRef]
- Sebesta, K.D.; Boizot, N. A Real-Time Adaptive High-Gain EKF, Applied to a Quadcopter Inertial Navigation System. IEEE Trans. Ind. Electron. 2013, 61, 495–503. [Google Scholar] [CrossRef]
- Zou, X.; Thiruvenkatanathan, P.; Seshia, A.A. A Seismic-Grade Resonant MEMS Accelerometer. J. Microelectromechanical Syst. 2014, 23, 768–770. [Google Scholar]
- Veluvolu, K.C.; Tatinati, S.; Hong, S.-M.; Ang, W.T. Multistep Prediction of Physiological Tremor for Surgical Robotics Applications. IEEE Trans. Biomed. Eng. 2013, 60, 3074–3082. [Google Scholar] [CrossRef]
- Wang, C.; Li, X.; Kou, K.; Wu, T.; Xiang, H. High resolution quartz flexure accelerometer based on laser self-mixing interferometry. Rev. Sci. Instruments 2015, 86, 065001. [Google Scholar] [CrossRef]
- Cervantes, F.G.; Kumanchik, L.; Pratt, J.; Taylor, J.M. High sensitivity optomechanical reference accelerometer over 10 kHz. Appl. Phys. Lett. 2014, 104, 221111. [Google Scholar] [CrossRef] [Green Version]
- Flores, J.G.F.; Huang, Y.; Li, Y.; Wang, D.; Goldberg, N.; Zheng, J.; Yu, M.; Lu, M.; Kutzer, M.; Rogers, D. A CMOS-compatible oscillation-mode optomechanical DC accelerometer at 730-ng/Hz1/2 resolution. In Proceedings of the 2016 IEEE International Symposium on Inertial Sensors and Systems, Laguna Beach, CA, USA, 22−25 February 2016; pp. 125–127. [Google Scholar]
- Tian, W.; Wu, S.C.; Zhou, Z.B.; Qu, S.B.; Bai, Y.Z.; Luo, J. High resolution space quartz-flexure accelerometer based on capacitive sensing and electrostatic control technology. Rev. Sci. Instruments 2012, 83, 095002. [Google Scholar] [CrossRef]
- Zou, X.; Seshia, A.A. A high-resolution resonant MEMS accelerometer, Solid-State Sensors, Actuators and Microsystems (TRANSDUCERS). In Proceedings of the 2015 Transducers—2015 18th International Conference on Solid-State Sensors, Actuators and Microsystems (TRANSDUCERS), Anchorage, AK, USA, 21−25 June 2015; pp. 1247–1250. [Google Scholar]
- Seshia, A.; Palaniapan, M.; Roessig, T.; Howe, R.; Gooch, R.; Schimert, T.; Montague, S. A vacuum packaged surface micromachined resonant accelerometer. J. Microelectromechanical Syst. 2002, 11, 784–793. [Google Scholar] [CrossRef] [Green Version]
- Liu, C.-H.; Kenny, T. A high-precision, wide-bandwidth micromachined tunneling accelerometer. J. Microelectromechanical Syst. 2001, 10, 425–433. [Google Scholar]
- Cui, T.; Wang, J. Polymer-based wide-bandwidth and high-sensitivity micromachined electron tunneling accelerometers using hot embossing. J. Microelectromechanical Syst. 2005, 14, 895–902. [Google Scholar]
- Aydemir, A.; Terzioglu, Y.; Akın, T. A new design and a fabrication approach to realize a high performance three axes capacitive MEMS accelerometer. Sensors Actuators A: Phys. 2016, 244, 324–333. [Google Scholar] [CrossRef]
- Xu, H.; Liu, X.; Yin, L. A Closed-Loop ∆Σ Interface for a High-Q Micromechanical Capacitive Accelerometer With 200 ng/√Hz Input Noise Density. IEEE J. Solid-St. Circ. 2015, 50, 2101–2112. [Google Scholar] [CrossRef]
- Dong, Y.; Zwahlen, P.; Nguyen, A.M.; Frosio, R.; Rudolf, F. Ultra-high precision MEMS accelerometer. In Proceedings of the 2011 16th International Solid-State Sensors, Actuators and Microsystems Conference, Beijing, China, 5−9 June 2011; pp. 695–698. [Google Scholar]
- Amini, B.V.; Abdolvand, R.; Ayazi, F. A 4.5-mW Closed-Loop ∆Σ Micro-Gravity CMOS SOI Accelerometer. IEEE J. Solid-St. Circ. 2006, 41, 2983–2991. [Google Scholar] [CrossRef]
- Paavola, M.; Kamarainen, M.; Jarvinen, J.A.M.; Saukoski, M.; Laiho, M.; Halonen, K.A.I. A Micropower Interface ASIC for a Capacitive 3-Axis Micro-Accelerometer. IEEE J. Solid-state Circuits 2007, 42, 2651–2665. [Google Scholar] [CrossRef]
- Young, D.J.; Zurcher, M.A.; Semaan, M.; Megerian, C.A.; Ko, W.H. MEMS Capacitive Accelerometer-Based Middle Ear Microphone. IEEE Trans. Biomed. Eng. 2012, 59, 3283–3292. [Google Scholar] [CrossRef]
- Phan, K.; Mauritz, A.; Homburg, F. A novel elastomer-based magnetoresistive accelerometer. Sens. Actuators A Phys. 2008, 145, 109–115. [Google Scholar] [CrossRef]
- Shoji, S. Acceleration Sensor and Magnetic Disk Drive Apparatus. US Patent US7222535B2, 29 May 2007. [Google Scholar]
- Takemura, R.; Kawahara, T.; Miura, K.; Yamamoto, H.; Hayakawa, J.; Matsuzaki, N.; Ono, K.; Yamanouchi, M.; Ito, K.; Takahashi, H.; et al. A 32-Mb SPRAM with 2T1R Memory Cell, Localized Bi-Directional Write Driver and ‘1’/‘0’ Dual-Array Equalized Reference Scheme. IEEE J. Solid-State Circuits 2010, 45, 869–879. [Google Scholar] [CrossRef]
- Lee, Y.M.; Hayakawa, J.; Ikeda, S.; Matsukura, F.; Ohno, H. Effect of electrode composition on the tunnel magnetoresistance of pseudo-spin-valve magnetic tunnel junction with a MgO tunnel barrier. Appl. Phys. Lett. 2007, 90, 212507. [Google Scholar] [CrossRef]
- Hayakawa, J.; Ikeda, S.; Lee, Y.M.; Matsukura, F.; Ohno, H. Effect of high annealing temperature on giant tunnel magnetoresistance ratio of CoFeB/MgO/CoFeB magnetic tunnel junctions. Appl. Phys. Lett. 2006, 89, 232510. [Google Scholar] [CrossRef] [Green Version]
- Ikeda, S.; Hayakawa, J.; Ashizawa, Y.; Lee, Y.M.; Miura, K.; Hasegawa, H.; Tsunoda, M.; Matsukura, F.; Ohno, H. Tunnel magnetoresistance of 604% at 300K by suppression of Ta diffusion in CoFeB/MgO/CoFeB pseudo-spin-valves annealed at high temperature. Appl. Phys. Lett. 2008, 93, 082508. [Google Scholar] [CrossRef]
- Polovy, H.; Guerrero, R.; Scola, J.; Lecoeur, M.P.; Fermon, C.; Feng, G.; Fahy, K.; Cardoso, S.; Almeida, J.; De Freitas, S.C. Noise of MgO-based magnetic tunnel junctions. J. Magn. Magn. Mater. 2010, 322, 1624–1627. [Google Scholar] [CrossRef]
- Herranz, D.; Bonell, F.; Gomez-Ibarlucea, A.; Andrieu, S.; Montaigne, F.; Villar, R.; Tiusan, C.; Aliev, F.G. Strongly suppressed 1/f noise and enhanced magnetoresistance in epitaxial Fe–V/MgO/Fe magnetic tunnel junctions. Appl. Phys. Lett. 2010, 96, 202501. [Google Scholar] [CrossRef] [Green Version]
- Gao, L.; Yao, Y.; Li, S.; Xu, X.; Xu, D. Micro Acceleration Measurement System Based On Highly-Sensitive Tunnel Magneto-Resistance Sensor. In Proceedings of the 2019 IEEE International Symposium on Inertial Sensors and Systems (INERTIAL), Naples, FL, USA, 1−5 April 2019; pp. 1–4. [Google Scholar]
- Tang, Q.; He, Q.; Li, M.; Dong, C.; Xu, D.; Li, X. Wireless Alarm Microsystem Self-powered by Vibration-threshold Triggered Energy-harvester. IEEE Trans. Ind. Electron. 2015, 63, 2447–2456. [Google Scholar] [CrossRef]
- Zhao, J.; Gao, R.; Liu, S.; Huang, Y. A New Sensitivity-Improving Method for Piezoelectric Resonance Mass Sensors Through Cantilever Cross-Section Modification. IEEE Trans. Ind. Electron. 2013, 61, 1612–1621. [Google Scholar] [CrossRef]
- Scott, S.; Kim, J.-I.; Sadeghi, F.; Peroulis, D. An Analytical Capacitance Model of Temperature-Sensitive, Large-Displacement Multimorph Cantilevers: Numerical and Experimental Validation. J. Microelectromechanical Syst. 2011, 21, 161–170. [Google Scholar] [CrossRef]
- Cao, H.; Li, H.; Liu, J.; Shi, Y.; Tang, J.; Liu, N. An improved interface and noise analysis of a turning fork microgyroscope structure. Mech. Syst. Signal Process. 2016, 70, 1209–1220. [Google Scholar] [CrossRef]
- Rinaldi, G.; Packirisamy, M.; Stiharu, I. Dynamic Synthesis of Microsystems Using the Segment Rayleigh–Ritz Method. J. Microelectromechanical Syst. 2008, 17, 1468–1480. [Google Scholar] [CrossRef]
- Khan, M.M.; Panwar, N.; Dhawan, R. Modified cantilever beam shaped FBG based accelerometer with self temperature compensation. Sensors Actuators A: Phys. 2014, 205, 79–85. [Google Scholar] [CrossRef]
- Itzke, A.; Weiss, R.; Weigel, R. Influence of the Conductor Position on a Circular Array of Hall Sensors for Current Measurement. IEEE Trans. Ind. Electron. 2018, 66, 580–585. [Google Scholar] [CrossRef]
- Lahdo, M.; Strohla, T.; Kovalev, S. Repulsive Magnetic Levitation Force Calculation For A High Precision 6-DoF Magnetic Levitation Positioning System. IEEE Trans. Magn. 2016, 53, 7200106. [Google Scholar] [CrossRef]
- Giusi, G.; Crupi, F.; Pace, C.; Magnone, P. Full Model and Characterization of Noise in Operational Amplifier. IEEE Trans. Circuits Syst. I: Regul. Pap. 2009, 56, 97–102. [Google Scholar] [CrossRef]
- Yang, B.; Wang, B.; Yan, H.; Gao, X. Design of a Micromachined Z-axis Tunneling Magnetoresistive Accelerometer with Electrostatic Force Feedback. Micromachines 2019, 10, 158. [Google Scholar] [CrossRef] [Green Version]
- Schlageter, V.; Besse, P.-A.; Popovic, R.; Kucera, P. Tracking system with five degrees of freedom using a 2D-array of Hall sensors and a permanent magnet. Sensors Actuators A: Phys. 2001, 92, 37–42. [Google Scholar] [CrossRef]
- Yao, Y.; Xue, C.; Wang, P.; Young, D.; Xu, D. A Novel Method of Acceleration Measurement Based On Tunneling Magnetoresistance. In Proceedings of the Asia-Pacific Conference of Transducers and Micro-Nano Technology 2018, Hong Kong, China, 24–27 June 2018. [Google Scholar]
- Hu, J.; Pan, M.; Tian, W.; Chen, D.; Luo, F. Integrating magnetoresistive sensors with microelectromechanical systems for noise reduction. Appl. Phys. Lett. 2012, 101, 234101. [Google Scholar] [CrossRef]
- Jander, A.; Nordman, C.A.; Pohm, A.V.; Anderson, J.M. Chopping techniques for low-frequency nanotesla spin-dependent tunneling field sensors. J. Appl. Phys. 2003, 93, 8382. [Google Scholar] [CrossRef]


| Parameter | Value | Parameter | Value |
|---|---|---|---|
| Micro-cantilever (length × width × height (μm)) | 6000 × 1500 × 15 | Density of micro-cantilever (g/cm3) | 2.33 |
| Permanent magnet (length × width × height (μm)) | 1500 × 1500 × 500 | Density of magnet (g/cm3) | 8.4 |
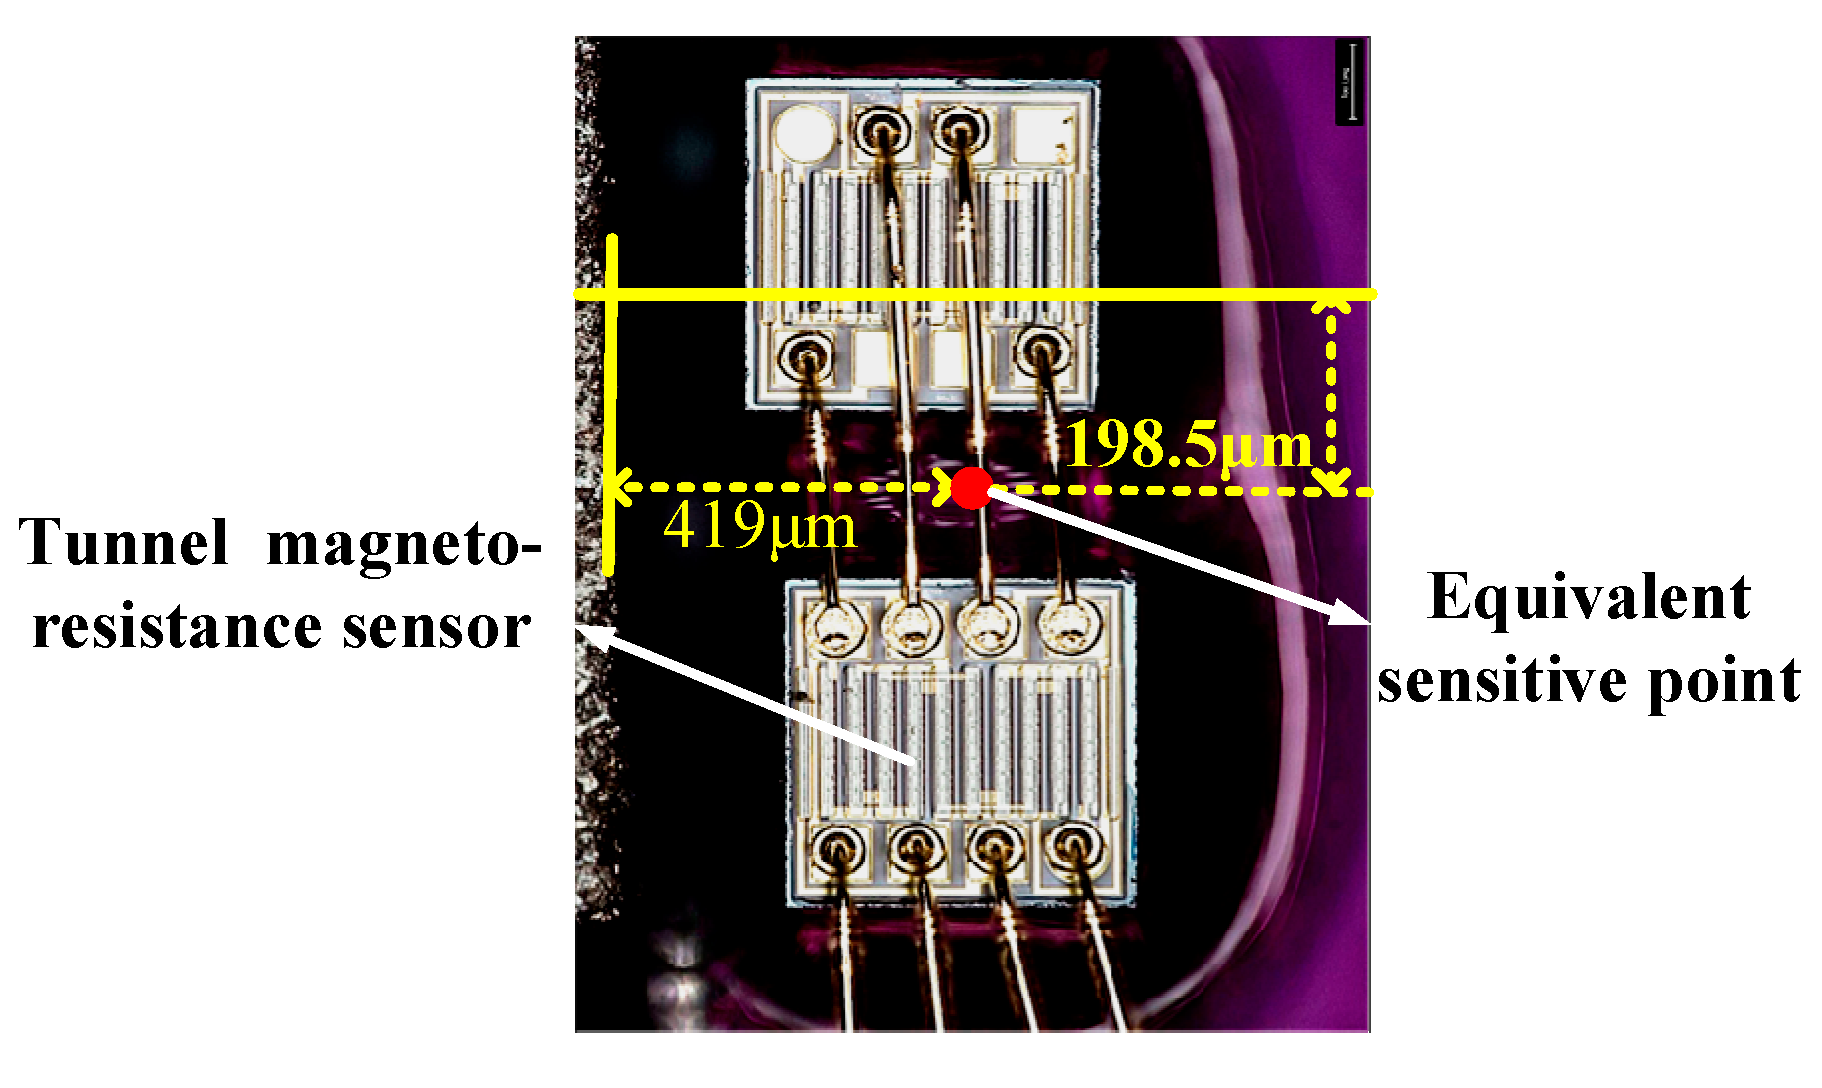
| Coordinates of sensitive point ((x, y, z) (μm)) | (1169, -198.5, 0) | Remanence (T) | 1.023 |
| Sensitivity of mechanical displacement (μm/g) | 75.7 | Resonant frequency (Hz) | 62.37 |
| Sensitivity of Hx (Oe/μm) | 2.72 | Linear region of Hx (μm) | ±161 |
| Sensitivity of TMR (mV/V/Oe) | 0.31 | Mechanical–thermal noise (ng/√Hz) | 4.85 |
| Parameter | Value | Parameter | Value |
|---|---|---|---|
| Measurement range (g) | ±2 | Sensitivity (mV/g) | 181 |
| Noise floor of the signal processing circuit (μg/√Hz) | 0.2 | Resolution (μg/√Hz at 1 Hz) | 19 |
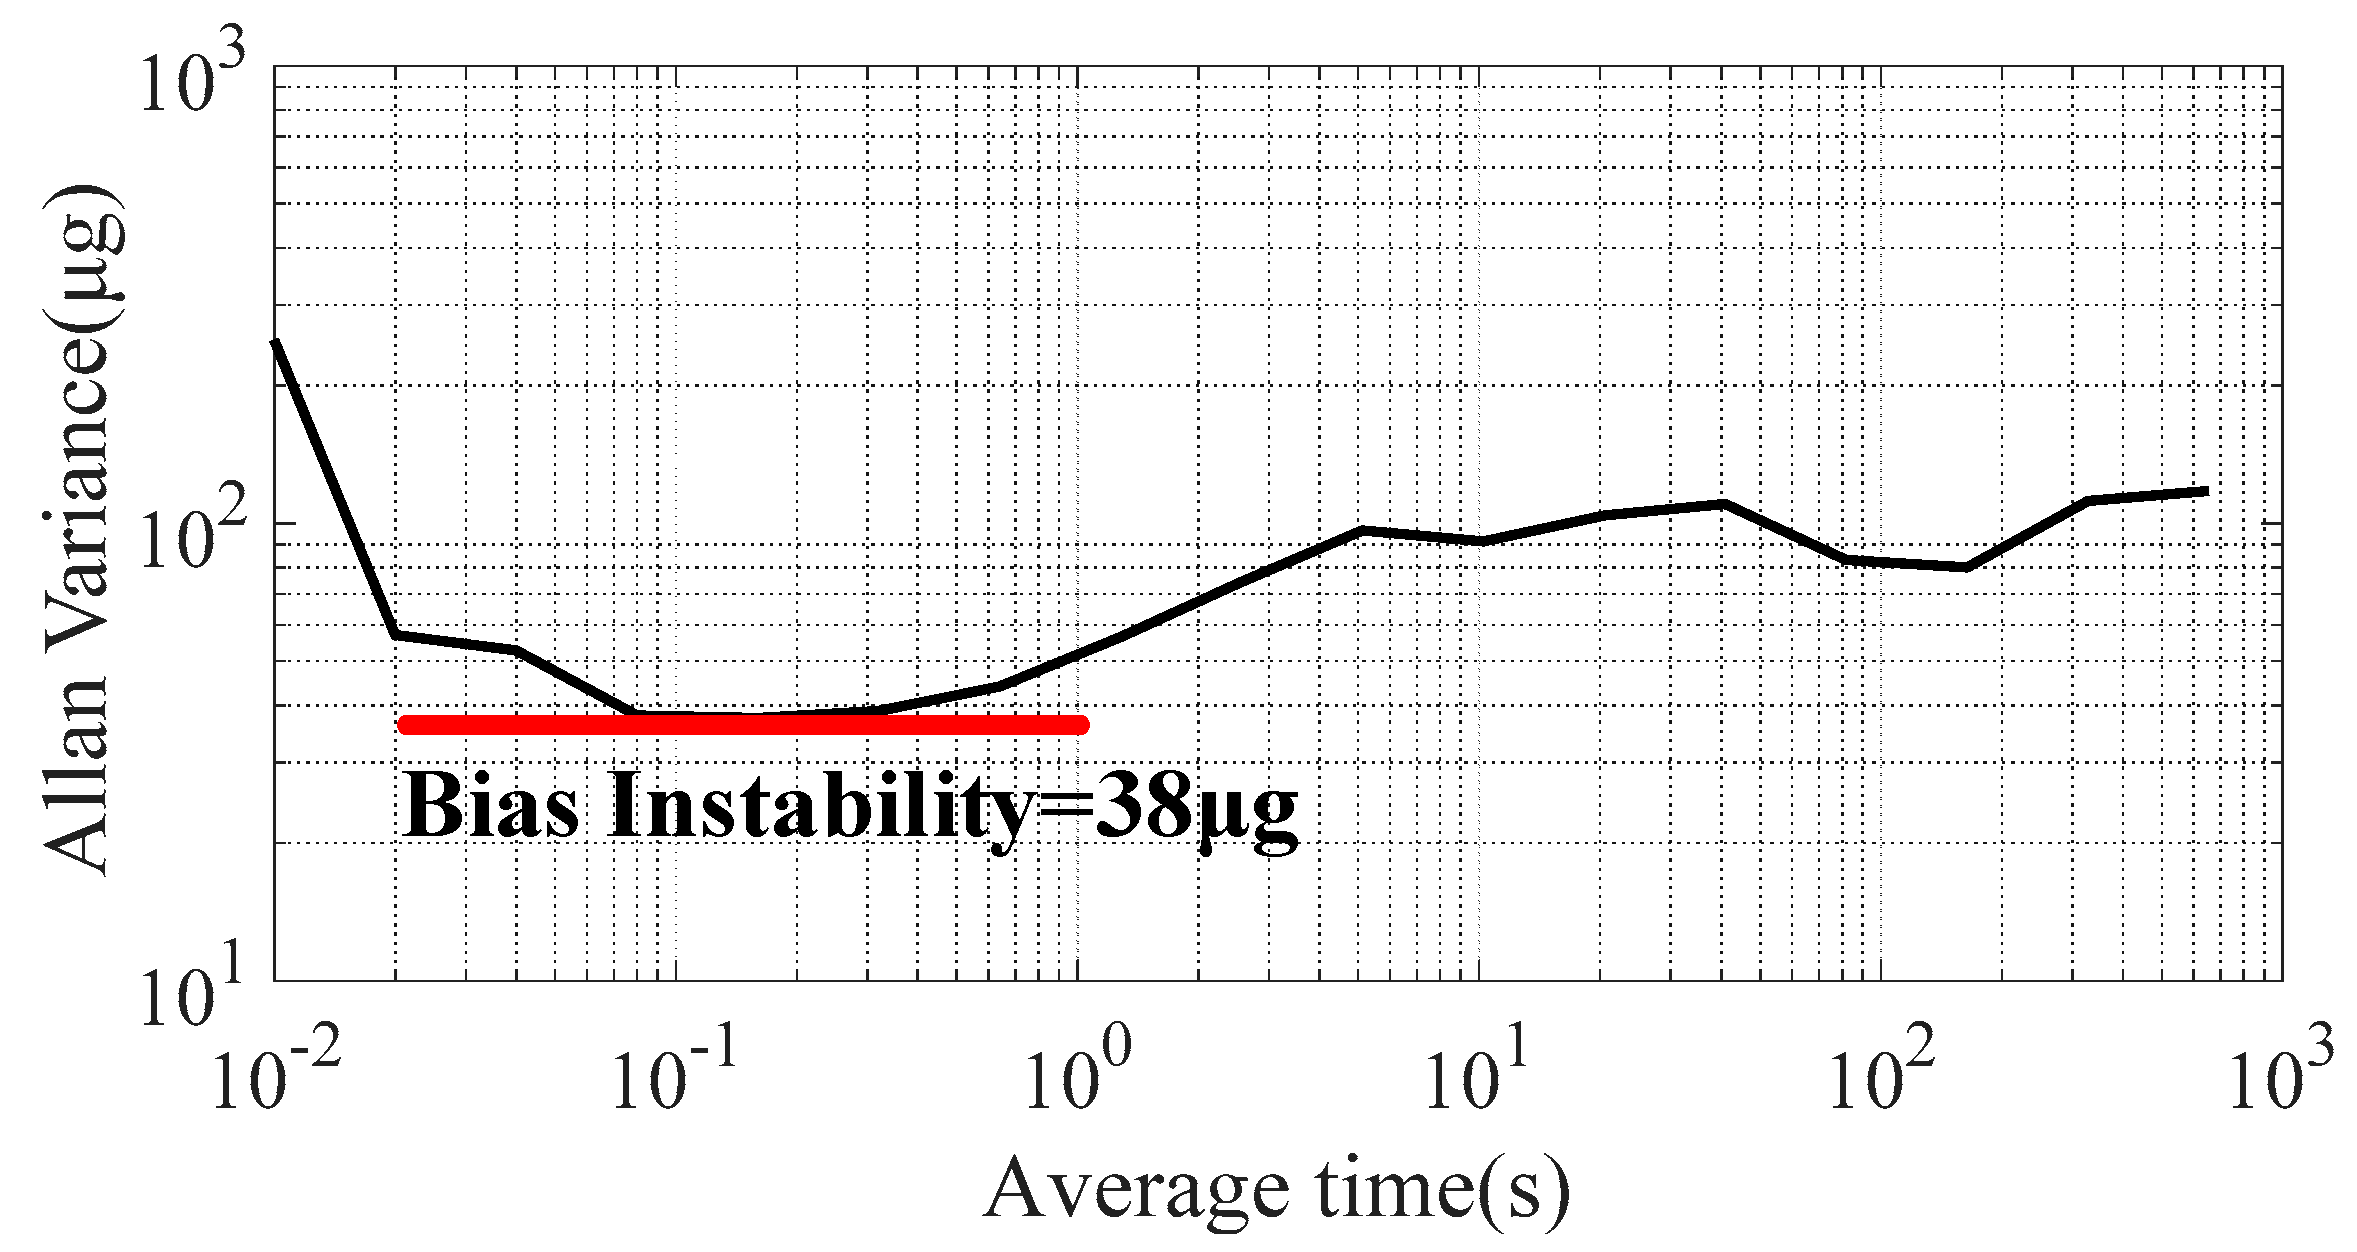
| Bias stability (μg) | 266 | Bias instability (μg) | 38 |
© 2020 by the authors. Licensee MDPI, Basel, Switzerland. This article is an open access article distributed under the terms and conditions of the Creative Commons Attribution (CC BY) license (http://creativecommons.org/licenses/by/4.0/).
Share and Cite
Gao, L.; Chen, F.; Yao, Y.; Xu, D. High-Precision Acceleration Measurement System Based on Tunnel Magneto-Resistance Effect. Sensors 2020, 20, 1117. https://doi.org/10.3390/s20041117
Gao L, Chen F, Yao Y, Xu D. High-Precision Acceleration Measurement System Based on Tunnel Magneto-Resistance Effect. Sensors. 2020; 20(4):1117. https://doi.org/10.3390/s20041117
Chicago/Turabian StyleGao, Lu, Fang Chen, Yingfei Yao, and Dacheng Xu. 2020. "High-Precision Acceleration Measurement System Based on Tunnel Magneto-Resistance Effect" Sensors 20, no. 4: 1117. https://doi.org/10.3390/s20041117
APA StyleGao, L., Chen, F., Yao, Y., & Xu, D. (2020). High-Precision Acceleration Measurement System Based on Tunnel Magneto-Resistance Effect. Sensors, 20(4), 1117. https://doi.org/10.3390/s20041117