Recognition of Common Non-Normal Walking Actions Based on Relief-F Feature Selection and Relief-Bagging-SVM


Abstract
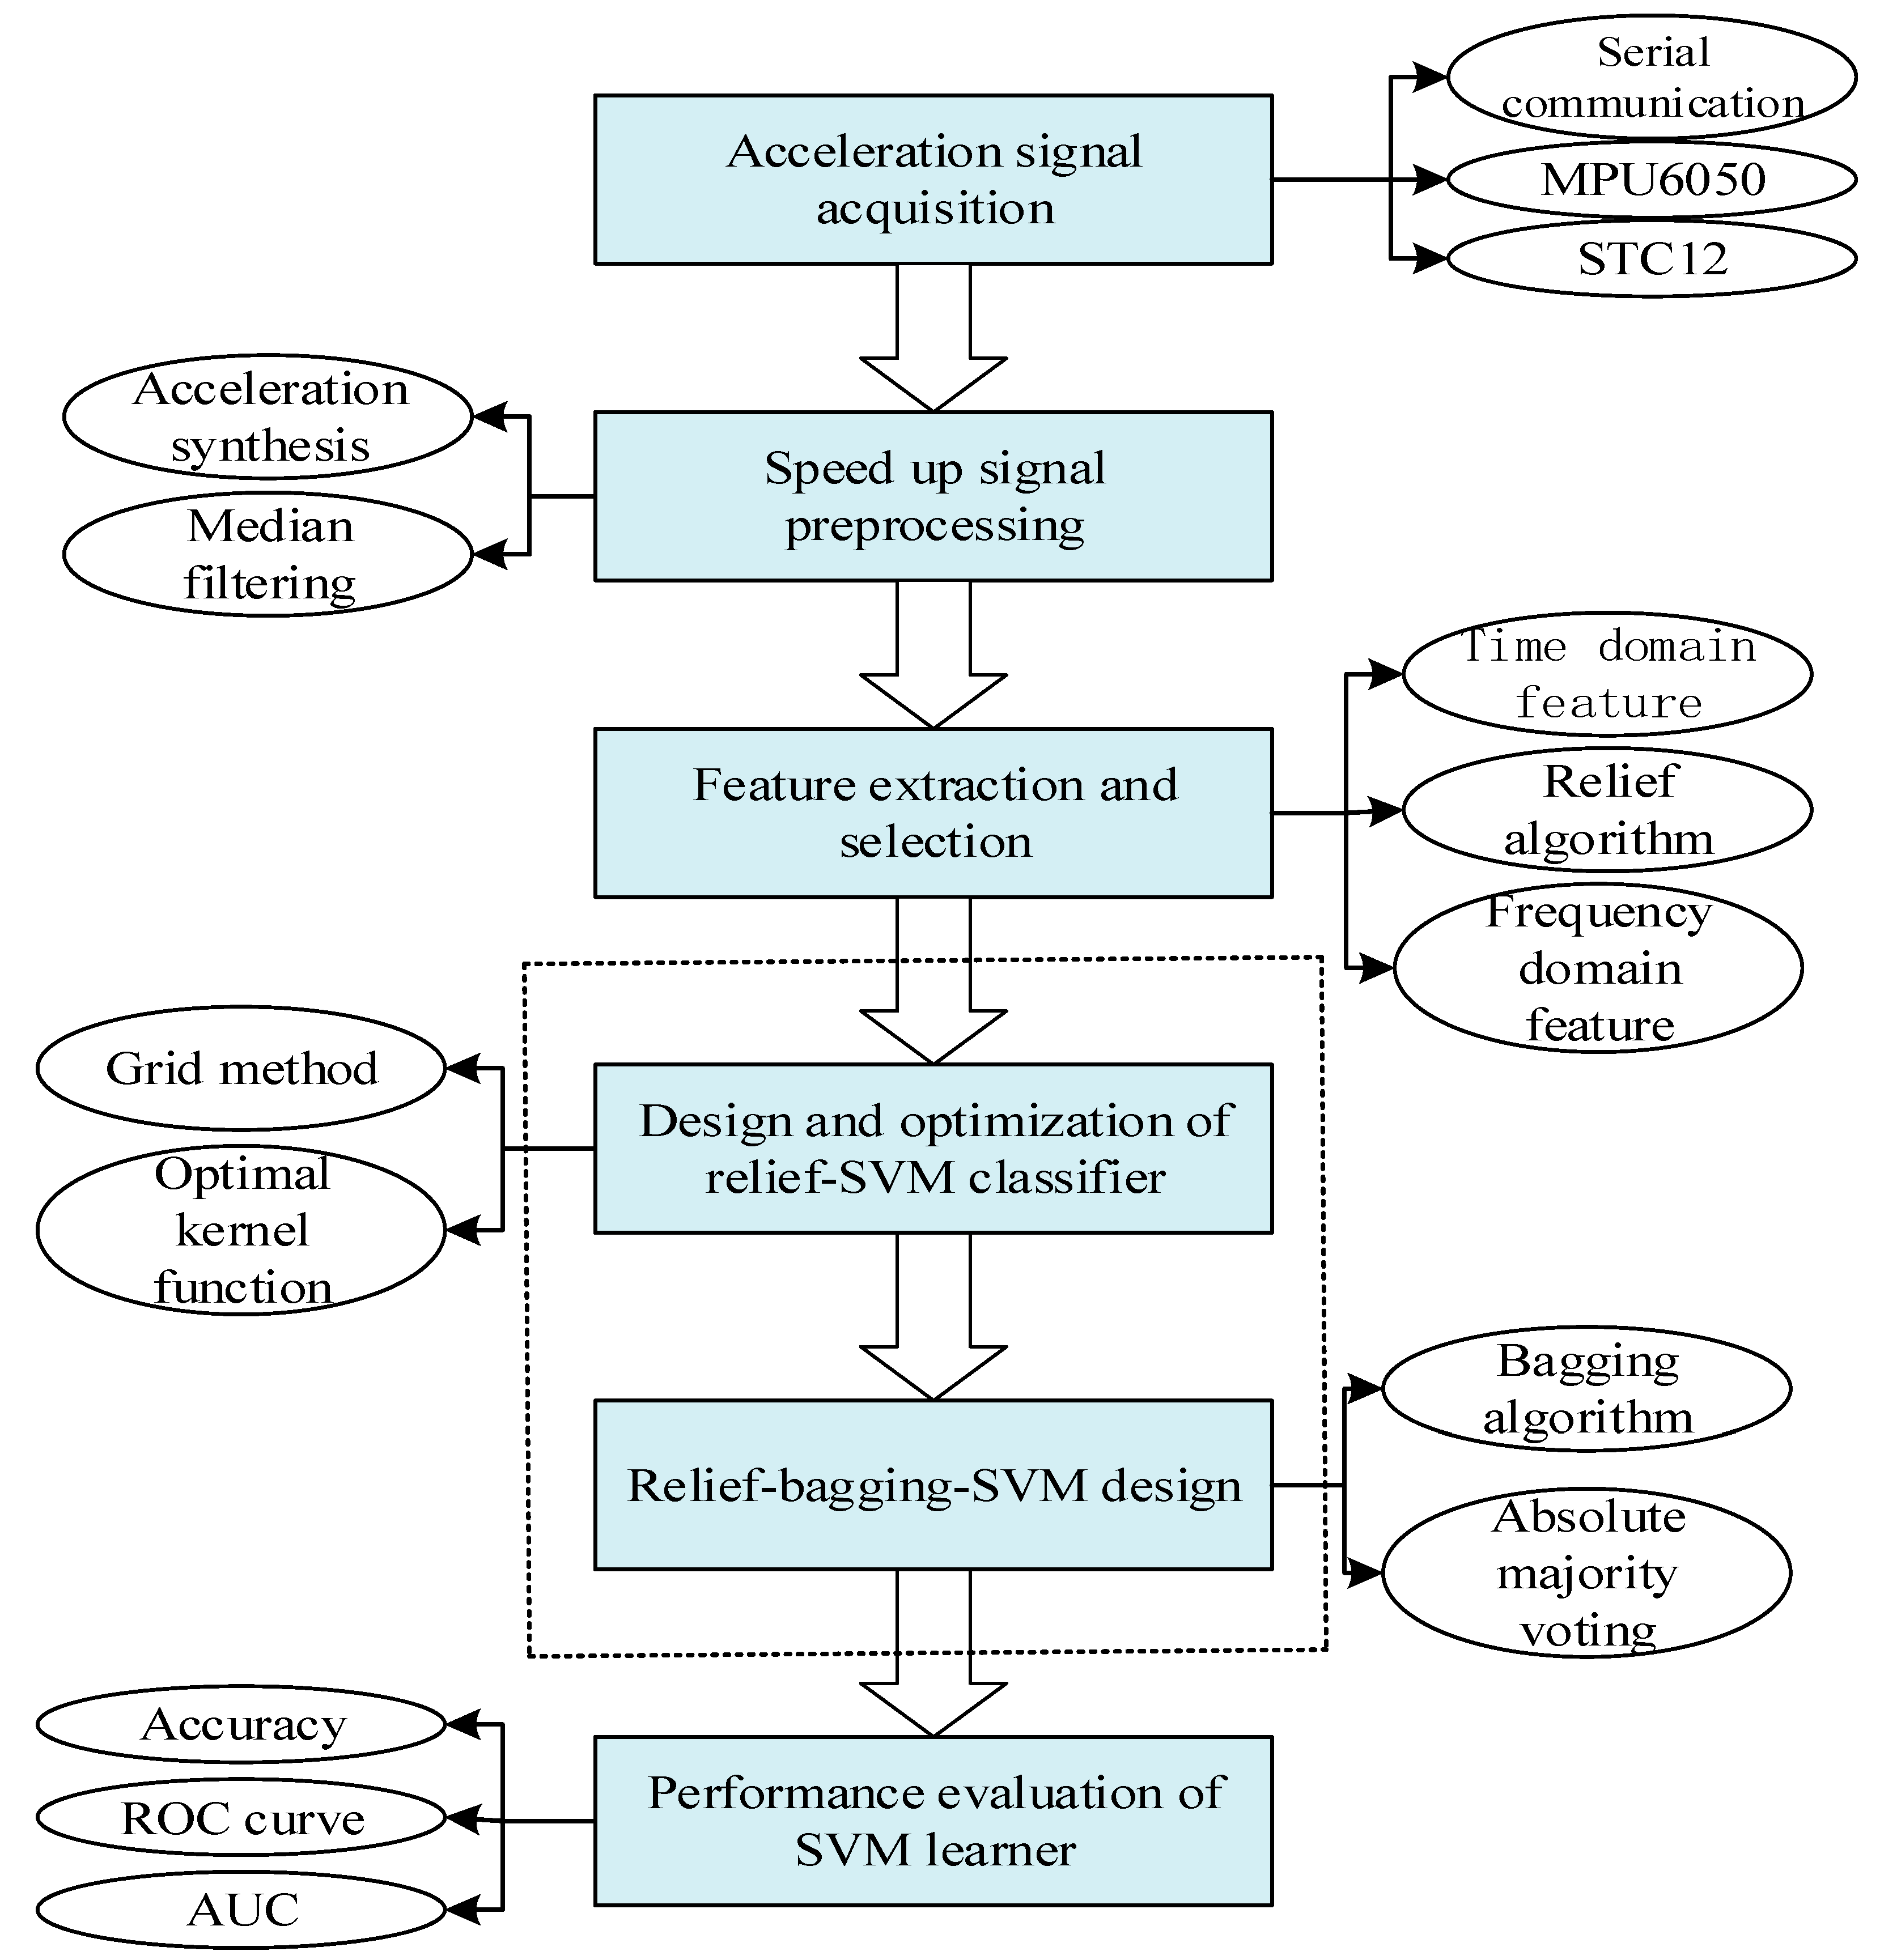
:1. Introduction
2. Data Acquisition and Preprocessing
2.1. Acceleration Acquisition Hardware Platform
2.2. Acceleration Signal Preprocessing
2.2.1. Acceleration Synthesis
2.2.2. Four-Point Median Filtering
3. Improvement of the Action Recognition Algorithm
3.1. Feature Extraction and Selection
3.2. Design and Optimization of Relief-SVM
3.3. Design of Relief-Bagging-SVM
3.4. Performance Evaluation of SVM Learners
4. Experiments and Results Analysis
4.1. Action Classification Accuracy and Time Performance
4.2. ROC Curve of the SVM Model
4.3. Leave-One-Person-Out Cross Validation
5. Conclusions
Author Contributions
Funding
Conflicts of Interest
References
- Wan, E.S.; Kantorowski, A.; Polak, M.; Kadri, R.; Richardson, C.R.; Gagnon, D.R.; Garshick, E.; Moy, M. Long-term effects of web-based pedometer-mediated intervention on COPD exacerbations. Respir. Med. 2020, 162, 105878. [Google Scholar] [CrossRef]
- Ye, H.; Li, Y.X.; Luo, H.; Wang, J.X.; Chen, W.; Zhang, Q. Hybrid Urban Canyon Pedestrian Navigation Scheme Combined PDR, GNSS and Beacon Based on Smartphone. Remote Sens. 2019, 11, 2174. [Google Scholar] [CrossRef] [Green Version]
- Wang, C.Y.; Zhang, Z.Y.; Xi, Z. A Human Body Based on Sift-Neural Network Algorithm Attitude Recognition Method. J. Med. Imaging Health Inform. 2020, 10, 129–133. [Google Scholar] [CrossRef]
- Ince, O.F.; Ince, I.F.; Yildirim, M.E.; Park, J.S.; Song, J.K.; Yoon, B.W. Human activity recognition with analysis of angles between skeletal joints using a RGB-depth sensor. Etri J. 2020, 42, 78–89. [Google Scholar] [CrossRef]
- Ravbar, P.; Branson, K.; Simpson, J.H. An automatic behavior recognition system classifies animal behaviors using actions and their temporal context. J. Neurosci. Methods 2019, 326. [Google Scholar] [CrossRef]
- Ullah, A.; Muhammad, K.; Del Ser, J.; Baik, S.W.; de Albuquerque, V.H.C. Activity Recognition Using Temporal Optical Flow Convolutional Features and Multilayer LSTM. IEEE Trans. Ind. Electron. 2019, 66, 9692–9702. [Google Scholar] [CrossRef]
- An, J.; Yang, L.; Lee, J. Three-dimensional indoor location estimation using single inertial navigation system with linear regression. Meas. Sci. Technol. 2019, 30. [Google Scholar] [CrossRef]
- Diete, A.; Stuckenschmidt, H. Fusing Object Information and Inertial Data for Activity Recognition. Sensors 2019, 19, 4119. [Google Scholar] [CrossRef] [Green Version]
- Kabir, M.H.; Thapa, K.; Yang, J.Y.; Yang, S.H. State-Space based Linear Modeling for Human Activity Recognition in Smart Space. Intell. Autom. Soft Comput. 2019, 25, 673–681. [Google Scholar] [CrossRef]
- Kelly, D.; Condell, J.; Curran, K.; Caulfield, B. A multimodal smartphone sensor system for behaviour measurement and health status inference. Inf. Fusion 2020, 53, 43–54. [Google Scholar] [CrossRef]
- Lee, J.S.; Huang, S.M. An Experimental Heuristic Approach to Multi-Pose PDR without Using Magnetometers for Indoor Localization. IEEE Sens. J. 2019, 19, 9532–9542. [Google Scholar] [CrossRef]
- Ma, C.C.; Li, W.F.; Cao, J.J.; Du, J.; Li, Q.M.; Gravina, R. Adaptive sliding window based activity recognition for assisted livings. Inf. Fusion 2020, 53, 55–65. [Google Scholar] [CrossRef]
- Tong, X.; Su, Y.; Li, Z.F.; Si, C.W.; Han, G.W.; Ning, J.; Yang, F.H. A Double-Step Unscented Kalman Filter and HMM-Based Zero-Velocity Update for PDR Using MEMS Sensors. IEEE Trans. Ind. Electron. 2020, 67, 581–591. [Google Scholar] [CrossRef]
- Huang, P.; Liu, S.; Lu, M.; Liu, Y.; Zhang, L.; Huang, Y.; Zhang, L. Design of STC12 and RFID Bracelet Campus Card System. Microcontrollers Embed. Syst. (Key Mag. China Technol.) 2019, 19, 76–80. [Google Scholar]
- Boudet, S.; de l’Aulnoit, A.H.; Demailly, R.; Peyrodie, L.; Beuscart, R.; de l’Aulnoit, D.H. Fetal heart rate baseline computation with a weighted median filter. Comput. Biol. Med. 2019, 114. [Google Scholar] [CrossRef]
- Huang, L.S.; Ding, W.J.; Liu, W.J.; Zhao, J.L.; Huang, W.J.; Xu, C.; Liang, D. Identification of wheat powdery mildew using in-situ hyperspectral data and linear regression and support vector machines. J. Plant. Pathol. 2019, 101, 1035–1045. [Google Scholar] [CrossRef]
- Li, D.Y.; Wen, G.H.; Hou, Z.; Huan, E.Y.; Hu, Y.; Li, H.H. RTCRelief-F: An effective clustering and ordering-based ensemble pruning algorithm for facial expression recognition. Knowl. Inf. Syst. 2019, 59, 219–250. [Google Scholar] [CrossRef]
- Kaur, P.; Pannu, H.S.; Malhi, A.K. Plant disease recognition using fractional-order Zernike moments and SVM classifier. Neural Comput. Appl. 2019, 31, 8749–8768. [Google Scholar] [CrossRef]
- Liu, Y.; Zhang, F.F.; Wang, C.K.; Wu, S.W.; Liu, J.; Xu, A.A.; Pan, X.Z. Estimating the soil salinity over partially vegetated surfaces from multispectral remote sensing image using non-negative matrix factorization. Geoderma 2019, 354. [Google Scholar] [CrossRef]
- Xiao, R.; Hu, Q.F.; Li, J. Leak detection of gas pipelines using acoustic signals based on wavelet transform and Support Vector Machine. Measurement 2019, 146, 479–489. [Google Scholar] [CrossRef]
- Vieira, P.M.; Freitas, N.R.; Valente, J.; Vaz, I.F.; Rolanda, C.; Lima, C.S. Automatic detection of small bowel tumors in wireless capsule endoscopy images using ensemble learning. Med. Phys. 2019, 13. [Google Scholar] [CrossRef] [PubMed]
- Lu, H.J.; Zou, N.; Jacobs, R.; Afflerbach, B.; Lu, X.G.; Morgans, D. Error assessment and optimal cross-validation approaches in machine learning applied to impurity diffusion. Comput. Mater. Sci. 2019, 169. [Google Scholar] [CrossRef]
- Xiong, Z.; Cui, Y.X.; Liu, Z.H.; Zhao, Y.; Hu, M.; Hu, J.J. Evaluating explorative prediction power of machine learning algorithms for materials discovery using k-fold forward cross-validation. Comput. Mater. Sci. 2020, 171. [Google Scholar] [CrossRef]
- Zhang, Y.X.; Zhang, X.; Chen, J.Z.; Yang, J.H. Electro-Mechanical Impedance Based Position Identification of Bolt Loosening Using LibSVM. Intell. Autom. Soft Comput. 2018, 24, 81–87. [Google Scholar] [CrossRef]


| Hardware | Parameter | Value | Parameter | Value |
|---|---|---|---|---|
| MPU6050 | Sampling frequency | 125 Hz | acceleration sensitivity/LSB/g | 16,384 |
| Sampling range | −4 g~4 g | - | - | |
| STC12 MCU | x-axis acceleration register | 0 × 3B, 0 × 3C | y-axis acceleration registers | 0 × 3D, 0 × 3E |
| z-axis acceleration registers | 0 × 3F, 0 × 40 | - | - | |
| BLE | Communication cycle | 10 ms | Baud rate/bps | 11,520 |
| Way of communication | Asynchronous serial | - | - |
| Category | Feature Name | Dimension | Feature Name | Dimension |
|---|---|---|---|---|
| mean | 1 | absolute slope | 9 | |
| standard deviation | 1 | maximum | 1 | |
| Time Domain | skewness | 1 | root mean square | 1 |
| correlation coefficient | 1 | maximal value | 1 | |
| variance | 1 | minimum | 1 | |
| average slope | 1 | kurtosis | 1 | |
| FFT | spectrum energy | 1 | average power | 1 |
| median frequency | 1 | - | - |
| Number | Feature Name | Number | Feature Name | Number | Feature Name |
|---|---|---|---|---|---|
| 1 | mean | 8 | average slope | 23 | median frequency |
| 4 | root mean square | 19 | maximum | - | - |
| 7 | maximal value | 21 | skewness | - | - |
| Category | LASSO-SVM | Relief-F-SVM |
|---|---|---|
| Walking (%) | 80.00 | 100.0 |
| Running (%) | 93.33 | 100.0 |
| Standing (%) | 13.33 | 100.0 |
| Writing (%) | 86.66 | 93.33 |
| Man-made (%) | 13.33 | 40.00 |
| Sleep (%) | 93.33 | 100.0 |
| Downstairs (%) | 40.00 | 100.0 |
| Upstairs (%) | 66.66 | 100.0 |
| Average accuracy (%) | 60.83 | 91.66 |
| Category | Linear | Polynomial | Gauss | Sigmoid |
|---|---|---|---|---|
| Walking (%) | 100.0 | 100.0 | 93.33 | 0 |
| Running (%) | 100.0 | 100.0 | 100.0 | 0 |
| Standing (%) | 93.33 | 100.0 | 93.33 | 0 |
| Writing (%) | 93.33 | 93.33 | 93.33 | 100.0 |
| Man-made (%) | 33.33 | 40.00 | 26.66 | 0 |
| Sleep (%) | 86.67 | 100.0 | 86.66 | 0 |
| Downstairs (%) | 93.33 | 100.0 | 93.33 | 0 |
| Upstairs (%) | 53.33 | 100.0 | 100.0 | 12.50 |
| Average accuracy (%) | 81.66 | 91.66 | 85.83 | 12.50 |
| Category | KNN | RF | DT | SVM | Relief-SVM | Relief-Bagging-SVM |
|---|---|---|---|---|---|---|
| Walking (%) | 100.0 | 93.75 | 100.0 | 80.00 | 100.0 | 100.0 |
| Running (%) | 100.0 | 100.0 | 100.0 | 93.33 | 100.0 | 100.0 |
| Standing (%) | 73.33 | 91.67 | 100.0 | 13.33 | 100.0 | 94.87 |
| Writing (%) | 86.66 | 38.46 | 100.0 | 86.67 | 93.33 | 94.12 |
| Man-made (%) | 40.00 | 100.0 | 40.00 | 13.33 | 40.00 | 100.0 |
| Sleep (%) | 80.00 | 85.71 | 100.0 | 93.33 | 100.0 | 97.56 |
| Downstairs (%) | 100.0 | 100.0 | 100.0 | 40.00 | 100.0 | 86.84 |
| Upstairs (%) | 100.0 | 94.74 | 100.0 | 66.67 | 100.0 | 81.58 |
| Normal Actions (%) | 100.0 | 97.12 | 100.0 | 70.00 | 100.0 | 92.10 |
| Non-normal Actions (%) | 69.99 | 78.96 | 85.00 | 51.66 | 83.33 | 96.63 |
| Average accuracy (%) | 85.00 | 88.04 | 92.50 | 60.83 | 91.66 | 94.37 |
| Time/Dimension | KNN | RF | DT | SVM | Relief-SVM | Relief-Bagging-SVM |
|---|---|---|---|---|---|---|
| Feature dimension | 23 | 23 | 23 | 23 | 7 | 7 |
| Search time(s) | 1.36 | 0.58 | 0.81 | 18.68 | 9.13 | 9.13 |
| People | 1 | 2 | 3 | 4 | 5 | 6 | 7 | 8 |
|---|---|---|---|---|---|---|---|---|
| Sex | Man | Woman | Woman | Man | Woman | Man | Woman | Man |
| Weight/kg | 63 | 51 | 45 | 85 | 56 | 80 | 55 | 70 |
| Height/cm | 170 | 165 | 157 | 183 | 161 | 191 | 155 | 178 |
| Age | 26 | 21 | 19 | 45 | 42 | 39 | 23 | 22 |
| Classifier | Parameter | Value | Parameter | Value |
|---|---|---|---|---|
| DT | Maximum number of splits | 100 | Surrogate decision splits | off |
| Split criterion | Cini’s diversity index | Maximum surrogates per node | 10 | |
| SVM | Kernel function | Polynomial | Kernel scale mode | Manual |
| Multiclass method | One-vs-One | Standardize data | on | |
| RF | Pruning strategy | Post-pruning | Tree numbers | 5 |
| Split criterion | Cini’s diversity index | Max features | 23 | |
| KNN | Number of neighbors | 1 | Distance weight | Equal |
| Distance metric | Euclidean | Standardize data | on |
| Category | RF | KNN | DT | SVM | Relief-SVM | Relief-Bagging-SVM |
|---|---|---|---|---|---|---|
| Walking | - | - | - | 0.9321 | 1 | 1 |
| Running | - | - | - | 0.9822 | 0.9975 | 1 |
| Standing | - | - | - | 0.1562 | 1 | 1 |
| Writing | - | - | - | 0.9283 | 0.9994 | 0.9953 |
| Man-made | - | - | - | 0.3321 | 0.3162 | 1 |
| Sleep | - | - | - | 0.9949 | 0.9994 | 0.9981 |
| Downstairs | - | - | - | 0.8317 | 1 | 0.8567 |
| Upstairs | - | - | - | 0.7441 | 1 | 0.7231 |
| Average AUC | 0.9066 | 0.8323 | 0.9231 | 0.7377 | 0.9141 | 0.9466 |
| Category | 1 | 2 | 3 | 4 | 5 | 6 | 7 | 8 |
|---|---|---|---|---|---|---|---|---|
| Walking (%) | 100.0 | 98.32 | 97.63 | 100.0 | 98.66 | 100.0 | 97.22 | 100.0 |
| Running (%) | 100.0 | 100.0 | 100.0 | 100.0 | 100.0 | 100.0 | 100.0 | 100.0 |
| Standing (%) | 95.87 | 93.61 | 95.11 | 94.33 | 97.65 | 94.18 | 97.58 | 96.33 |
| Writing (%) | 93.12 | 93.21 | 94.64 | 93.21 | 92.47 | 95.66 | 97.55 | 98.11 |
| Man-made (%) | 100.0 | 96.21 | 93.22 | 94.31 | 92.10 | 95.33 | 93.11 | 94.56 |
| Sleep (%) | 95.56 | 96.55 | 96.12 | 94.33 | 96.58 | 93.22 | 95.12 | 94.23 |
| Downstairs (%) | 90.84 | 88.63 | 84.25 | 92.31 | 97.46 | 95.21 | 86.33 | 89.94 |
| Upstairs (%) | 80.58 | 84.16 | 82.15 | 86.21 | 87.68 | 80.14 | 83.22 | 88.21 |
| Average accuracy (%) | 94.49 | 93.83 | 92.89 | 94.33 | 95.32 | 94.21 | 93.76 | 95.17 |
© 2020 by the authors. Licensee MDPI, Basel, Switzerland. This article is an open access article distributed under the terms and conditions of the Creative Commons Attribution (CC BY) license (http://creativecommons.org/licenses/by/4.0/).
Share and Cite
Huang, P.; Li, Y.; Lv, X.; Chen, W.; Liu, S. Recognition of Common Non-Normal Walking Actions Based on Relief-F Feature Selection and Relief-Bagging-SVM. Sensors 2020, 20, 1447. https://doi.org/10.3390/s20051447
Huang P, Li Y, Lv X, Chen W, Liu S. Recognition of Common Non-Normal Walking Actions Based on Relief-F Feature Selection and Relief-Bagging-SVM. Sensors. 2020; 20(5):1447. https://doi.org/10.3390/s20051447
Chicago/Turabian StyleHuang, Pan, Yanping Li, Xiaoyi Lv, Wen Chen, and Shuxian Liu. 2020. "Recognition of Common Non-Normal Walking Actions Based on Relief-F Feature Selection and Relief-Bagging-SVM" Sensors 20, no. 5: 1447. https://doi.org/10.3390/s20051447