Article

Facile Fabrication of an Ammonia-Gas Sensor Using Electrochemically Synthesised Polyaniline on Commercial Screen-Printed Three-Electrode Systems

by
Anja Korent
1,2,*,
Kristina Žagar Soderžnik
1,
Sašo Šturm
1,2,
Kristina Žužek Rožman
1,2,
Nathalie Redon
3,
Jean-Luc Wojkiewicz
3 and
Caroline Duc
3
1
Department for Nanostructured Materials, Jožef Stefan Institute, Jamova cesta 39, SI-1000 Ljubljana, Slovenia
2
Jožef Stefan International Postgraduate School, Jožef Stefan Institute, Jamova cesta 39, SI-1000 Ljubljana, Slovenia
3
IMT Lille Douai, Institut Mines-Télécom, University of Lille, Centre for Environment and Energy, F-59000 Lille, France
*
Author to whom correspondence should be addressed.
Sensors 2021, 21(1), 169; https://doi.org/10.3390/s21010169
Submission received: 26 November 2020 / Revised: 21 December 2020 / Accepted: 25 December 2020 / Published: 29 December 2020
(This article belongs to the Section Chemical Sensors)

Abstract

:
Polyaniline (PANI) is a conducting polymer, widely used in gas-sensing applications. Due to its classification as a semiconductor, PANI is also used to detect reducing ammonia gas (NH3), which is a well-known and studied topic. However, easier, cheaper and more straightforward procedures for sensor fabrication are still the subject of much research. In the presented work, we describe a novel, more controllable, synthesis approach to creating NH3 PANI-based receptor elements. The PANI was electrochemically deposited via cyclic voltammetry (CV) on screen-printed electrodes (SPEs). The morphology, composition and surface of the deposited PANI layer on the Au electrode were characterised with electron microscopy, Fourier-transform infrared spectroscopy and profilometry. Prior to the gas-chamber measurement, the SPE was suitably modified by Au sputtering the individual connections between the three-electrode system, thus showing a feasible way of converting a conventional three-electrode electrochemical SPE system into a two-electrode NH3-gas detecting system. The feasibility of the gas measurements’ characterisation was improved using the gas analyser. The gas-sensing ability of the PANI-Au-SPE was studied in the range 32–1100 ppb of NH3, and the sensor performed well in terms of repeatability, reproducibility and sensitivity.

1. Introduction

Conductive polymers have great potential as gas-sensing materials because of their light weight, low cost, and straightforward production, which are associated with the electronic, magnetic and optical properties of metals [1]. The π-conjugation along the chains of those materials allows the formation of a delocalised electron at the origin of the electrical conduction, which can be modulated by a redox reaction or protonation from a near-insulator to a metallic conductor [2,3]. Integrated into chemiresistive sensors for the detection of oxidising or reducing gases [4,5,6] (NH3 [6,7,8,9,10], hydrogen [11], carbon monoxide [10], nitrogen oxides (NOx) [7,12], and hydrogen sulphide [12]), they enable room-temperature (RT) measurements, i.e., much lower than the operating temperatures of metal oxides that are conventionally used in gas sensing and operate at temperatures ~300–400 °C [5]. Moreover, in comparison with metal oxides, they show good metrological characteristics, such as a high sensitivity and a short response time, combined with the ability to be easily tuned, both chemically and physically [13].
Detecting ammonia (NH3) at low concentrations is crucial in many environmental and biomedical situations. Firstly, NH3 is essential to various industries, e.g., chemical, medical, food, and automotive. Still, it can also be problematic concerning the environment and human health, i.e., it is highly reactive and can trigger skin, eye, and lung illnesses [6,14]. According to the Occupational Safety and Health Administration (OSHA) [15], the exposure limit for humans is 50 ppm for 8 h and 35 ppm for 15 min. Humans are incapable of sensing the presence of NH3 at concentrations below 5 ppm [16,17], and NH3 is highly reactive. It can form harmful, nanosized aerosols (particulate atmospheric matter such as ammonium nitrate and ammonium sulphate) [14]. Thus, it is essential to develop detection techniques that are quick to react, convenient and reliable for detecting NH3 in low concentrations. Secondly, NH3 has been reported to be a relevant marker for liver and kidney diseases [18]. In the case of these organs’ failure, the NH3 concentration from exhaled breath increases from a few hundred ppb to several ppm [19]. The detection of NH3 over such a broad concentration range in human breath shows promise as a non-invasive and low-cost technique for diagnosing and/or monitoring such diseases [20,21]. The ability to sense NH3 in a low-ppb range can be transferred to the indirect detection of other toxic gases, where NH3 is a by-product of a certain chemical reaction triggered by an applied organic compound or catalyst. For example, formaldehyde gas was detected by using polyaniline (PANI) as a sensing material for NH3 produced as a by-product of an organic reaction between formaldehyde and Fluoral-P [22,23].
Different working principles can be used to detect ammonia, such as electronics, electrochemistry, optical, surface acoustic wave and field-effect transistor. Optical methods such as tuneable-diode-laser adsorption spectroscopy have the highest sensitivity (150 ppt) and selectivity. However, their operating conditions do not match all the application requirements. For this reason, chemiresistive sensors are the most popular. Presenting sensitivities in the range 20 to 100 ppb, they have more cost-effective and simpler fabrication and integration [14,24].
Among the sensitive materials in chemiresistive sensors, PANI is one of the most studied conductive polymers for NH3 sensing [4]. It is based on the ability of the gas to change the resistance of the material via the well-known deprotonation/protonation mechanism [25,26]. It is, in addition, light weight, inexpensive, and environmentally stable with a straightforward polymerisation reaction that has high yields and reversible redox and pH-switching properties. Its conductivity can be adjusted by changing its oxidation and protonation state, which makes PANI unique in the family of conductive polymers. PANI can be found in various oxidative states, with three being the most known: the fully reduced state (leucoemeraldine), the half-oxidised state (emeraldine) and the fully oxidised state (pernigraniline). Emeraldine is the most conductive form of PANI [27]. Emeraldine has high stability at room temperature and is classified as a semiconductor, which makes it suitable for gas sensing [28]. However, like the other conductive polymers, PANI’s main limitations are a sensitivity to humidity and problems with long-term stability [14].
In order to enhance PANI;s conductivity, its switching abilities, and its morphological and structural properties that consequently influence the response to NH3 [5,6], many different formulations have been developed. They range from using pure PANI with simple dopants such as HClO4 [29] or polymers (polyurethane [30], poly(methyl methacrylate) [31]), in addition to more complex dopants (dodecylbenzenesulfonic acid (DBSA), camphorsulfonic acid (CSA)) [8] or nanomaterials such as carbon nanotubes [21,32,33] and metal particles [5,33] or metal oxides [9,34,35]).
Moreover, various configurations have been used to monitor the changes in the PANI’s resistance [8,9,21,30,36,37,38] or impedance [39] in the presence of NH3 gas. They consist of (i) two-point resistivity measurements that are usually made using either PANI deposited on interdigitated electrodes with multiple “fingertips” [8,9,21,30,36] (Figure 1a), (ii) a PANI film on glass substrates [40] (Figure 1b), (iii) a PANI pellet connected by wires [38] (Figure 1c), (iv) a PANI film deposited on two electrodes made of different metals [39] (Figure 1d) or (v) PANI in a screen-printed two-electrode system [37] (Figure 1e). The deposition of PANI on such electrodes is usually completed with drop-casting [9,21,30,37,39], spin-coating [8,41] and layer-by-layer assembly [41]. In all these cases, PANI is synthesised via a chemical polymerisation method.
Knowing the impact of the PANI’s morphology and the PANI’s film thickness on gas-sensing performance [41,42], the processes of its synthesis and its deposition are thus crucial. In this respect, PANI’s electrochemical polymerisation allows easier control over the PANI’s film thickness and the morphology of the final product by controlling the parameters of the electrochemical deposition, such as deposition time, applied current or applied voltage. Indeed, the result of such a synthesis is a nanostructured polymer in conductive, doped form due to the polymerisation in an acid electrolyte [27,43]. Such a synthesised polymer is well integrated and compacted with the surface of the working electrode [44] that can be used for gas sensing.
As per the electrochemical synthesis principle, the required three-electrode system (the working, counter and reference electrodes) [27,43] allows the deposition of material only on the surface of the working electrode, which represents a significant drawback and challenge for resistance-based gas measurements. Paul et al. [45] electrodeposited PANI on an eight-electrode array with a 1.7 μm gap between the Au electrodes. Indeed, in the case of a sufficiently small gap (1–10 μm) and long polymerisation times, PANI can assemble over the gap [36,45,46,47], making it possible to construct two solid-state electrodes, in between which a conducting material is sandwiched. However, such an approach is difficult and expensive in terms of the demand of a particular small electrochemical cell, which needs to enable the contact of the electrolyte with a two-electrode system and a removable reference electrode. In the case of a three-electrode SPE, only a drop of electrolyte is needed, and when a conductive material is electrochemically deposited on the working electrode, for further functionalisation, only suitable contacts on the top of the deposited material still need to be made. These contacts must not be in contact with the working electrode, but must connect the deposited material with the secondary electrode [48]. The deposited material and the type of synthesis represent a bottleneck for these approaches.
By combining a knowledge of resistivity-based gas sensing and electrochemistry, we focused our work on developing a NH3-detection system based on electrochemically synthesised “pure” PANI without the use of any complex dopants [29,30,31] and nanomaterials [5,21,32,33,49,50]. PANI was chosen because of its superior sensing performance with regard to ammonia [6,51]. We report on a direct electrodeposition procedure for PANI on a commercial, screen-printed electrode (SPE) that results in the PANI′s excellent uniformity, and high reproducibility, with the potential for mass production and in-situ analyses [52]. Moreover, this procedure is suitable for automation processes, and has an increased reliability and repeatability. The proposed procedure enables the feasible production of low-cost sensor devices without the extensive use of chemicals/materials. A sensor prepared in this way was characterised in different humidity conditions and NH3 concentrations. In addition, by including a real-time analyser for NH3 gas, two different approaches for sensor-sensitivity characterisation were used. As a result, by using this inexpensive and practical fabrication procedure we were able to construct a robust, ppb-range NH3 sensor. Indeed, at room temperature and under 70% of humidity, the sensor in this study shows a limit of detection of 23 ppb and sensitivities of 12.30 and 4.27%.ppm−1 in the ranges 32–200 ppb and 200–1000 ppb, respectively.

2. Materials and Methods

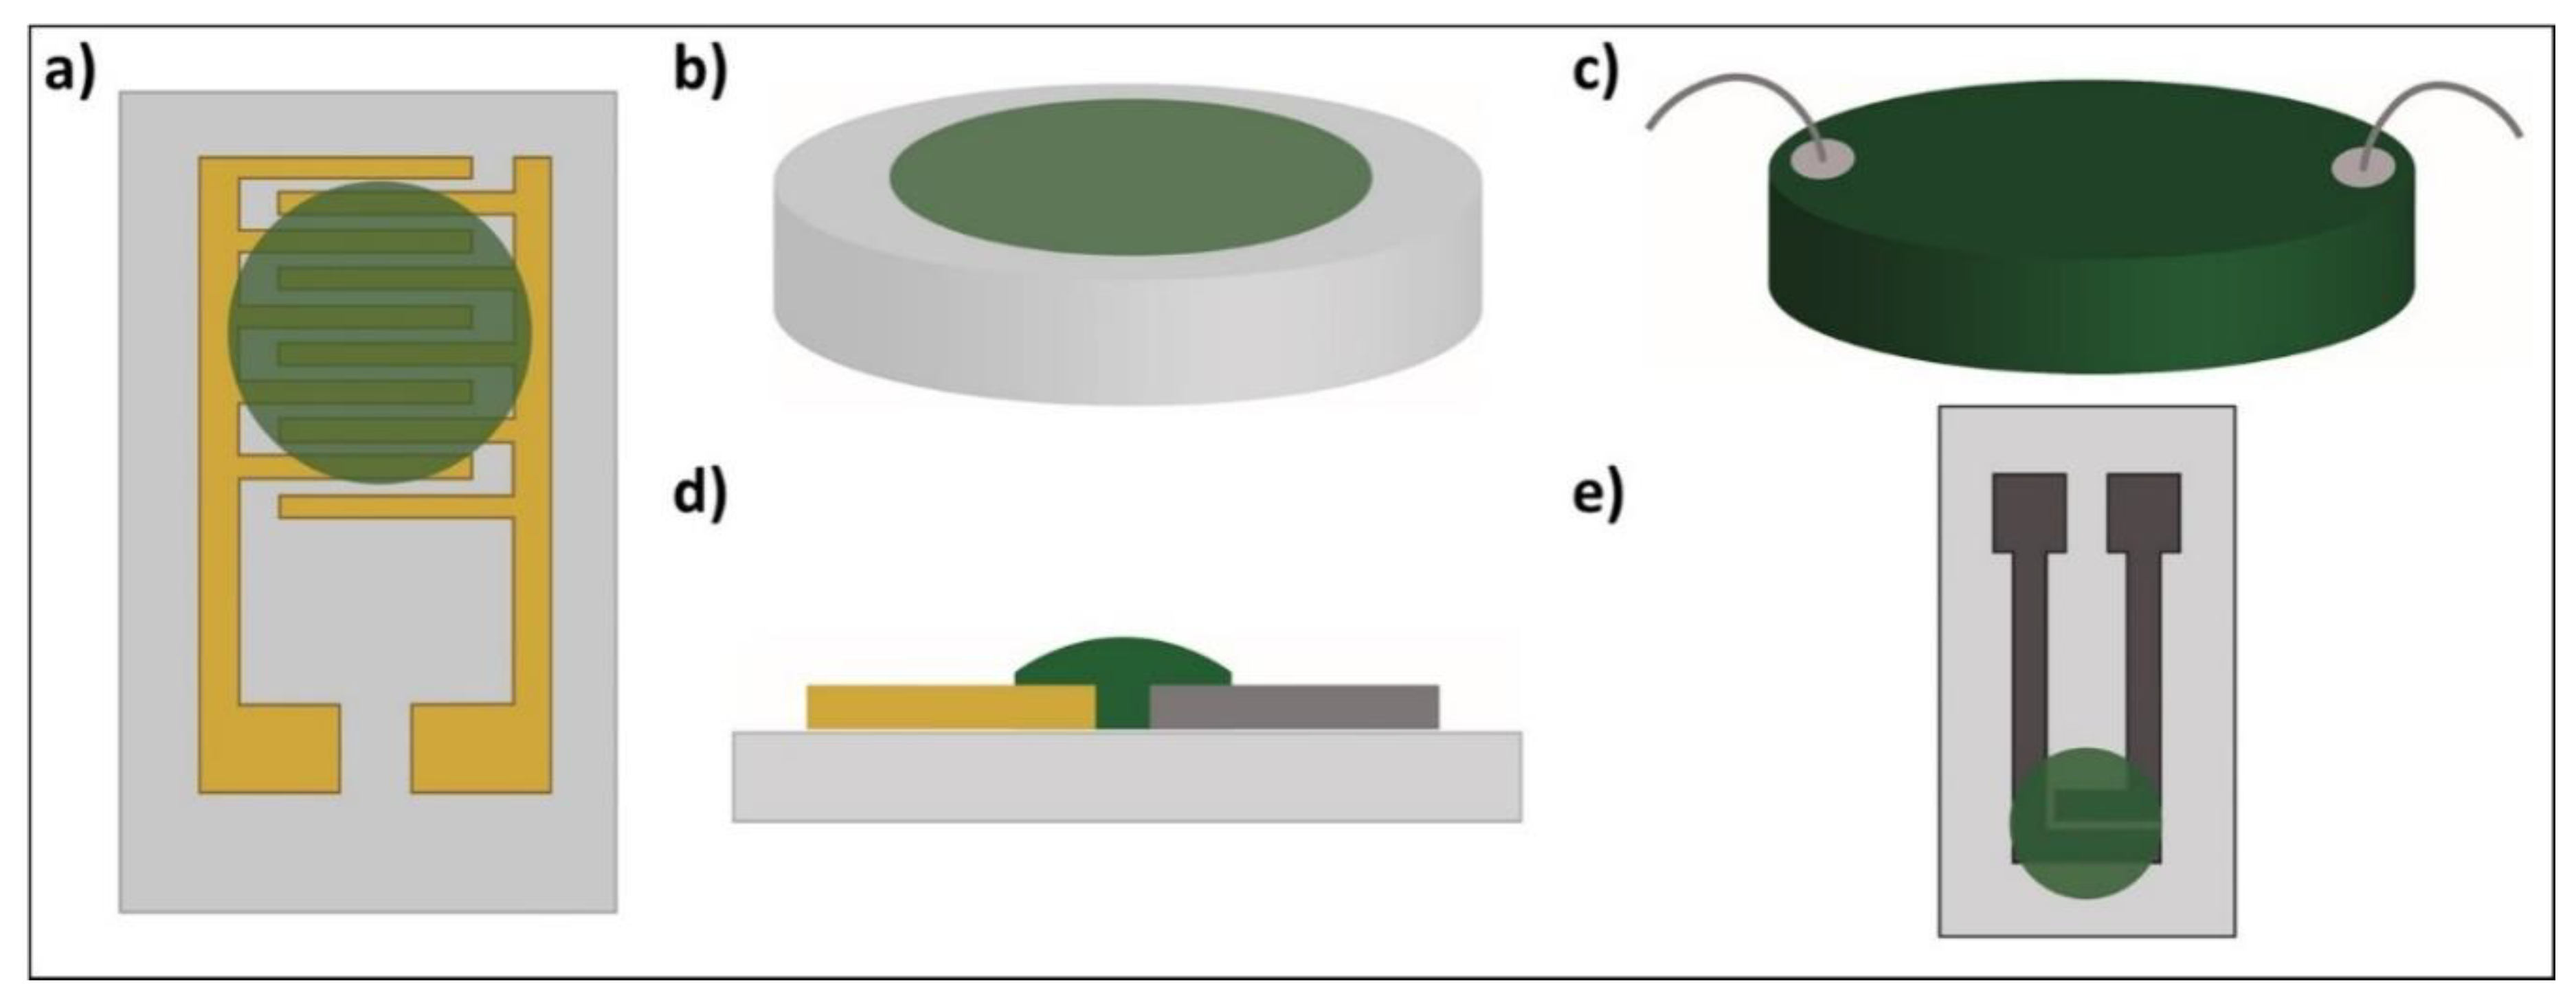
2.1. Polyaniline Synthesis

PANI can be electrodeposited on a metal electrode using three different electrochemical techniques (potentiodynamic, potentiostatic, and galvanostatic). The potentiodynamic method (cyclic voltammetry, CV), exposes the growing polymer to additional processes, i.e., oxidation/reduction reactions, which adds another dimension to the electropolymer’s growth [27]. By changing the CV conditions (scan rate, number of cycles) the polymer’s properties can be tailored. By applying a slower scan rate (25, 50 mV/s) the peak potential of the first redox couple shifts towards lower potentials and the resulting polymer has a higher growth rate in comparison to the polymer grown with high scan rates (100 mV/s). It was shown that by using 50 mV/s the lowest average diameter of PANI nanofibers is achieved [53]. Controlling the charge consumed for electropolymerisation enables an estimation of the amount of deposited PANI. Only the first oxidation peak of the PANIs’ CV behaviour contains information of just the PANI reaction. In all the other peaks, pure bare-electrode material oxidation or reduction is included [53,54,55]. Therefore, by controlling the equality of the anodic current of the first oxidation, the reproducibility between polymerisations can be achieved. Based on this, the experimental conditions for the PANI’s polymerisation were chosen.
The PANI was electrodeposited on a commercial DropSens screen-printed electrode (SPE; MetrohmDropSens, ref. SPE-250AT) [56], with gold as the working electrode, platinum as the counter electrode and silver as the reference electrode. The electropolymerisation was carried out in an acidic medium (1 M HCl prepared from 37% HCl Sigma Aldrich, pH = 0.43) containing a 0.1 M aniline monomer (Sigma Aldrich). The electrochemical experiments were performed on a USB- and battery-powered potentiostat/galvanostat/EIS analyzer PalmSens4. CV, as the deposition method, was performed at a potential of −0.3 V to 1 V using a scan rate of 50 mV/s. The CV was stopped after completing the cycle in which the first oxidation peak reached an anodic current of 1.5 mA to achieve reproducibility for the deposited material. Due to the deviations in weighing the aniline monomer for the polymerisation solution, the anodic current of 1.5 mA of the first anodic peak was achieved in a different number of cycles (from 23 to 25 cycles). Therefore, the experiment was manually stopped at –0.3 V vs. Ag with a 0.1 V uncertainty. After the deposition, the electrode was cleaned with methanol (Sigma Aldrich) to remove the residual monomer/electrolyte suspension and the unattached polymeric parts.

2.2. Material Characterisation

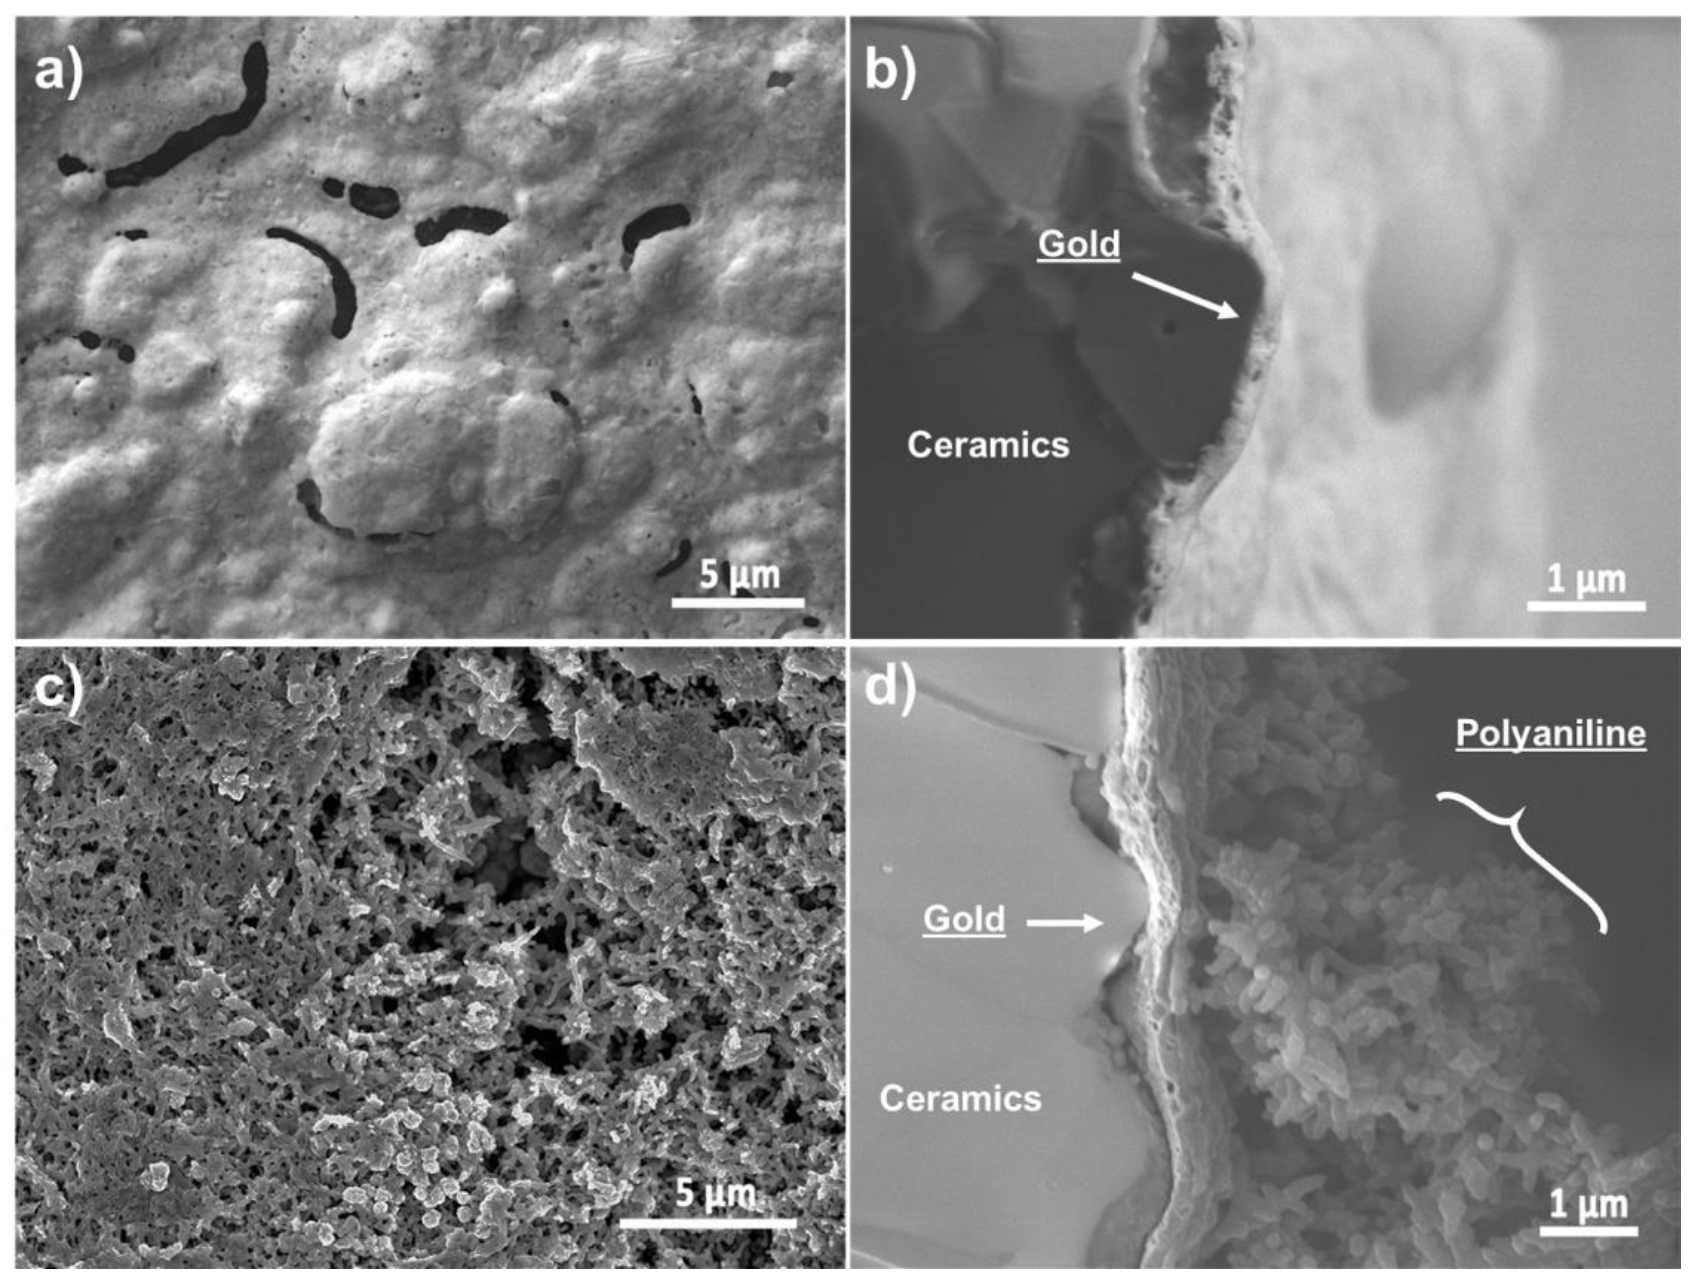
2.2.1. Scanning Electron Microscopy (SEM)

Field-emission scanning electron microscopy (FE-SEM) was used to characterise the morphology of the pure-gold SPE (Au-SPE) and the electrodeposited PANI (PANI-Au-SPE). The specimens for the FE-SEM observations (Jeol JSM-7600F) were prepared by placing the samples on a conductive tape. Cross-section samples were cut perpendicular to the electrode. The Au-SPE surface was observed at an acceleration voltage of 20 kV and the PANI-Au-SPE samples at 5 kV.

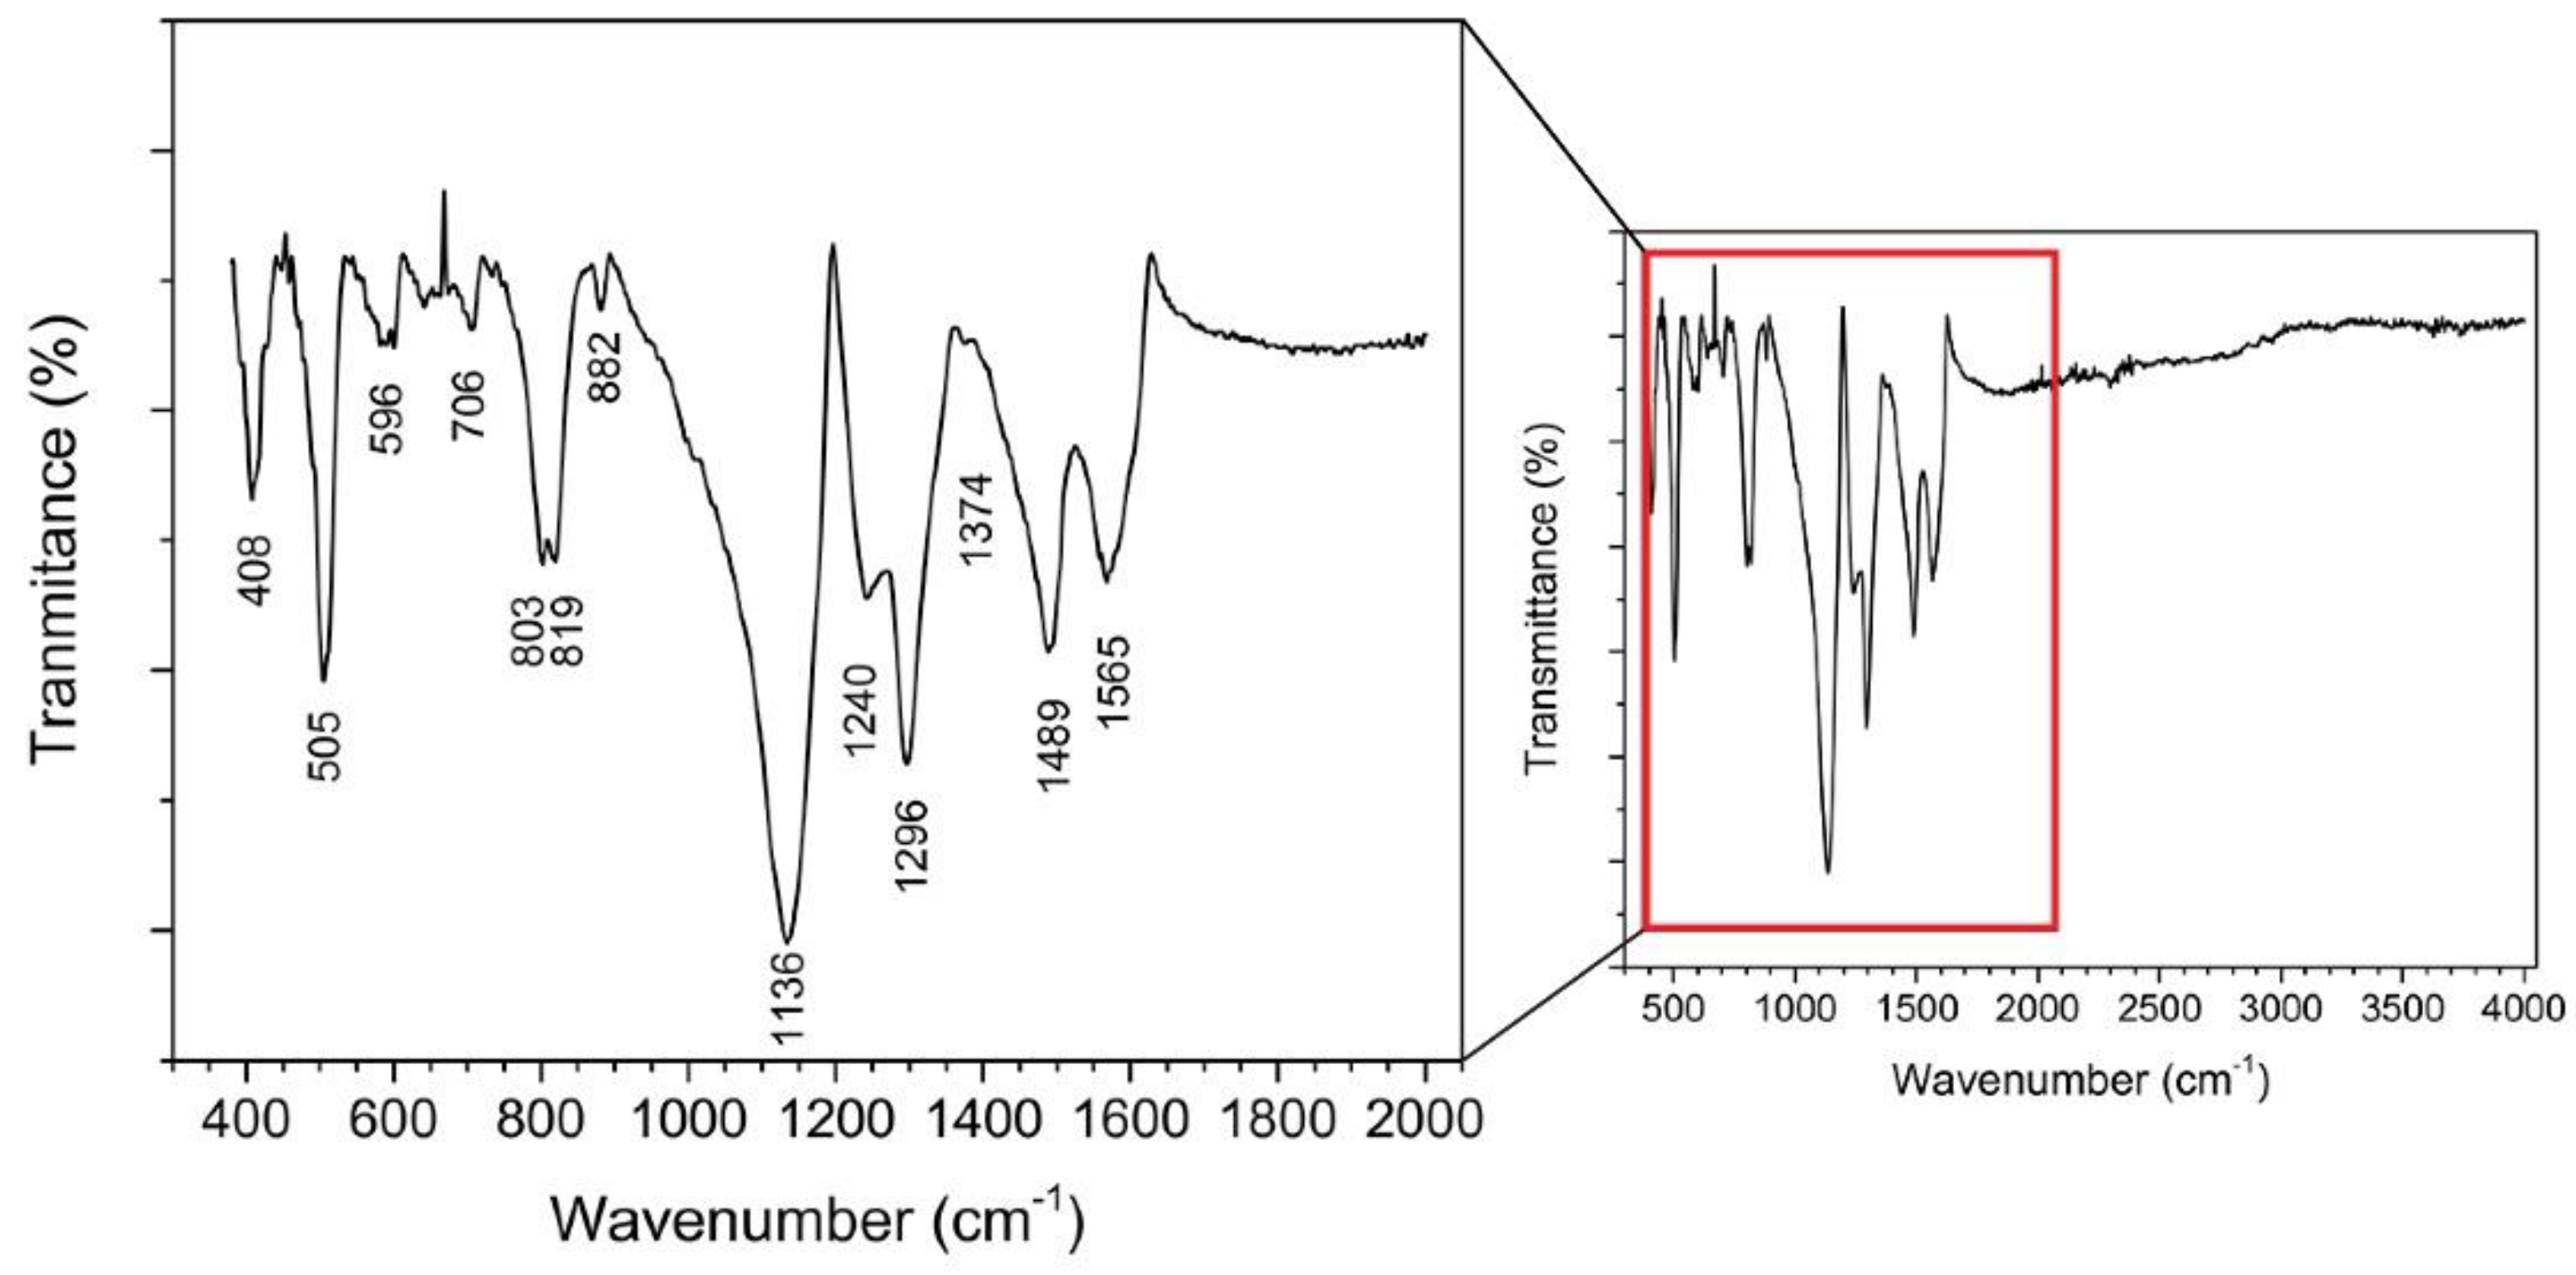
2.2.2. Fourier-Transform Infrared (FTIR) Spectroscopy

Fourier-transform infrared (FTIR) spectra of the prepared PANI-Au-SPE were measured using an ATR (attenuated total reflection) crystal with an ATR FTIR Frontier L1280018 spectrometer (Perkin Elmer, Waltham, MA, USA). A spectrum was obtained by sampling 20 interferograms with a resolution of 4 cm−1 in the range 500–4000 cm−1.

2.2.3. Profilometer

Three-dimensional (3D) mapping of the surface roughness of the Au-SPE and PANI-Au-SPE was carried out with a Stylus profilometer DEKTAK (Bruker) having a resolution 0.3 nm in the x, 1 µm in the y, and 0.1 nm in the z directions.

2.3. Sensing Characterisation

The prepared PANI-Au-SPE samples were sputtered with gold (Agar Auto Sputter Coater from Agar Scientific) using a 3D-printed template to create an appropriate connection between the separated working, counter and reference electrodes. Two different geometries were used. Connection 1 is composed of one 2-mm-wide electrode deposited on the surface to connect the polymer surface to the counter electrode (Figure 2a). The electric field is oriented longitudinally. For connection 2, two parallel electrodes are deposited on the surface of the polymer with a 1-mm gap in between (Figure 2b), connecting the polymer to the platinum and silver parts of the SPE. A transversal electric field was applied between the counter and the reference electrodes. By using a custom-made connector for the SPE, the PANI-Au-SPE sensors were put in a dynamic exposure chamber, in which the temperature and relative humidity (RH) were controlled for all the experiments: T = 25 °C (RT) and RH for ammonia (NH3) sensing fixed at 70% and for humidity characterisation varying between 10 and 90%. When the sensor was exposed to the NH3 and humidity, a variation in the resistance of the active PANI material was measured. The behaviour of the sensor in the presence of NH3 is presented as a percentage of the relative response Equation (1):
R e s p o n s e   ( % ) =   [ ( R t R 0 ) R 0 ] · 100
where Rt is the resistance at a certain time, and R0 is the initial resistance under zero air. The resistance of the sensor was measured continuously with a computerised digital multimeter (Agilent 34970A) as a function of the NH3/humidity concentration and the exposure time. The NH3 concentration was measured at the gas outlet of the gas chamber with the NH3 analyser (Picarro G2103) and the humidity was measured directly in the chamber with the temperature/RH sensor (Sensirion SHT25). The desired analyte concentration in the chamber was controlled by the flow rate of the two gases (NH3 gas and humid air) using a gas generation and dilution system (Omicron technologies OMI-SR042A-A). The complete measuring setup is presented in Figure 2c.
For the characterisation of the effect of humidity, the sensor was exposed to a certain percentage of relative humidity for 30 min in both directions (from 0% to 70% RH and back). The sensor’s stability in purified air at 70% RH was monitored over 40 h.
The protocol to analyse the behaviour of the sensor in contact with NH3 involved three phases: 1. Estimation of the initial resistance of the sensor after exposing it to purified air (zero air + humid air); 2. Measuring of the sensor’s resistance during exposure to the analyte. In this phase, the sensor’s resistance changes due to the interaction of the analyte with the active PANI layer; 3. Blowing the sensor flushed with purified air (zero air + humid air), causing desorption of the analyte and recovery of the sensor’s resistance. The NH3 was sensed by exposing the sensor for 10 min to a particular concentration of NH3 gas and 50 min to purified gas for the desorption. Then, for simulating real-time measurements without an intermediate process of desorption, the NH3 gas concentration changed every 10 min. The response time is defined as the time it takes for the sensor to reach 90% of the response change.

3. Results and Discussion

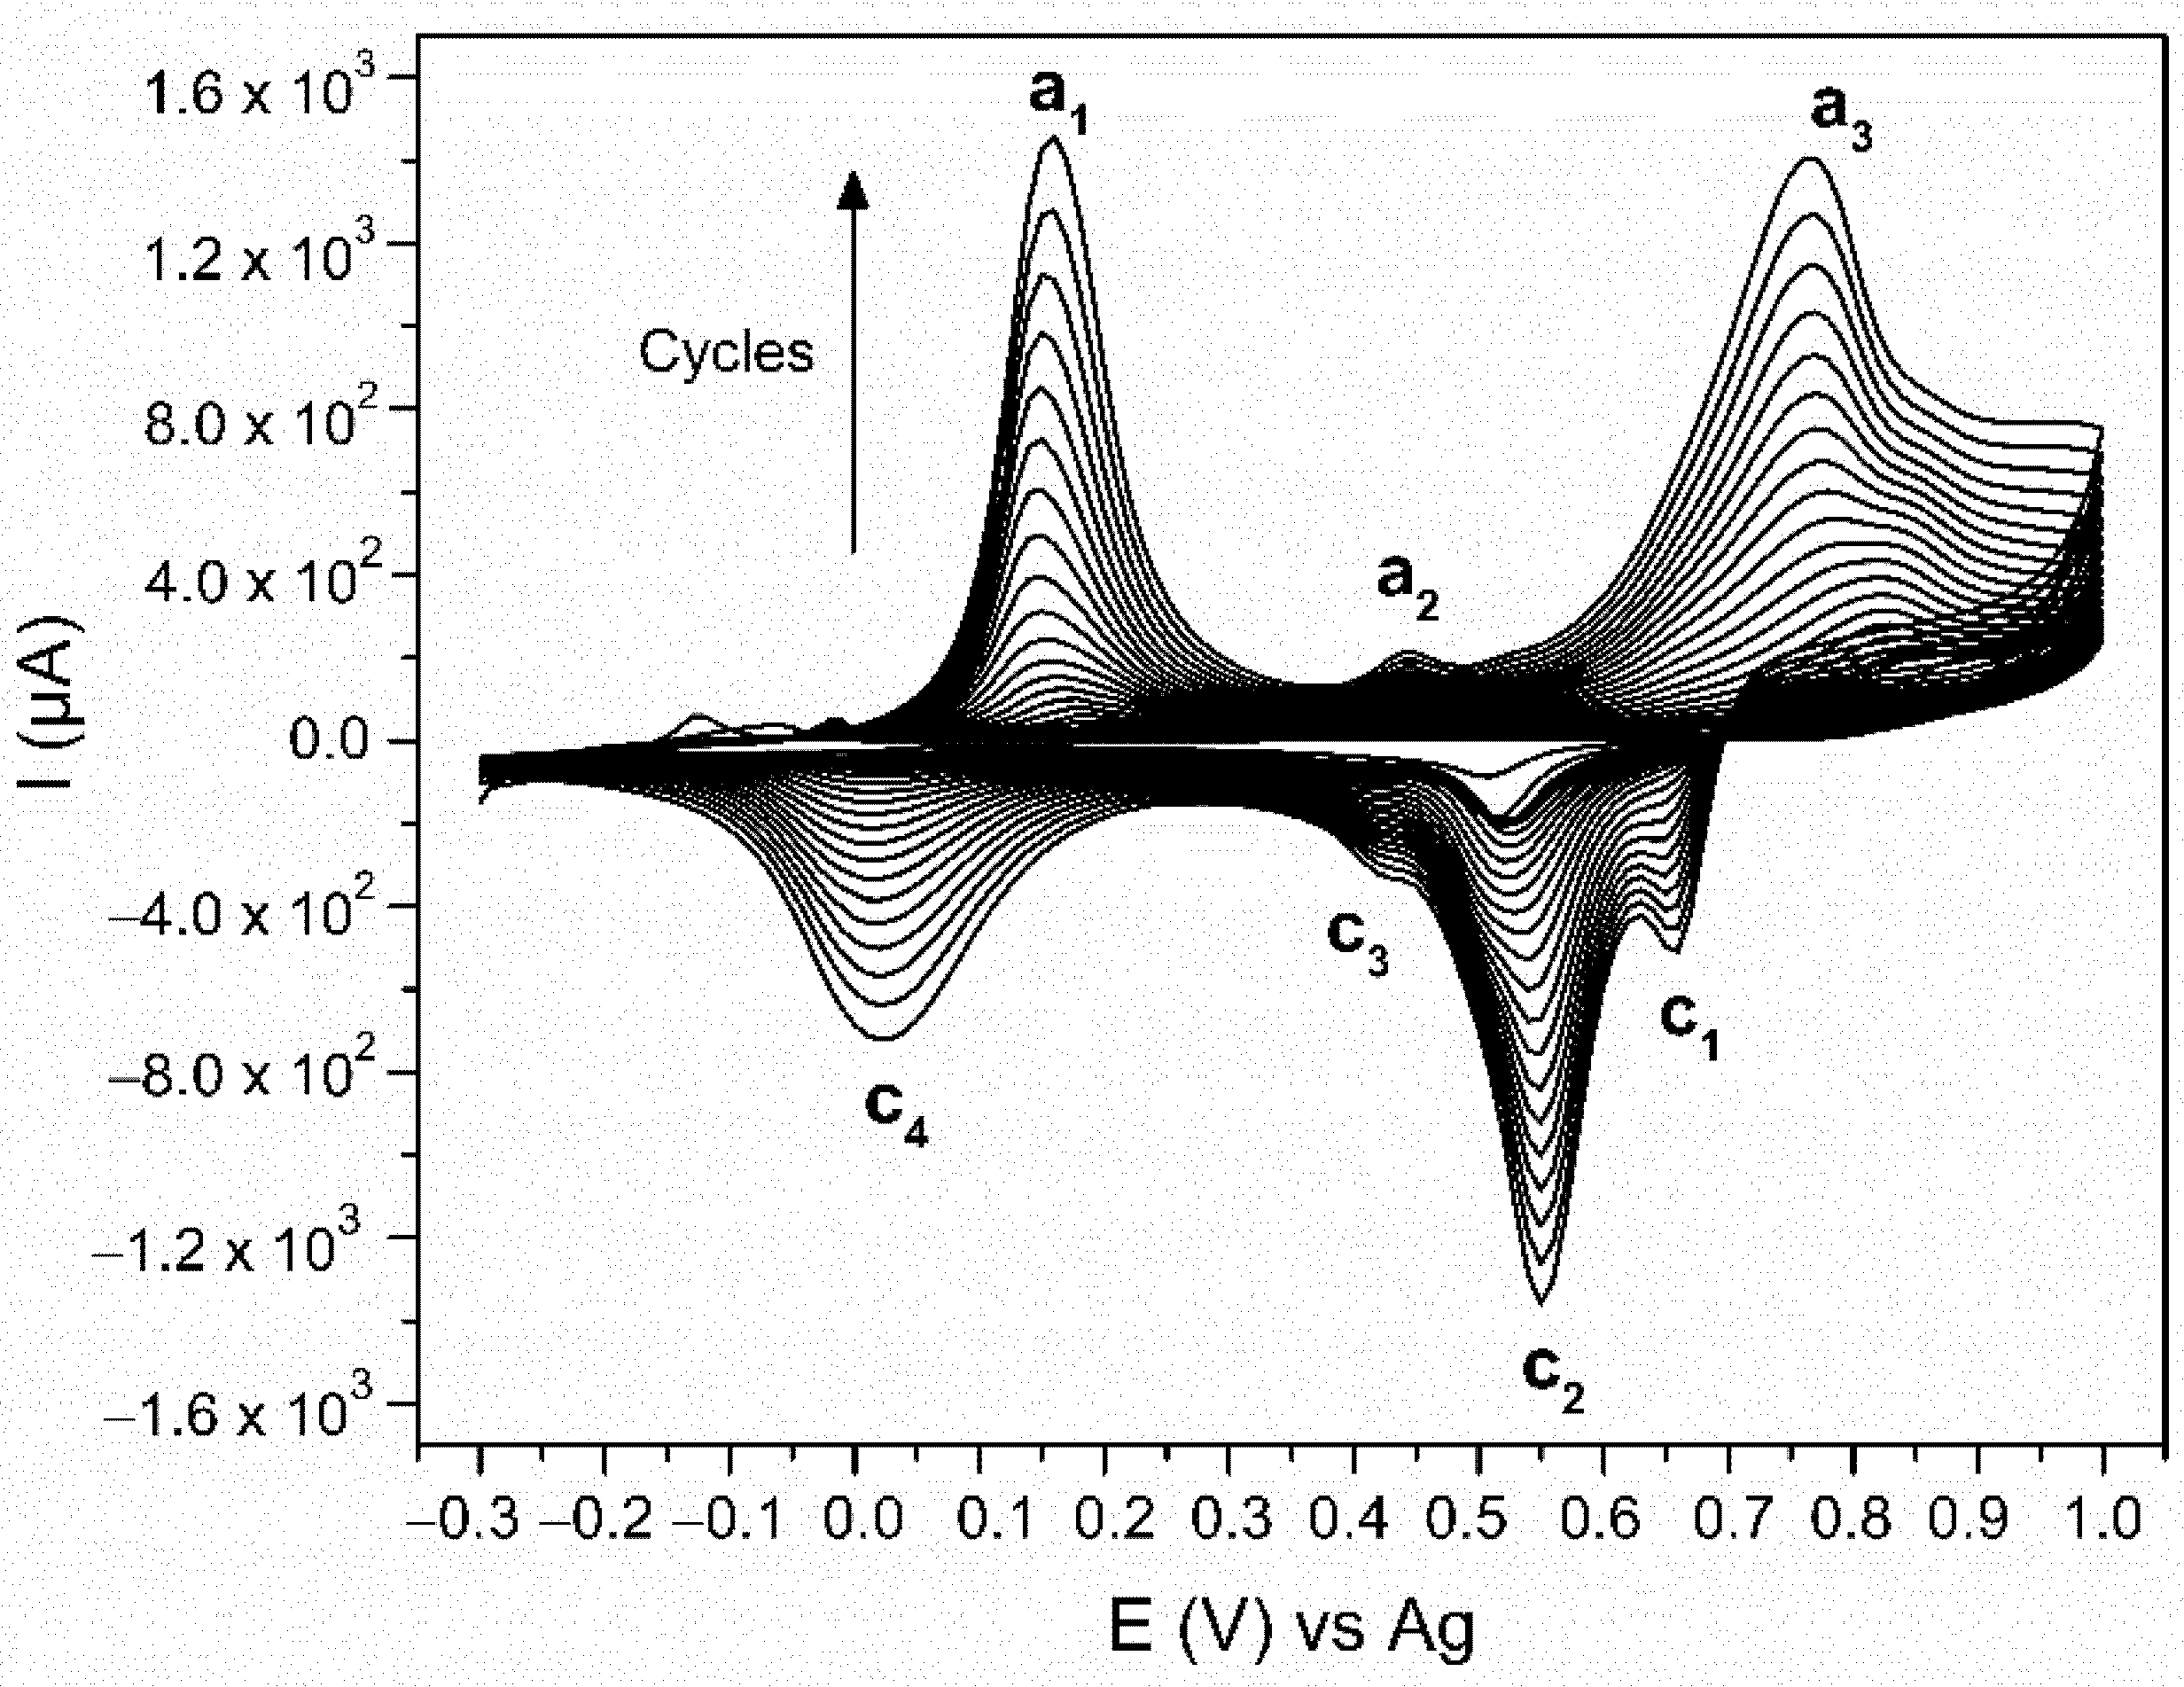
3.1. Electrodeposition of Polyaniline (PANI)

The PANI was electrodeposited with CV using a 0.1 M aniline monomer suspension in a 1 M HCl electrolyte. Figure 3 shows all 23 cycles of the electropolymerisation process. There are three peaks observed in the anodic scan (E (a1) = 0.16 V, E (a2) = 0.45 V, and E (a3) 0.77 V vs. Ag) and four in the cathodic scan (E (c1) = 0.66 V, E (c2) = 0.55 V, E (c3) = 0.42 V, E (c4) = 0.02 V vs. Ag). At the beginning of the electropolymerisation, the CV is performed on the pure Au-SPE, causing Au oxidation (E = 1 V) and reduction (E = 0.51 V) [57,58]. The monomer aniline oxidation, which is the first step in the aniline electropolymerisation occurs at E = 0.9 V [43] in the anodic scan. These later peaks, however, are not visible due to the gradually increasing currents of the peaks, characteristic for the PANI’s formation and its redox behaviour. The anodic peak a1 is the oxidation peak of the leucoemeraldine (the fully reduced state of PANI), which oxidises to emeraldine (half-oxidised state). The anodic peak a2 is related to the formation of the intermediate degradation products (p-benzoquinone) and their oxidation. The anodic peak a3 is the oxidation of emeraldine to pernigraniline (fully oxidised state) [55,59,60]. All these processes are reversible during the cathodic scan. The cathodic peaks c1 and c2 are the reduction of pernigraniline. The splitting of the peak is associated with the acidity of the electrolyte [59]. The cathodic peak c3 is the reduction of the intermediate degradation products, p-benzoquinone to hydroquinone, and the cathodic peak c4 is the reduction of emeraldine to leucoemeraldine [55,59,60]. Leucoemeraldine is known to be an unstable state of PANI [61]; therefore, after exposing the electrode to air at the end of the electropolymerisation, it is oxidised in the direction of emeraldine. The same conclusion was made after a correlative study of the electrodeposition and electrochromic behaviour of PANI [54]. Due to the fact that we are performing the electropolymerisation in an HCl electrolyte [43], the final product is HCl-doped PANI.

3.2. Characterisation and Analysis of the Electrodeposited PANI

The morphology of the Au-SPE and the PANI-Au-SPE in the form of FE-SEM images is presented in Figure 4. The Au-SPE top-view surface (Figure 4a) appears to be a layer with an uneven surface relief and larger, randomly distributed pores. From the cross-section view (Figure 4b) the Au layer takes on the surface relief of the ceramic grains of the SPE substrate. The Au layer’s thickness is approximately 250 nm. Figure 4c,d shows the top-view surface and the cross-section of the PANI-Au-SPE. The PANI electrodeposited with CV appears to be a compact film composed of interconnected nanofibers attached to the Au surface. The PANI layer’s thickness was estimated to be around 5 µm.
Figure 5a,b presents the 3D surface mapping of the Au-SPE and PANI-Au SPE. A 0.2 × 0.2 mm2 surface area was examined in the direction perpendicular to the electrode. The Au-SPE surface has an uneven relief with some randomly distributed, low areas, which is consistent with the Au-SPE SEM surface images (Figure 4a). The roughness factor (Ra) for the Au-SPE surface is approximately 0.58 µm. In the case of the PANI-Au-SPE, the Ra increases to 0.91 µm. The surface relief has fewer higher areas, but more lower areas with an open PANI structure, as seen from the PANI-Au-SPE SEM surface image (Figure 4c). Materials with a higher roughness have abundant surface-adsorption sites, causing an increased response to gas analytes [62]. Therefore, by electrodepositing the PANI with CV, we have successfully completed the first step towards obtaining suitable material for gas sensing, due to the open nanostructure of the PANI and the increased roughness.
Fourier-transform infrared (FTIR) spectra were used to characterise the state of the PANI-Au-SPE (Figure 6). The band at 1565 cm−1 corresponds to the quinoid-ring stretching vibrations, while the band at 1489 cm−1 corresponds to the benzenoid-ring stretching vibrations. The bands at 1374 and 1296 cm−1 correspond to the C–N stretching in the neighbourhood of the quinoid ring and to the C–N stretching of a secondary aromatic amine. The band at 1240 cm−1 corresponds to the C–N+• stretching vibrations in the conductive protonated form of PANI. The broad band at approximately 1136 cm−1 corresponds to the C–H aromatic in-plane deformation vibrations [9,63,64,65]. The bands at approximately 800 cm−1 originate from the C–H out-of-plane bending in the 1,4-disubstituted ring structures. These indicate the head-to-tail coupling of the aniline during the polymerisation [30,66]. This type of coupling is known for polymerisation in acidic conditions [59]. The band at 505 cm−1 corresponds to the bending vibrations of the PANI backbone due to the presence of a chloride ion [66], which confirms the spontaneous doping of the PANI during electropolymerisation. From the ratio of the area of the peaks corresponding to the quinoid (1565 cm−1) and benzenoid rings (1489 cm−1) (Q/B), the oxidation level can be estimated [65,67]. The oxidation level of the PANI-Au-SPE is 0.8, which is consistent with the electrochemically synthesised PANI via chronoamperometry (polymerisation at constant potential) [65]. The structural form of the emeraldine state has one quinoid ring vs. three benzenoid rings, giving a ratio of 0.75. The FTIR results confirm the formation of a conductive PANI layer on the SPE in the form of an emeraldine salt, which was expected based on the observed green colour of the polymerised electrode.

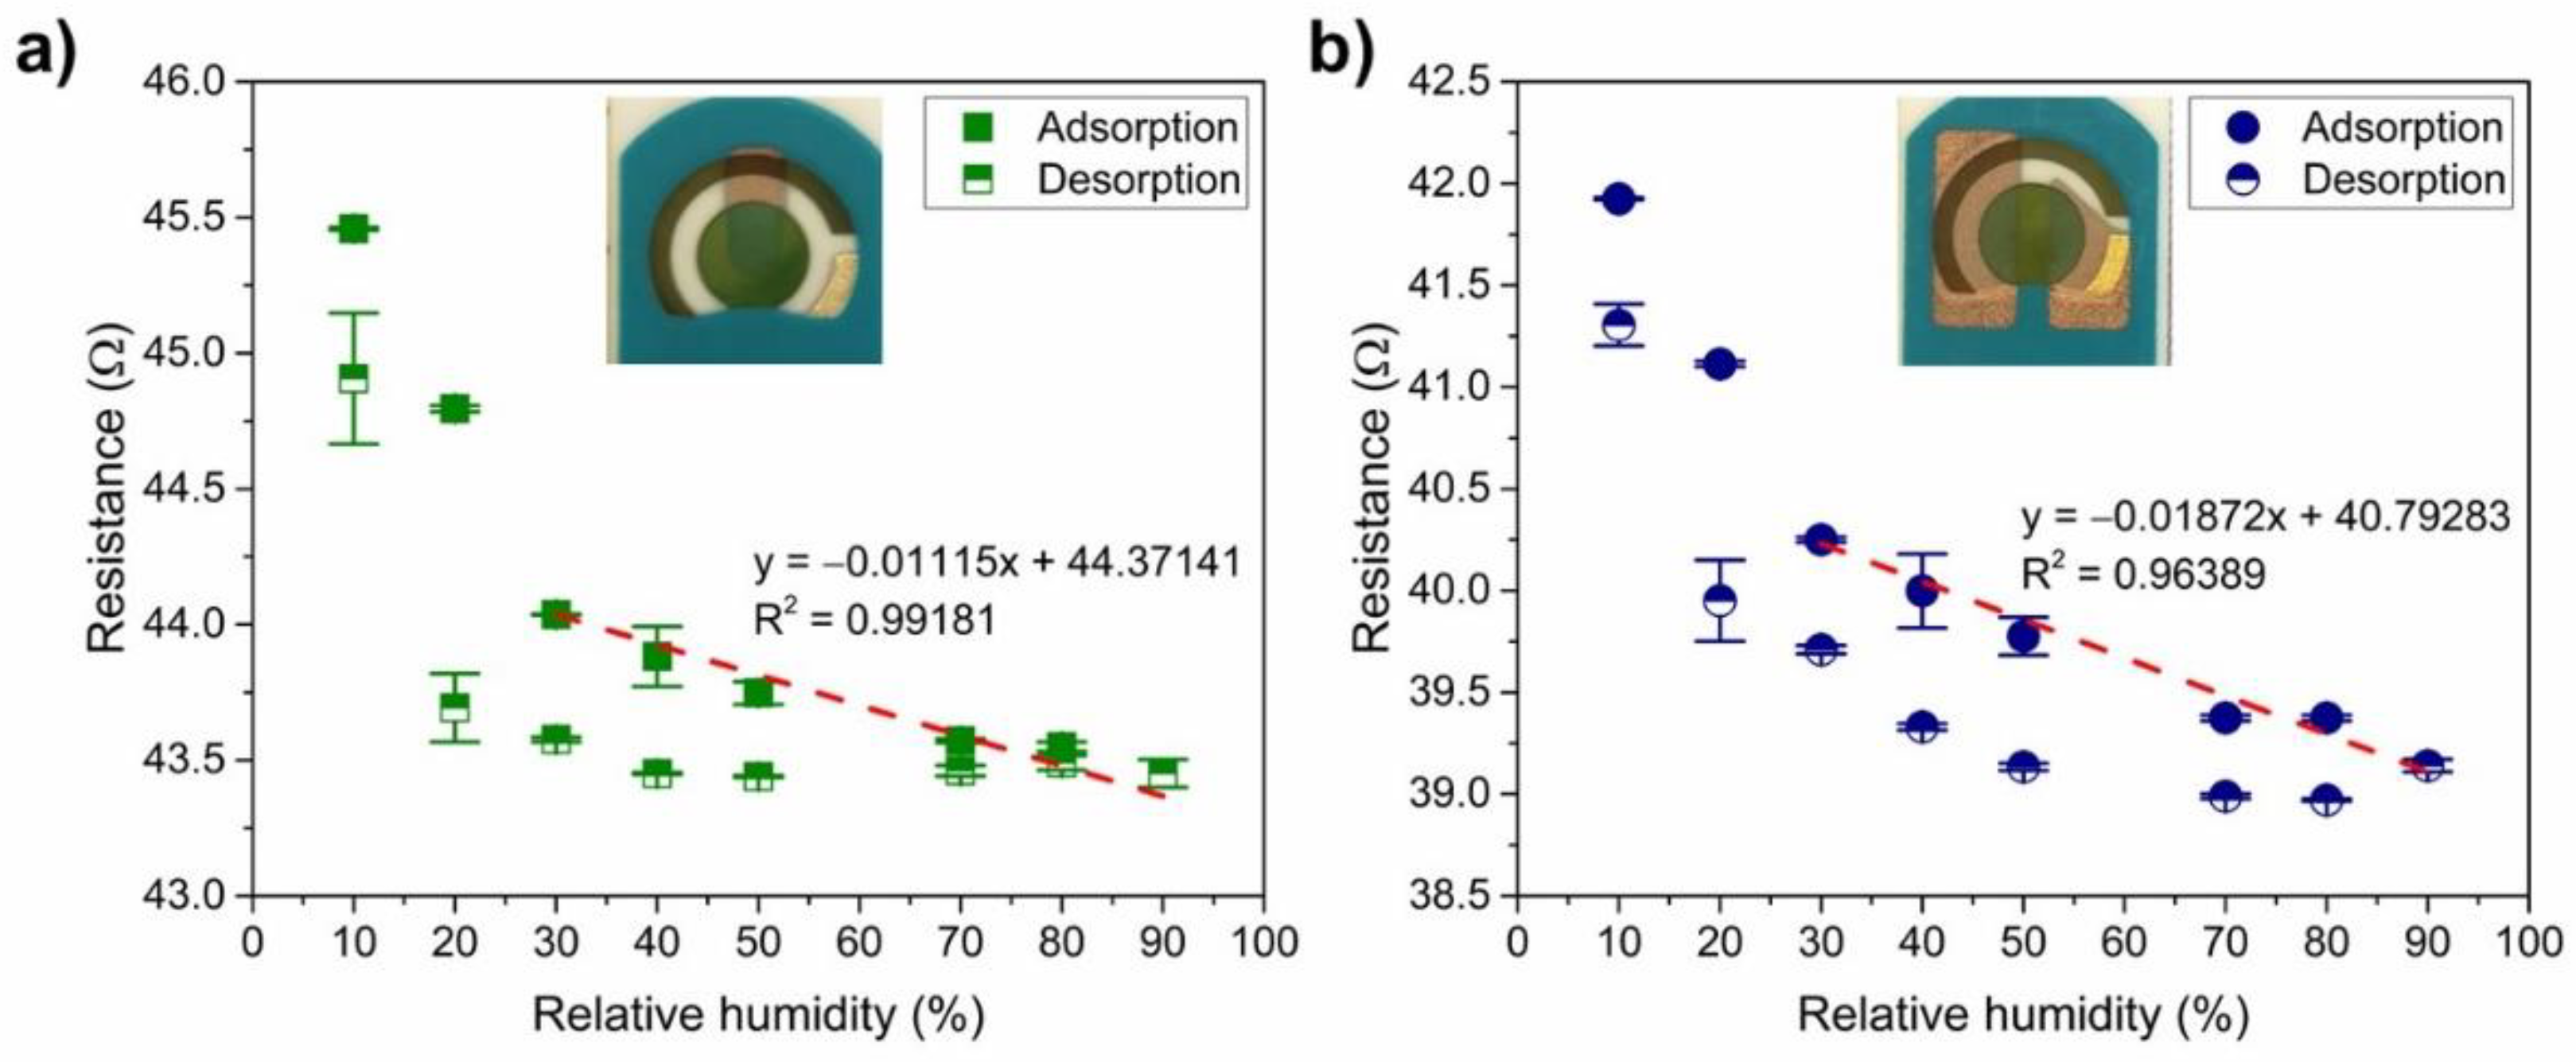
3.3. Impact of Humidity on the Resistance of the PANI-Au-SPE

The PANI-Au-SPE samples were firstly prepared for a two-point measuring system. The electrochemical SPE-based system has three separate electrodes, a large gap between them (approximately 1 mm) and the electrodeposition of PANI only on the surface of the gold working electrode. Therefore, a suitable connection between the working and counter electrodes (connection 1, Figure 2a) and the counter, working and reference electrode (connection 2, Figure 2b), was created with Au sputtering. The as-prepared PANI-Au-SPE sensors were characterised for the effect of humidity and NH3 sensing.
Figure 7 shows the typical response of the PANI to humidity for both types of connection (olive circle—connection 1, and navy square—connection 2): the water molecules cause a higher degree of doping, i.e., a lower resistivity by facilitating the proton exchange inside the PANI. The enhancement of the charge transport comes from the transfer from the reduced units (NH2+) to the oxidised units (NH+=) [40,68] and/or the increase of the ionic conduction due to the release of a proton from the water molecules that are adsorbed [69]. Both PANI-Au-SPE sensors have a similar initial resistance (the same exponential range) and show a linear trend (R2 > 0.96 for both connections) in the decreasing resistance with increased RH from 30% to 90% (adsorption of humidity). The difference in the sensitivity to RH (slope of the linear curve; –0.01 Ω%−1 for connection 1, and –0.02 Ω%−1 for connection 2) is two-times higher in the case of the sensor with connection 2.
Next, the reversibility of the PANI-Au-SPE sensors’ resistance after exposing them to 90% RH was investigated. Figure 7 shows the adsorption and desorption of water vapour in humid air for the PANI-Au-SPE sensor with connection 1 (Figure 7a) and connection 2 (Figure 7b). After continuous exposure to a higher RH, the PANI-Au-SPE did not return to its initial resistance at a certain RH. The desorption resistances are different from the adsorption resistances by 0.14–2.46% for connection 1 and 0.98–2.83% for connection 2. In addition to the “protonation effect”, water molecules at high RH can cause swelling of the PANI fibres, which increases the packing disorder [37] and can contribute to the irreversibility. As the PANI acts as water-sensitive material, all further measurements were performed at a constant 70% RH to eliminate the influence of the environment.
The stability of the PANI-Au-SPE was investigated by exposing the PANI-Au-SPE sensors to environmental conditions (room temperature-RT, 70% RH), which were later used for the NH3 detection (Figure 8). The PANI-Au-SPE sensor with both connection geometries has a linear increase in the resistance with time (R2 = 0.99 for both connections). Connection 1 has a two-times-higher aging effect than connection 2 (slope of the linear curve; 0.1 Ωh−1 for connection 1, and 0.05 Ωh−1 for connection 2). Thus, the PANI-Au-SPE sensor with connection 1 is more stable with time. As seen in Figure 7, connection 2 has a two-times-higher sensitivity towards RH and a two-times-lower stability with time (Figure 8). Both connections have approximately the same PANI surface area sputtered with Au, i.e., 4 mm2. The main difference is in the distribution of the current flows across the device, which are difficult to determine precisely given its structure.

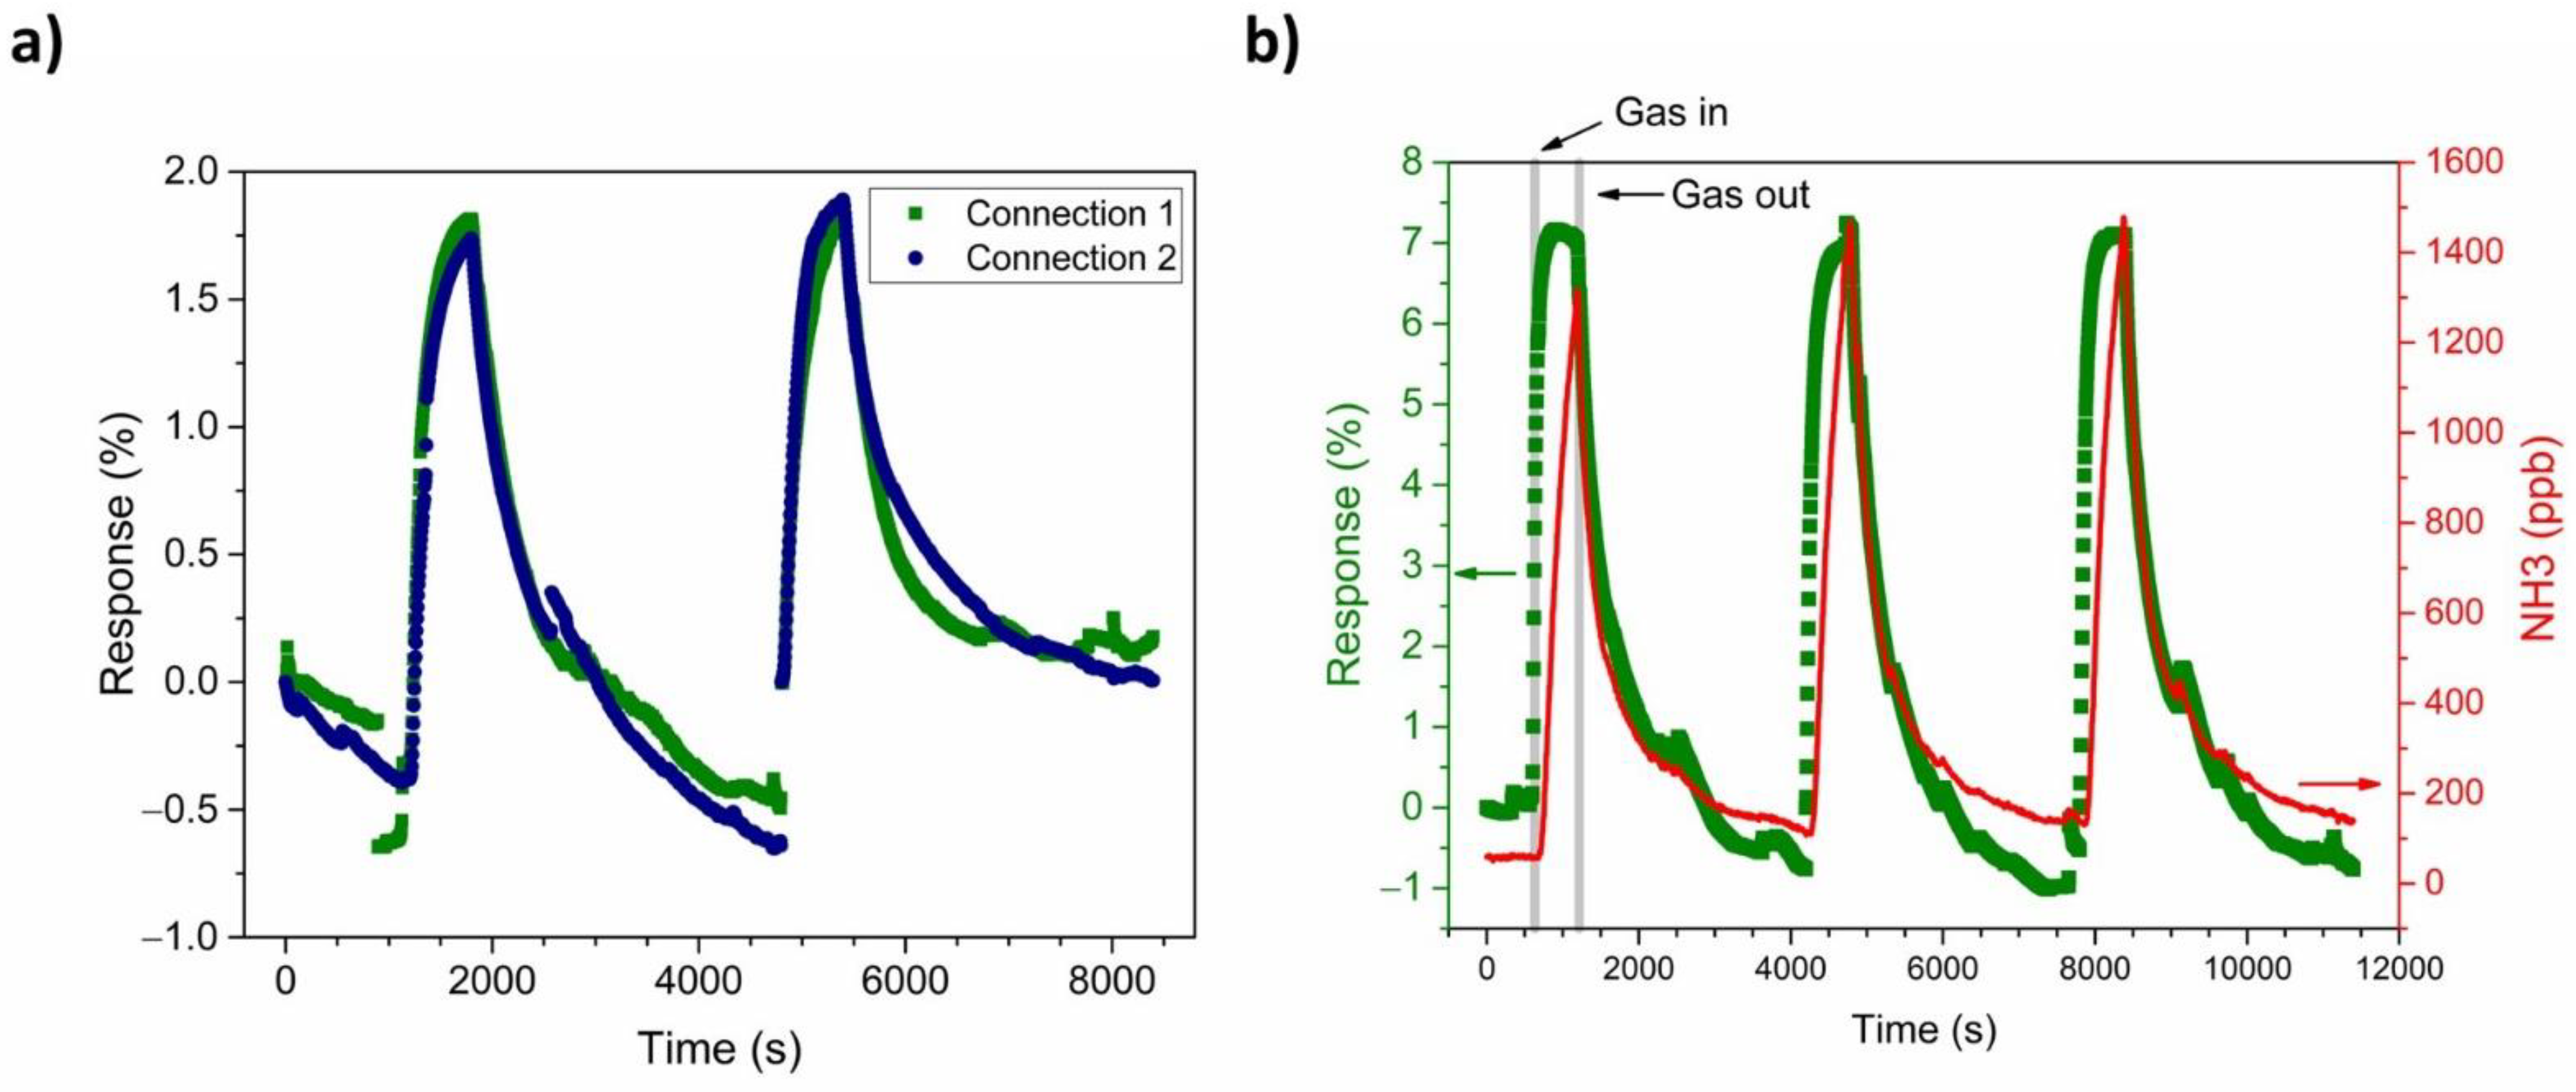
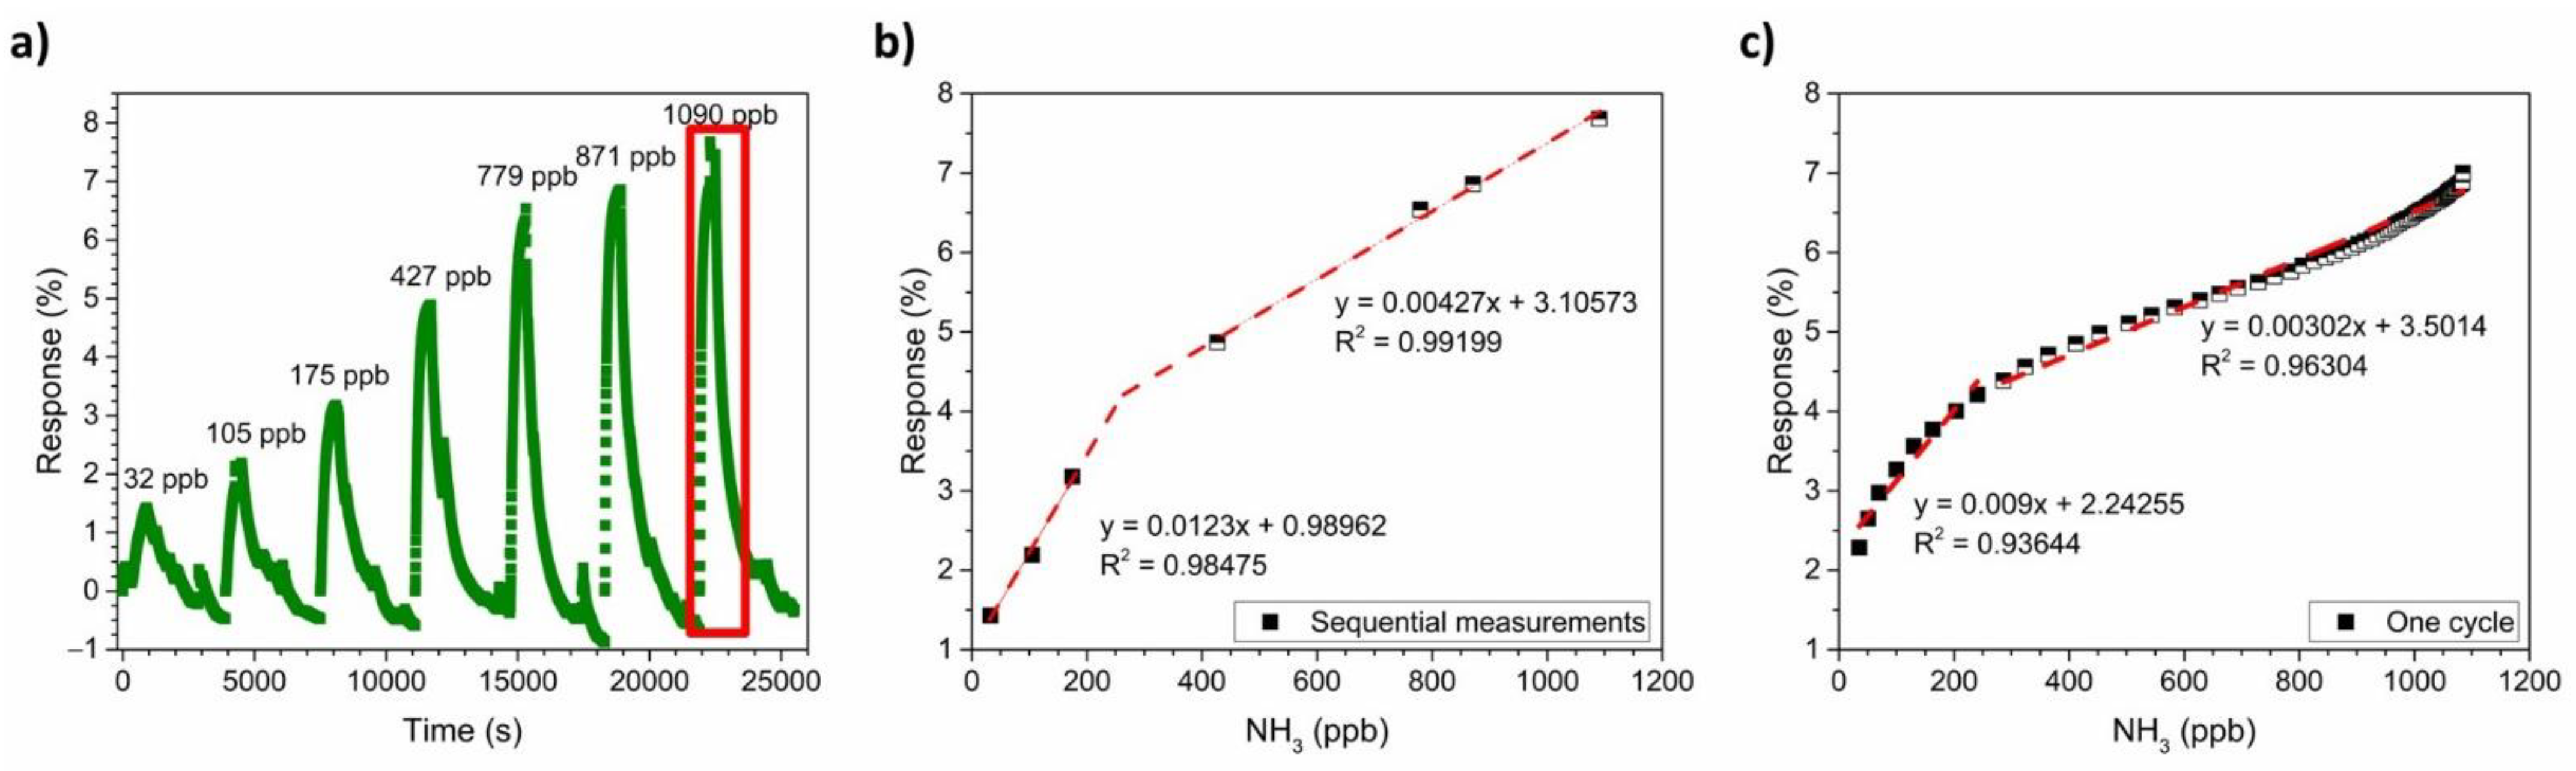
3.4. NH3-Sensing Performance of the PANI-Au-SPE

For a comparison of the influence of the connection geometry on the sensor’s response to NH3, PANI-Au-SPE sensors with both connections were exposed to 500-ppb NH3 at RT and 70% RH (Figure 9a). Both connections exhibit an equivalent relative response to the NH3 under the same conditions. Even though connections 1 and 2 have differences in terms of humidity characterisation (Figure 7) and sensor stability (Figure 8), they both show linear behaviour. As the PANI-Au-SPE sensor’s behaviour towards the NH3 is presented as a relative response, it is not influenced by this difference. Therefore, we can conclude that the current flow through the PANI film due to the geometry of the connections does not influence the PANI’s response to NH3 gas, which suggests the uniformity of the electrodeposited PANI.
As both connections show the same response, either could be used for the subsequent experiments. Our next results, in terms of sensor dynamics, calibration and the simulation of real-time measurements, are presented for connection 1.
Figure 9b shows the repeatability of the PANI-Au-SPE sensor upon exposure to 1400 ppb of NH3 operating at RT and 70% RH. The olive squares represent the relative PANI-Au-SPE sensor’s response and the red curve, the variation in the NH3 concentration at the same time, monitored by the analyser. The PANI-Au-SPE shows the character of a typical p-type semiconductor [70,71], as its resistance increases upon exposure to NH3. The NH3 sensing by the PANI follows the well-known deprotonation/protonation mechanism [25,26]. Polyaniline becomes conductive with the addition of dopants to the polymeric chain, which generates protonation on the nitrogen atom and consequently facilitates the movements of valence electrons, causing hopping conduction. In the presence of NH3 gas, a proton is removed from the polymeric chain to form an energetically favourable ammonium cation (NH4+), compensated in the structure by the dopant (A). Removing a proton from the PANI reduces the amount and the mobility of the charge carrier, resulting in an increased resistance of the PANI [6]. In the absence of NH3, NH4+ decomposes to NH3 and H+, causing the reversible protonation of the PANI (Equation (2) and Figure 10) [25,26].
PANIH+ + NH3 = PANI + NH4+
Compared with the NH3 analyser data (Figure 9b), the PANI-Au-SPE sensor follows the behaviour of real-time NH3 concentration, without reaching the saturation point at the maximum NH3 concentration, i.e., 1400 ppb. The PANI-Au-SPE sensor shows repeatability during three cycles of exposure to NH3, having enough time to complete the NH3 desorption (50 min), and then to respond equally to the NH3 exposure (10 min).
To obtain the calibration curve of the PANI-Au-SPE sensor for NH3, a series of NH3 gases with concentrations ranging from 32 ppb to 1090 ppb were used. Figure 11a shows the PANI-Au-SPE sensor’s response to different real-time NH3 concentrations, monitored by the analyser. A higher concentration of NH3 has a higher PANI-Au-SPE sensor response. By plotting the maximum sensor response vs. the NH3 concentration, the calibration plot for the PANI-Au-SPE sensor is obtained (Figure 11b). The PANI-Au-SPE sensor shows two linear ranges, from 32 ppb to 250 ppb (R2 = 0.98) and from 250 ppb to 1100 ppb (R2 = 0.99). The sensitivity of the PANI-Au-SPE sensor to NH3 detection at 70% RH and RT is 12.3% ppm−1 for the first linear range, and 4.27% ppm−1 for the second. Due to the synchronic NH3 concentration monitoring by the analyser, the calibration plot for the PANI-Au-SPE sensor was also made by plotting the responses of the PANI-Au-SPE sensor for the last cycle of 1090 ppb NH3 (Figure 11a) vs. NH3 analyser data at the same time (Figure 11c). The analyser gives more extensive and detailed NH3 data for all the measurement times. Therefore, the calibration plot of one cycle has more points in comparison to the calibration plot made from the maximum responses of sequential measurements (Figure 11b). The calibration plot of one cycle (Figure 11c) has the same two linear ranges, from 32 ppb to 250 ppb (R2 = 0.94) and from 250 ppb to 1100 ppb (R2 = 0.96) with a similar sensitivity (9% ppm−1 for the first linear range, and 3.02% ppm−1 for the second). As both ways of obtaining the calibration plot provide the same result, the calibration obtained by applying data from the analyser simplifies the sensor’s characterisation, i.e., a larger number of points made with only one measurement. The theoretical detection limit is calculated according to the formula from IUPAC recommendations Equation (3):
L O D   ( p p b ) =   3 σ m ,
where σ is the standard deviation of the sensing 15-min baseline before the NH3 exposure and m is the slope of the first calibration curve (0.0123% pbb−1). The detection limit is calculated to be 23 ppb, which is a realistic number regarding to the lowest detected concentration (quantification limit 32 pbb).
In a real-time environment the sensors are not exposed to absorption and desorption cycles, but the gas concentration varies continuously without a recovery time. Figure 12a shows the PANI-Au-SPE sensor response (olive squares) to a continuously changing NH3 concentration (red curve). The PANI-Au-SPE sensor follows the same trend as the NH3 concentration, proving that the system can have the same response trend without any additional recovery time. The out-of-range jump in the sensor’s response and the NH3 analyser at 27 min is a consequence of the RH instability (grey curve) at the same time. It was already proven [30] that different humidity conditions influence the PANI’s sensitivity to NH3, due to the reaction between water and NH3. Thus, it is important to maintain constant humidity conditions in the case of NH3 sensing or to monitor simultaneously the humidity to correct the signal. For a comparison of the real-time sensor responses with measurements from a typical laboratory cycle, four points (blue dots in Figure 12a) were inserted into the calibration plot, acquired from sequential measurements (Figure 11b), and are presented in Figure 12b. All the real-time points represent a linear trend in the higher NH3 concentration range (250 ppb to 1100 ppb) with the same sensitivity.
Table 1 summarises the characteristics of the PANI-Au-SPE sensor constructed and studied here with state-of-the-art PANI NH3 sensors at RT [8,30,70,71,72,73]. All the presented PANI systems from the literature were based on a chemically synthesised PANI and without the presence of any nanomaterials. Indeed, the PANI/HCl from a chemical synthesis shows a quantification limit at 1000 ppb [73] when the electropolymerised PANI/HCl from this investigation has a quantification limit 31 times lower. Regarding the response time, we also need to consider preliminary experiments with the reference NH3 analyser, showing a slow response to the real-time NH3 concentration increase inside the gas chamber. Because the concentration is not that high, it is impossible to distinguish the response time from the actual filling time. Thus, the calculated response time for the presented system is over-estimated and is probably much shorter.
Regarding the PANI’s′ conductivity and sensing performance, the addition of an appropriate nanomaterial, i.e., electron donors or acceptors, in the form of metal, metal oxide nanoparticles or carbon nanotubes, enhances the conductivity due to the p-n heterojunction at the interface between the p-type PANI and n-type nanoparticles [33,34,50]. If the PANI’s sensing characteristic is changed to n-type, p-n heterojunctions are formed by the addition of material, which acts as p-type (electron acceptor), e.g., carbon nanotubes [35]. As a result, ultra-low detection limits (0.25 ppb at 60% RH and RT [50], 0.25 ppb [33] and <16 ppb [34] at RT with humidity compensation) can be achieved. In contrast, this work is based on pure PANI with the simplest dopant (HCl) and no additional nanomaterial. Nevertheless, due to the film’s morphology and low thickness, a sufficiently low quantification limit (32 ppb) and good performance (sensitivity: 12.3% ppm−1 [32–200 ppb] and 4.27% ppm−1 [200–1000 ppb]) were achieved. Comparing the presented sensing system based on PANI with the literature on PANI for NH3 sensing as presented in Table 1, better sensing properties in terms of sensitivity were found, mainly due to the addition of complex dopants and nanomaterials. Our proposed sensing system is comparable to the best of the state-of-the-art literature for PANI/NH3 sensors; however, it offers the advantages of ease of fabrication and simplicity where PANI is doped only with an univalent ion (Cl). At this stage, any further work on adding nanomaterials to the system has the potential to improve sensitivity. With the good baseline of the current sensor, the addition of nanomaterials could, in the first stage, be focused on adding a certain material that could catalyse the target analyte to produce NH3 and enable the indirect detection of other toxic compounds.
In the field of sensors, four main characteristics make a material/system suitable: sensitivity, repeatability, reproducibility, and selectivity. As shown in the calibration plots (Figure 11a,b) and by comparing with the literature (Table 1), the PANI-Au-SPE has a high sensitivity in the low-ppb range. Moreover, the reproducibility and the repeatability of our PANI-Au-SPE was proven by comparing electrodes with different connection geometries (Figure 9a) and by performing several continuous cycles (Figure 9b). Finally, as the selectivity of PANI for NH3 detection was already proven [21,26,30,71], our PANI-Au-SPE sensor is an excellent example of an NH3 sensor system. Generally, after comparing our work with previously reported studies [6,8,30,70,71,72,73] we can conclude that electrochemically deposited PANI is an under-examined but up-and-coming area of NH3 gas sensing. Due to its practical and controllable preparation via electropolymerisation and SPE’s direct use, the proposed procedure reveals novel aspects for NH3 sensing.

4. Conclusions

We have shown that electrochemically synthesised PANI doped with HCl can be successfully deposited on a gold, screen-printed electrode (Au-SPE) and used as an efficient room-temperature NH3-gas sensor. With our approach, we have successfully bridged the gap from 3-electrode electrochemical systems suitable for PANI electrodeposition to 2-electrode resistivity systems suitable for NH3 gas sensing, which was further achieved via additional Au sputtering. Such prepared PANI-Au-SPE sensors show exceptionally good repeatability, reproducibility and sensitivity in the low-ppb NH3 range. The incorporation of the gas analyser as an additional component for checking and controlling the target gas inlet contributes to the system characterisation, i.e., fewer measurements for a calibration curve with multiple points, enable real-time sensor responses and genuine results, i.e., monitoring the sensor’s responses during gas interflow and not only at the maximum concentration. Electrochemical synthesis is considered to be unconventional as it is rarely used in gas sensing, but this fully controllable way of preparing PANI, and its combination with a three-electrode SPE system, leads to novel aspects in PANI gas-sensing systems.

Author Contributions

Conceptualisation, A.K., C.D., J.-L.W. and K.Ž.R.; methodology, A.K., K.Ž.S. and C.D.; software, N.R.; validation, C.D., J.-L.W. and K.Ž.R.; formal analysis, A.K., and K.Ž.S.; investigation, A.K., K.Ž.S. and C.D.; resources, C.D., J.-L.W.; data curation, A.K., K.Ž.S. and C.D.; writing—original draft preparation, A.K.; writing—review and editing, A.K., C.D., N.R., J.-L.W., K.Ž.R., K.Ž.S. and S.Š.; visualisation, A.K., K.Ž.R., C.D. and J.-L.W.; supervision, K.Ž.R., C.D., J.-L.W.; project administration, S.Š., K.Ž.R.; funding acquisition, S.Š. All authors have read and agreed to the published version of the manuscript.

Funding

This research was funded by the ARRS young-researcher project, grant number PR-08337; the ARRS project High performance nanostructured acrylamide sensors, grant number J2-1739; program Nanostructured Materials, grant number P2-0084; and the Erasmus+ program of the European Union, Jožef Stefan International Postgraduate School project, grant number 2019-1-SI01-KA103-060202.

Institutional Review Board Statement.

Not applicable.

Informed Consent Statement

Not applicable.

Data Availability Statement

Data sharing not applicable.

Acknowledgments

The work was performed in the framework of collaboration between Jožef Stefan Institute, Slovenia and Institut Mines-Télécom, Lille Douai France. The authors are grateful to Beno Klopčič for construction and production of the connector, to the ULTRACOOL laboratory for the access to equipment (Director’s Fund 2017 project), and to Živa Marinko for performing the profilometry.

Conflicts of Interest

The authors declare no conflict of interest.

References

  1. Hangarter, C.M.; Chartuprayoon, N.; Hernández, S.C.; Choa, Y.; Myung, N.V. Hybridized conducting polymer chemiresistive nano-sensors. Nano Today 2013, 8, 39–55. [Google Scholar] [CrossRef]
  2. Le, T.-H.; Kim, Y.; Yoon, H. Electrical and electrochemical properties of conducting polymers. Polymers 2017, 9, 150. [Google Scholar] [CrossRef] [PubMed]
  3. Park, S.J.; Park, C.S.; Yoon, H. Chemo-electrical gas sensors based on conducting polymer hybrids. Polymers 2017, 9, 155. [Google Scholar] [CrossRef] [PubMed]
  4. Wong, Y.C.; Ang, B.C.; Haseeb, A.S.M.A.; Baharuddin, A.A.; Wong, Y.H. Review—Conducting polymers as chemiresistive gas sensing materials: A review. J. Electrochem. Soc. 2020, 167, 037503. [Google Scholar] [CrossRef]
  5. Pandey, S. Highly sensitive and selective chemiresistor gas/vapor sensors based on polyaniline nanocomposite: A comprehensive review. J. Sci. Adv. Mater. Devices 2016, 1, 431–453. [Google Scholar] [CrossRef] [Green Version]
  6. Tanguy, N.R.; Thompson, M.; Yan, N. A review on advances in application of polyaniline for ammonia detection. Sens. Actuators B Chem. 2018, 257, 1044–1064. [Google Scholar] [CrossRef]
  7. Alfano, B.; Massera, E.; de Maria, A.; de Girolamo, A.; di Francia, G.; Delli Veneri, P.; Napolitano, T.; Borriello, A. Polyaniline Proton Doping for Sensor Application. In Proceedings of the 2015 18th AISEM Annual Conference, AISEM 2015, Trento, Italy, 26 March 2015. [Google Scholar]
  8. Wojkiewicz, J.L.; Bliznyuk, V.N.; Carquigny, S.; Elkamchi, N.; Redon, N.; Lasri, T.; Pud, A.A.; Reynaud, S. Nanostructured polyaniline-based composites for ppb range ammonia sensing. Sens. Actuators B Chem. 2011, 160, 1394–1403. [Google Scholar] [CrossRef]
  9. Mikhaylov, S.; Ogurtsov, N.; Noskov, Y.; Redon, N.; Coddeville, P.; Wojkiewicz, J.L.; Pud, A. Ammonia/amine electronic gas sensors based on hybrid polyaniline-TiO2 nanocomposites. The effects of titania and the surface active doping acid. RSC Adv. 2015, 5, 20218–20226. [Google Scholar] [CrossRef]
  10. Patni, N.; Jain, N.; Pillai, S.G. Polyaniline-based sensors for monitoring and detection of ammonia and carbon monoxide gases. In Trends and Applications in Advanced Polymeric Materials; John Wiley & Sons Inc.: Hoboken, NJ, USA, 2017; pp. 145–162. ISBN 9781119364795. [Google Scholar]
  11. Virji, S.; Kaner, R.B.; Weiller, B.H. Hydrogen sensors based on conductivity changes in polyaniline nanofibers. J. Phys. Chem. B 2006, 110, 22266–22270. [Google Scholar] [CrossRef]
  12. Nicolas-Debarnot, D.; Poncin-Epaillard, F. Polyaniline as a new sensitive layer for gas sensors. Anal. Chim. Acta 2003, 475, 1–15. [Google Scholar] [CrossRef]
  13. Bai, H.; Shi, G. Gas sensors based on conducting polymers. Sensors 2007, 7, 267–307. [Google Scholar] [CrossRef] [Green Version]
  14. Kwak, D.; Lei, Y.; Maric, R. Ammonia gas sensors: A comprehensive review. Talanta 2019, 204, 713–730. [Google Scholar] [CrossRef] [PubMed]
  15. Occupational Safety and Health Administration Sampling and Analytical Methods; Ammonia in Workplace Atmospheres—Solid Sorbent. Available online: https://www.osha.gov/dts/sltc/methods/inorganic/id188/id188.html (accessed on 16 March 2020).
  16. The Fertilizer Institute. Health Effects of Ammonia; The Fertilizer Institute: Arlington, VA, USA, 2010. [Google Scholar]
  17. National Research Council (US); Committee on Acute Exposure Guideline Levels Ammonia. Acute exposure guideline levels. In Acute Exposure Guideline Levels for Selected Airborne Chemicals; National Academies Press: Washington, DC, USA, 2008; Volume 6, pp. 58–114. ISBN 978-0-309-11213-0. [Google Scholar]
  18. Grabowska-Polanowska, B.; Faber, J.; Skowron, M.; Miarka, P.; Pietrzycka, A.; Śliwka, I.; Amann, A. Detection of potential chronic kidney disease markers in breath using gas chromatography with mass-spectral detection coupled with thermal desorption method. J. Chromatogr. A 2013, 1301, 179–189. [Google Scholar] [CrossRef] [PubMed]
  19. Davies, S.; Spanel, P.; Smith, D. Quantitative analysis of ammonia on the breath of patients in end-stage renal failure. Kidney Int. 1997, 52, 223–228. [Google Scholar] [CrossRef] [PubMed] [Green Version]
  20. Di Natale, C.; Paolesse, R.; Martinelli, E.; Capuano, R. Solid-state gas sensors for breath analysis: A review. Anal. Chim. Acta 2014, 824, 1–17. [Google Scholar] [CrossRef]
  21. Le Maout, P.; Wojkiewicz, J.L.; Redon, N.; Lahuec, C.; Seguin, F.; Dupont, L.; Mikhaylov, S.; Noskov, Y.; Ogurtsov, N.; Pud, A. Polyaniline nanocomposites based sensor array for breath ammonia analysis. Portable e-nose approach to non-invasive diagnosis of chronic kidney disease. Sens. Actuators B Chem. 2018, 274, 616–626. [Google Scholar] [CrossRef]
  22. Carquigny, S.; Redon, N.; Plaisance, H.; Reynaud, S. Development of a polyaniline/fluoral-P chemical sensor for gaseous formaldehyde detection. IEEE Sens. J. 2012, 12, 1300–1306. [Google Scholar] [CrossRef]
  23. Antwi-Boampong, S.; Peng, J.S.; Carlan, J.; Belbruno, J.J. A molecularly imprinted fluoral-p/polyaniline double layer sensor system for selective sensing of formaldehyde. IEEE Sens. J. 2014, 14, 1490–1498. [Google Scholar] [CrossRef]
  24. Feng, S.; Farha, F.; Li, Q.; Wan, Y.; Xu, Y.; Zhang, T.; Ning, H. Review on smart gas sensing technology. Sensors 2019, 19, 3760. [Google Scholar] [CrossRef] [Green Version]
  25. Kukla, A.L.; Shirshov, Y.M.; Piletsky, S.A. Ammonia sensors based on sensitive polyaniline films. Sens. Actuators B Chem. 1996, 37, 135–140. [Google Scholar] [CrossRef]
  26. Kumar, L.; Rawal, I.; Kaur, A.; Annapoorni, S. Flexible room temperature ammonia sensor based on polyaniline. Sens. Actuators B Chem. 2017, 240, 408–416. [Google Scholar] [CrossRef]
  27. Wallace, G.G.; Teasdale, P.R.; Spinks, G.M. Conductive Electroactive Polymers: Intelligent Polymer Systems; CRC Press: Boca Raton, FL, USA, 2009; ISBN 9781420067095. [Google Scholar]
  28. Ramohlola, K.E.; Monana, G.R.; Hato, M.J.; Modibane, K.D.; Molapo, K.M.; Masikini, M.; Mduli, S.B.; Iwuoha, E.I. Polyaniline-metal organic framework nanocomposite as an efficient electrocatalyst for hydrogen evolution reaction. Compos. Part B Eng. 2018, 137, 129–139. [Google Scholar] [CrossRef]
  29. Hirata, M.; Sun, L. Characteristics of an organic semiconductor polyaniline film as a sensor for NH3 gas. Sens. Actuators A. Phys. 1994, 40, 159–163. [Google Scholar] [CrossRef]
  30. Mérian, T.; Redon, N.; Zujovic, Z.; Stanisavljev, D.; Wojkiewicz, J.L.; Gizdavic-Nikolaidis, M. Ultra sensitive ammonia sensors based on microwave synthesized nanofibrillar polyanilines. Sens. Actuators B Chem. 2014, 203, 626–634. [Google Scholar] [CrossRef]
  31. Di Zhang, H.; Tang, C.C.; Long, Y.Z.; Zhang, J.C.; Huang, R.; Li, J.J.; Gu, C.Z. High-sensitivity gas sensors based on arranged polyaniline/PMMA composite fibers. Sens. Actuators A Phys. 2014, 219, 123–127. [Google Scholar] [CrossRef]
  32. Abdulla, S.; Mathew, T.L.; Pullithadathil, B. Highly sensitive, room temperature gas sensor based on polyaniline-multiwalled carbon nanotubes (PANI/MWCNTs) nanocomposite for trace-level ammonia detection. Sens. Actuators B Chem. 2015, 221, 1523–1534. [Google Scholar] [CrossRef]
  33. Zhang, D.; Wu, Z.; Li, P.; Zong, X.; Dong, G.; Zhang, Y. Facile fabrication of polyaniline/multi-walled carbon nanotubes/molybdenum disulfide ternary nanocomposite and its high-performance ammonia-sensing at room temperature. Sens. Actuators B Chem. 2018, 258, 895–905. [Google Scholar] [CrossRef]
  34. Liu, C.; Tai, H.; Zhang, P.; Yuan, Z.; Du, X.; Xie, G.; Jiang, Y. A high-performance flexible gas sensor based on self-assembled PANI-CeO2 nanocomposite thin film for trace-level NH3 detection at room temperature. Sens Actuators B Chem. 2018, 261, 587–597. [Google Scholar] [CrossRef]
  35. Zhang, W.; Cao, S.; Wu, Z.; Zhang, M.; Cao, Y.; Guo, J.; Zhong, F.; Duan, H.; Jia, D. High-performance gas sensor of polyaniline/carbon nanotube composites promoted by interface engineering. Sensors 2020, 20, 149. [Google Scholar] [CrossRef] [Green Version]
  36. Krutovertsev, S.A.; Sorokin, S.I.; Zorin, A.V.; Letuchy, Y.A.; Antonova, O.Y. Polymer film-based sensors for ammonia detection. Sens. Actuators B. Chem. 1992, 7, 492–494. [Google Scholar] [CrossRef]
  37. Zeng, F.-W.; Liu, X.-X.; Diamond, D.; Lau, K.T. Humidity sensors based on polyaniline nanofibres. Sens. Actuators B Chem. 2010, 143, 530–534. [Google Scholar] [CrossRef]
  38. Manjunatha, S.; Machappa, T.; Ravikiran, Y.T.; Chethan, B.; Sunilkumar, A. Polyaniline based stable humidity sensor operable at room temperature. Phys. B Condens. Matter 2019, 561, 170–178. [Google Scholar] [CrossRef]
  39. Chani, M.T.S.; Karimov, K.S.; Khalid, F.A.; Moiz, S.A. Polyaniline based impedance humidity sensors. Solid State Sci. 2013, 18, 78–82. [Google Scholar] [CrossRef]
  40. Jain, S.; Chakane, S.; Samui, A.B.; Krishnamurthy, V.N.; Bhoraskar, S.V. Humidity sensing with weak acid-doped polyaniline and its composites. Sens. Actuators B Chem. 2003, 96, 124–129. [Google Scholar] [CrossRef]
  41. Nohria, R.; Khillan, R.K.; Su, Y.; Dikshit, R.; Lvov, Y.; Varahramyan, K. Humidity sensor based on ultrathin polyaniline film deposited using layer-by-layer nano-assembly. Sens. Actuators B Chem. 2006, 114, 218–222. [Google Scholar] [CrossRef]
  42. Zhang, J.; Liu, X.; Neri, G.; Pinna, N. Nanostructured materials for room-temperature gas sensors. Adv. Mater. 2016, 28, 795–831. [Google Scholar] [CrossRef]
  43. Gvozdenovic, M.; Jugovic, B.; Stevanovic, J.; Grgur, B. Electrochemical synthesis of electroconducting polymers. Hem. Ind. 2014, 68, 673–684. [Google Scholar] [CrossRef] [Green Version]
  44. Rana, U.; Paul, N.D.; Mondal, S.; Chakraborty, C.; Malik, S. Water soluble polyaniline coated electrode: A simple and nimble electrochemical approach for ascorbic acid detection. Synth. Met. 2014, 192, 43–49. [Google Scholar] [CrossRef]
  45. Paul, E.W.; Ricco, A.J.; Wrighton, M.S. Resistance of polyaniline films as a function of electrochemical potential and the fabrication of polyaniline-based microelectronic devices. J. Phys. Chem. 1985, 89, 1441–1447. [Google Scholar] [CrossRef]
  46. Song, E.; Choi, J.W. A selective hydrogen peroxide sensor based on chemiresistive polyaniline nanowires modified with silver catalytic nanoparticles. J. Micromech. Microeng. 2014, 24, 065004. [Google Scholar] [CrossRef]
  47. Wang, J.; Chan, S.; Carlson, R.R.; Luo, Y.; Ge, G.; Ries, R.S.; Heath, J.R.; Tseng, H.R. Electrochemically fabricated polyaniline nanoframework electrode junctions that function as resistive sensors. Nano Lett. 2004, 4, 1693–1697. [Google Scholar] [CrossRef]
  48. Mehto, A.; Mehto, V.R.; Chauhan, J.; IB, S.; RK, P. Preparation and characterization of polyaniline/ZnO composite sensor. J. Nanomed. Res. 2017, 5. [Google Scholar] [CrossRef] [Green Version]
  49. Chen, C.; Zhang, J.; Du, Y.; Yang, X.; Wang, E. Microfabricated on-chip integrated Au-Ag-Au three-electrode system for in situ mercury ion determination. Analyst 2010, 135, 1010–1014. [Google Scholar] [CrossRef] [PubMed]
  50. Zhang, Y.; Zhang, J.; Jiang, Y.; Duan, Z.; Liu, B.; Zhao, Q.; Wang, S.; Yuan, Z.; Tai, H. Ultrasensitive flexible NH3 gas sensor based on polyaniline/SrGe4O9 nanocomposite with ppt-level detection ability at room temperature. Sens. Actuators B Chem. 2020, 319. [Google Scholar] [CrossRef]
  51. Fratoddi, I.; Venditti, I.; Cametti, C.; Russo, M.V. Chemiresistive polyaniline-based gas sensors: A mini review. Sens. Actuators B Chem. 2015, 220, 534–548. [Google Scholar] [CrossRef]
  52. Couto, R.A.S.; Lima, J.; Quinaz, M.B. Recent developments, characteristics and potential applications of screen-printed electrodes in pharmaceutical and biological analysis. Talanta 2016, 146, 801–814. [Google Scholar] [CrossRef]
  53. Kellenberger, A.; Ambros, D.; Plesu, N. Scan rate dependent morphology of polyaniline films electrochemically deposited on nickel. Int. J. Electrochem. Sci. 2014, 9, 6821–6833. [Google Scholar]
  54. Korent, A.; Žagar Soderžnik, K.; Šturm, S.; Žužek Rožman, K. A correlative study of polyaniline electropolymerization and its electrochromic behavior. J. Electrochem. Soc. 2020, 167, 106504. [Google Scholar] [CrossRef]
  55. Plesu, N.; Kellenberger, A.; Mihali, M.; Vaszilcsin, N. Effect of temperature on the electrochemical synthesis and properties of polyaniline films. J. Non Cryst. Solids 2010, 356, 1081–1088. [Google Scholar] [CrossRef]
  56. DropSens. DropSens Screen-Printed Electrodes. Available online: http://www.dropsens.com/en/pdfs_productos/new_brochures/250at-250bt.pdf (accessed on 8 October 2019).
  57. Yano, J.; Yoshikawa, K.; Kitani, A. Kinetic study of the electropolymerization of aniline using chronoamperometric techniques. Anal. Sci. 1997, 13, 741–746. [Google Scholar] [CrossRef] [Green Version]
  58. Molano Franco, D.; Arevalo-Rodriguez, I.; Roqué i Figuls, M.; Zamora, J. Interleukin-6 for diagnosis of sepsis in critically ill adult patients. Cochrane Database Syst. Rev. 2015, 1, 1–8. [Google Scholar] [CrossRef]
  59. Fitriyana, F.; Kurniawan, F. Polyaniline-invertase-gold nanoparticles modified gold electrode for sucrose detection. Indones. J. Chem. 2015, 15, 226–233. [Google Scholar] [CrossRef] [Green Version]
  60. Chen, W.C.; Wen, T.C.; Gopalan, A. Negative capacitance for polyaniline: An analysis via electrochemical impedance spectroscopy. Synth. Met. 2002, 128, 179–189. [Google Scholar] [CrossRef]
  61. Huang, W.S.; MacDiarmid, A.G. Optical properties of polyaniline. Polymer 1993, 34, 1833–1845. [Google Scholar] [CrossRef]
  62. Yin, M.; Liu, S. Preparation of ZnO hollow spheres with different surface roughness and their enhanced gas sensing property. Sens. Actuators B Chem. 2014, 197, 58–65. [Google Scholar] [CrossRef]
  63. Brožová, L.; Holler, P.; Kovářová, J.; Stejskal, J.; Trchová, M. The stability of polyaniline in strongly alkaline or acidic aqueous media. Polym. Degrad. Stab. 2008, 93, 592–600. [Google Scholar] [CrossRef]
  64. Rangel-Vazquez, N.-A.; Sánchez-López, C.; Felix, F.R. Spectroscopy analyses of polyurethane/polyaniline IPN using computational simulation (Amber, MM+ and PM3 method). Polímeros 2014, 24, 453–463. [Google Scholar] [CrossRef] [Green Version]
  65. Bhadra, S.; Singha, N.K.; Khastgir, D. Electrochemical synthesis of polyaniline and its comparison with chemically synthesized polyaniline. J. Appl. Polym. Sci. 2007, 104, 1900–1904. [Google Scholar] [CrossRef]
  66. Dhivya, C.; Vandarkuzhali, S.A.A.; Radha, N. Antimicrobial activities of nanostructured polyanilines doped with aromatic nitro compounds. Arab. J. Chem. 2019, 12, 3785–3798. [Google Scholar] [CrossRef] [Green Version]
  67. Kinyanjui, J.M.; Hanks, J.; Hatchett, D.W.; Smith, A.; Josowicz, M. Chemical and electrochemical synthesis of polyaniline/gold composites. J. Electrochem. Soc. 2004, 151, D113–D120. [Google Scholar] [CrossRef]
  68. Travers, J.P.; Nechtschein, M. Water effects in polyaniline: A new conduction process. Synth. Met. 1987, 21, 135–141. [Google Scholar] [CrossRef]
  69. Cavallo, P.; Acevedo, D.F.; Fuertes, M.C.; Soler-Illia, G.J.A.A.; Barbero, C.A. Understanding the sensing mechanism of polyaniline resistive sensors. Effect of humidity on sensing of organic volatiles. Sens. Actuators B Chem. 2015, 210, 574–580. [Google Scholar] [CrossRef]
  70. He, L.; Jia, Y.; Meng, F.; Li, M.; Liu, J. Gas sensors for ammonia detection based on polyaniline-coated multi-wall carbon nanotubes. Mater. Sci. Eng. B Solid State Mater. Adv. Technol. 2009, 163, 76–81. [Google Scholar] [CrossRef]
  71. Fan, G.; Chen, D.; Li, T.; Yi, S.; Ji, H.; Wang, Y.; Zhang, Z.; Shao, G.; Fan, B.; Wang, H.; et al. Enhanced room-temperature ammonia-sensing properties of polyaniline-modified WO3 nanoplates derived via ultrasonic spray process. Sens. Actuators B Chem. 2020, 127892. [Google Scholar] [CrossRef]
  72. Hibbard, T.; Crowley, K.; Killard, A.J. Direct measurement of ammonia in simulated human breath using an inkjet-printed polyaniline nanoparticle sensor. Anal. Chim. Acta 2013, 779, 56–63. [Google Scholar] [CrossRef] [PubMed]
  73. Chen, J.; Yang, J.; Yan, X.; Xue, Q. NH3 and HCl sensing characteristics of polyaniline nanofibers deposited on commercial ceramic substrates using interfacial polymerization. Synth. Met. 2010, 160, 2452–2458. [Google Scholar] [CrossRef]
Figure 1. Polyaniline (PANI)-based ammonia/humidity gas sensors: (a) interdigitated electrodes [8,9,21,30,36]; (b) film [40]; (c) pellet [38]; (d) two different metal electrodes [39]; (e) screen-printed two-electrode system [37].
Sensors 21 00169 g001
Figure 2. (a) Scheme of connection 1; (b) scheme of connection 2; (c) schematic view of measurement system for sensing.
Sensors 21 00169 g002
Figure 3. Voltammogram of aniline electropolymerisation via cyclic voltammetry (CV) on the surface of gold screen-printed electrode (Au-SPE) in HCl electrolyte.
Sensors 21 00169 g003
Figure 4. Au-SPE field-emission scanning electron microscopy (FE-SEM-LEI) images: (a) top view and (b) cross-section view; PANI-Au-SPE FE-SEM-SEI images: (c) top view and (d) cross-section.
Sensors 21 00169 g004
Figure 5. Three-dimensional (3D) mapping of surface area: (a) Au-SPE and (b) PANI-Au-SPE.
Sensors 21 00169 g005
Figure 6. Fourier-transform infrared (FTIR) spectrum of PANI-Au-SPE with magnified fingerprint (500–1500 cm−1) and double bond (1500–2000 cm−1) region.
Sensors 21 00169 g006
Figure 7. Reversibility of the PANI-Au-SPE sensor after exposing to increasing relative humidity (RH): (a) connection 1 and (b) connection 2. Both figures, (a,b), contain linear fitting for the adsorption of water between 30% and 90% RH.
Sensors 21 00169 g007
Figure 8. PANI-Au-SPE sensor stability at 70% of RH and room temperature (RT) for connection 1 (olive) and connection 2 (navy).
Sensors 21 00169 g008
Figure 9. (a) Comparison between connection 1 (olive) and connection 2 (navy) of PANI-Au-SPE sensor response to 500 ppb NH3 and (b) the dynamics of PANI-Au-SPE-Au resistance change (olive) and NH3 concentration variation monitored by the PICARO analyser (red curve).
Sensors 21 00169 g009
Figure 10. Mechanism of deprotonation/protonation at the origin of the PANI’s sensitivity to ammonia gas. A, NH3 and NH4+ refer to the dopant, ammonia and ammonium cation, respectively.
Sensors 21 00169 g010
Figure 11. NH3 calibration: (a) PANI-Au-SPE sensor’s response after exposing to different concentrations of gas; (b) calibration curve obtained from the PANI-Au-SPE sensor’s response at maximum achieved gas concentration in sequential measurements and (c) calibration curve obtained from one cycle of measurements.
Sensors 21 00169 g011
Figure 12. (a) PANI-Au-SPE sensor’s response, NH3 concentration, and RH vs. time—simulation of real-time measurement and (b) comparison of PANI-Au-SPE sensor’s responses obtained from real-time measurement with the calibration curve.
Sensors 21 00169 g012
Table 1. Metrological parameters for the NH3 gas sensors based on PANI at RT.
MaterialPANI SynthesisDetection Limit 1 [ppb]Quantification Limit 2 [ppb]Sensitivity [% ppm−1]Response Time [min]
PU-PANI (CSA) [8]Chemical/200.85 at 1 ppm
PBuA-PANI (HCl) [8]Chemical/250102.5 at 1 ppm
PVDF-PANI (DBSA) [8]Chemical/100172.5 at 1 ppm
WO3@PANI [71]Chemical3500/4.2 for >0.25 ppm
PANI (H2SO4) [30]Chemical7/153 at 50 ppm
PANI-MWCNT (HCl) [70]Chemical/200/1.3 at 12 ppm
PANI (DBSA) 3 [72]Chemical/407900/
PANI (HCl) [73]Chemical/1000//
PANI (HCl) [this work]Electrochemical233212.3 [32–200 ppb] & 4.27 [200–1000 ppb]5.2 at 1 ppm
1 Theoretical detection limit. 2 Lowest measured concentration. 3 Results were only reported as an evolution of relative impedance and not the relative resistance.
Publisher’s Note: MDPI stays neutral with regard to jurisdictional claims in published maps and institutional affiliations.

