1. Introduction
Electronic textiles, also known as E-textiles or smart garments, could be a solution for monitoring daily activities due to their small size, light weight, and simple operation [
1,
2]. As a result, they can comfortably be worn by participants without obstructing their daily activities.
Inductive textile sensors are made from highly conductive materials (e.g., copper wire, stainless steel yarn, conductive threads). These sensors base their working principle on their capacity to create a magnetic field when an electrical current is passed through loop(s) of the conductive threads [
3]. The sensor’s output is modified when the shape of the magnetic field changes. These changes are the result of deforming the sensor due to an externally applied force. Fava et al. [
4] reported that the inductance and the sensitivity (Δ Inductance/Δ strain) of the sensor can be increased by augmenting the number of coils and/or narrowing the width and space between the coils [
4]. Typically, inductive sensors are manufactured with a circular coil shape, however, they are not limited to only this shape [
5]. The versatility of the inductive textile sensors enables the ability to embed or affixed these sensors to different surfaces. Inductive sensors are regularly used in antennas [
6,
7] and plethysmographs [
5,
6,
8].
Yoo [
9] and Coosemans et al. [
10] used inductive-type sensors for wireless-powered applications. Coosemans et al. [
10] created a platform using these types of sensors to transmit ECG measurement data. To measure the heartbeat, Koo et al. [
11] developed a magnetic-induced conductivity sensing module shaped in a coil configuration using nine strands of silver-polyester hybrid yarn. Wijesiriwardana [
12] manufactured a knitted sensor made with Lycra and copper wire to measure strain and displacement, suggesting the possibility of expanding the sensor’s applications to respiratory measuring and motion and gesture capturing systems. This sensor was reported to be ideal for wearable devices given its unobtrusive behavior, small size, lightweight, comfort, and tightfitting properties. Wu et al. [
13] presented a wearable inductive plethysmography to monitor respiration during sleep. This inductive plethysmography showed high reliability and low production cost.
Commonly, monitoring E-textile devices are based on resistive sensors. However, resistive sensors present important disadvantages that limit their practicality, such as high hysteresis, non-linearity of their response, and a drift in their readings when a certain amount of stretch is held for a period of time [
2]. The aforementioned disadvantages can be overcome through the use of inductive textile sensors since these sensors do not present a drift in their output signal over time, which makes them a reliable monitoring system for an extended period of time. Additionally, inductive textile sensors’ output signals present minimal noise, almost linear behavior, almost no hysteresis, straightforward signal processing, and do not require specialized equipment or materials [
2,
14,
15]. Unfortunately, there is little information regarding the design and manufacture of the inductive textile sensors.
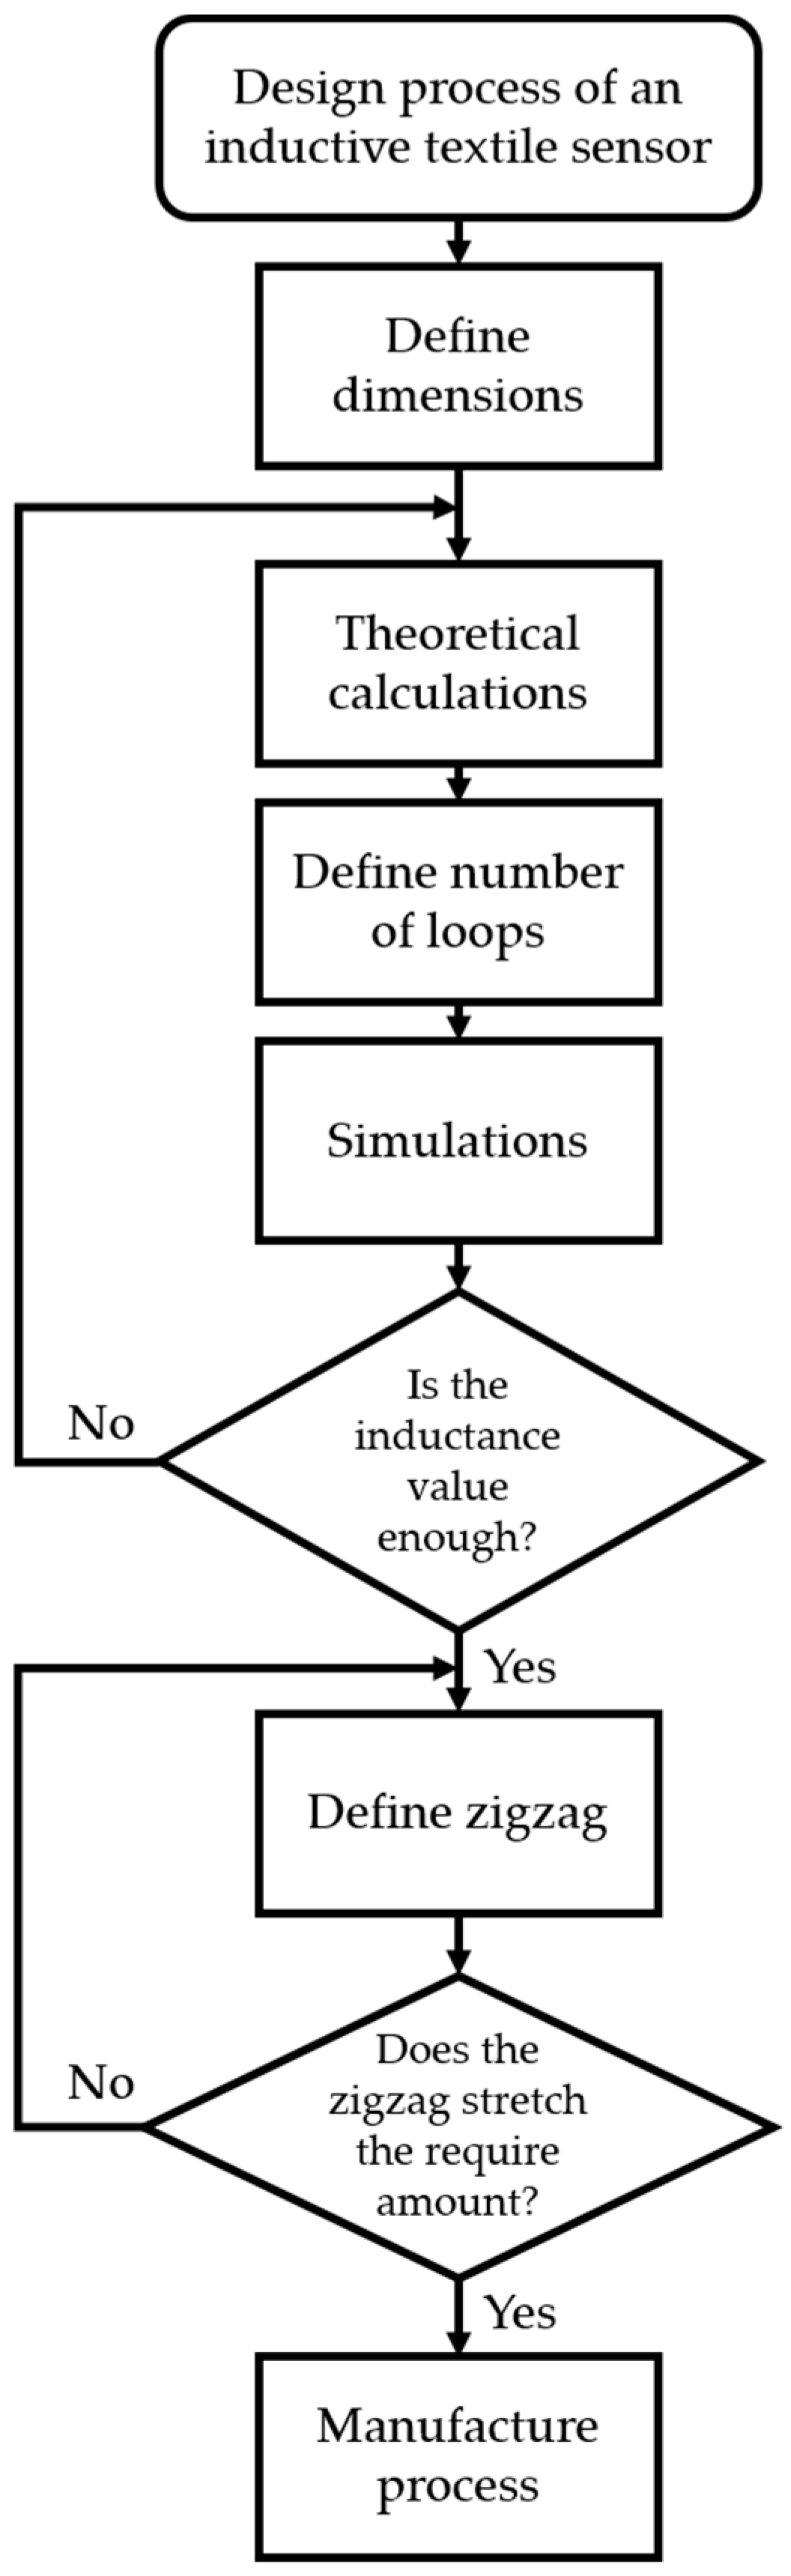
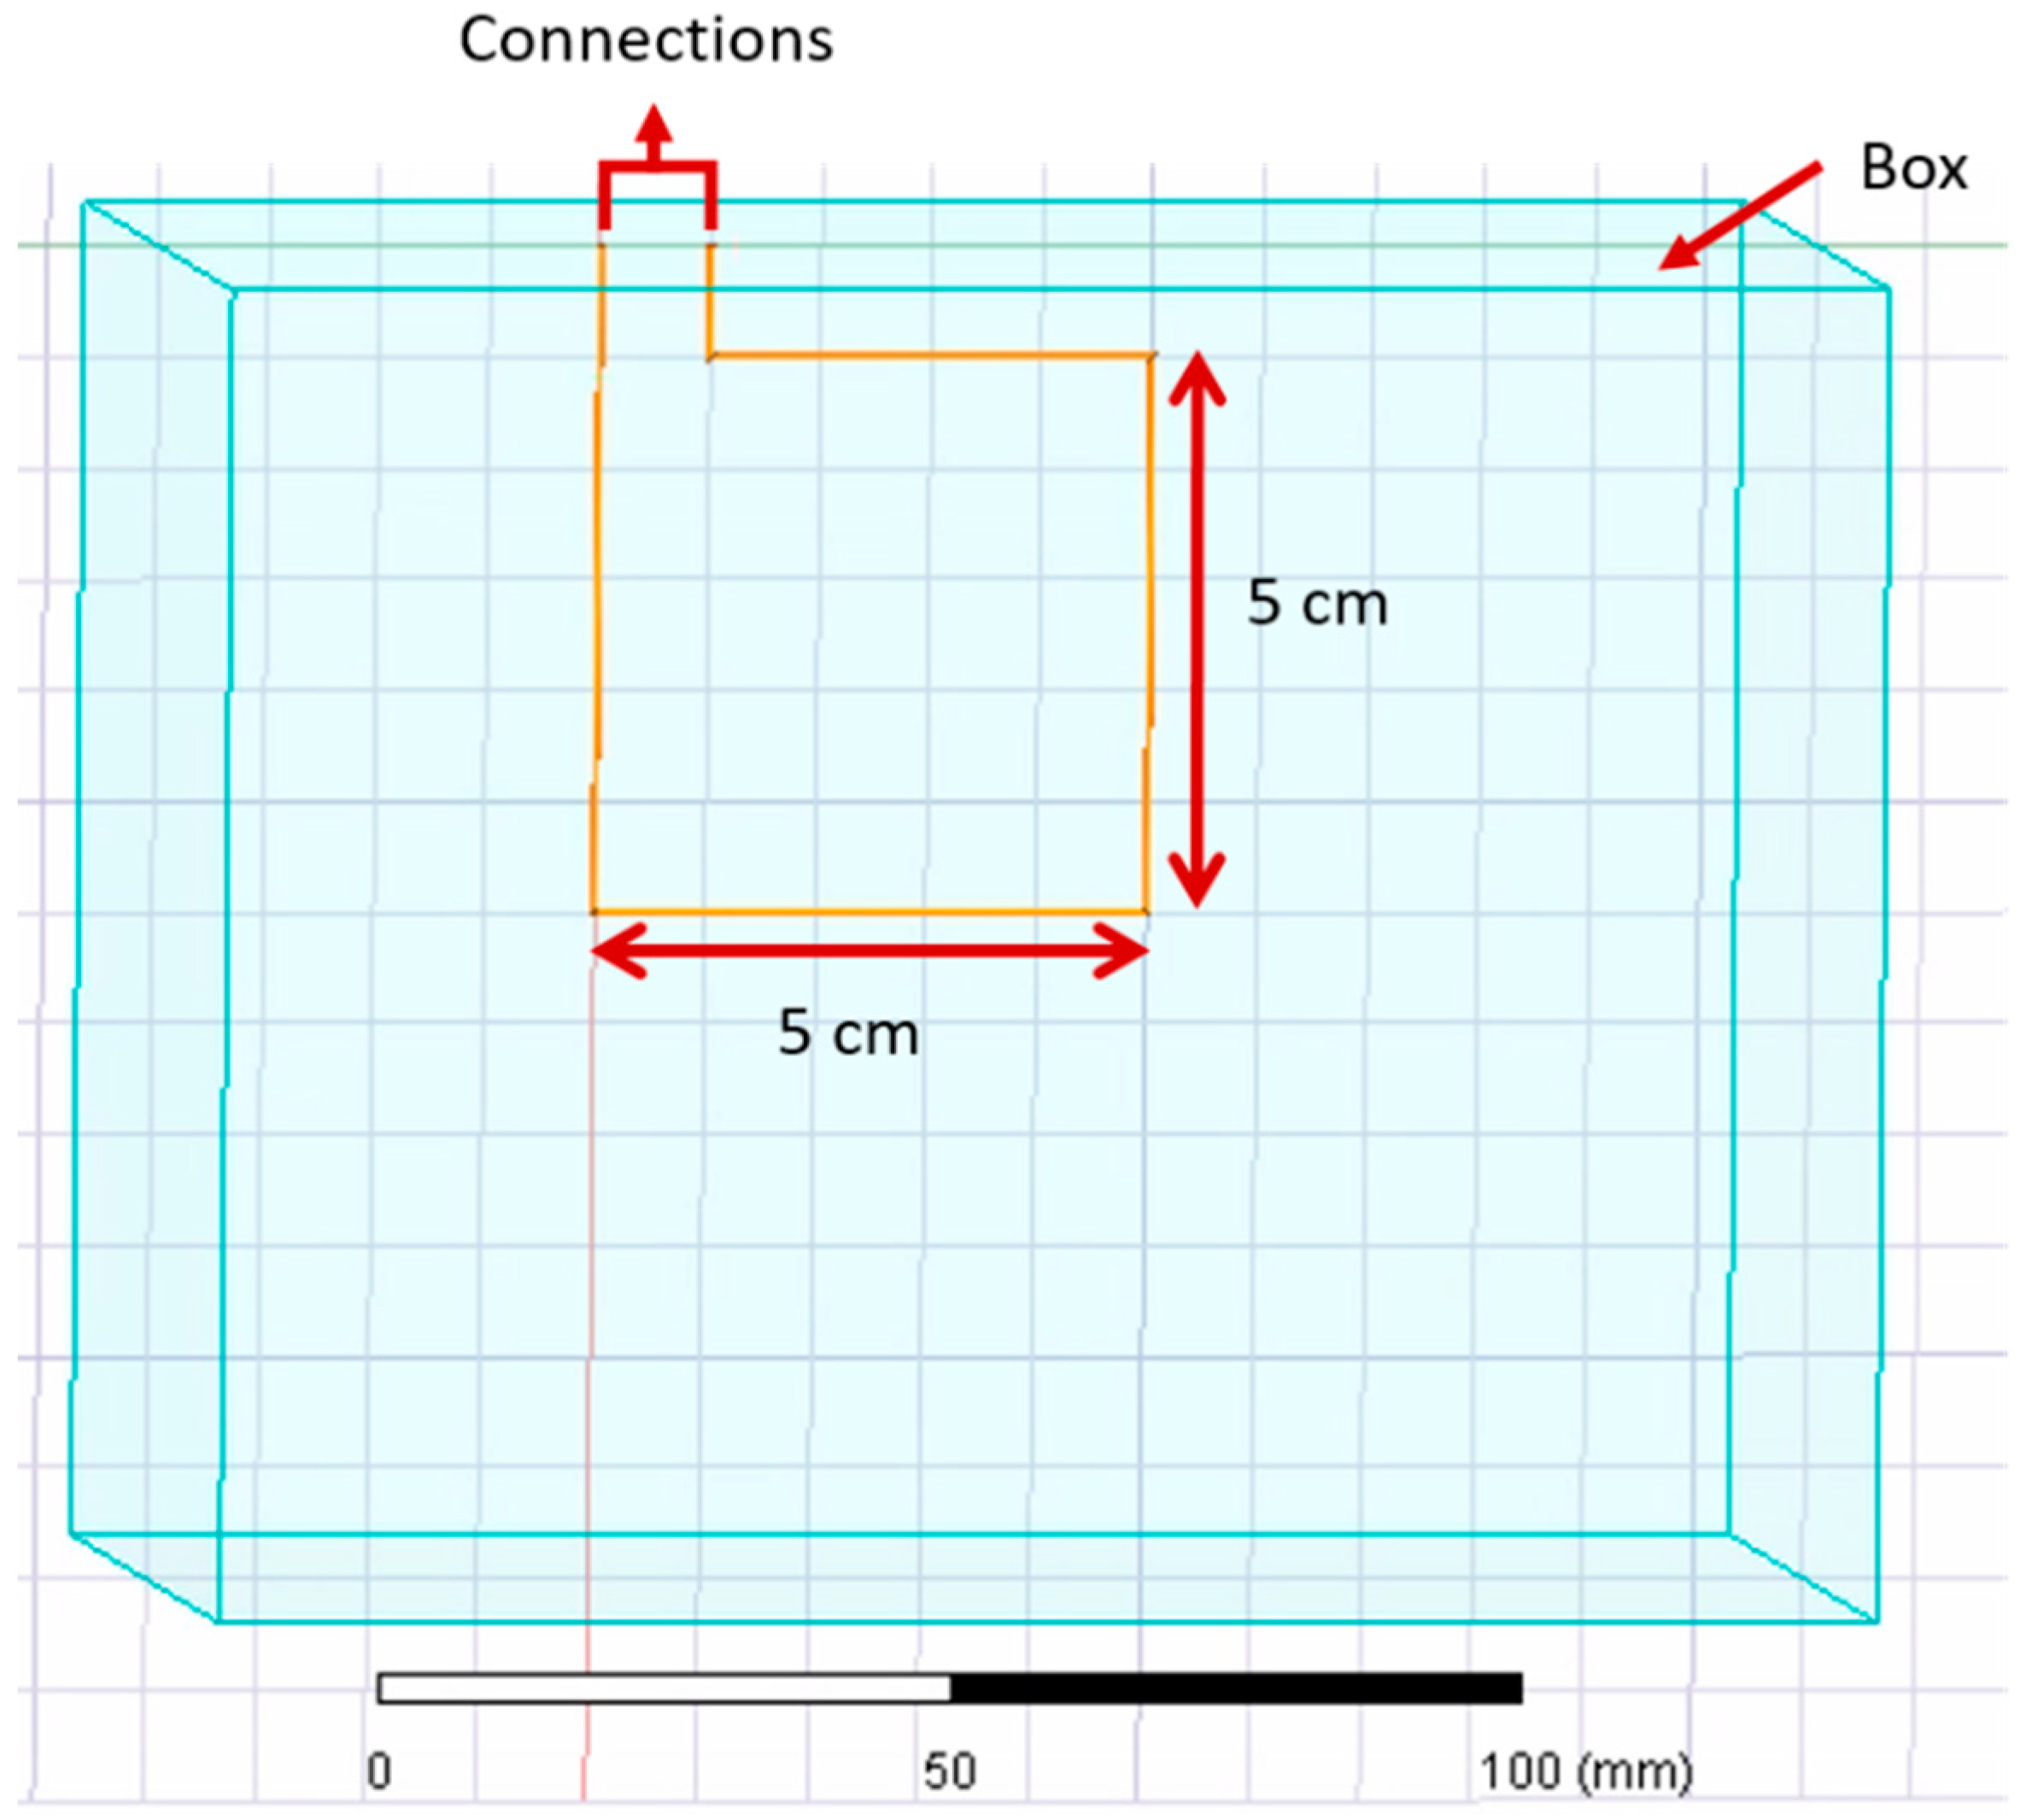
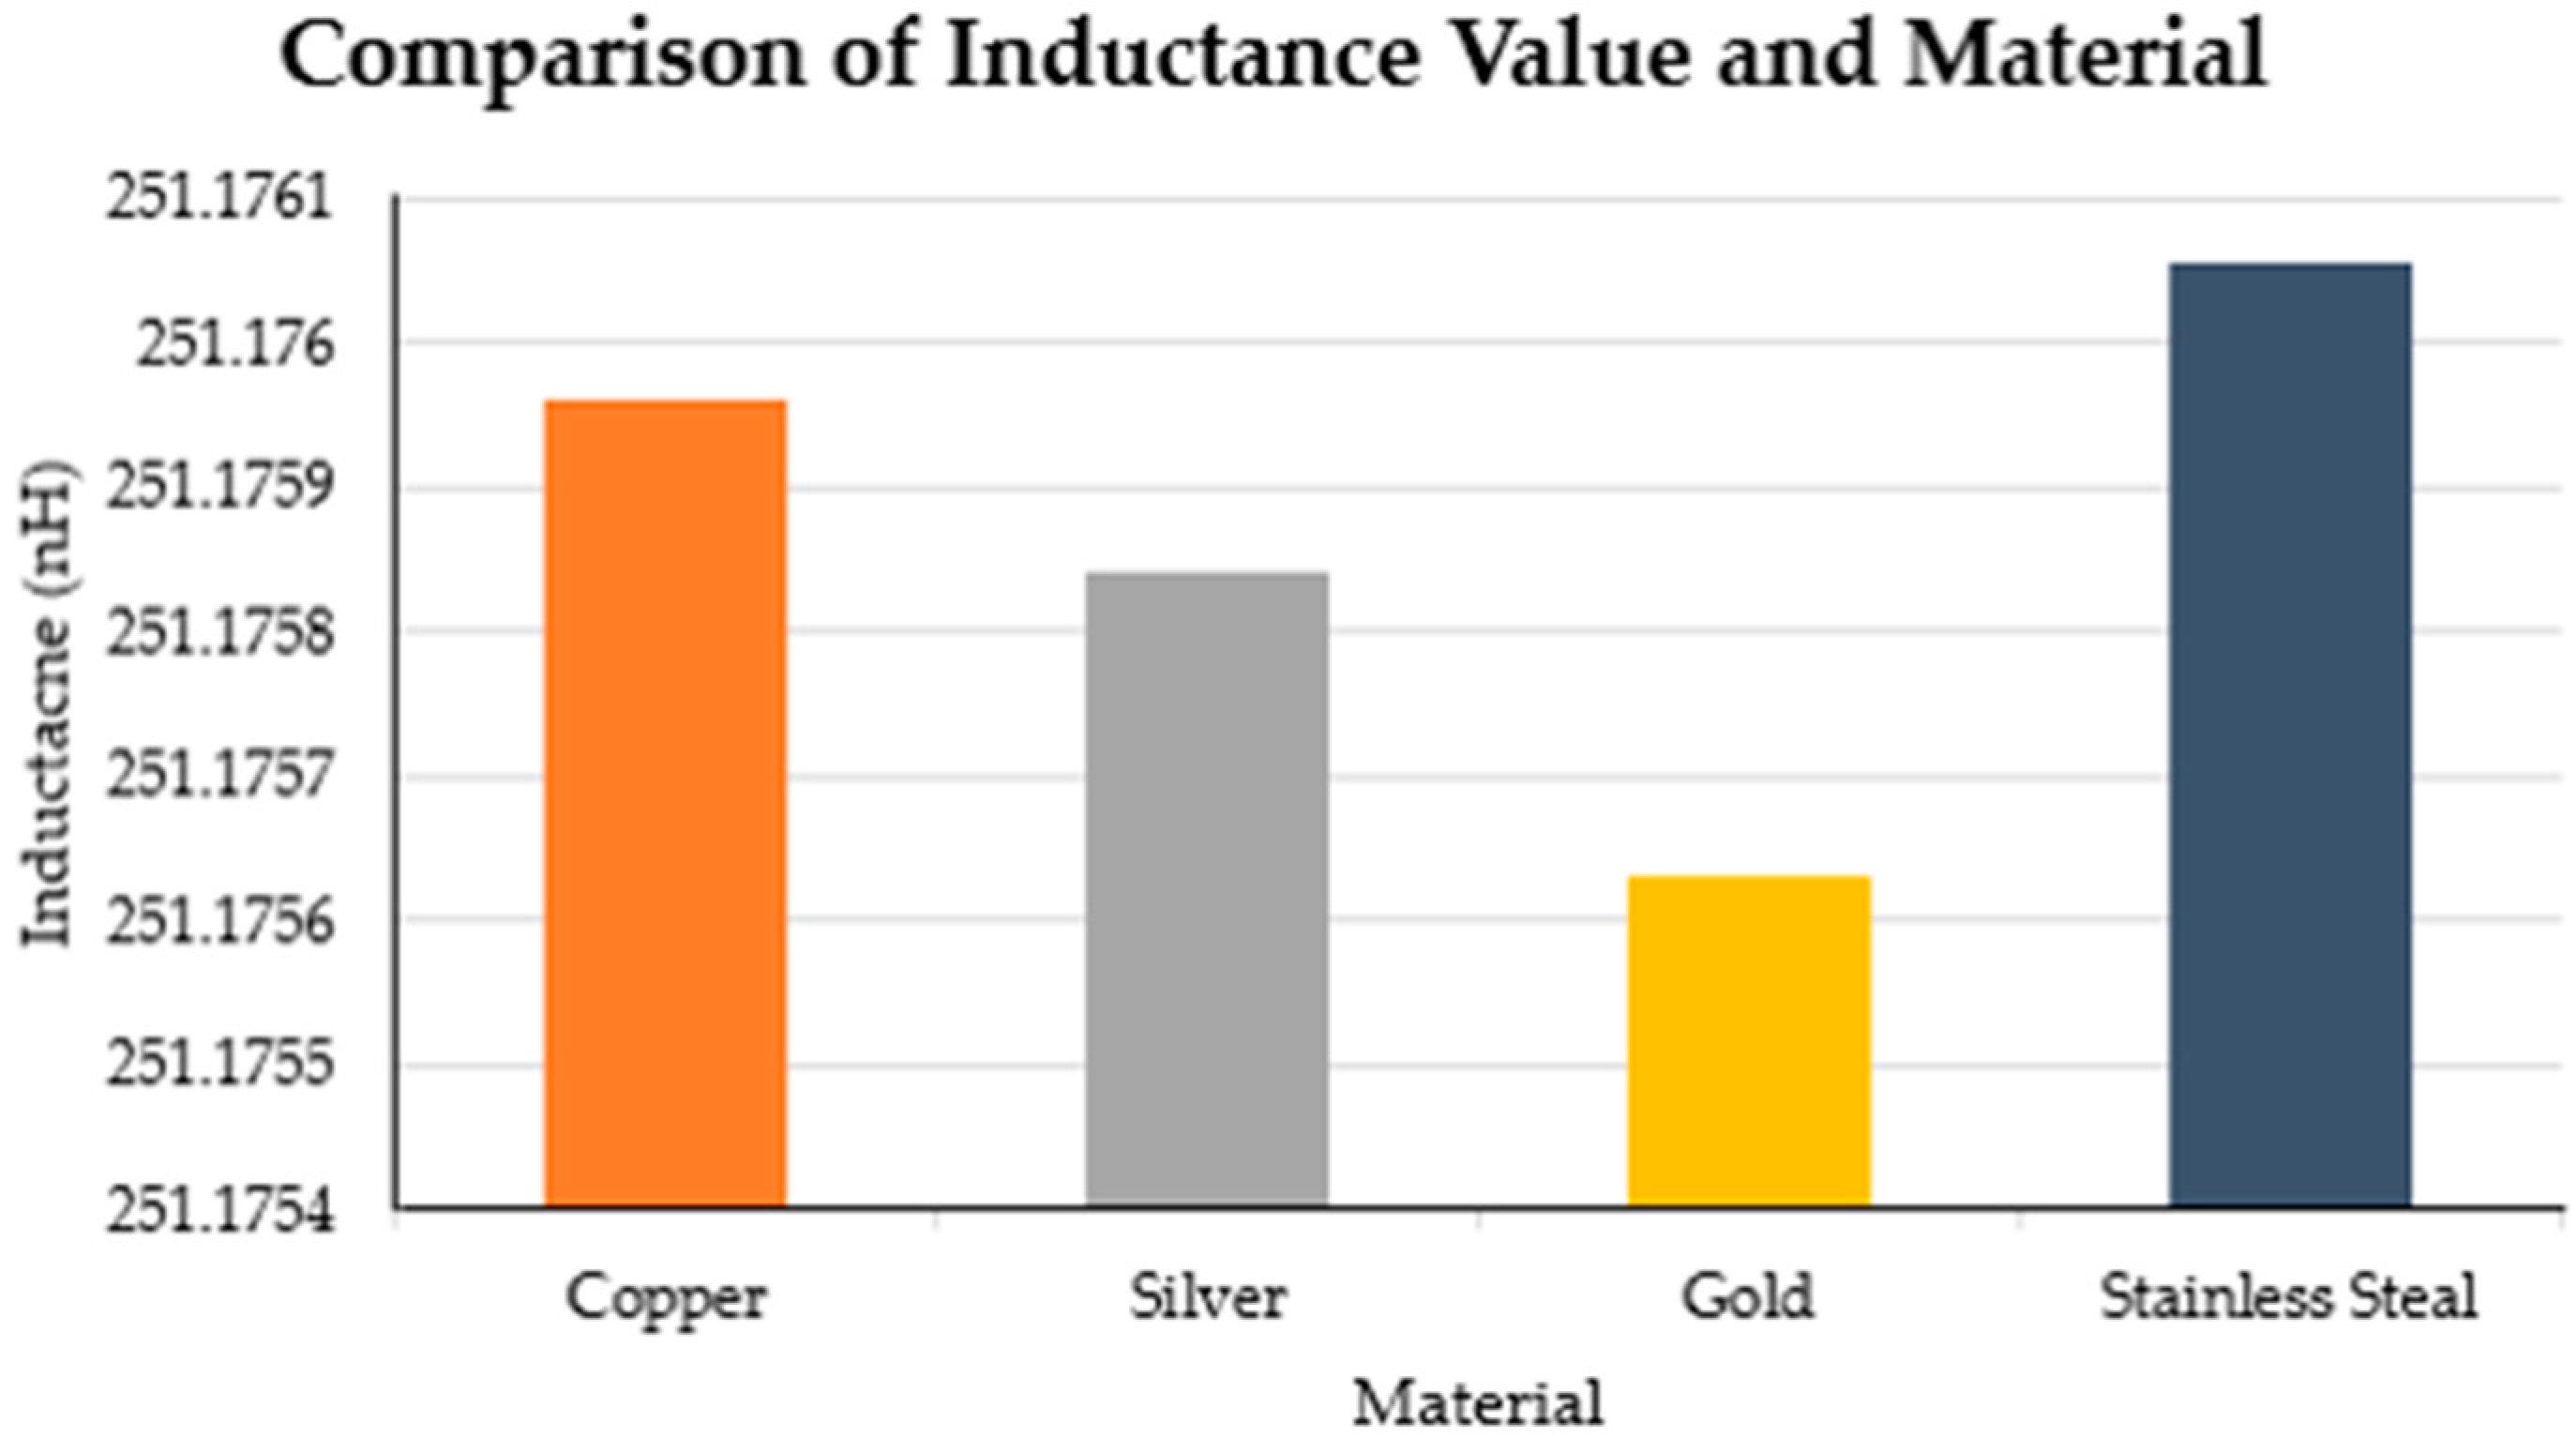
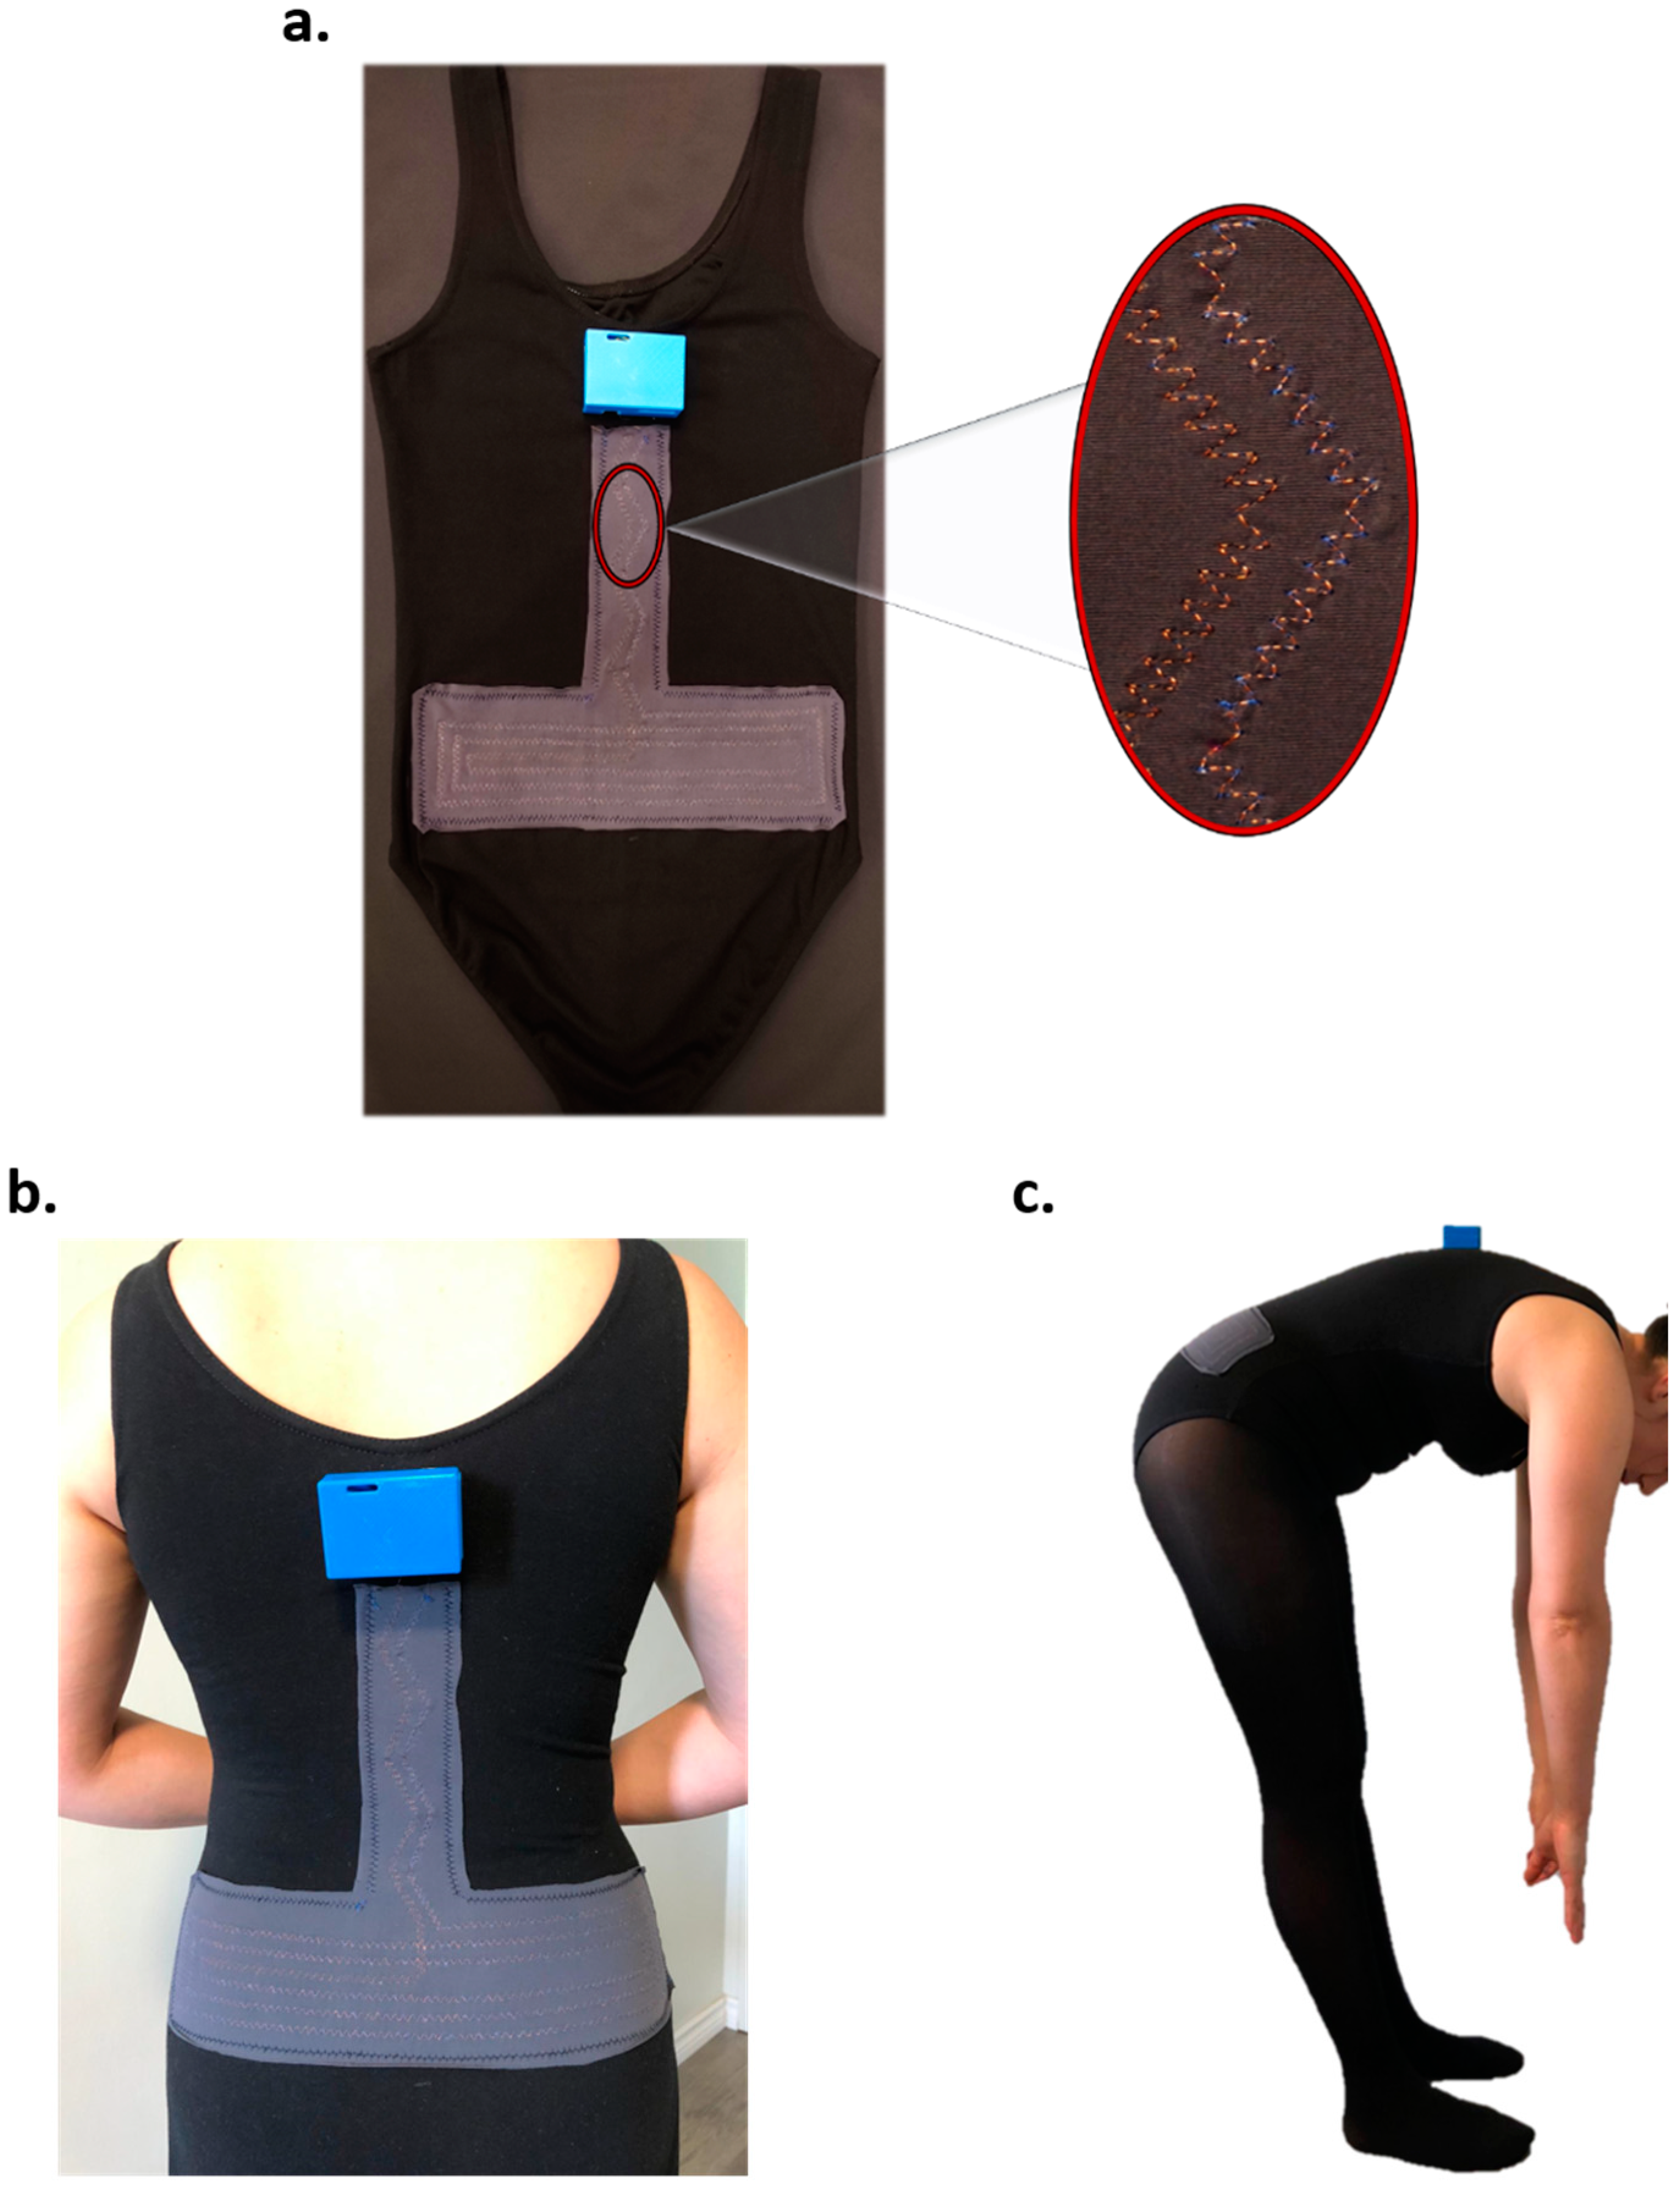
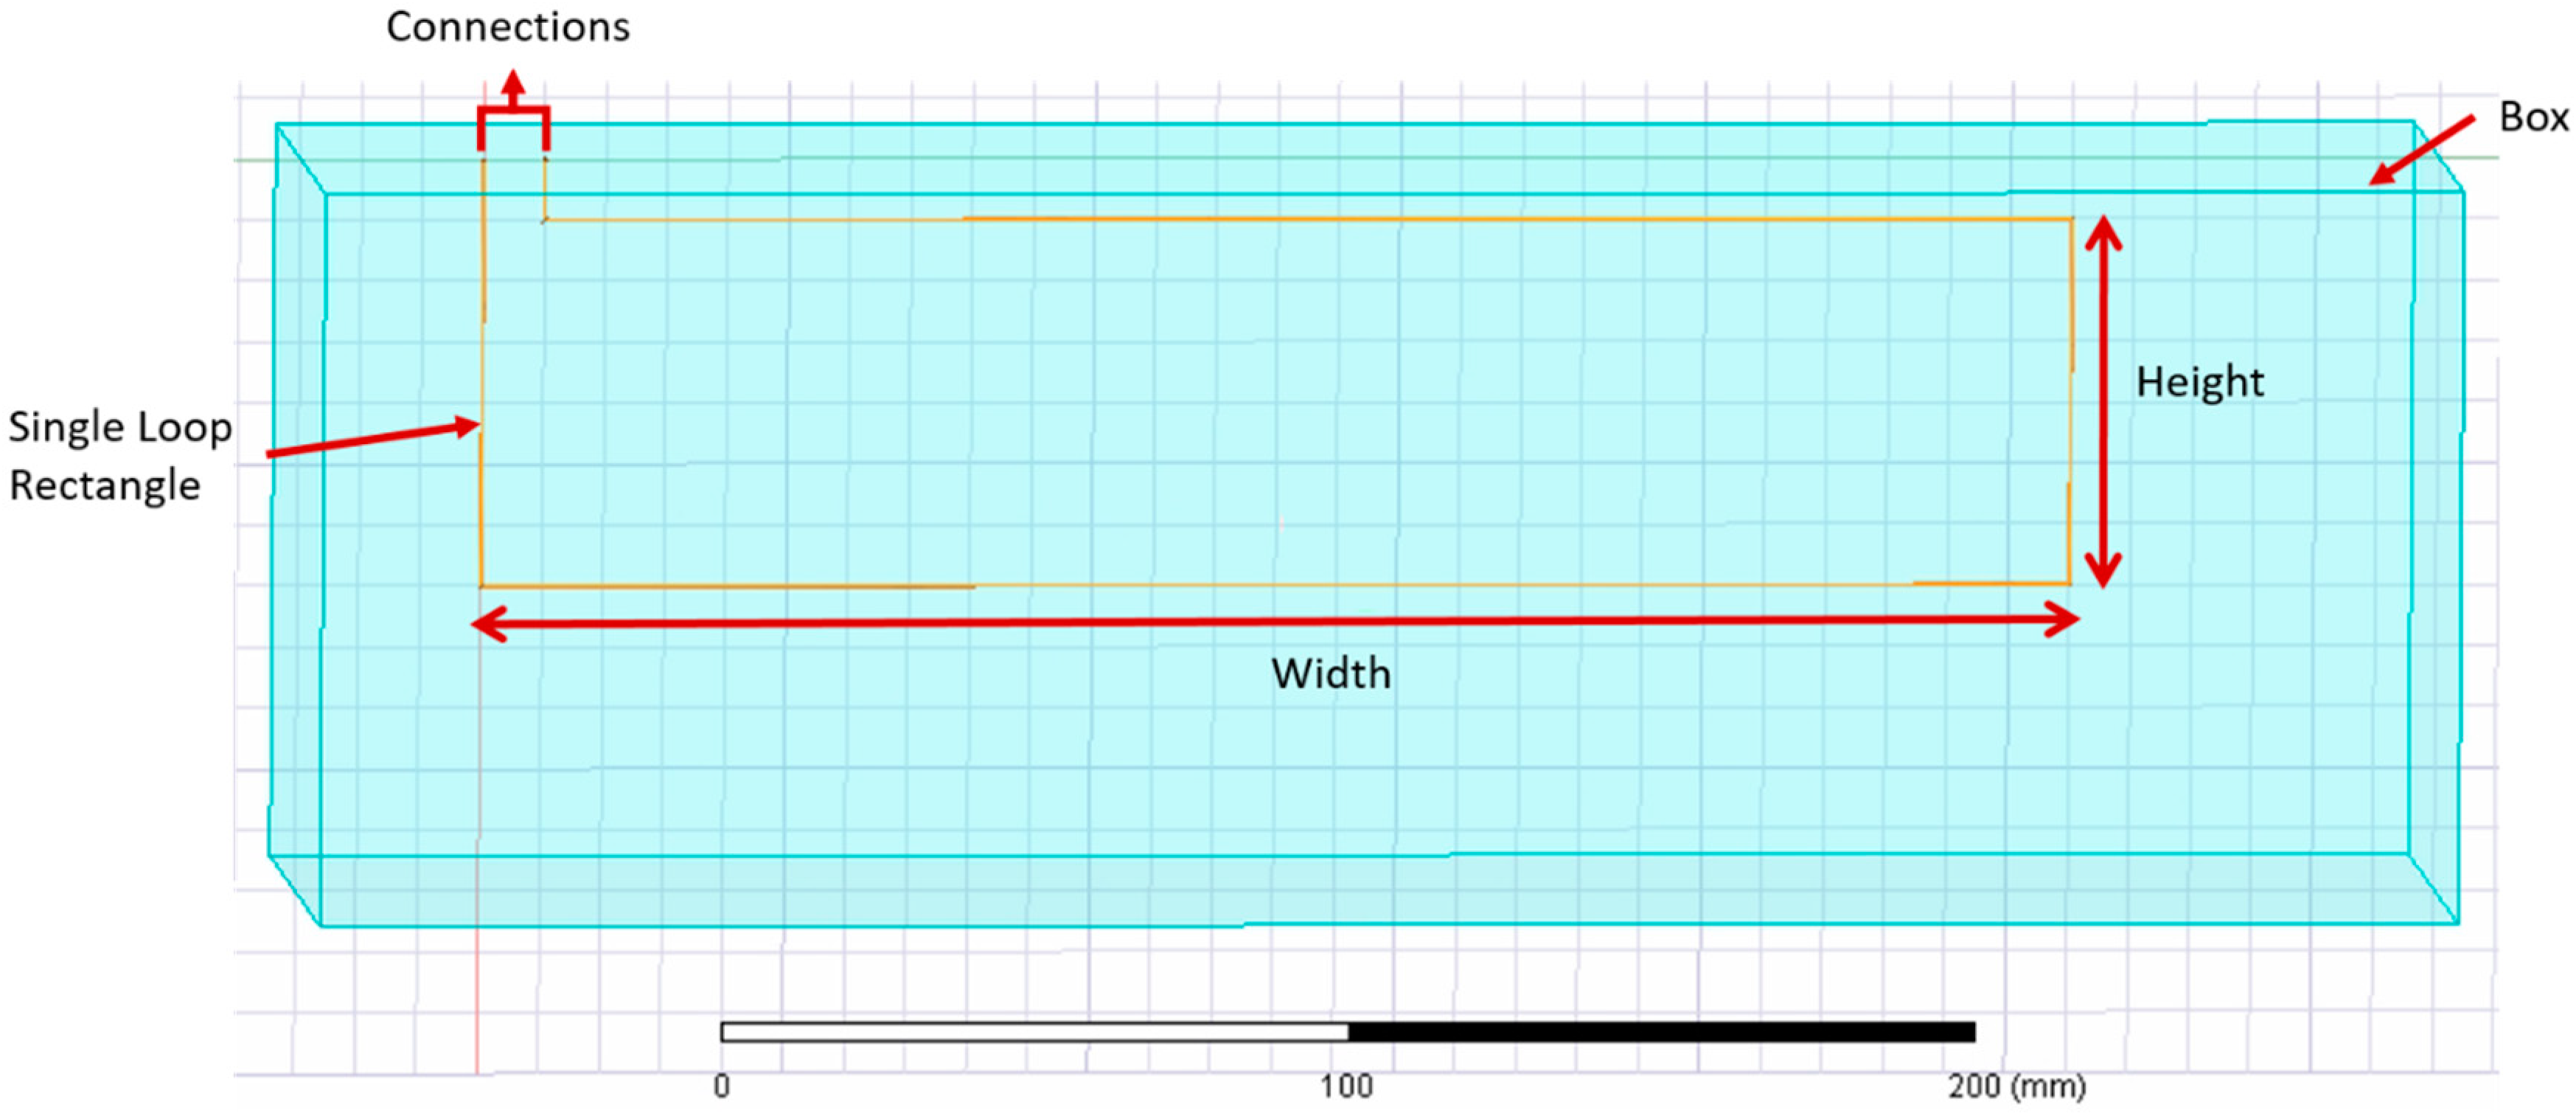
In this study, the process for designing an inductive strain textile sensor with a flat rectangular coil configuration is proposed. The inductance value behavior was studied based on the change of its dimensions and number of complete loops. A series of simulations were performed to validate the theoretical calculations and evaluate the inductance behavior when variables such as the material of the sensor and its surrounding was considered. Finally, the design process was applied to design and develop an inductive textile sensor to monitor the trunk forward bending [
3].
4. Discussion
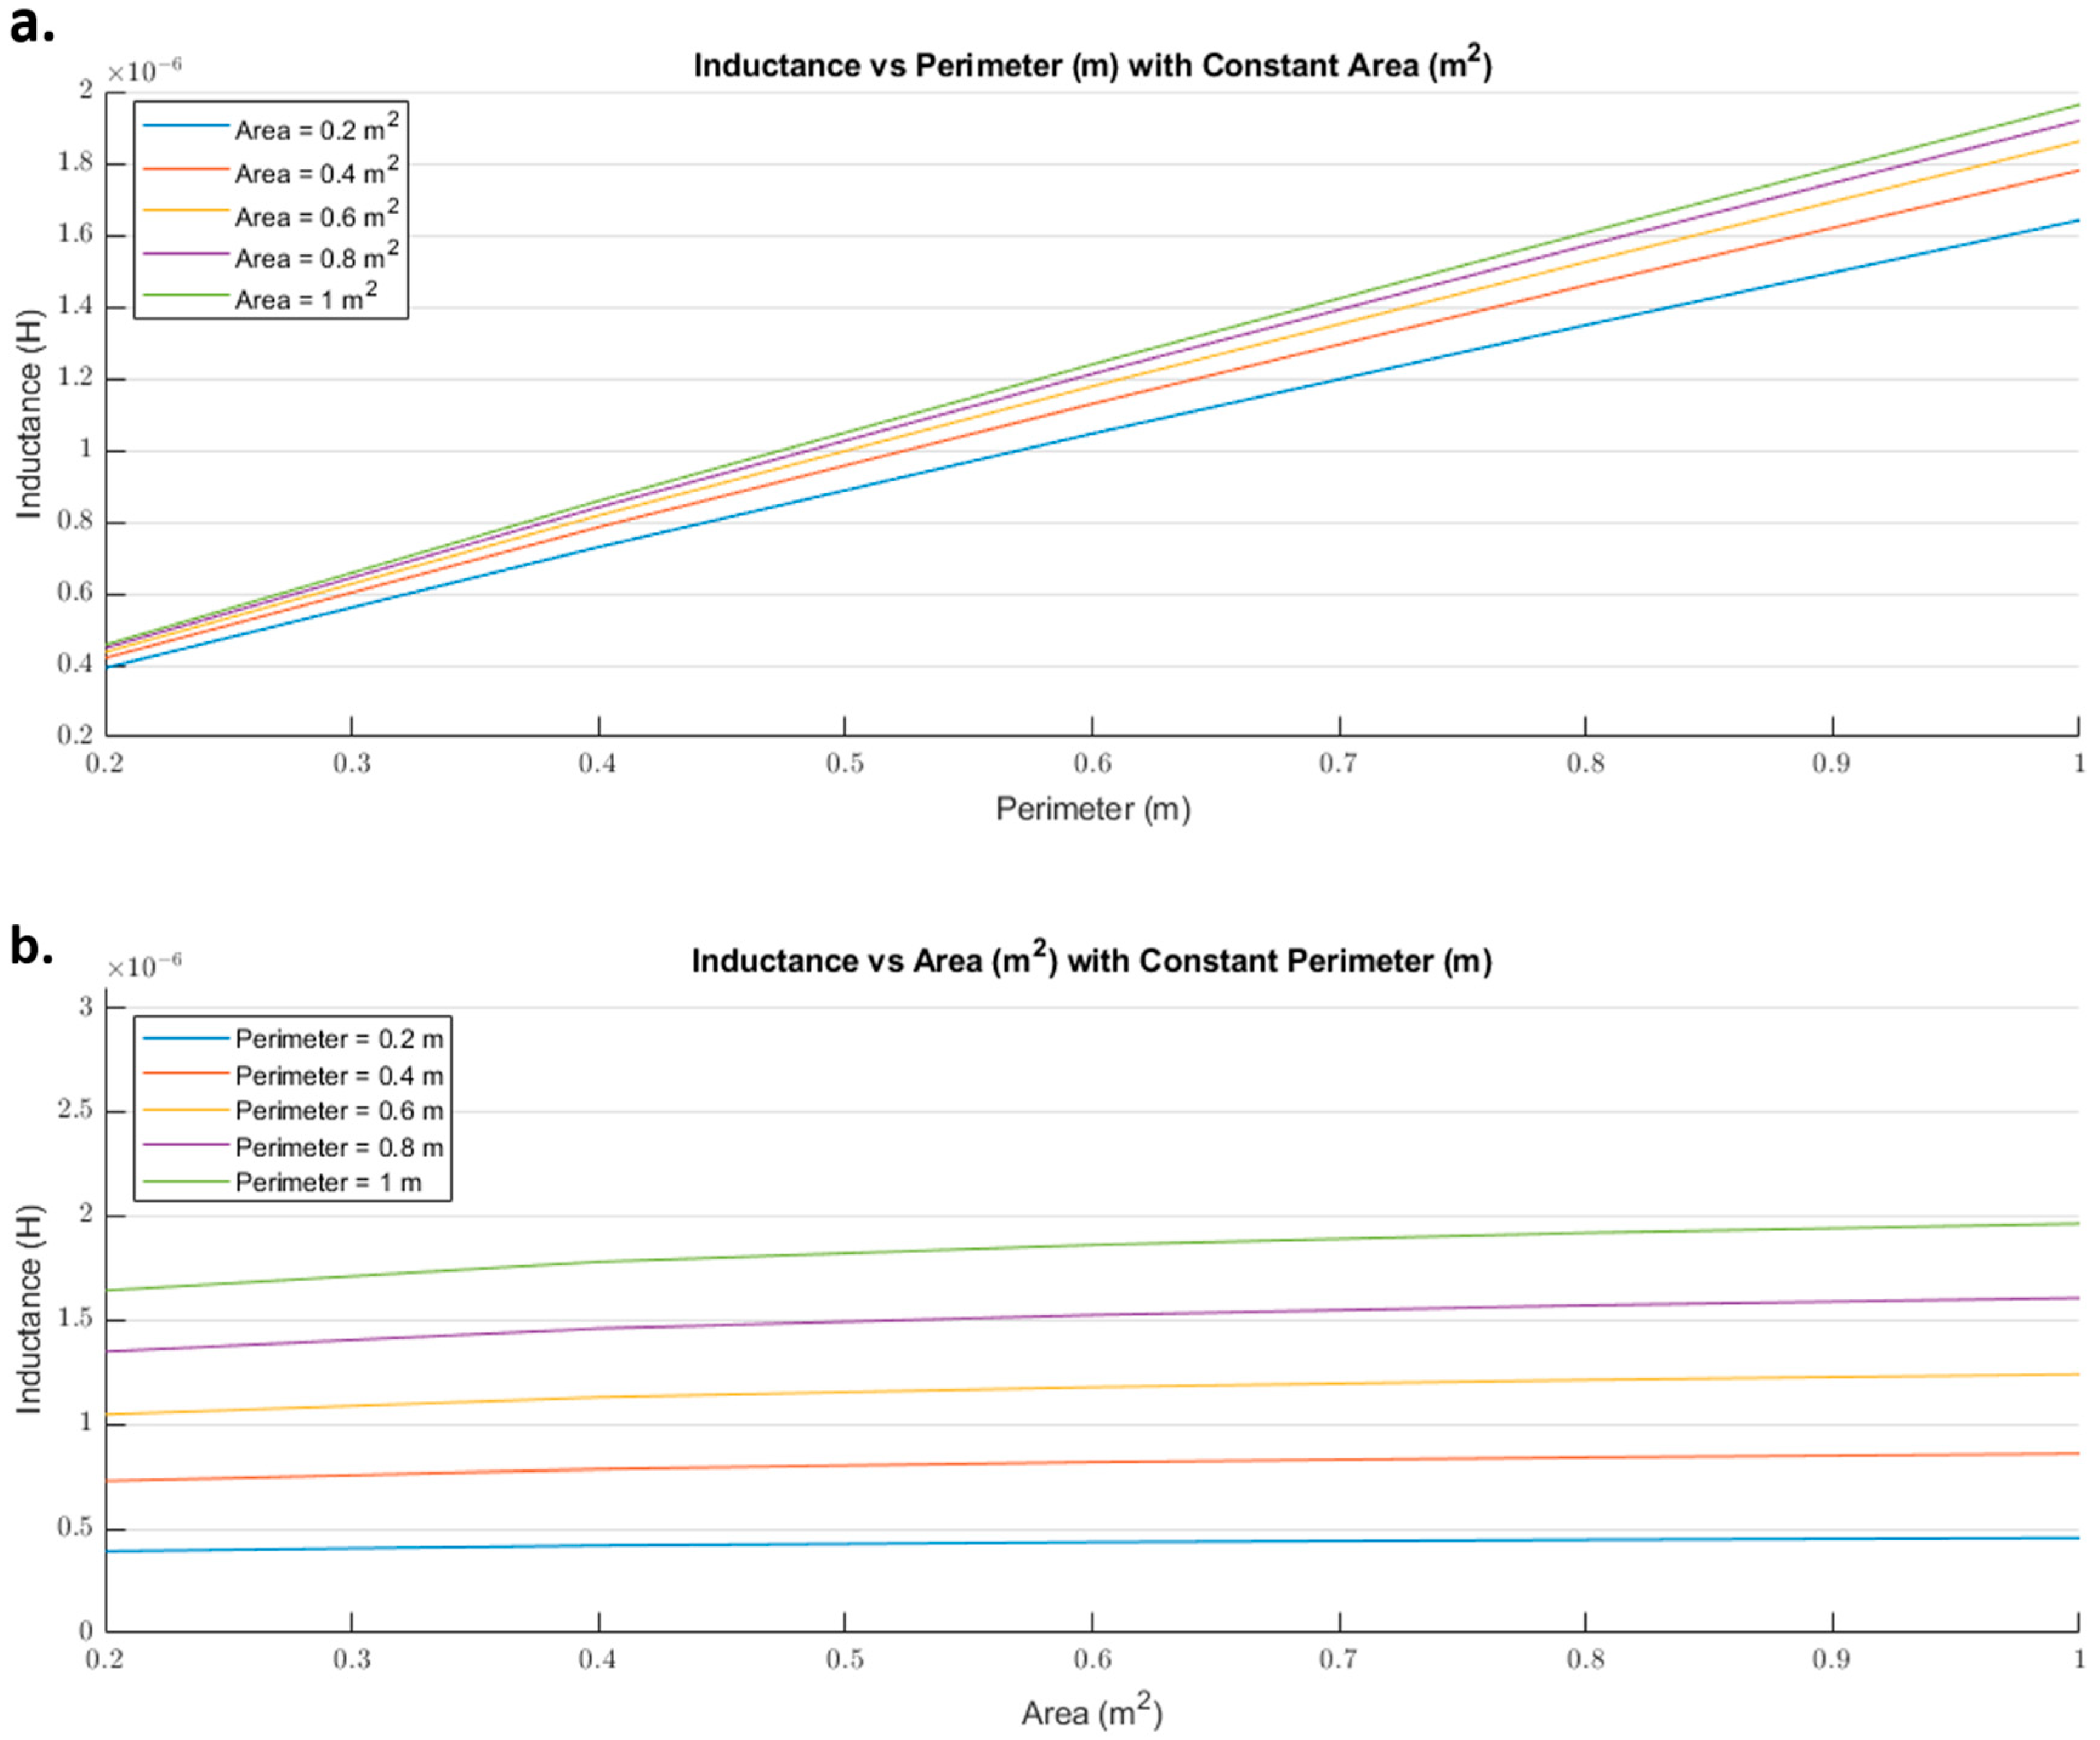
The inductance of a single loop rectangle was calculated using two different equations.
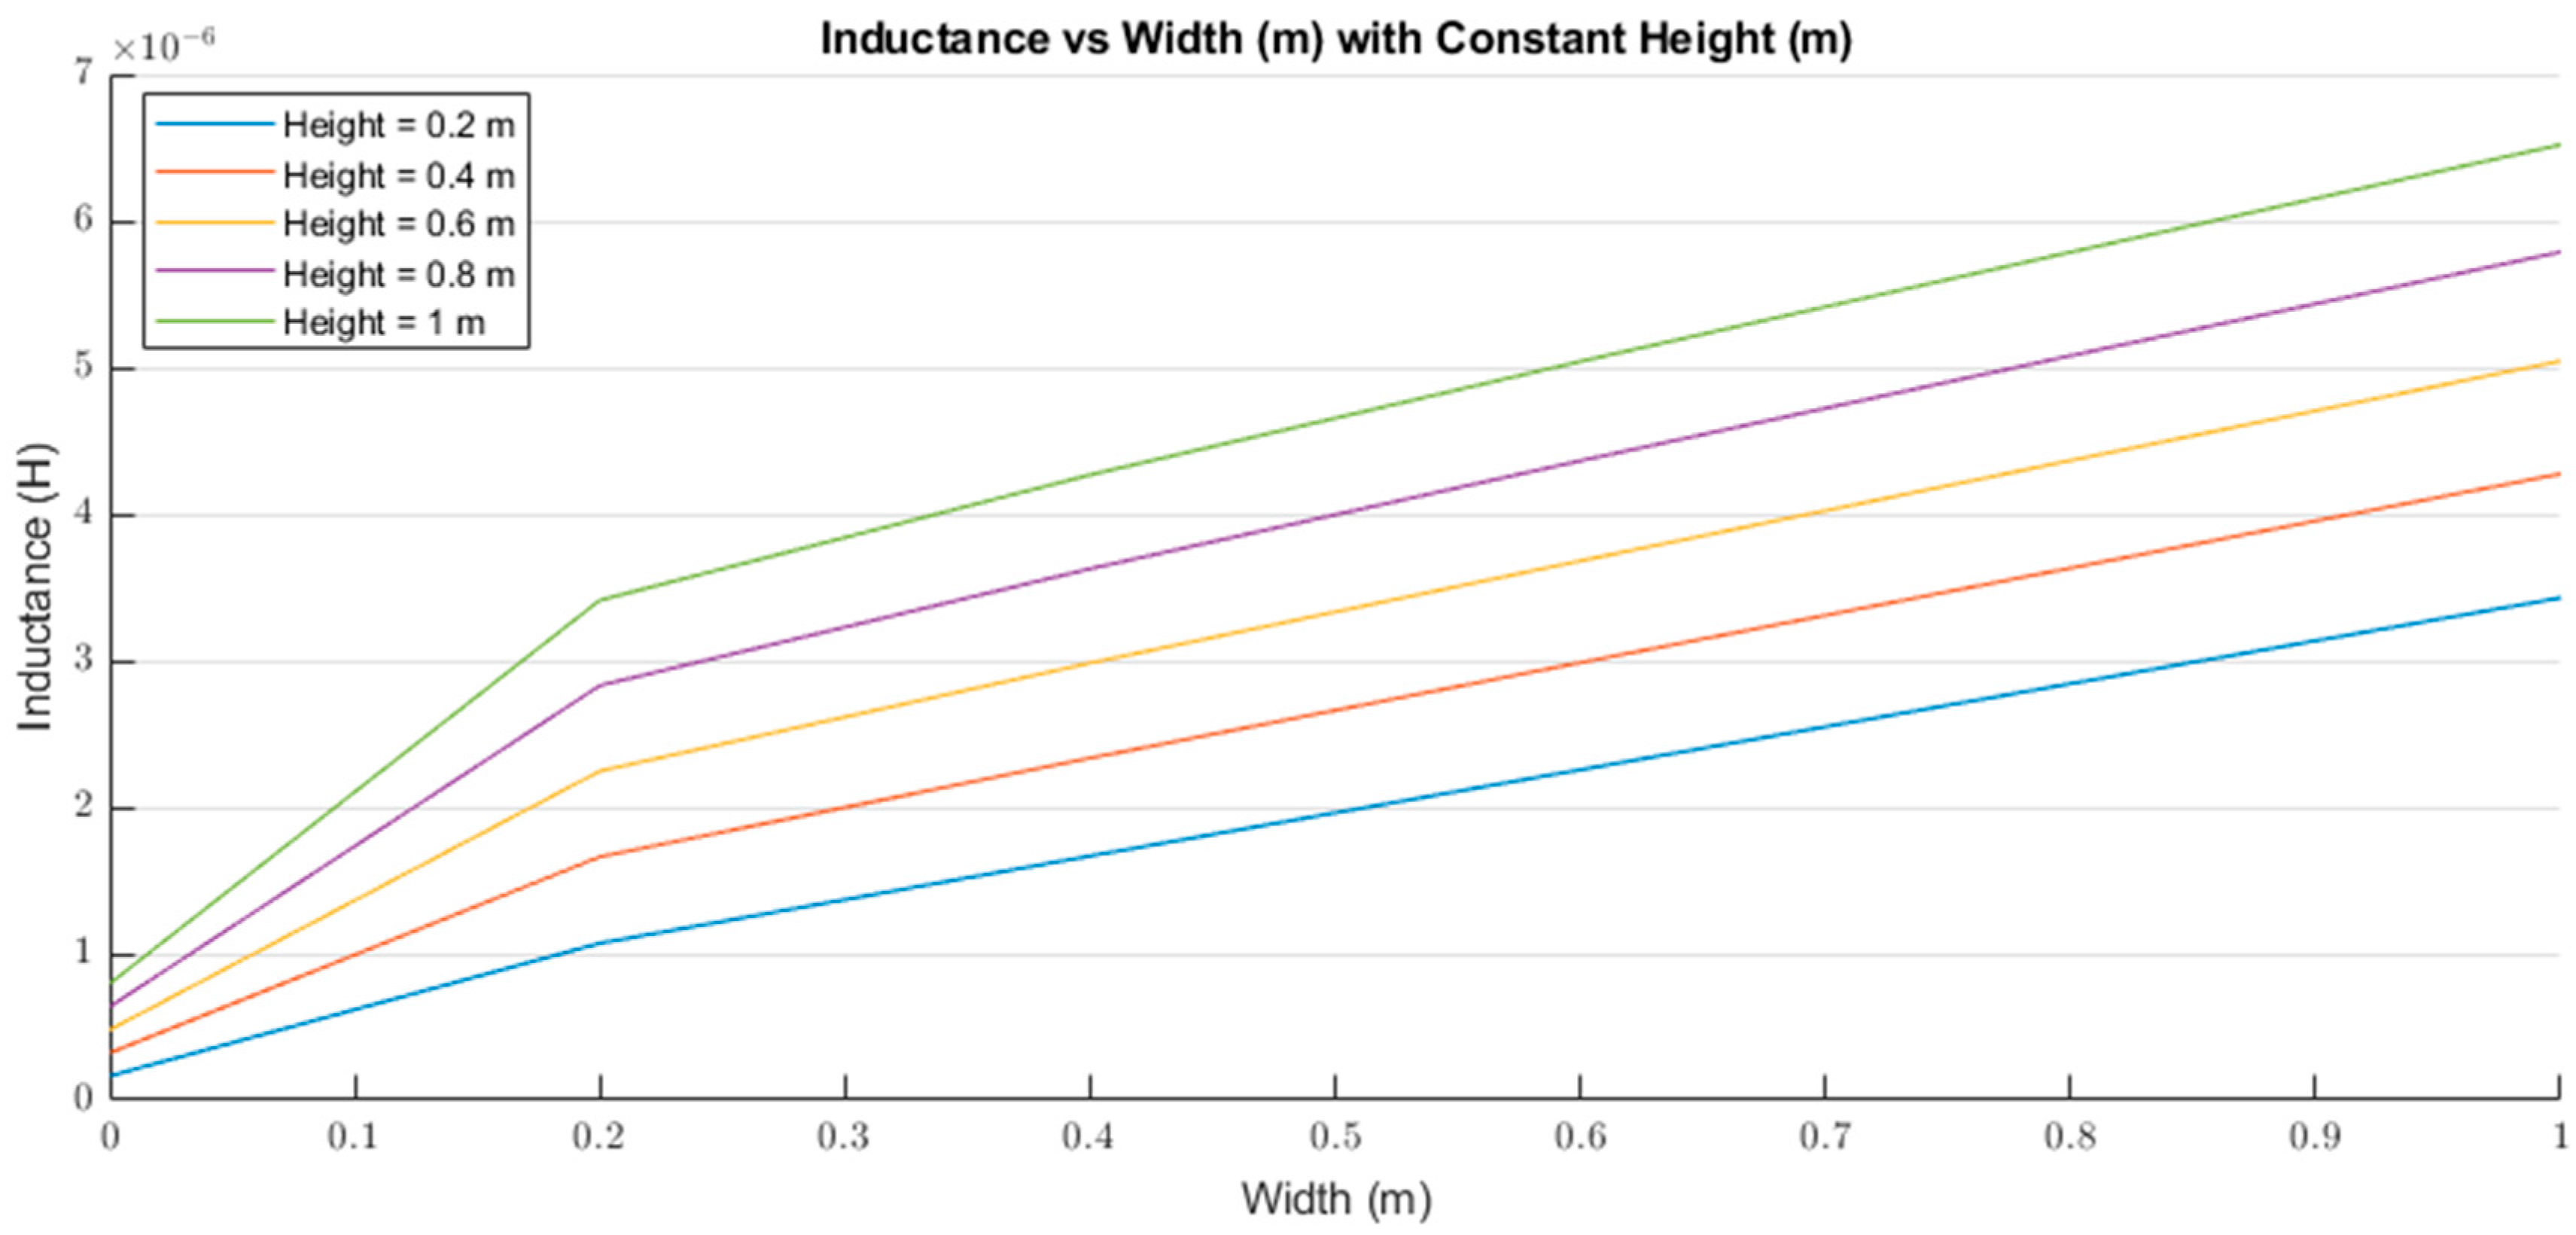
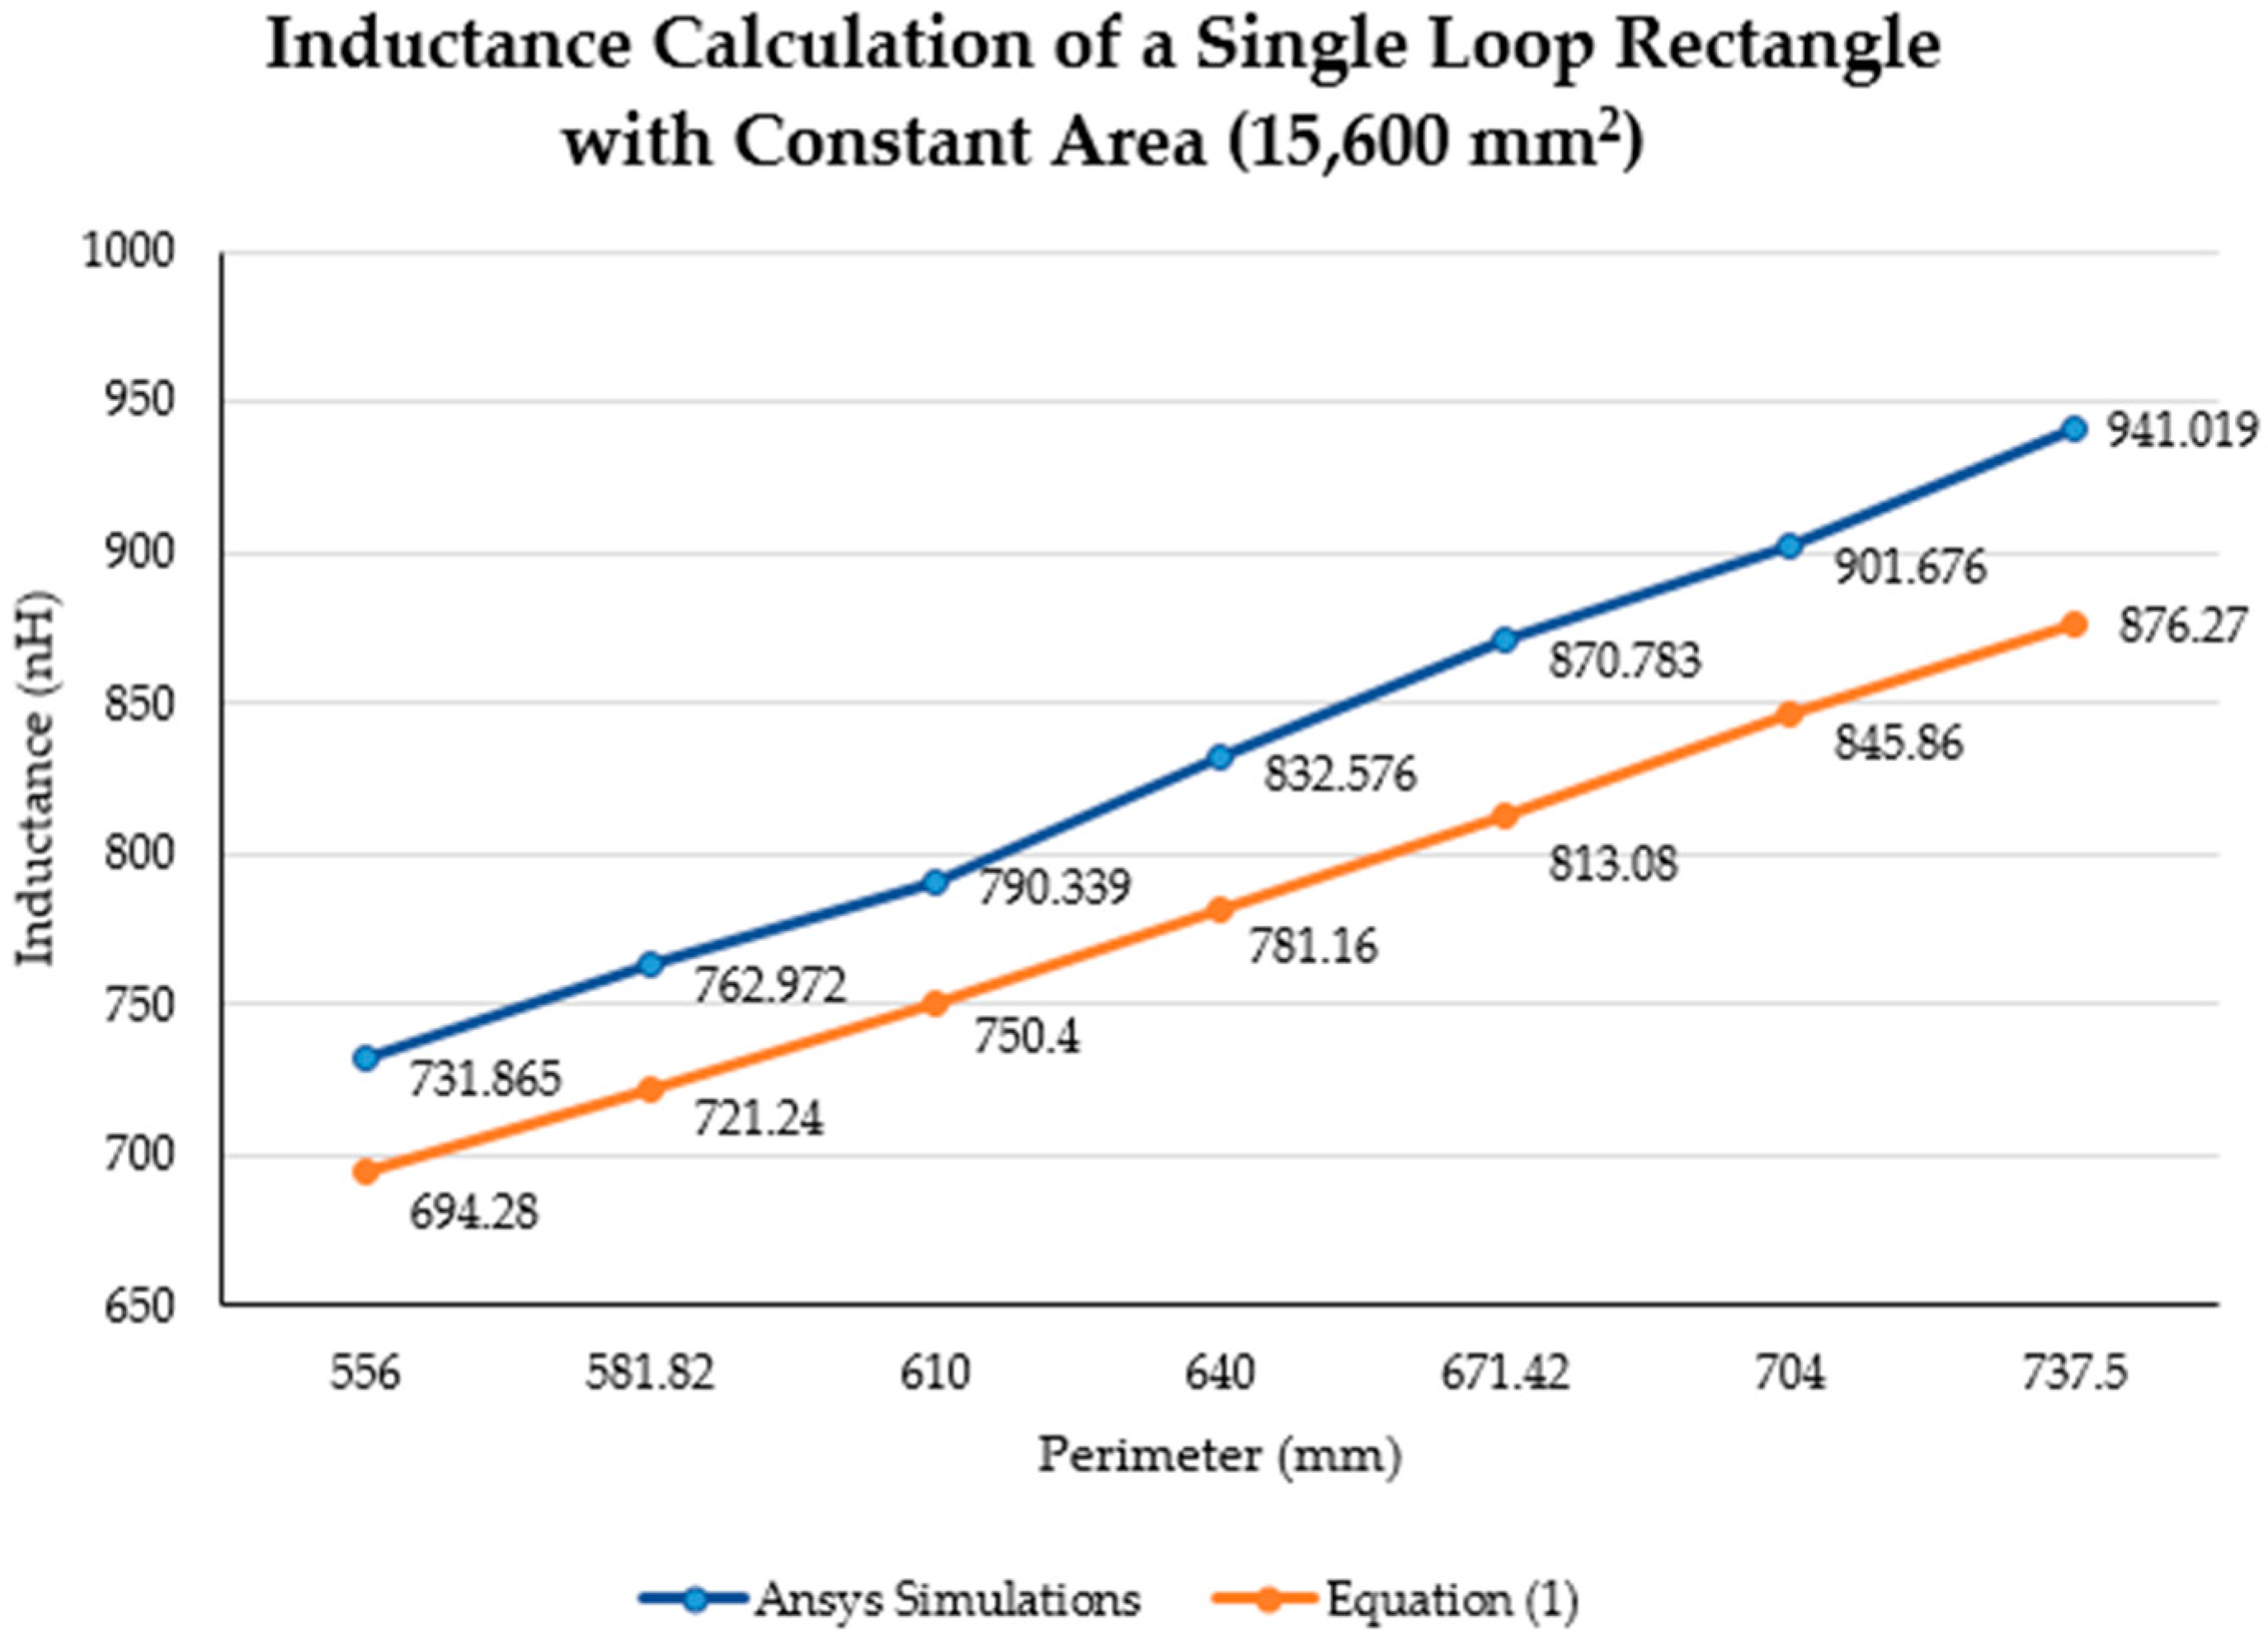
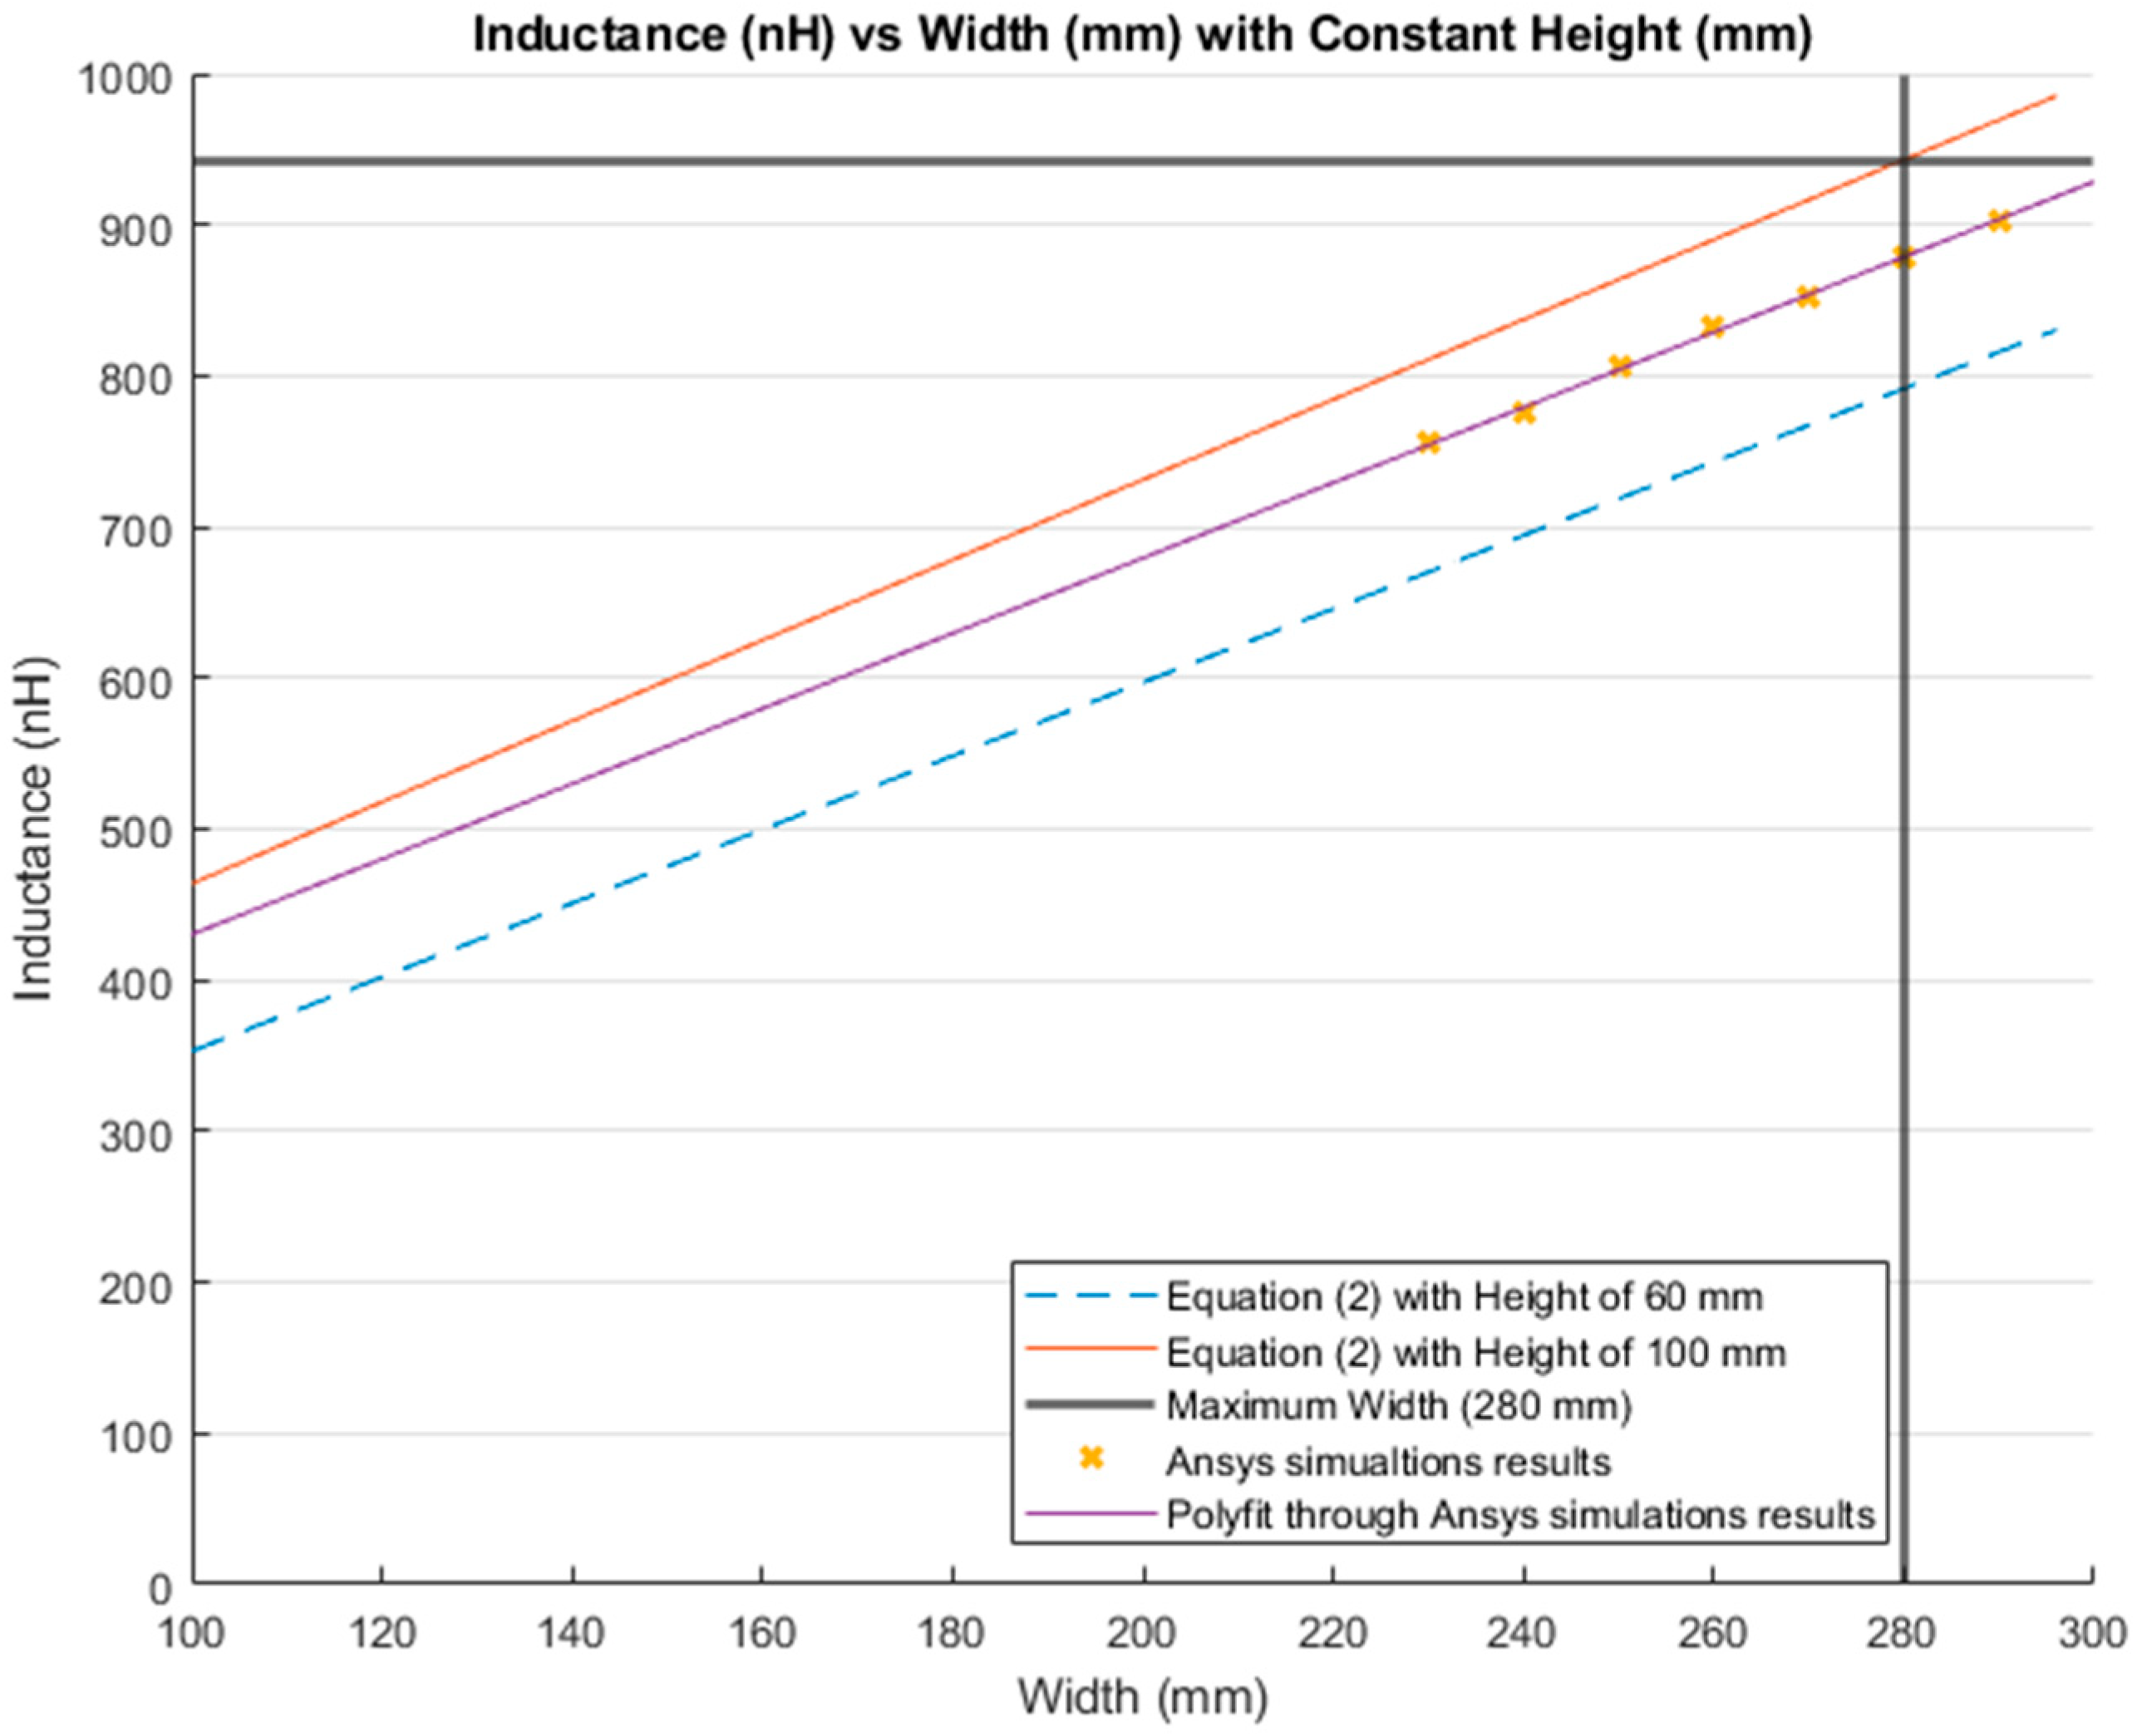
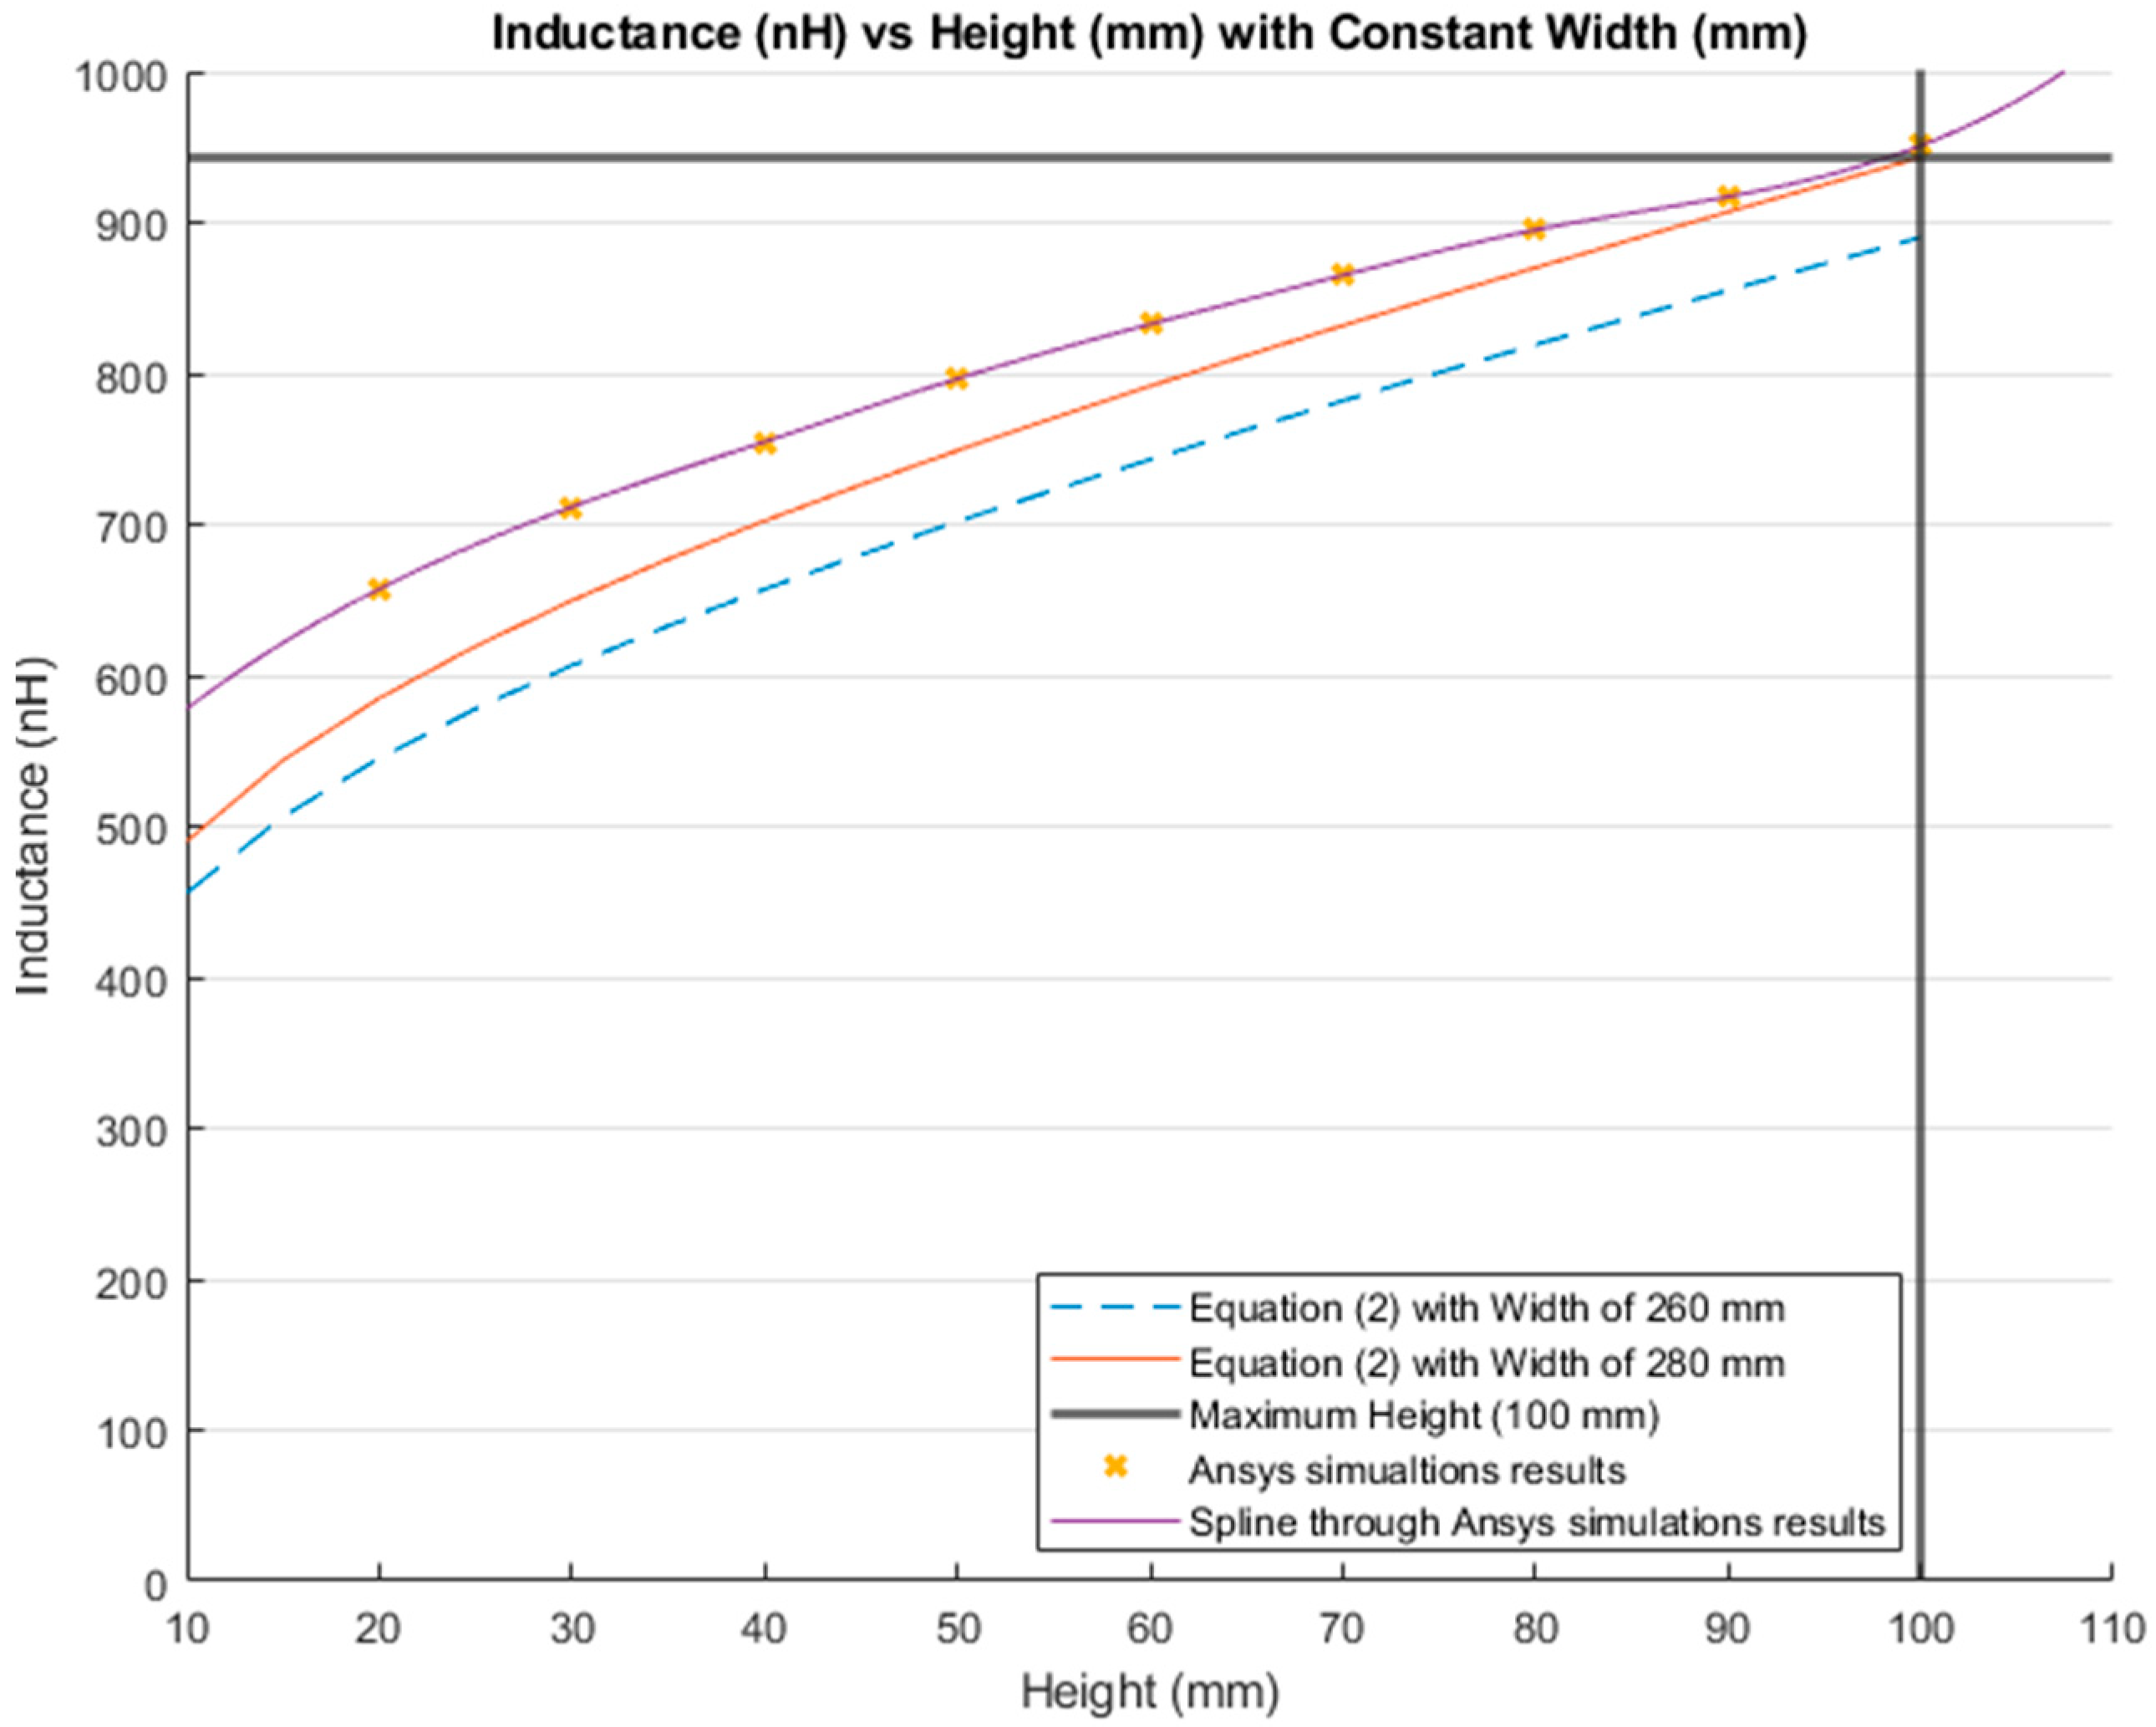
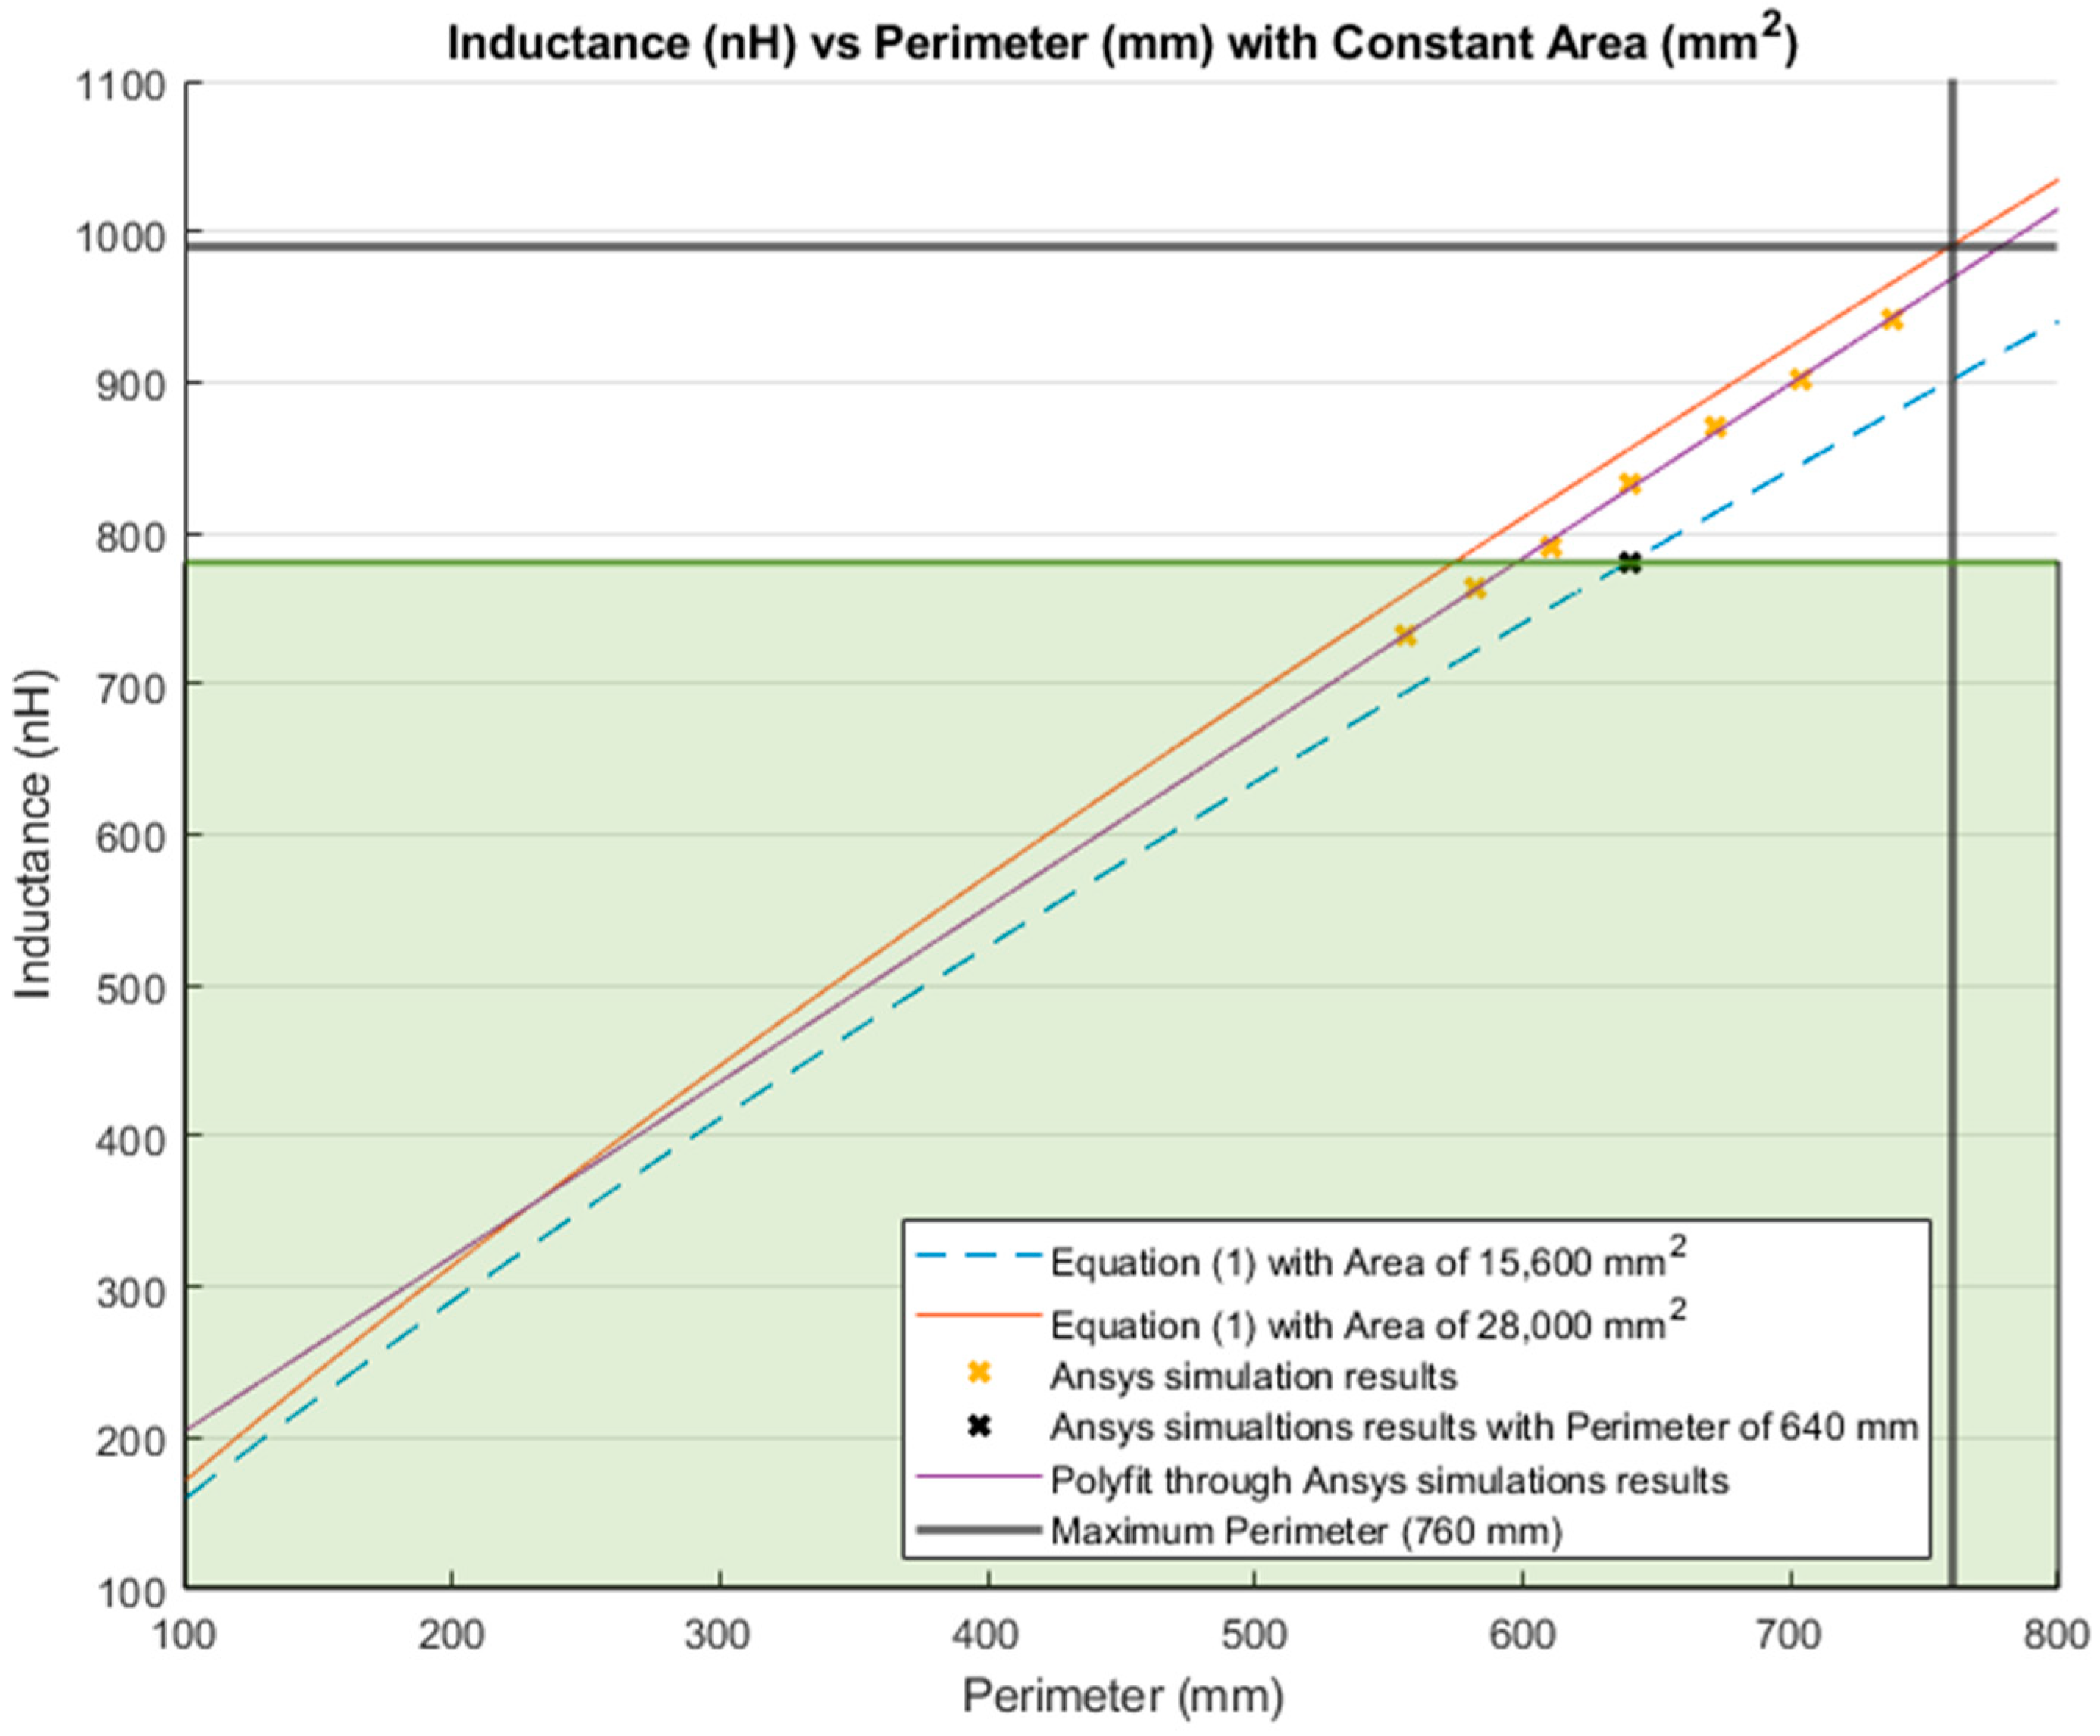
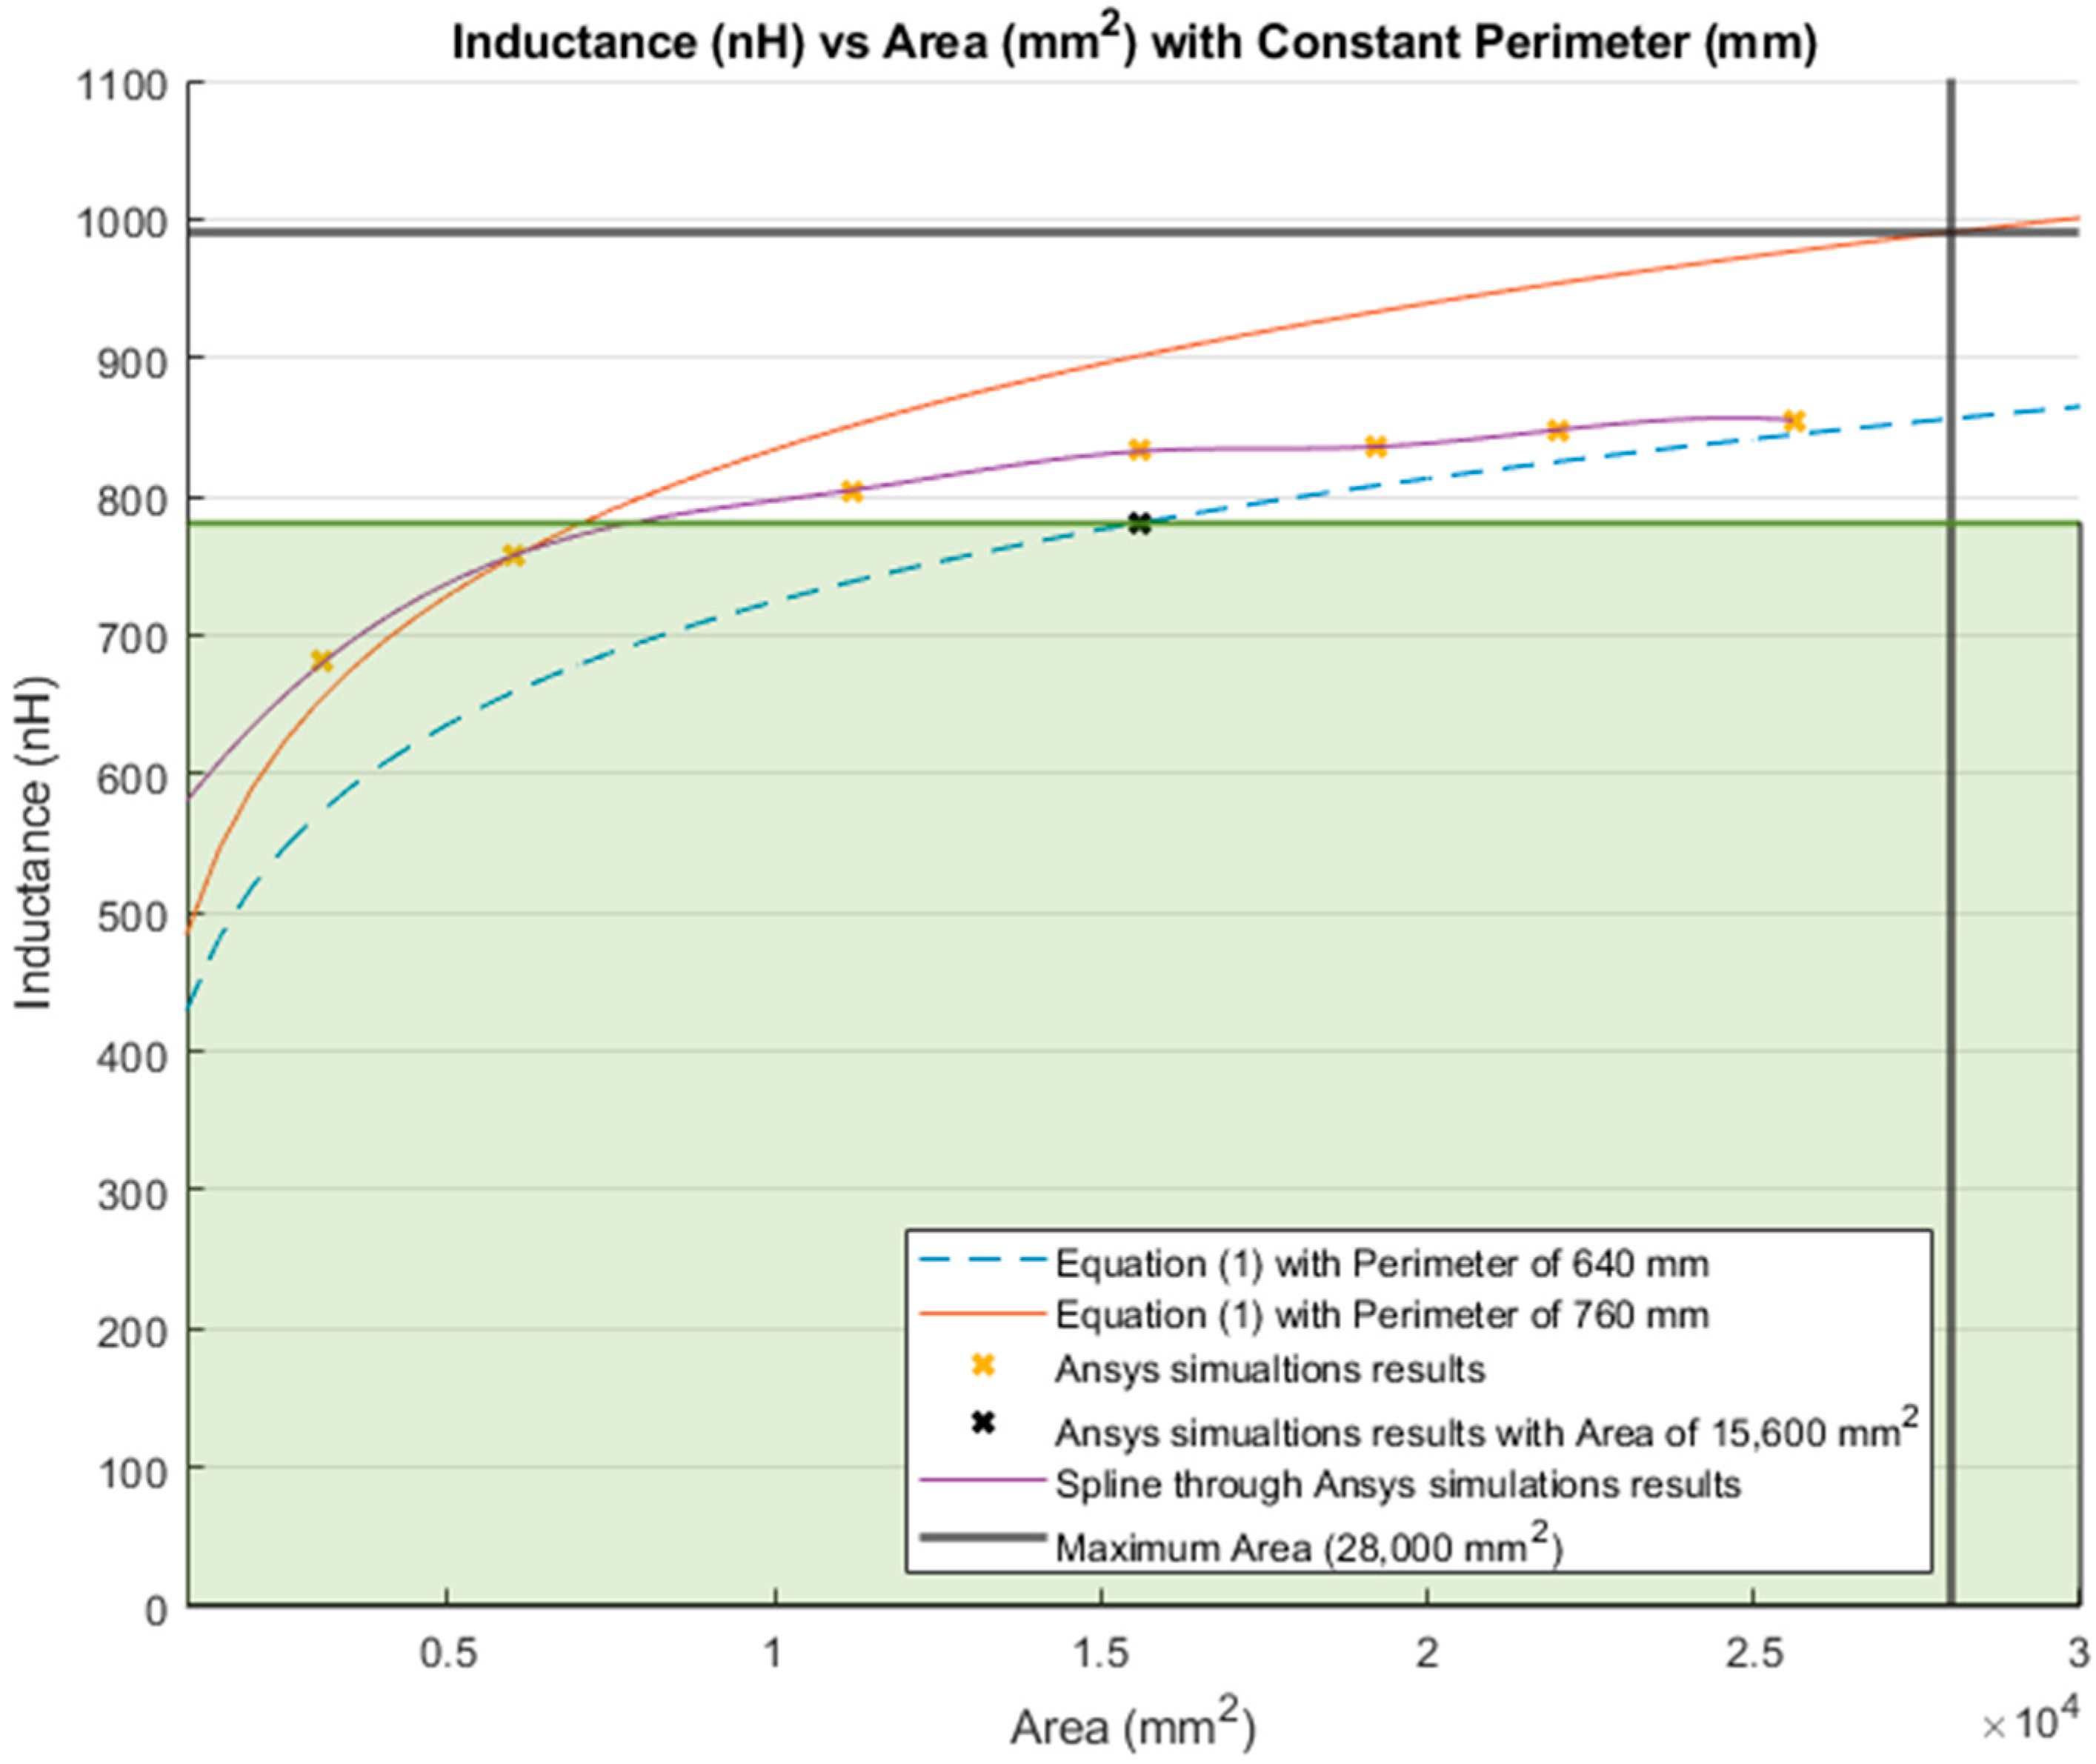
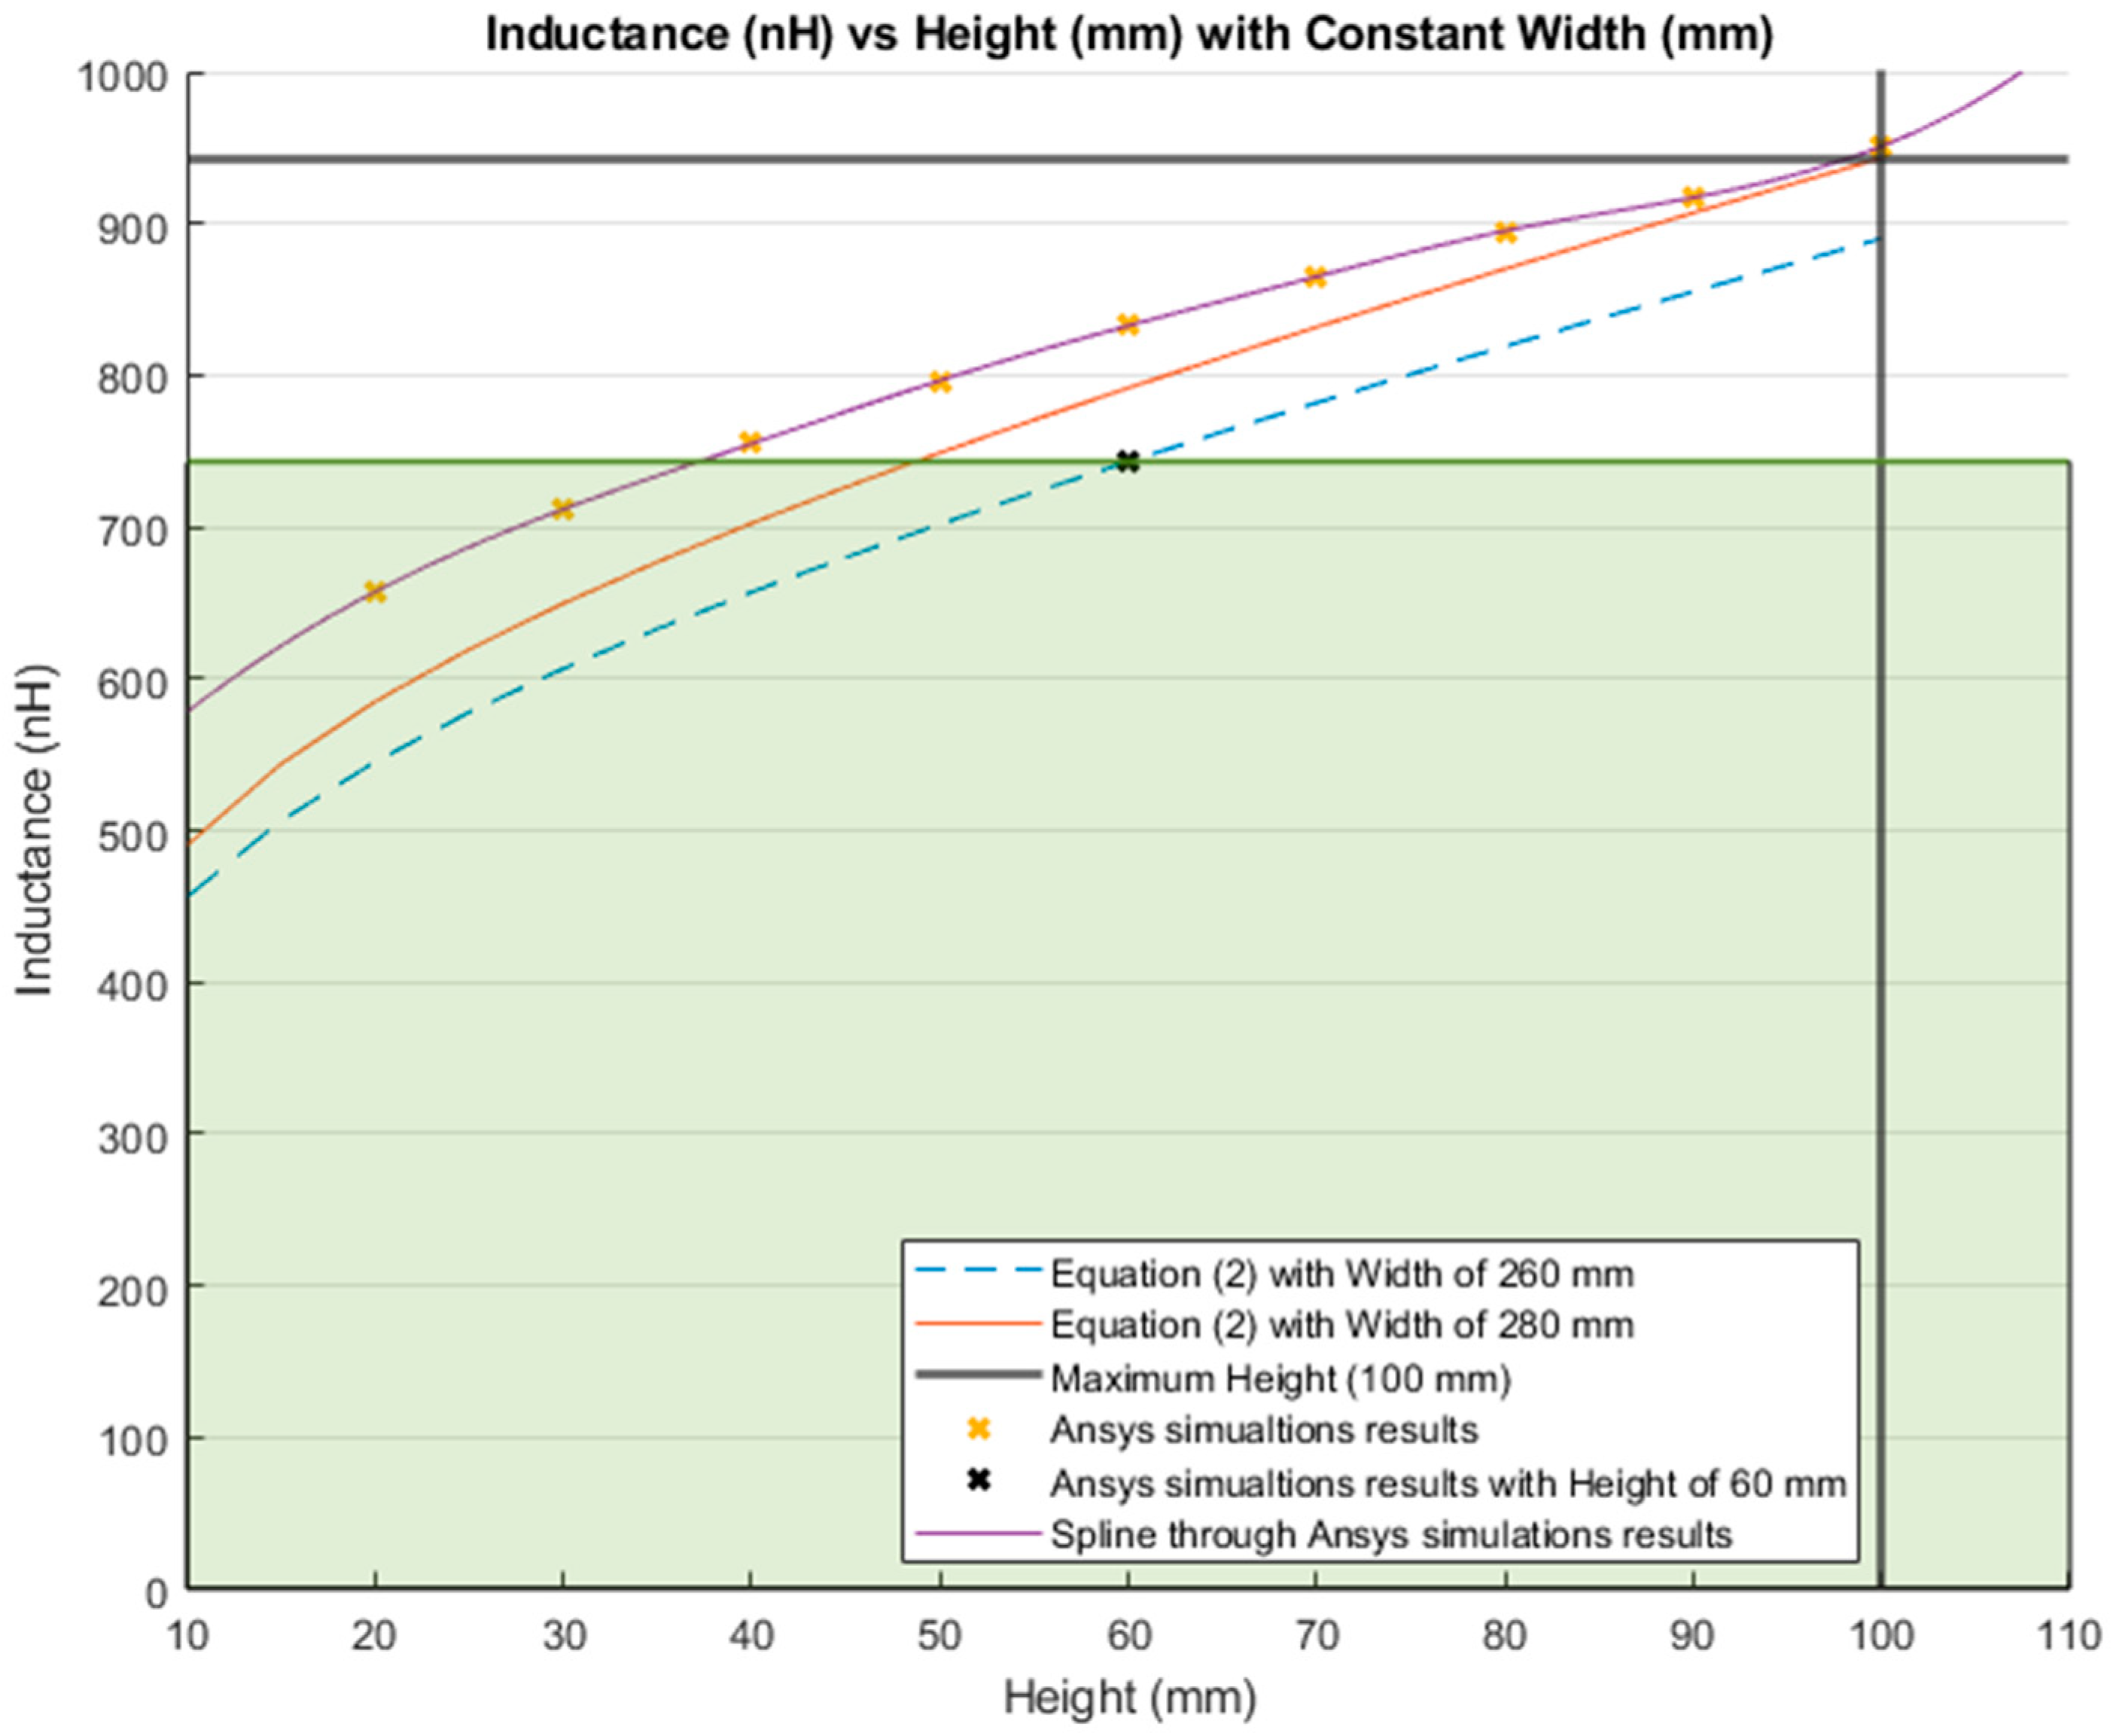
Figure 2 shows the results of Equation (1), which describes the inductance based on the perimeter and the area. Equation (1) demonstrated an almost linear behavior when the area was kept constant. However, in the case of a constant perimeter, the inductance behavior was similar to that of a logarithmic graph. Equation (2), which relates the inductance value to the height and width of the rectangle (
Figure 3), described the inductance with a linear behavior when the height was constant. On the other hand, when the width was constant, the inductance showed a linear behavior when the height was approximately 25 mm. Unfortunately, these two equations led to different results for the inductance of a single loop rectangle, such that there was a difference of approximately 40 nH between the inductance values calculated using these equations for the same sensor dimensions. This discrepancy in calculated values increased as the rectangle became bigger. An example of this discrepancy can be seen using the lumbar anthropometric dimensions of a healthy participant from
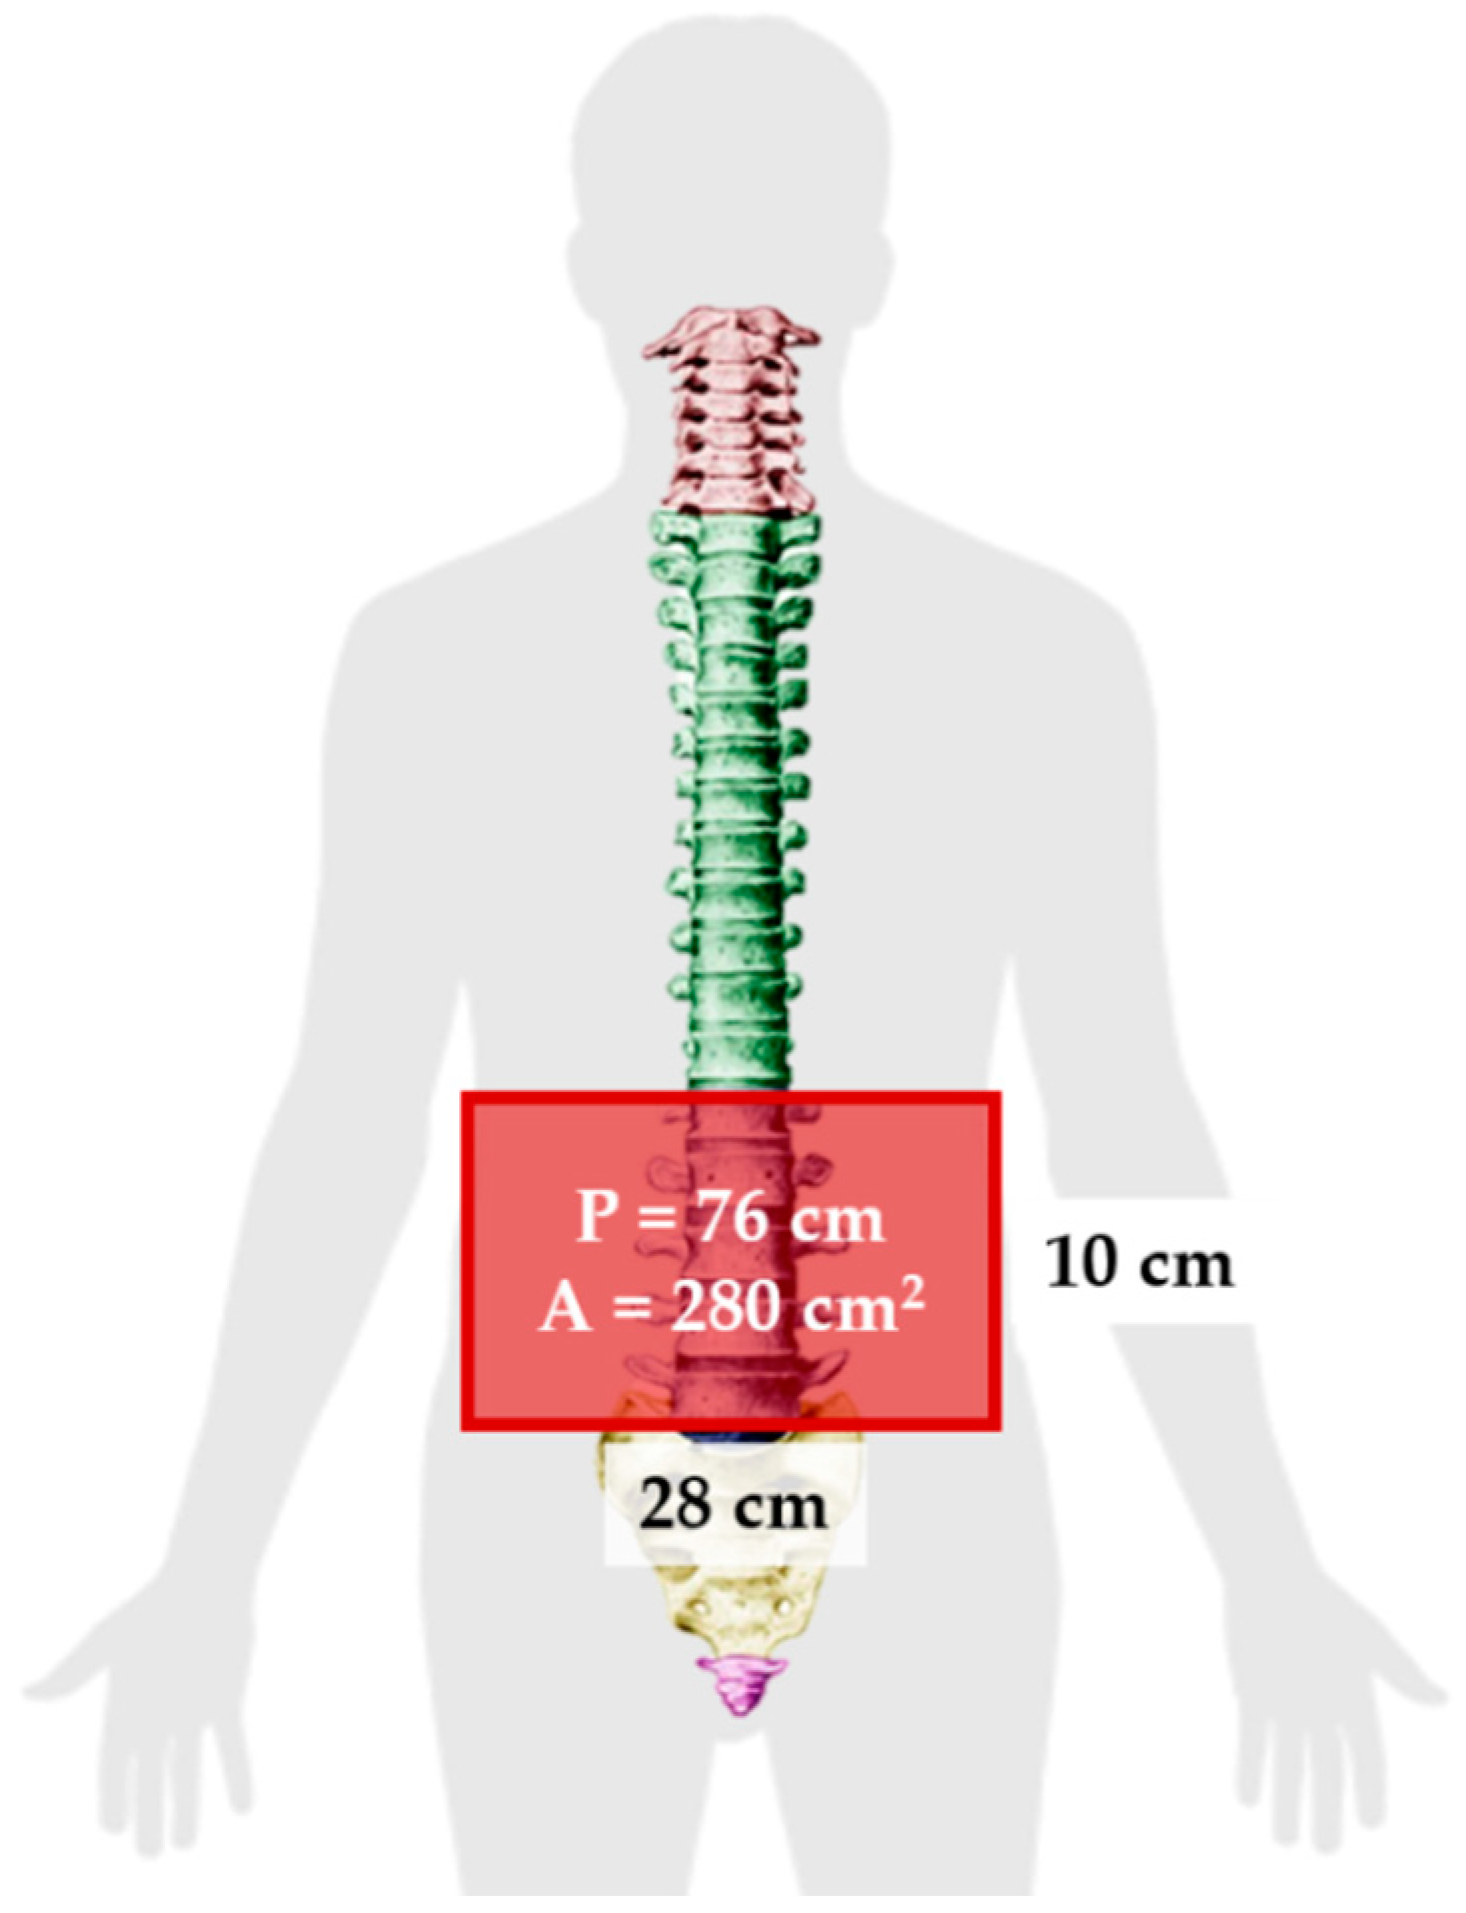
Section 3.1, where the rectangle had a width of 280 mm and a height of 100 mm. Using Equation (1), the inductance value was calculated to be 990.42 nH, while using Equation (2), the inductance was equal to 943.01 nH. The difference between these results was 47.41 nH. The equations used in this chapter are solely based on the geometry of the rectangle loop and entirely neglect the material from which the rectangle loop is made.
Finally, when the inductance was studied based on the height and width rather than the area and perimeter, it was possible to observe a more linear behavior, which facilitates the theoretical prediction of the inductance when using a rectangular shape. The inductance calculation based on the area and perimeter reported had closer results to the simulations compared to the results based on width and height. The average difference between the simulation results and Equation (1) calculations was 49.849 nH and 43.066 nH for constant area and constant perimeter, respectively. The average difference between the simulation results and Equation (2) calculations was 77.650 nH and 75.164 nH for a constant height and width, respectively. Additionally, the simulated inductance value using the lumbar anthropometric dimensions was 1.003 µH. The difference between this simulation and the results from Equations (1) and (2) using the same lumbar dimensions was 12.58 nH and 59.99 nH, respectively.
In general, the behavior and trend of inductance values were similar in both simulations and theoretical calculations, but the obtained inductance values were different. Nonetheless, the simulations were closer to the results of Equation (1) than to those of Equation (2). All simulations resulted in a higher inductance compared to theoretical calculations. This outcome could be a result of considering the material of the rectangle loop and the environment surrounding the rectangle loop while running the simulations. Future investigation should include an analysis on the change of the inductance value when a biological body is in close proximity to the inductive textile sensor. Furthermore, unlike studies such as [
4,
5], the equations presented in this study do not consider mutual-inductance or self-inductance. However, inserting these parameters into the calculations increased the complexity.
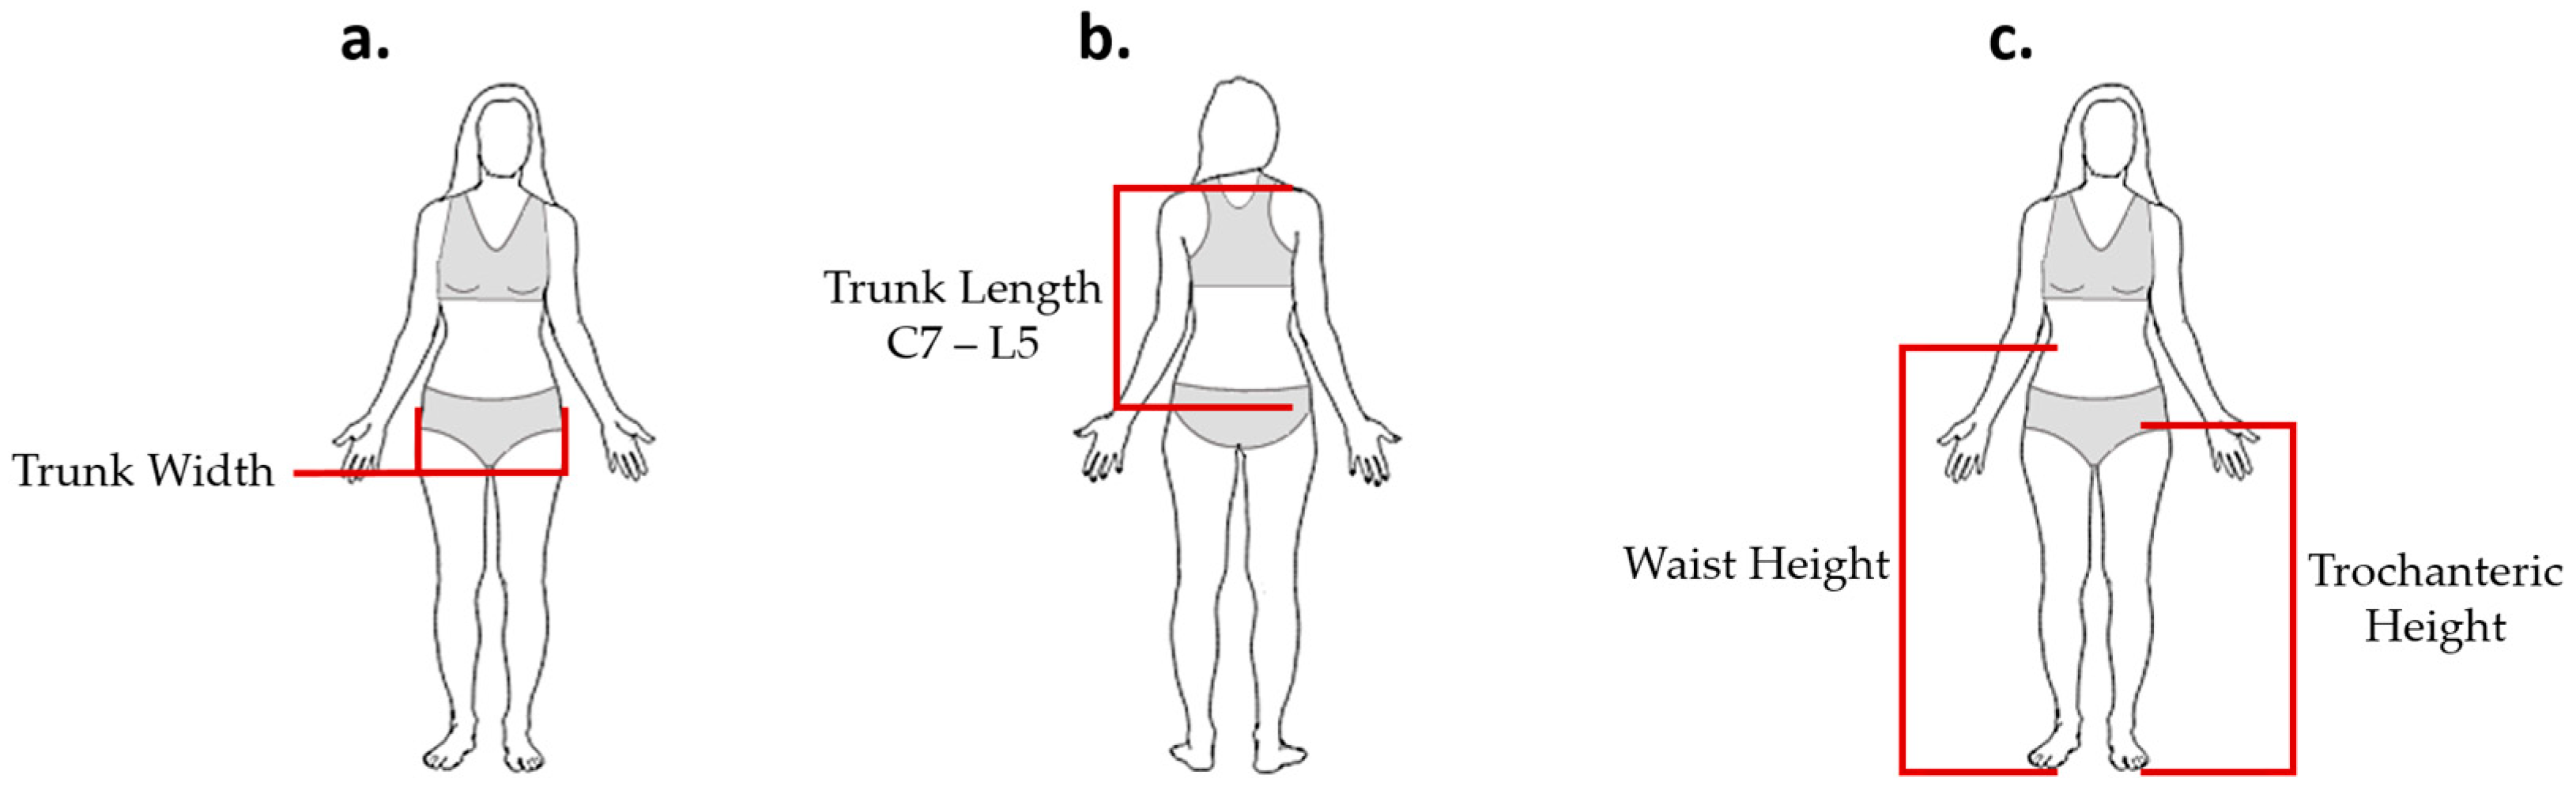
The dimensions of the inductive textile sensor were chosen based on using the anthropometric dimensions of the lumbar area of a healthy participant and according to the inductance behavior. A rectangle of smaller dimensions (260 mm width and 60 mm height) was arbitrary selected to compare the inductance value against the maximum inductance for the lumbar section of the back. Based on Equation (1), this smaller rectangle covered up to 78.81% of the maximum inductance range. While using Equation (2), the same smaller rectangle covered up to 78.79%. The maximum inductance was obtained by using the dimensions of the entire lumbar section of a healthy participant, and is presented in
Section 3.1.
Figure 21 and
Figure 22 show the covered area based on Equation (1). Moreover,
Figure 23 and
Figure 24 illustrate the covered area based on Equation (2). In both cases, the covered inductance change is highlighted in grey and the black “
x” represents the simulation results for a rectangle with dimensions 260 mm × 60 mm.
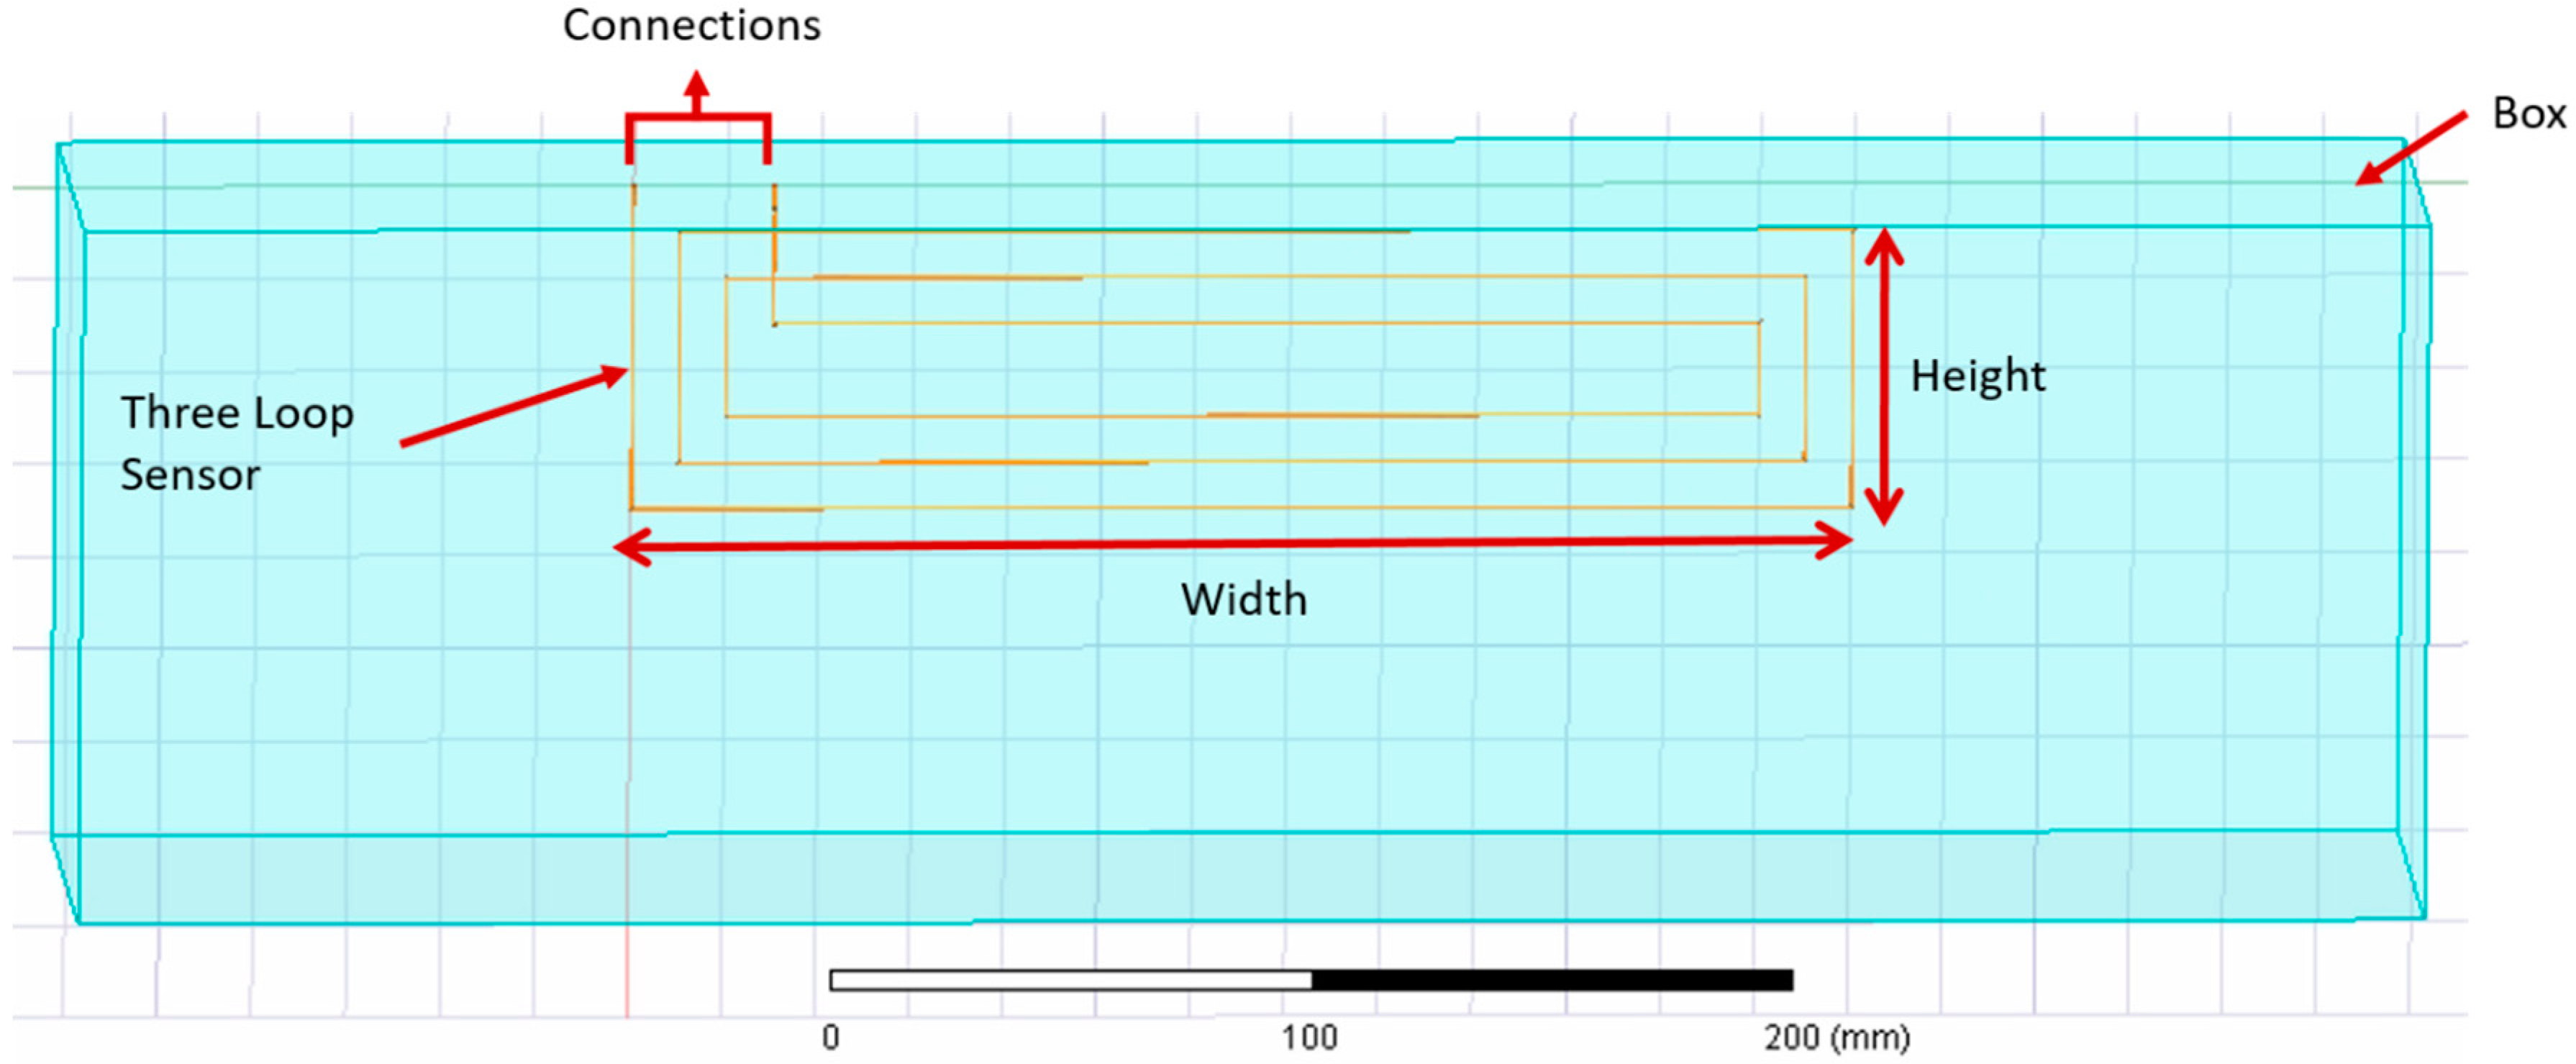
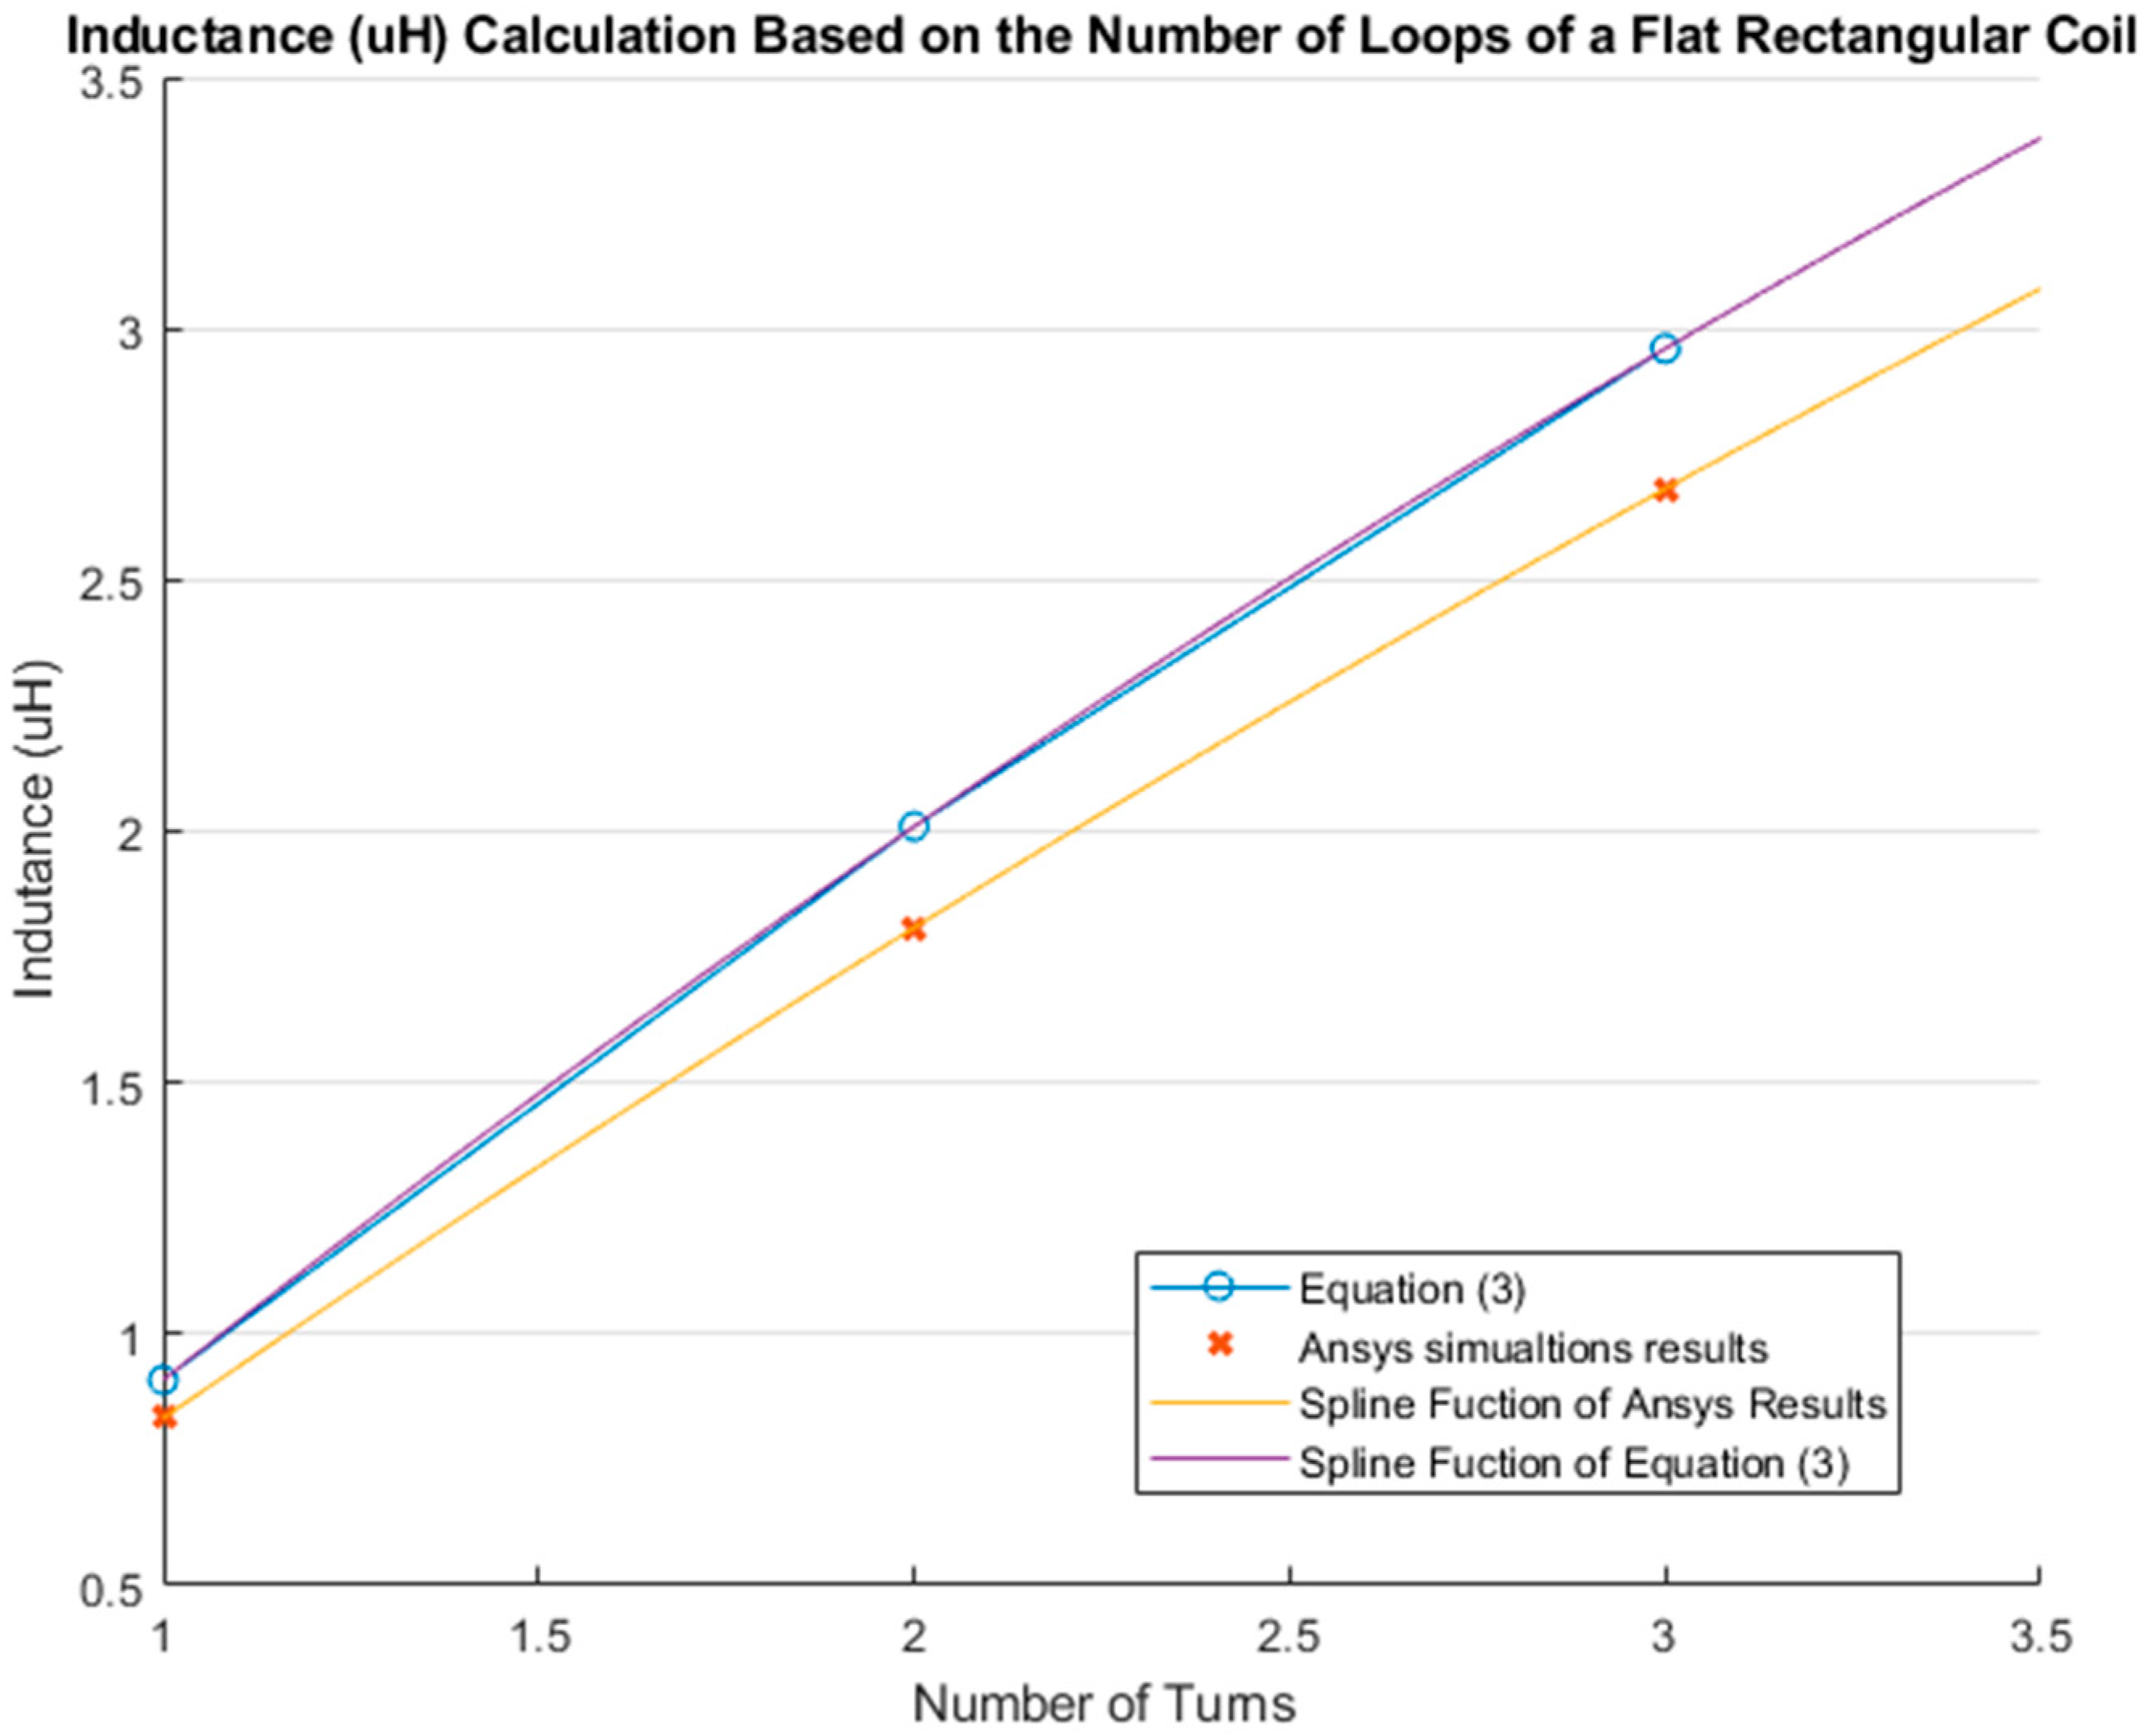
Results of Equation (3) were also different from those of the simulations. The difference between the inductance value calculated with Equation (3) and the simulated one increased with the number of loops. More specifically, the inductance value for a single loop was calculated to be 0.909 µH using Equation (3), while simulations yielded an inductance value of 0.833 µH for the same case, resulting in a difference of 0.0759 µH between the two methods. When considering three loops, the difference in the inductance value increased to 0.279 µH, which was more than twice that obtained for a single loop. Nonetheless, the behavior and trend of inductance were similar in both methods, as shown in
Figure 16.
The percentage reduction of the size and inductance value from the total lumbar dimensions to the arbitrary chosen dimension (260 mm width and 60 mm height) were as follows; the area was reduced to 44.29%, the perimeter was reduced to 15.79%, the height was reduced to 66.67%, and finally the width was reduced to 7.14%. These size modifications resulted in a reduction of the inductance by 21.19% and 21.21% for Equations (1) and (2), respectively. Reducing the perimeter and width has a greater impact on the inductance value than on the area and the height. As shown in
Figure 22 and
Figure 24, the inductance behavior, when modifying the area and height, followed the pattern of a logarithm. Therefore, when deciding the size of the sensor, it was better to modify the area or height to avoid a drastic decrease on its inductance. Additionally, increasing the number of complete loops without modifying the area increased the inductance value.
The theoretical inductance value of a flat rectangular coil of 260 mm width and 60 mm height with three complete loops using Equation (3) was 2.960 µH, while the simulated inductance value was 2.681 µH. The inductance value difference between the simulation and Equation (3) was 0.279 µH. The fabricated inductive strain textile sensor presented in our previous study had a value of 4.500 µH [
3]. However, this inductive strain textile sensor was made with a zigzag pattern and included a connection line along the spine. As discussed in
Section 2.4: Zigzag properties, use of a zigzag pattern increases the inductance value by 35%. Therefore, the inductance value after increasing the simulated value (2.681 µH) by 35% was 3.619 µH. The difference between the simulation result and the fabricated sensor presented in [
3] was 24.309%. This difference was due to the connection line not considered in this study and small differences between the simulation and actual parameters, since the inductive textile sensor was manufactured by hand. Moreover, a simulation presented in our previous study [
1], where a simulation of the inductive strain textile sensor included the zigzag pattern and the connection line obtained an inductance value of 4.698 µH. The difference in inductance value between this last simulation and the manufactured inductive textile sensor was 4.4%.
A rectangle of 260 mm width and 60 mm height proved to cover up to 78.8% of the maximum possible inductance value in both Equations (1) and (2), and consequently, was suggested to be an optimal option when the size of the inductive textile sensor was chosen. Additionally, the maximum number of loops that could be fitted into the aforementioned dimensions was three. Considering that the sensor was made of non-stretchable material, increasing the number of loops inevitably increased the stiffness of the fabric, which could interfere with the comfort for the user. Among the important requirements for wearable devices are comfort and being as unobstructive as possible, so users can perform their regular activities as normally as possible [
1,
6,
8,
9].


