Author Contributions
Conceptualization, D.G., D.D. and W.J.K.; methodology, D.G., D.D., and W.J.K.; software, D.D., D.K., D.G. and M.M.; validation, A.S.-K., D.K.; writing—original draft preparation, D.G., D.D., M.M., and W.J.K.; writing—review and editing, W.J.K.; visualization, D.K., D.D. and D.G.; supervision, W.J.K.; project administration, A.J.; funding acquisition, W.J.K., D.G., D.D. and A.J. All authors have read and agreed to publish this version of the manuscript.
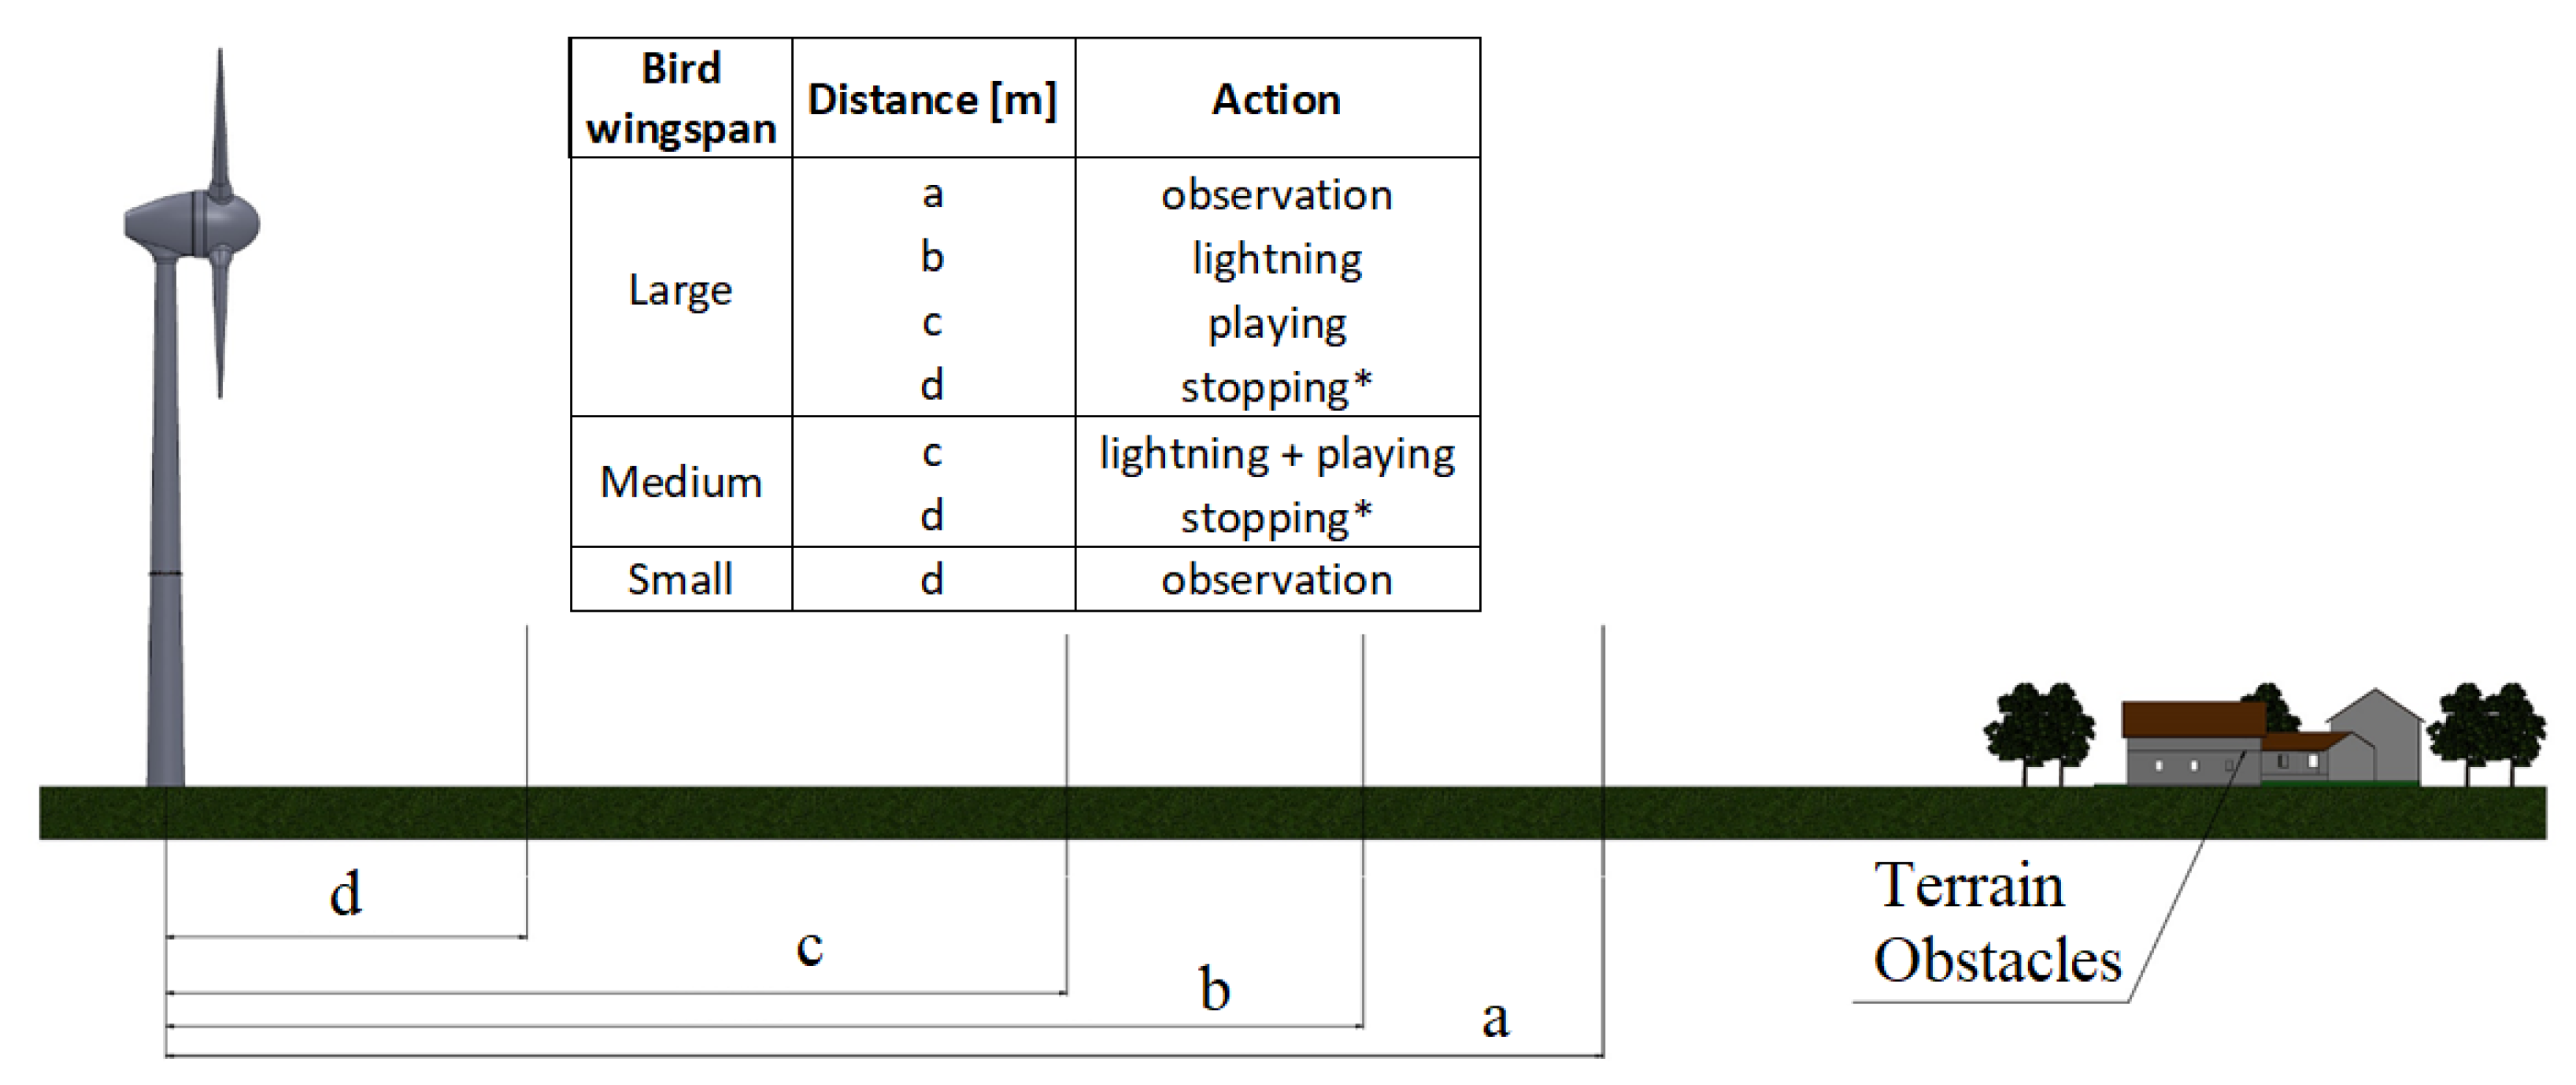
Figure 1.
Configuration and variables’ definitions of bird protection system, where (*) means an optional prevention method.
Figure 1.
Configuration and variables’ definitions of bird protection system, where (*) means an optional prevention method.
Figure 2.
The general system configuration and data processing scheme.
Figure 2.
The general system configuration and data processing scheme.
Figure 3.
Functionalities and constrains and their impact on hardware components.
Figure 3.
Functionalities and constrains and their impact on hardware components.
Figure 4.
Monitoring area of the system.
Figure 4.
Monitoring area of the system.
Figure 5.
Projection of the bird on an image [px] as a function of bird wingspan [m] and its distance from the baseline, for C1 camera and lens of f = 3 mm.
Figure 5.
Projection of the bird on an image [px] as a function of bird wingspan [m] and its distance from the baseline, for C1 camera and lens of f = 3 mm.
Figure 6.
Mapping of stereoscopic camera scenes, defining basic system parameters.
Figure 6.
Mapping of stereoscopic camera scenes, defining basic system parameters.
Figure 7.
Baseline [m] and distance [m] impact of uncertainty of distance measurement [m]. Black and green lines denote recommended sizes of Baseline of 10 m and 3 m respectively, red line is selected trade-off of 1 m.
Figure 7.
Baseline [m] and distance [m] impact of uncertainty of distance measurement [m]. Black and green lines denote recommended sizes of Baseline of 10 m and 3 m respectively, red line is selected trade-off of 1 m.
Figure 8.
Relationships between object Distance [m] and the difference in pixels on an image [px] (blue color) and a resolution of distance measurement [m] (brown color) for baseline of 1 m, 3 m and 10 m.
Figure 8.
Relationships between object Distance [m] and the difference in pixels on an image [px] (blue color) and a resolution of distance measurement [m] (brown color) for baseline of 1 m, 3 m and 10 m.
Figure 9.
The measurement resolution uncertainty [m] and pixel difference value [px] with respect to distance, for boundary values of the row number of the object projection on the image plane.
Figure 9.
The measurement resolution uncertainty [m] and pixel difference value [px] with respect to distance, for boundary values of the row number of the object projection on the image plane.
Figure 10.
The measurement resolution uncertainty [m] and pixel difference value [px] with respect to height for boundary values of the row number of object projection on the image plane.
Figure 10.
The measurement resolution uncertainty [m] and pixel difference value [px] with respect to height for boundary values of the row number of object projection on the image plane.
Figure 11.
Illustration of system general processing architecture.
Figure 11.
Illustration of system general processing architecture.
Figure 12.
Bird detection algorithm flowchart illustrated by original images from the system.
Figure 12.
Bird detection algorithm flowchart illustrated by original images from the system.
Figure 13.
Architecture of Convolutional Neural Network used for bird identification.
Figure 13.
Architecture of Convolutional Neural Network used for bird identification.
Figure 14.
Examples of images used for the training process.
Figure 14.
Examples of images used for the training process.
Figure 15.
Block diagram of decision-making system.
Figure 15.
Block diagram of decision-making system.
Figure 16.
Graphical approximation of the bird’s size calculation.
Figure 16.
Graphical approximation of the bird’s size calculation.
Figure 17.
The change of object size with distance caused by the quantization error of distance measurement for average representative of small, medium and large bird.
Figure 17.
The change of object size with distance caused by the quantization error of distance measurement for average representative of small, medium and large bird.
Figure 18.
A photo of the detection module of the bird protection system.
Figure 18.
A photo of the detection module of the bird protection system.
Figure 19.
The system prototype mounted on a wind turbine at the test field. The system consists of eight Detection modules fixed on the tower wall and the Decision-making system placed inside the tower.
Figure 19.
The system prototype mounted on a wind turbine at the test field. The system consists of eight Detection modules fixed on the tower wall and the Decision-making system placed inside the tower.
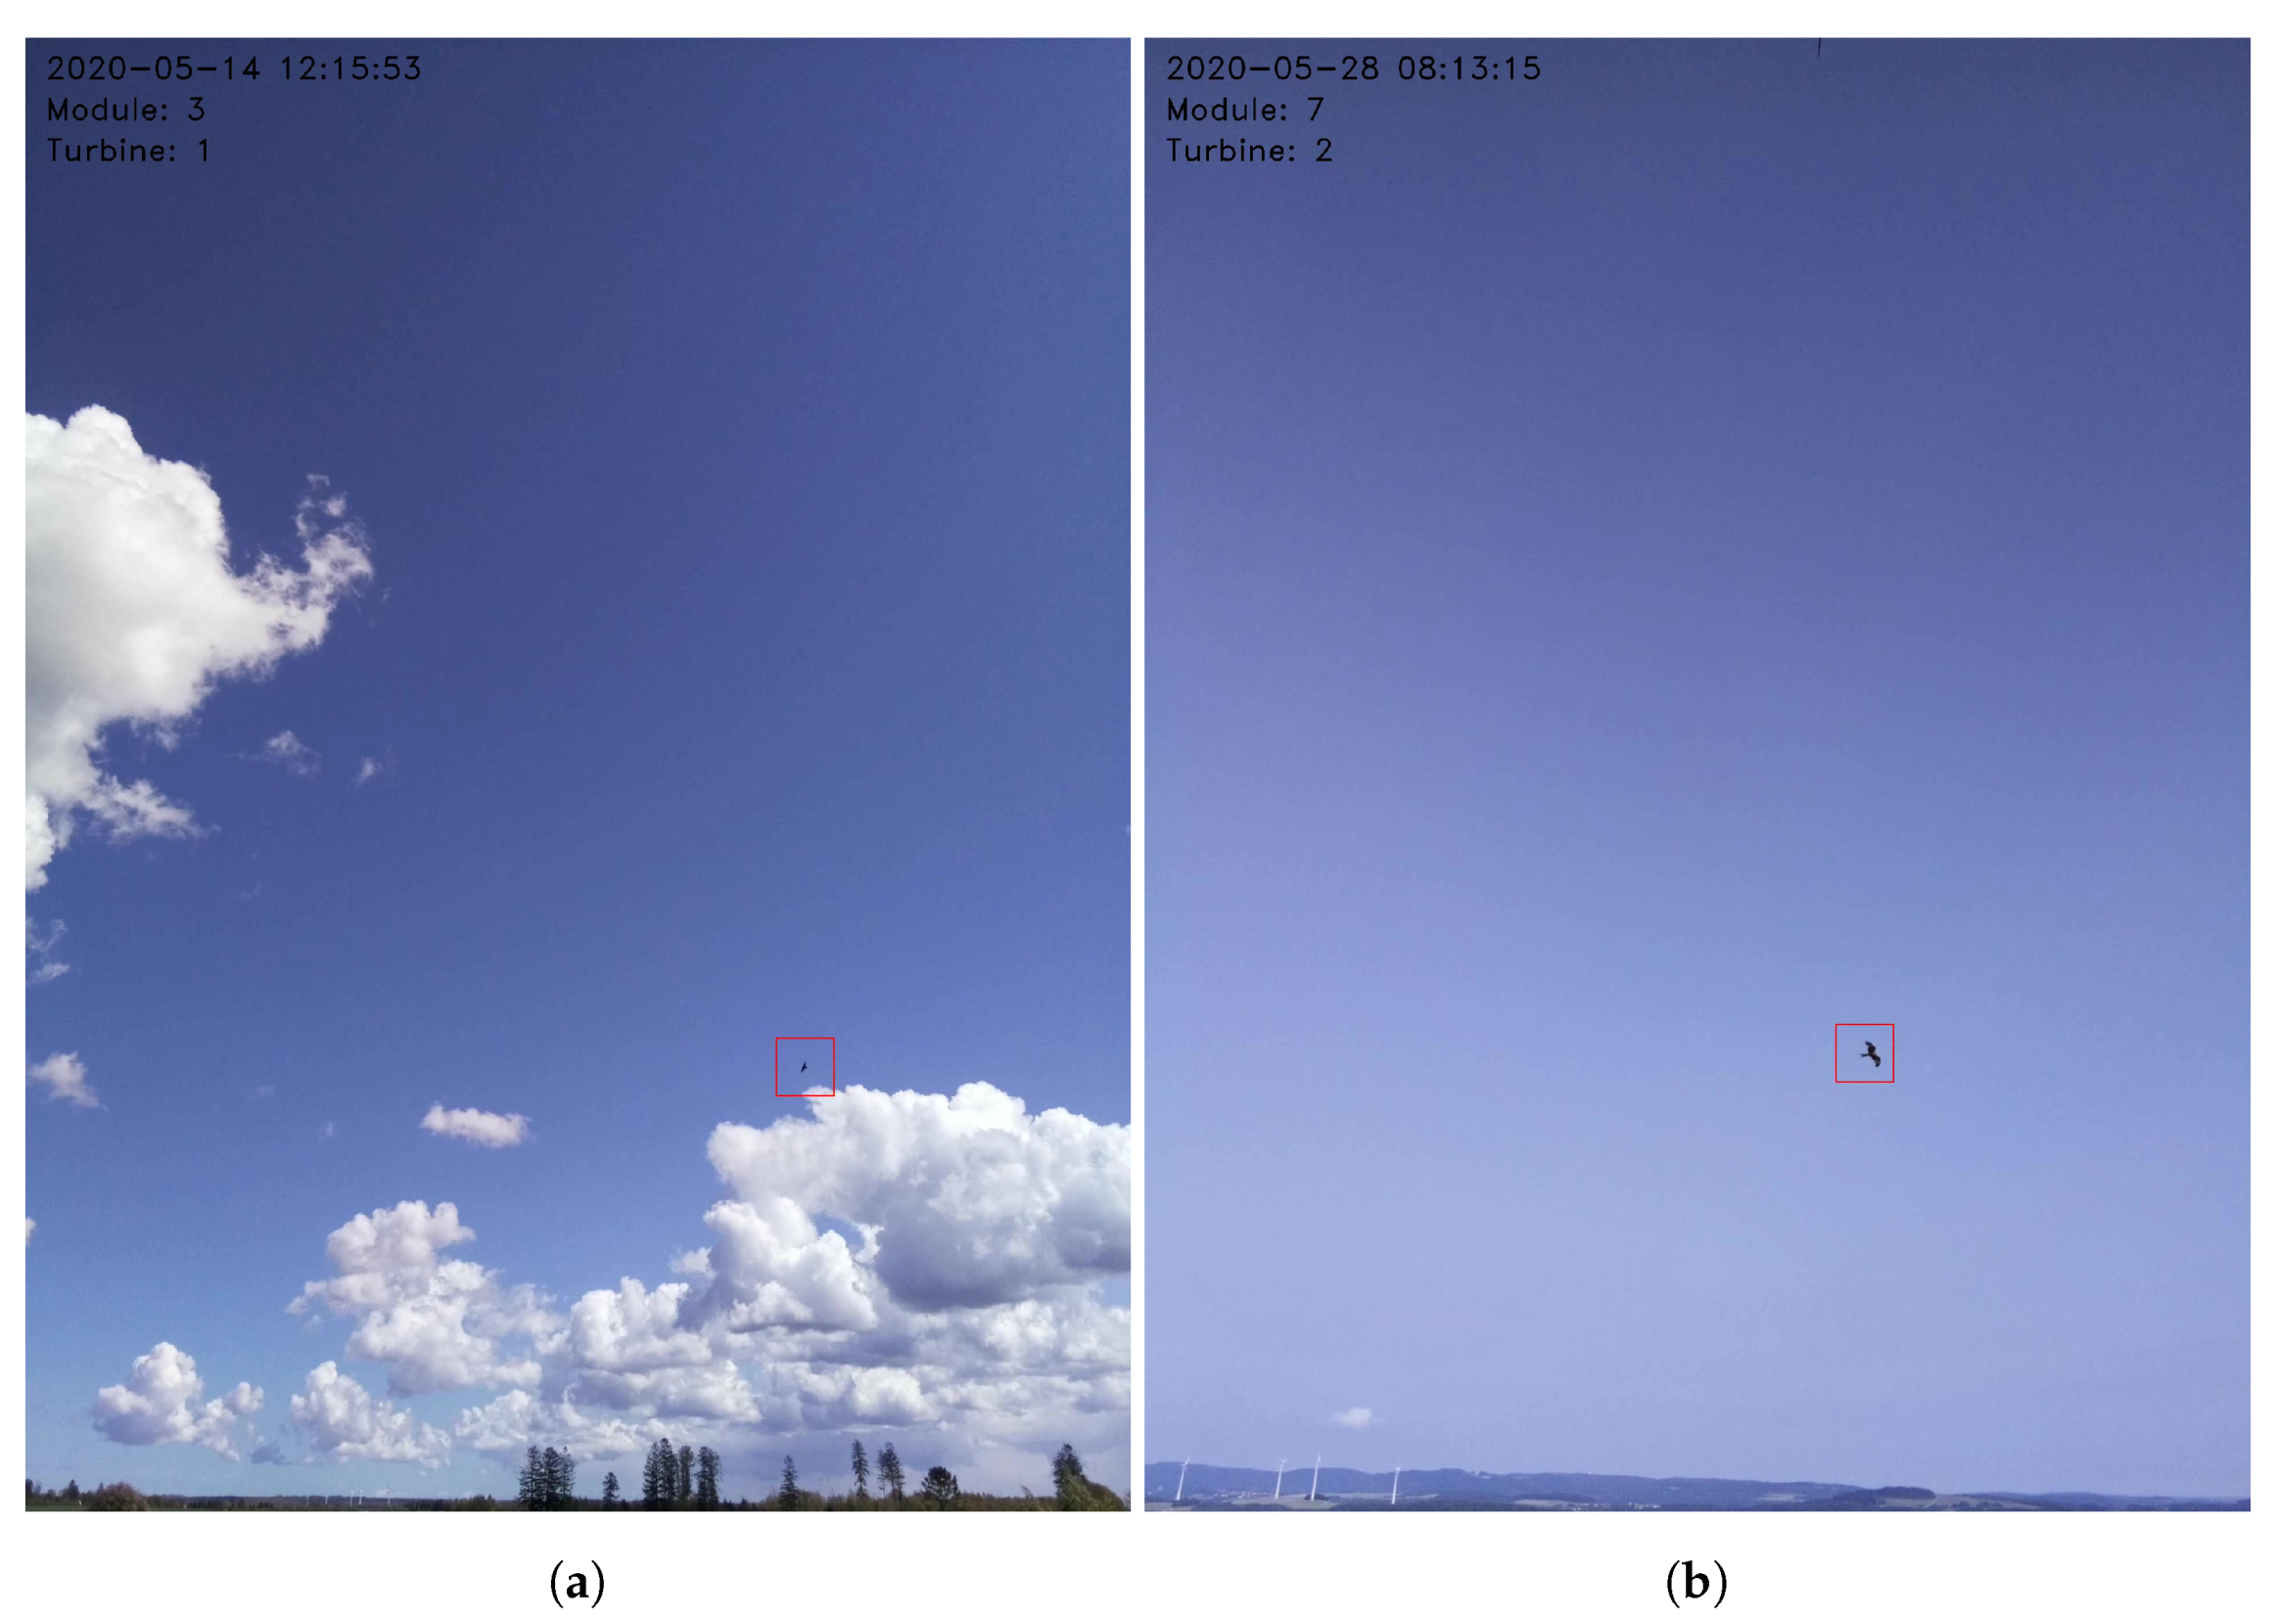
Figure 20.
Time-lapse photos of detection samples of Red Kite.
Figure 20.
Time-lapse photos of detection samples of Red Kite.
Figure 21.
Pictures of three bird silhouettes simulating (a) small ( = 0.8 m and = 0.3 m), (b) medium ( = 1.2 m and = 0.4 m) and (c) large ( = 1.5 m and = 0.5 m) birds at distance of 150 m.
Figure 21.
Pictures of three bird silhouettes simulating (a) small ( = 0.8 m and = 0.3 m), (b) medium ( = 1.2 m and = 0.4 m) and (c) large ( = 1.5 m and = 0.5 m) birds at distance of 150 m.
Figure 22.
Photos of the fixed-wing drone used for the system validation (a) on the ground (b) in flight.
Figure 22.
Photos of the fixed-wing drone used for the system validation (a) on the ground (b) in flight.
Figure 23.
The GPS flight path of the test drone.
Figure 23.
The GPS flight path of the test drone.
Figure 24.
The variation of and with time (sample) for Module A and Module B in the drone test.
Figure 24.
The variation of and with time (sample) for Module A and Module B in the drone test.
Figure 25.
Variation of estimated distances D, and H for Module A in the drone test.
Figure 25.
Variation of estimated distances D, and H for Module A in the drone test.
Figure 26.
Histogram of variation in pixel difference [px], for module A and B in the drone test.
Figure 26.
Histogram of variation in pixel difference [px], for module A and B in the drone test.
Figure 27.
Distance from a wind tower vs height of drone test. Green dots-GPS data. Red and blue dots-data from module A and module B, respectively. Corresponding color ellipses illustrate standard deviations of respective distance and height measurements.
Figure 27.
Distance from a wind tower vs height of drone test. Green dots-GPS data. Red and blue dots-data from module A and module B, respectively. Corresponding color ellipses illustrate standard deviations of respective distance and height measurements.
Figure 28.
Example images with depicted detected and classified (a) Raven, (b) Red Kite.
Figure 28.
Example images with depicted detected and classified (a) Raven, (b) Red Kite.
Figure 29.
Examples of flight paths of (
a) Raven, (
b) Red Kite observed on 21 May 2020 visualized on Google Maps [
64].
Figure 29.
Examples of flight paths of (
a) Raven, (
b) Red Kite observed on 21 May 2020 visualized on Google Maps [
64].
Figure 30.
A heat-map of the one-day observation where the red color depicts the highest density of detections.
Figure 30.
A heat-map of the one-day observation where the red color depicts the highest density of detections.
Table 1.
Comparison of vision techniques for bird detection by DT Bird, SafeWind, Identyflight, BirdVision, Airelectronics.
Table 1.
Comparison of vision techniques for bird detection by DT Bird, SafeWind, Identyflight, BirdVision, Airelectronics.
| Method | DT Bird | SafeWind | Identyflight | BirdVision | Airelectronics |
|---|
| Detection method | Monoscopic | Monoscopic | Stereoscopic | Monoscopic | Monoscopic |
| Distance estimation | No | No | Yes | No | Yes |
| Localization | No | No | Stereo-vision-based | No | No |
| Maximum detection range | 650 m | - | 1500 m | 300 m | 600 m |
| Target classification | No | No | Golden & Bald Eagles, Red Kite | No | No |
| Installation | Wind turbine | Wind turbine | Separate tower | Wind turbine | Wind turbine |
| Collision prevention | Audio, Turbine stop | Audio, Turbine Stop | Turbine stop | Turbine stop | Audio, Turbine stop |
Table 2.
Comparison of CNN architectures used for bird identification. BN—Batch Normalization; SC—Skip Connection; FP—False Positives.
Table 2.
Comparison of CNN architectures used for bird identification. BN—Batch Normalization; SC—Skip Connection; FP—False Positives.
| Paper | Database | Identification Algorithm | Image Size [px × px × Channel] | Pooling Window | Activation Function | Identification Accuracy |
|---|
| [47] | [42] | CNN | 28 × 28 × 3 | max 2 × 2 | ReLU | 80–90%, 0.2 FP |
| [45] | [45] | CNN | 256 × 256 × 1 | - | softmax | 90–98%, 0.2 FP |
| [48] | [49] | CNN (BN, SC) | 112 × 112 × 1 | max 2 × 2 | ReLU, softmax | 90–99% |
| [4] | [4] | CNN (SC) | 128 × 128 × 1; 96 × 96 × 1; 64 × 64 × 1; 32 × 32 × 1 | - | - | 70–90% |
Table 3.
Functional and nonfunctional requirements and particular constrains.
Table 3.
Functional and nonfunctional requirements and particular constrains.
| | | General Requirements | Itemized Requirements | Particular Constrains |
|---|
| Environmental Authorities | | Rare bird species | Very high effectiveness |
| Protection of the birds | Big birds | High effectiveness |
| | Medium/Small birds | Medium effectiveness |
| | During daylight | >100 lux |
| Collision avoidance | Turbine stopping | Compulsory for rare and big birds |
| | Deterrence | Optional for further distances |
| Validation data | Photo and video from events | High resolution allowing bird identification, data storage for 1 year |
| Wind farm developers | Functional | Bird localization | Distance estimation | 90% accuracy |
| Bird classification/ | Size | Small/Medium/Large |
| identification | Species | Local rare species |
| | | High classification reliability |
| Collision avoidance | Turbine stopping | Minimization of turbine-off time |
| | Deterrence method | Audio/Strobo |
| User interface | Easy access | Web/mobile application |
| Nonfunctional | Installation | Non-invasive installation | On turbine using stainless steel climbs |
| System lifetime | As long as possible | Minimum five years |
| System verification | Data from the events | High-resolution photos |
| | | High-resolution color smooth video |
| | Collision monitoring | At least HD resolution smooth Video |
| System accessibility | Web App | Chrome, Mozilla, Safari |
| | Mobile App | Android, IOS |
| Data handling | Storage | At least 2 years |
| | Reports | Selective allowing the choice of only interesting data up to a year back |
| Manufacturer | Functional | Installation | Plug and Play Solution | Module construction, easy replacement |
| | Compatibility with existing systems | Turbine stop using PLC or SCADA trough ModBus. |
| Maintenance | Remote software upgrade | IoT. |
| | In situ auto calibration | Daily. |
| Nonfunctional | High reliability | Small number of FP | Annual average number of FP less than 10% of all detections. |
| Remote connection | Daily status check | Fast and secure. |
| Customizability | Adjustment of system parameters such as detection range and size classification criteria | To bird species nesting nearby, local law and regulations, specific ornithology’s recommendations, turbines features. |
Table 4.
Optical parameters of selected vision sensors.
Table 4.
Optical parameters of selected vision sensors.
| Parameter | Unit | C1 (IMX219) | C2 (IMX447) | C3 (AR1335) | C4 (AR1820HS) |
|---|
| px | 3280 | 4056 | 4208 | 4912 |
| px | 2464 | 3040 | 3120 | 3684 |
| mm | 3.680 | 6.287 | 6.300 | 7.660 |
| mm | 2.760 | 4.712 | 5.700 | 4.560 |
| / | px/mm | 891.30 | 645.14 | 667.93 | 641.25 |
| / | px/mm | 892.75 | 645.16 | 547.36 | 807.95 |
Table 5.
Impact of the lens on the camera detection capabilities. The parameters, which fulfill the requirements are in bold. The selected options are underlined.
Table 5.
Impact of the lens on the camera detection capabilities. The parameters, which fulfill the requirements are in bold. The selected options are underlined.
| f [mm] | C1
| C2 | C3 | C4 |
|---|
| | | | | | | |
|---|
| [] × [] | [px] × [px] | [] × [] | [px] × [px] | [] × [] | [px] × [px] | [] × [] | [px] × [px] |
|---|
| 3 | 63.0 × 49.4
| 13.0 × 2.0 | 92.7 × 76.3 | 10.0 × 1.0 | 92.8 × 87.1 | 10.0 × 1.0 | 103.9 × 74.5 | 9.0 × 2.0 |
| 4 | 49.4 × 38.1 | 18.0 × 2.0 | 76.3 × 61.0 | 13.0 × 2.0 | 76.4 × 70.9 | 13.0 × 1.0 | 87.5 × 59.4 | 13.0 × 2.0 |
| 6 | 34.1 × 42.9 | 26.0 × 4.0 | 55.3 × 42.9 | 19.0 × 3.0 | 55.4 × 50.8 | 20.0 × 2.0 | 65.1 × 41.6 | 19.0 × 3.0 |
| 8 | 25.9 × 32.8 | 35.0 × 5.0 | 42.9 × 32.8 | 26.0 × 3.0 | 43.0 × 39.2 | 27.0 × 3.0 | 51.2 × 31.8 | 26.0 × 4.0 |
| 12 | 17.4 × 22.2 | 53.0 × 7.0 | 29.4 × 22.2 | 39.0 × 5.0 | 29.4 × 26.7 | 40.0 × 4.0 | 35.4 × 21.5 | 38.0 × 6.0 |
| 16 | 13.1 × 16.8 | 71.0 × 10.0 | 22.2 × 16.8 | 52.0 × 7.0 | 22.3 × 20.2 | 53.0 × 6.0 | 26.9 × 16.2 | 51.0 × 9.0 |
Table 6.
Test results of CNN performance evaluation, where the bolded row highlights the selected configuration; the values in red highlight the best values for a given parameter.
Table 6.
Test results of CNN performance evaluation, where the bolded row highlights the selected configuration; the values in red highlight the best values for a given parameter.
| CNN Parameters | FF Time [ms] | Precision | Recall | F1 | Specificity | Accuracy |
|---|
| | | | | | | | |
| 32 | 32 | 32 | 0.80 | 0.987 | 0.989 | 0.988 | 0.987 | 0.988 |
| 32 | 32 | 64 | 0.97 | 0.990 | 0.989 | 0.989 | 0.990 | 0.989 |
| 32 | 32 | 128 | 1.09 | 0.996 | 0.989 | 0.993 | 0.996 | 0.993 |
| 32 | 32 | 256 | 1.59 | 0.995 | 0.989 | 0.992 | 0.995 | 0.992 |
| 32 | 64 | 32 | 1.28 | 0.995 | 0.989 | 0.992 | 0.995 | 0.992 |
| 32 | 64 | 64 | 1.42 | 0.998 | 0.988 | 0.993 | 0.998 | 0.993 |
| 32 | 64 | 128 | 1.93 | 0.995 | 0.989 | 0.992 | 0.995 | 0.992 |
| 32 | 64 | 256 | 2.85 | 0.998 | 0.989 | 0.994 | 0.999 | 0.994 |
| 64 | 32 | 32 | 1.54 | 0.979 | 0.989 | 0.984 | 0.979 | 0.984 |
| 64 | 32 | 64 | 1.65 | 0.961 | 0.989 | 0.975 | 0.960 | 0.975 |
| 64 | 32 | 128 | 1.84 | 0.997 | 0.989 | 0.993 | 0.997 | 0.993 |
| 64 | 32 | 256 | 2.31 | 0.987 | 0.989 | 0.988 | 0.987 | 0.988 |
| 64 | 64 | 32 | 2.33 | 0.997 | 0.989 | 0.993 | 0.997 | 0.993 |
| 64 | 64 | 64 | 2.51 | 0.994 | 0.989 | 0.992 | 0.994 | 0.992 |
| 64 | 64 | 128 | 3.32 | 0.987 | 0.989 | 0.988 | 0.987 | 0.988 |
| 64 | 64 | 256 | 3.84 | 0.998 | 0.989 | 0.994 | 0.998 | 0.994 |
| min | 0.80 | 0.961 | 0.989 | 0.975 | 0.960 | 0.975 |
| max | 3.84 | 0.998 | 0.989 | 0.994 | 0.999 | 0.994 |
Table 7.
Classification boundaries of small, medium and large birds.
Table 7.
Classification boundaries of small, medium and large birds.
| Class | Detection Range
[m] | Wingspan
[m] | Height
[m] | Size
[] | Example Bird |
|---|
| Uncategorized | - | <0.68 | <0.32 | <0.11 | Feral Pigeon |
| | | | | | House Sparrow |
| Small | 10–183 | 0.68–1.25 | 0.32–0.39 | 0.11–0.24 | Common kestrel |
| | | | | | Peregrine Falcon |
| Medium | 10–312 | 1.26–1.50 | 0.40–0.55 | 0.25–0.41 | Steppe Buzzard |
| | | | | | Marsh Harrier |
| Large | 10–392 | >1.50 | >0.55 | >0.41 | Red Kite |
| | | | | | White stork |
Table 8.
Results of distance and size measurements at different distances for silhouettes simulating small, medium and large birds.
Table 8.
Results of distance and size measurements at different distances for silhouettes simulating small, medium and large birds.
| Parameter | Unit | Reference | Reference Distance [m] |
|---|
| | | Value | 50.00 | 100.00 | 150.00 | 200.00 | 250.00 | 300.00 |
|---|
| px | - | 54 | 27 | 19 | - | - | - |
| m | | | | | - | - | - |
| m | | | | | - | - | - |
| m | | 0.35 | 0.69 | 6.91 | - | - | - |
| m | 0.80 | 0.84 | 0.83 | 0.75 | - | - | - |
| m | 0.30 | 0.34 | 0.44 | 0.32 | - | - | - |
| m | 0.12 | 0.16 | 0.18 | 0.13 | - | - | - |
| m | | 0.14 | 0.19 | 0.12 | - | - | - |
| px | - | 55 | 28 | 18 | 13 | 10 | - |
| m | | | | | | | - |
| m | | | | | 8.04 | 13.59 | |
| m | | 0.57 | 2.91 | 1.04 | 9.13 | 21.87 | - |
| m | 1.20 | 1.18 | 1.16 | 1.24 | 1.09 | 1.22 | - |
| m | 0.40 | 0.41 | 0.44 | 0.51 | 0.39 | 0.41 | - |
| m | 0.24 | 0.24 | 0.24 | 0.33 | 0.23 | 0.23 | - |
| m | | 0.23 | 0.32 | 0.32 | 0.21 | 0.25 | - |
| px | - | 54 | 26 | 19 | 13 | 10 | 9 |
| m | | | | | | | |
| m | | | | | 8.04 | 13.59 | 16.78 |
| m | | 0.35 | 4.56 | 6.91 | 9.13 | 21.87 | 2.07 |
| m | 1.50 | 1.42 | 1.56 | 1.50 | 1.49 | 1.53 | 1.36 |
| m | 0.50 | 0.51 | 0.51 | 0.48 | 0.47 | 0.51 | 0.45 |
| m | 0.38 | 0.42 | 0.39 | 0.36 | 0.38 | 0.40 | 0.38 |
| m | | 0.36 | 0.40 | 0.36 | 0.35 | 0.39 | 0.31 |
Table 9.
Summary of drone test results.
Table 9.
Summary of drone test results.
| | [m] | [m] | [m] | [m] | [m] | [m] |
|---|
| Module A | 146.1 | 7.7 | 104.1 | 4.4 | 148.7 | 178.4 |
| Module B | 146.2 | 8.4 | 106.7 | 5.5 | 140.9 | 178.4 |
| Drone | 143.3 | 1.2 | 102.9 | 0.6 | - | - |
Table 10.
Comparison of ornithologists’ observations and system’s identification and classification of selected bird species.
Table 10.
Comparison of ornithologists’ observations and system’s identification and classification of selected bird species.
| Species Name | Wingspan [m] | Identification Rate (Sys/Ornithologist) | System Classification |
|---|
| [Eng]/[Lat] | [63] | <100 m | <100 m–200 m> | >200 m | Small/Medium/Large |
|---|
| Wood pigeon/ | 0.67–0.77 | 5/5 | 5/5 | 0/1 | 8/2/0 |
| Columba palumbus | | | | | |
| Common buzzard/ | 1.10–1.30 | 6/6 | 4/4 | - | 5/3/2 |
| Buteo | | | | | |
| Raven/ | 1.15–1.30 | 24/24 | 18/19 | 22/28 | 14/22/30 |
| Corvus corax | | | | | |
| Marsh harrier/ | 1.15–1.40 | 2/2 | 1/1 | 1/1 | 2/1/1 |
| Circus aeruginosus | | | | | |
| Herring gull/ | 1.23–1.48 | 2/2 | 1/1 | - | 1/1/1 |
| Larus argentatus | | | | | |
| Red Kite/ | 1.40–1.65 | 1/1 | - | 1/1 | 0/2/0 |
| Milvus | | | | | |
| Crane/ | 1.80–2.22 | - | 2/2 | 1/2 | 0/1/2 |
| Grus | | | | | |


