Author Contributions
Conceptualization, C.A.C., D.G.; Methodology, X.L., T.S., C.A.C., D.G.; Software, X.L.; Validation, X.L.; Formal Analysis, X.L.; Investigation, T.S., M.-C.N., T.S.; Resources, S.R.; Data Curation, X.L.; Writing–Original Draft Preparation, X.L.; Writing–Review and Editing, X.L., C.A.C., M.-C.N., S.R., T.S., D.G.; Visualization, X.L.; Supervision, C.A.C., D.G., S.R., T.S.; Project Administration, C.A.C.; Funding Acquisition, S.R., C.A.C. All authors have read and agreed to the published version of the manuscript.
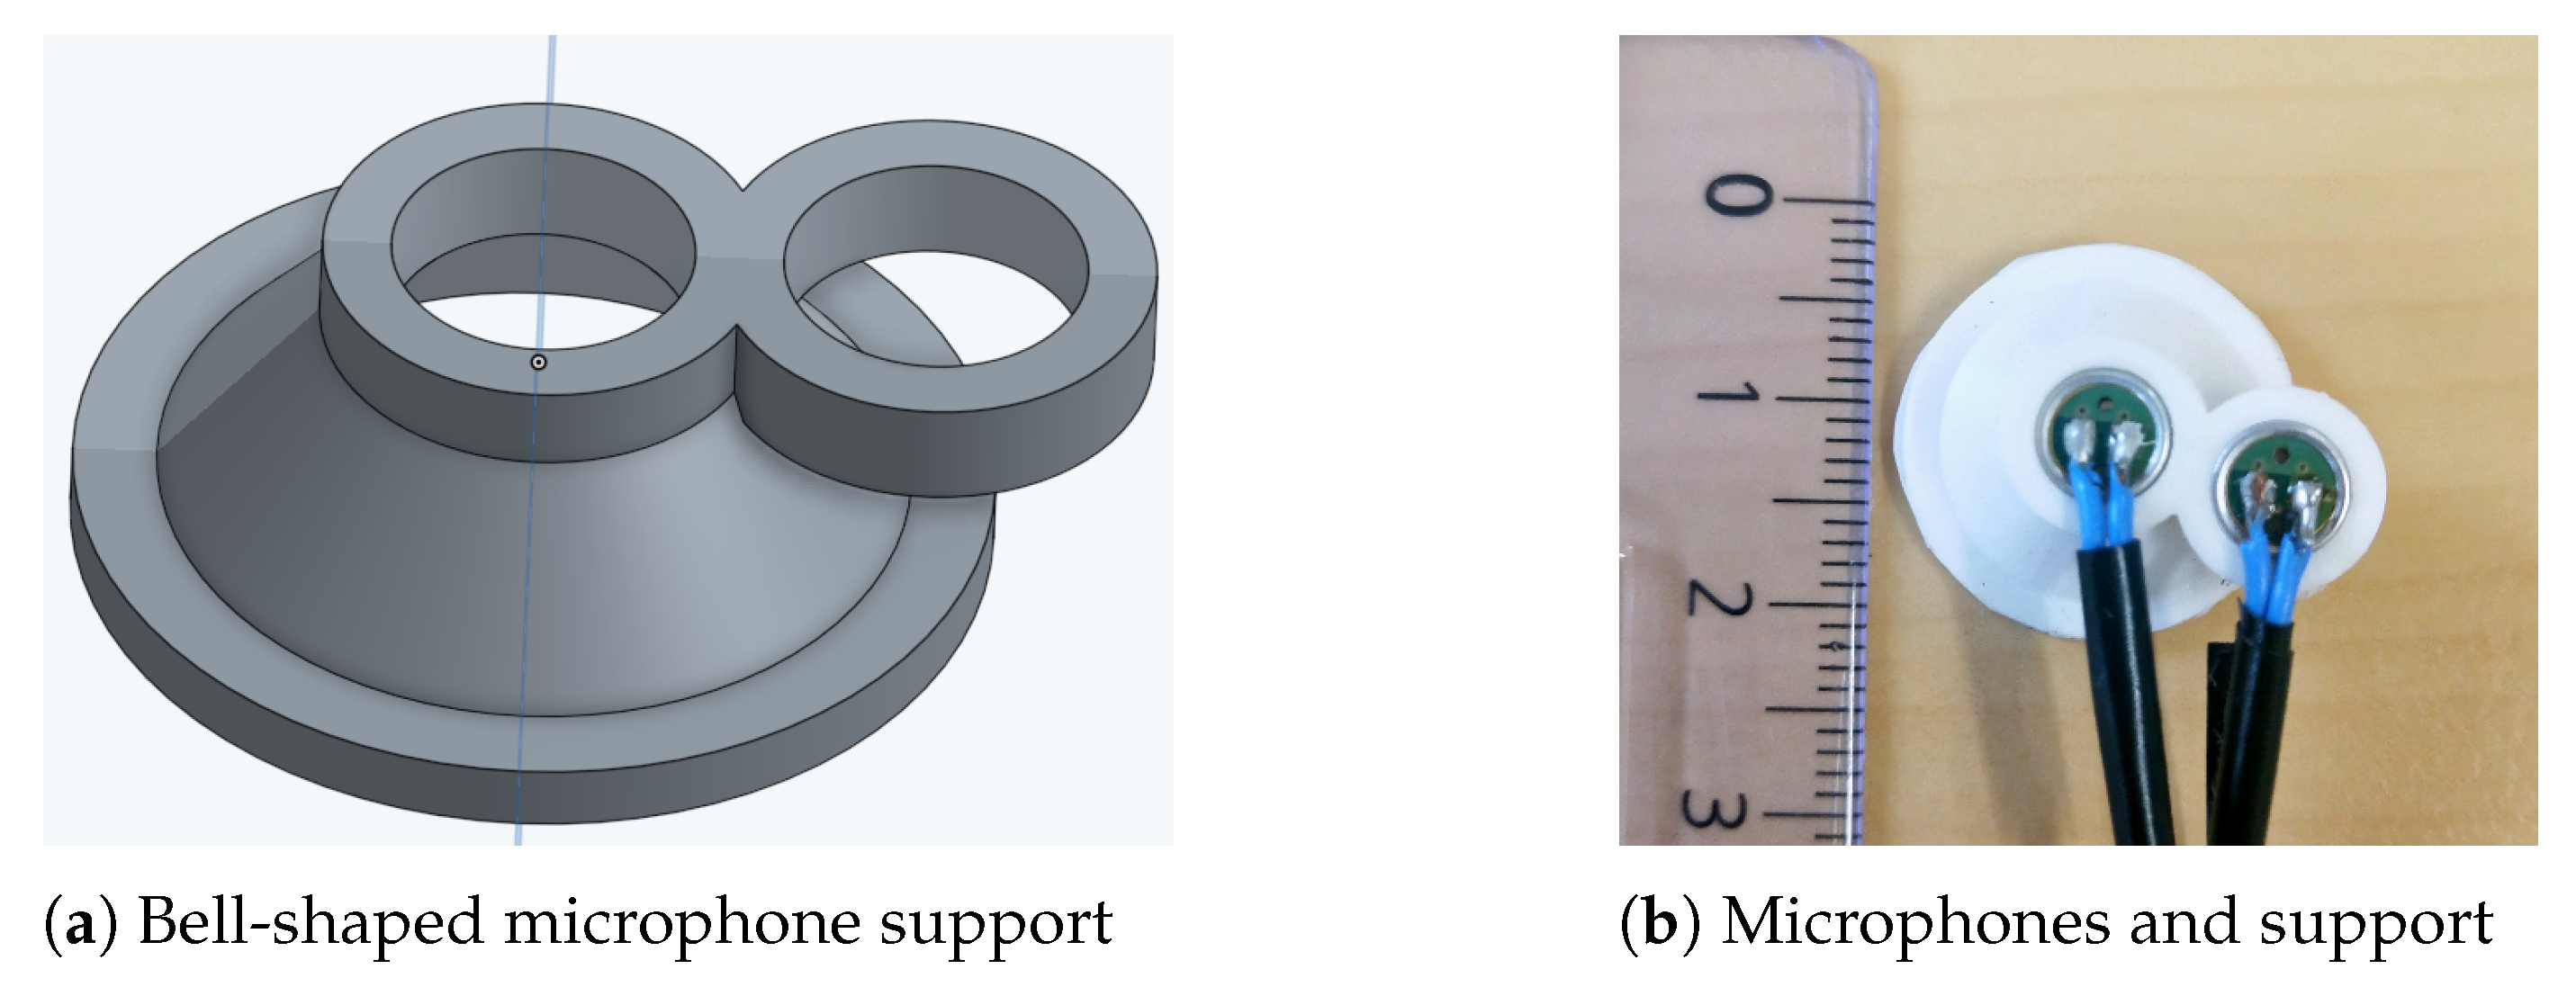
Figure 1.
Illustration of the microphone setup.
Figure 1.
Illustration of the microphone setup.
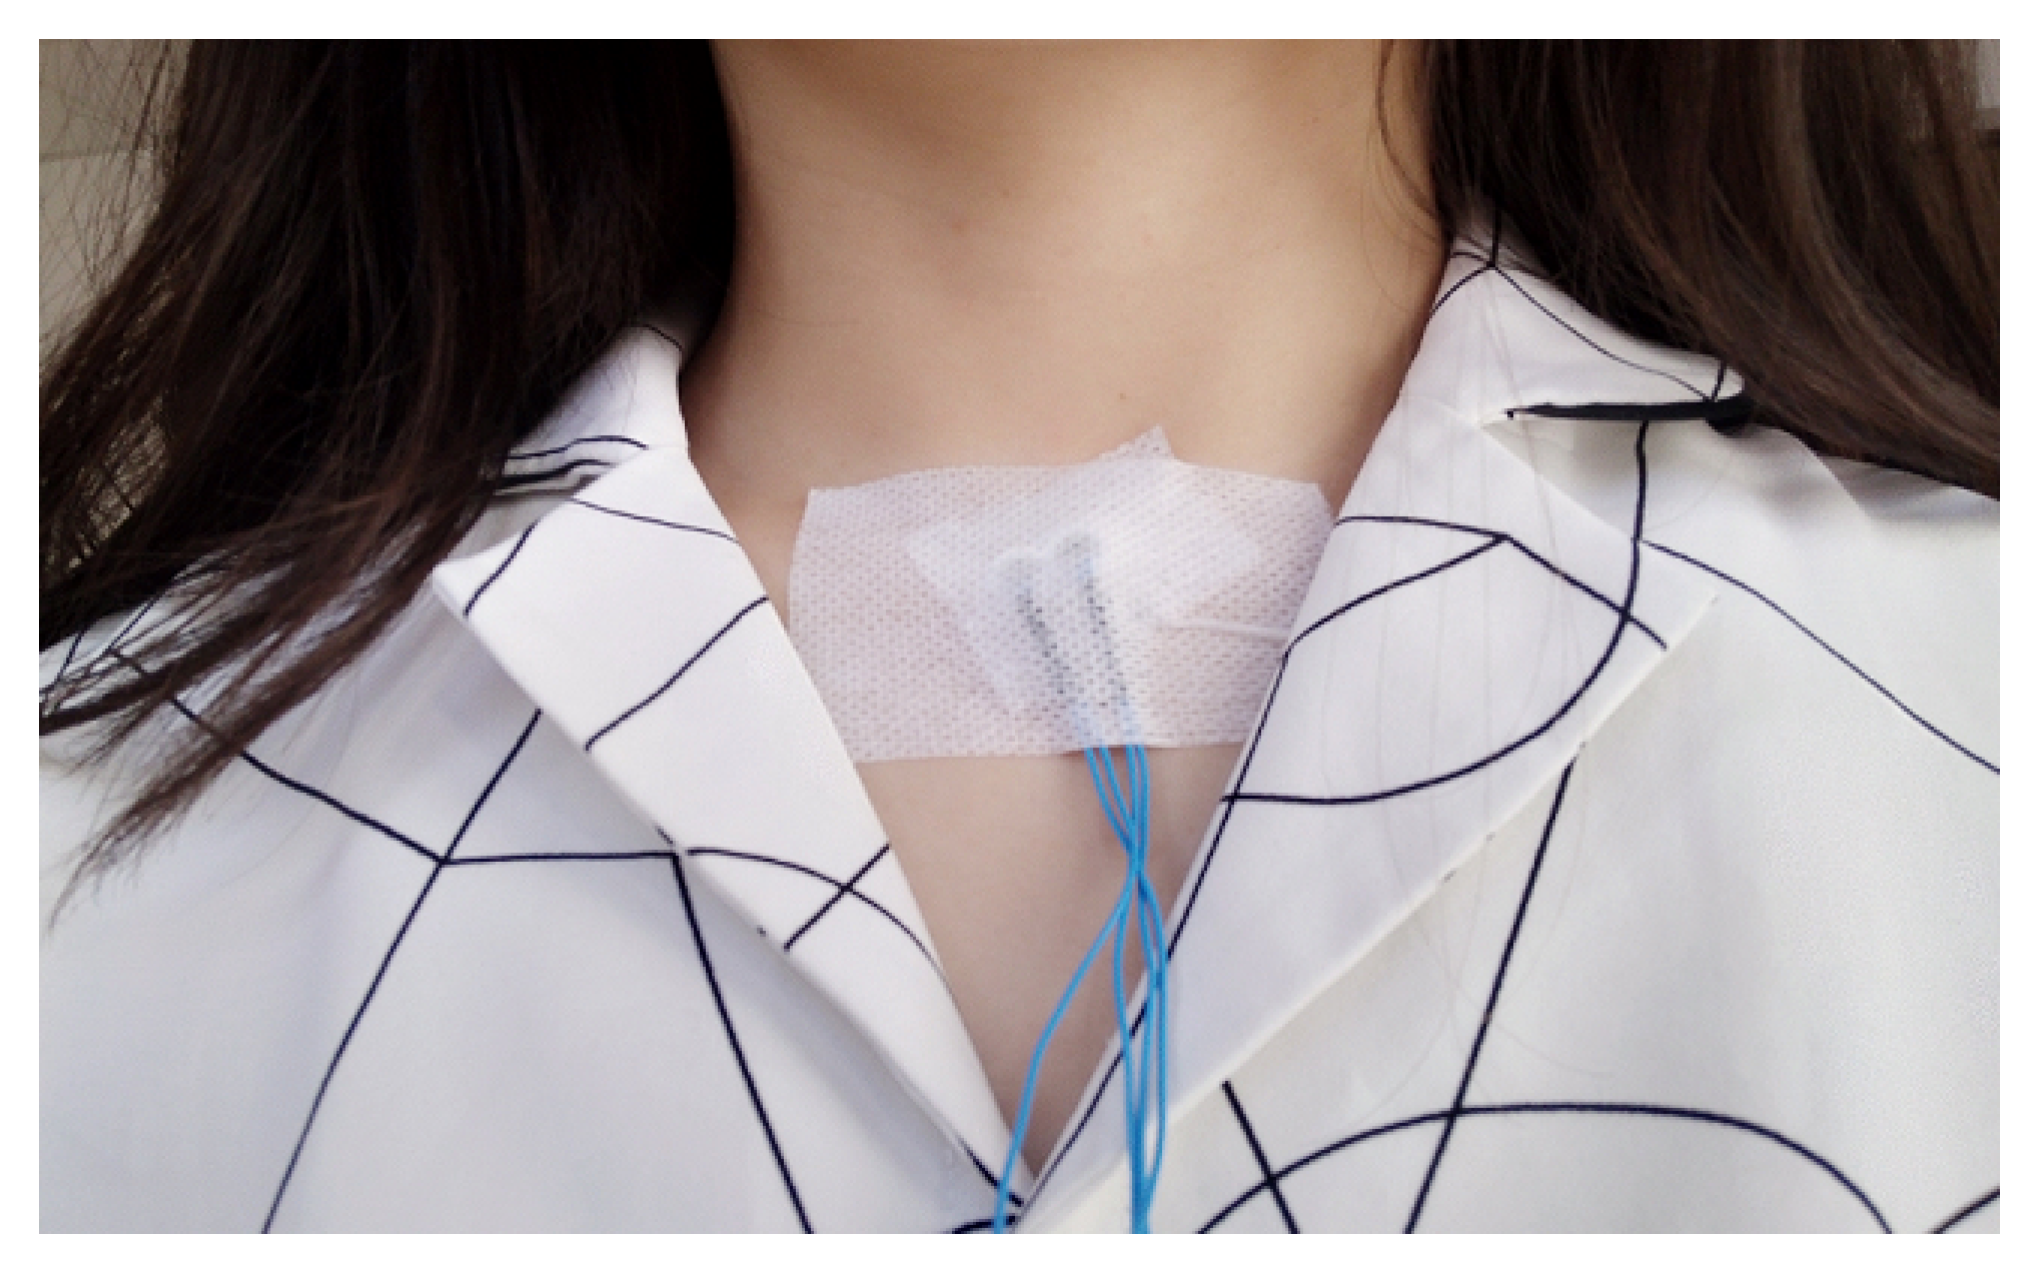
Figure 2.
Position of the microphones: two microphones are inserted into the support that is fixed at suprasternal notch with two strips of adhesive tape.
Figure 2.
Position of the microphones: two microphones are inserted into the support that is fixed at suprasternal notch with two strips of adhesive tape.
Figure 3.
Recording procedure: 0–60 s normal respiration (NR); 60–70 s apnea (holding breathing spontaneously, AP); 70–100 s normal respiration + speech (RS); 100–120 s normal respiration + environmental noise (RN).
Figure 3.
Recording procedure: 0–60 s normal respiration (NR); 60–70 s apnea (holding breathing spontaneously, AP); 70–100 s normal respiration + speech (RS); 100–120 s normal respiration + environmental noise (RN).
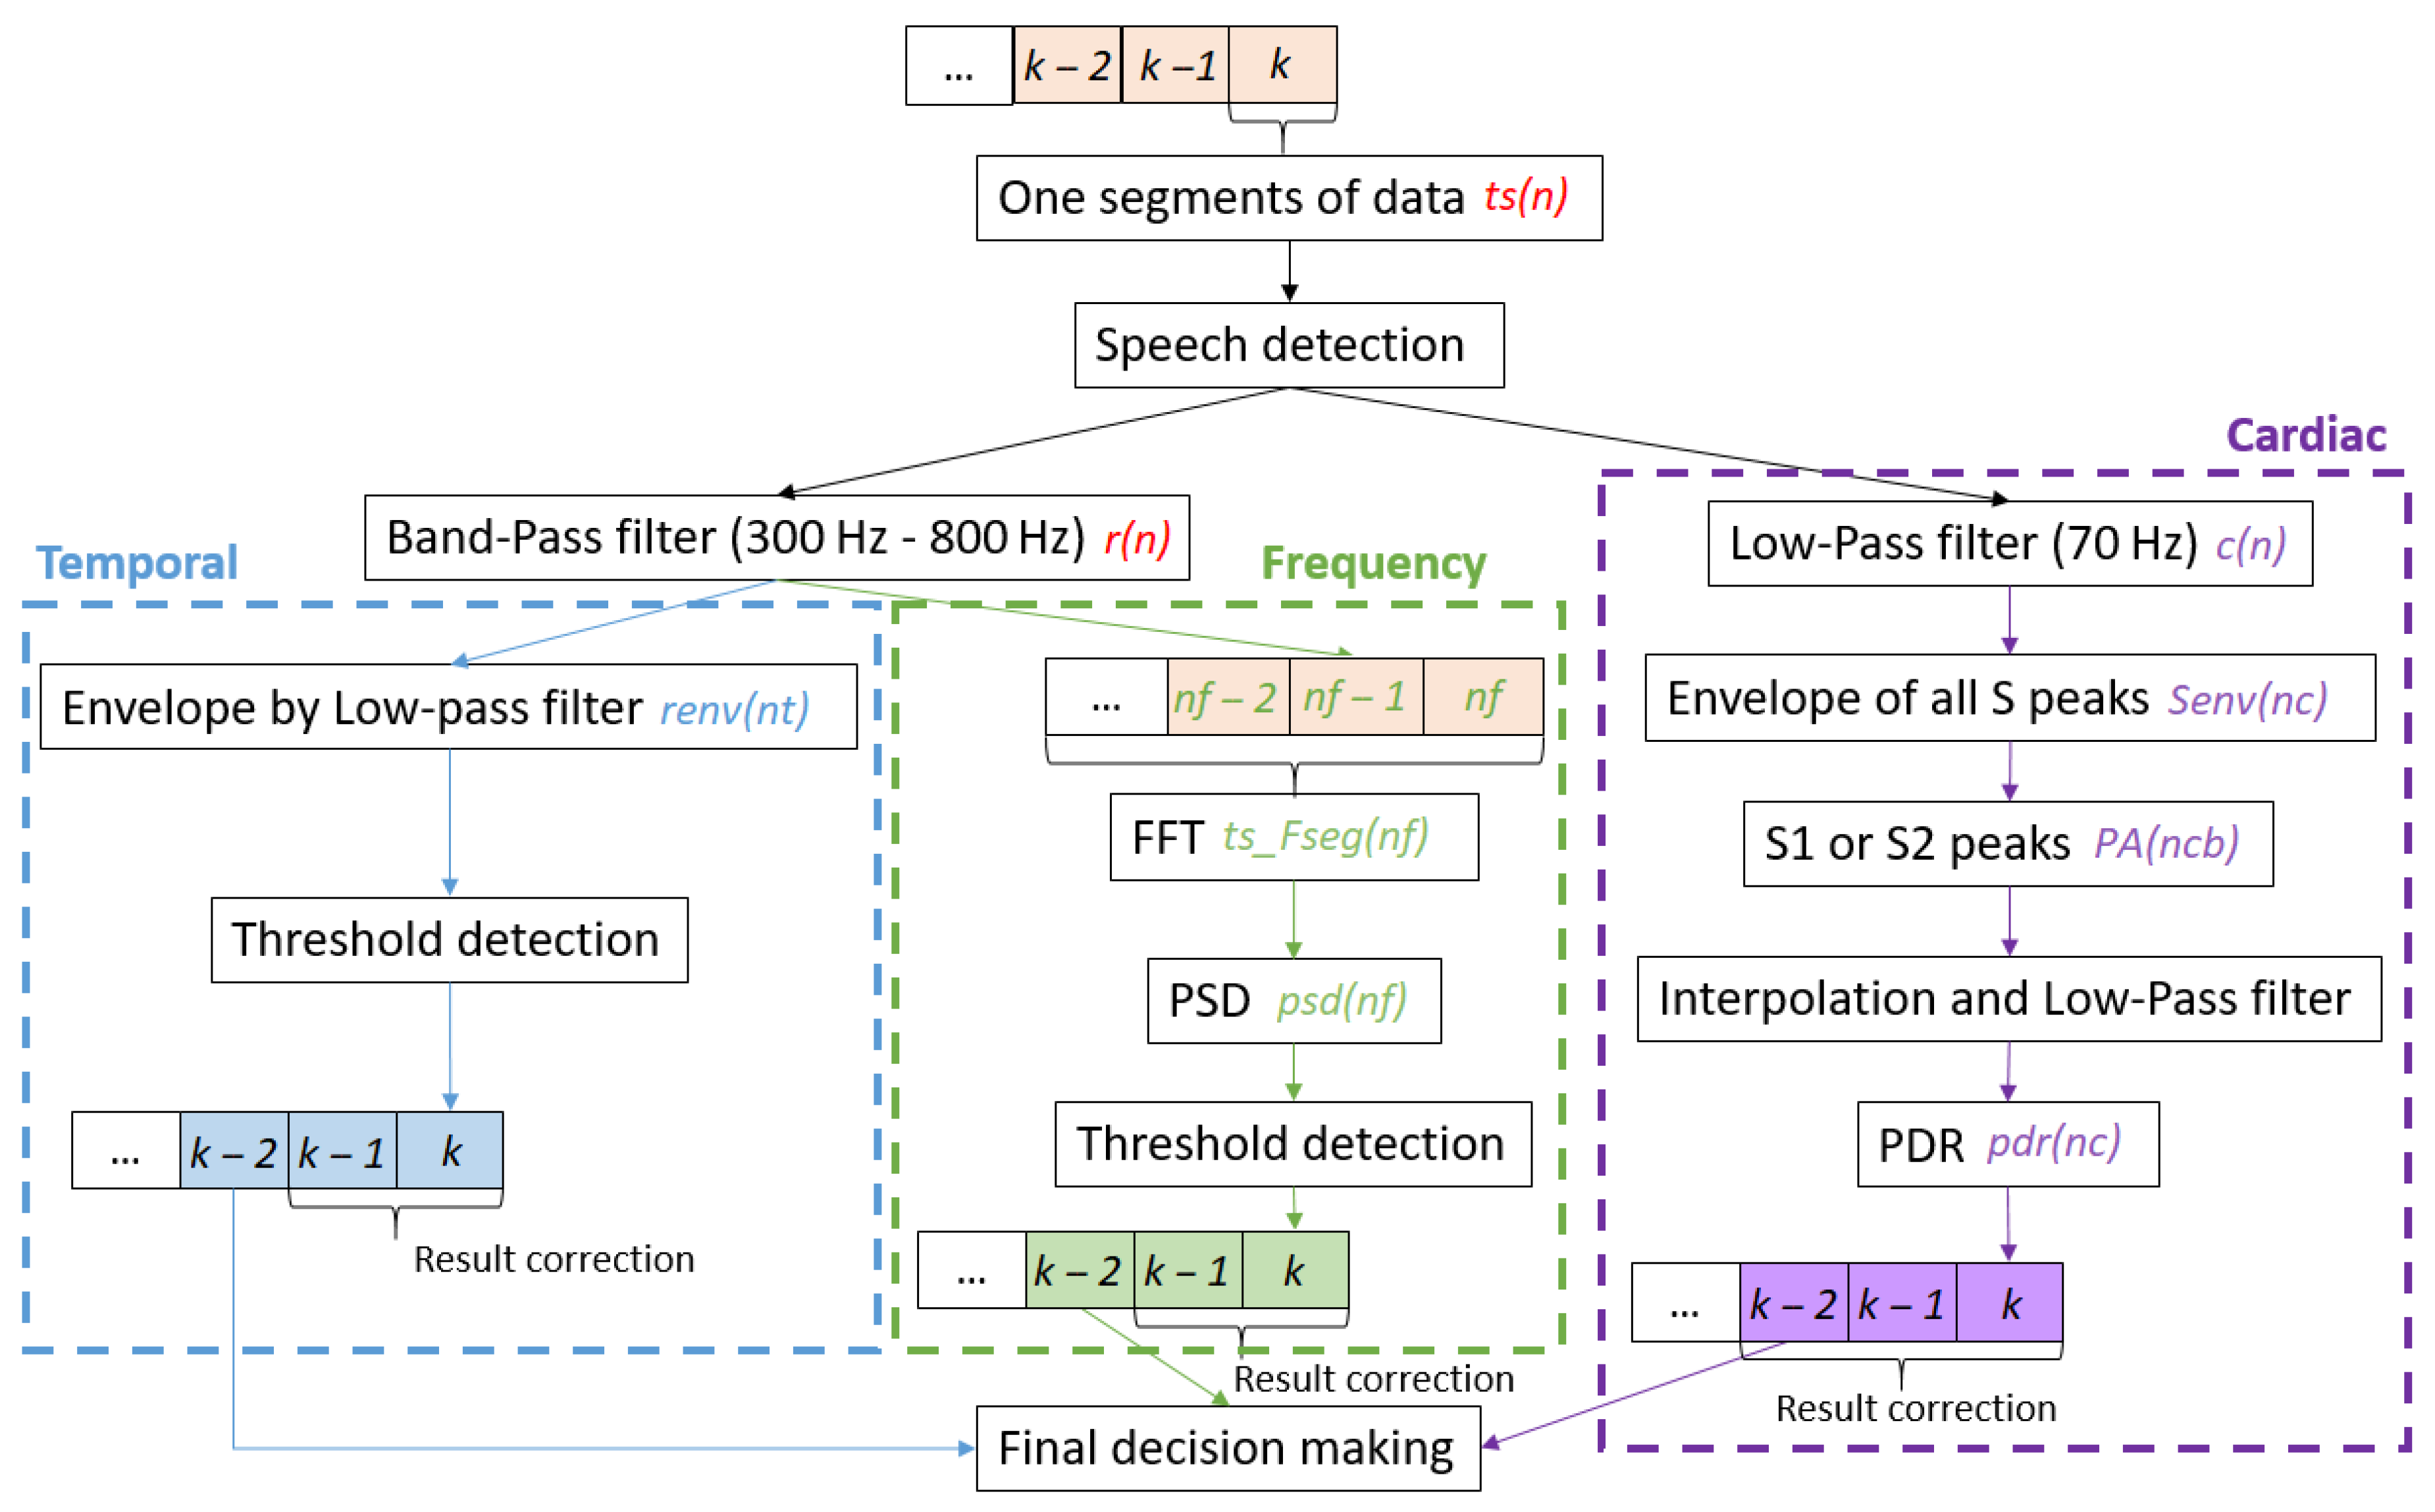
Figure 4.
Diagram of the detection algorithm.
Figure 4.
Diagram of the detection algorithm.
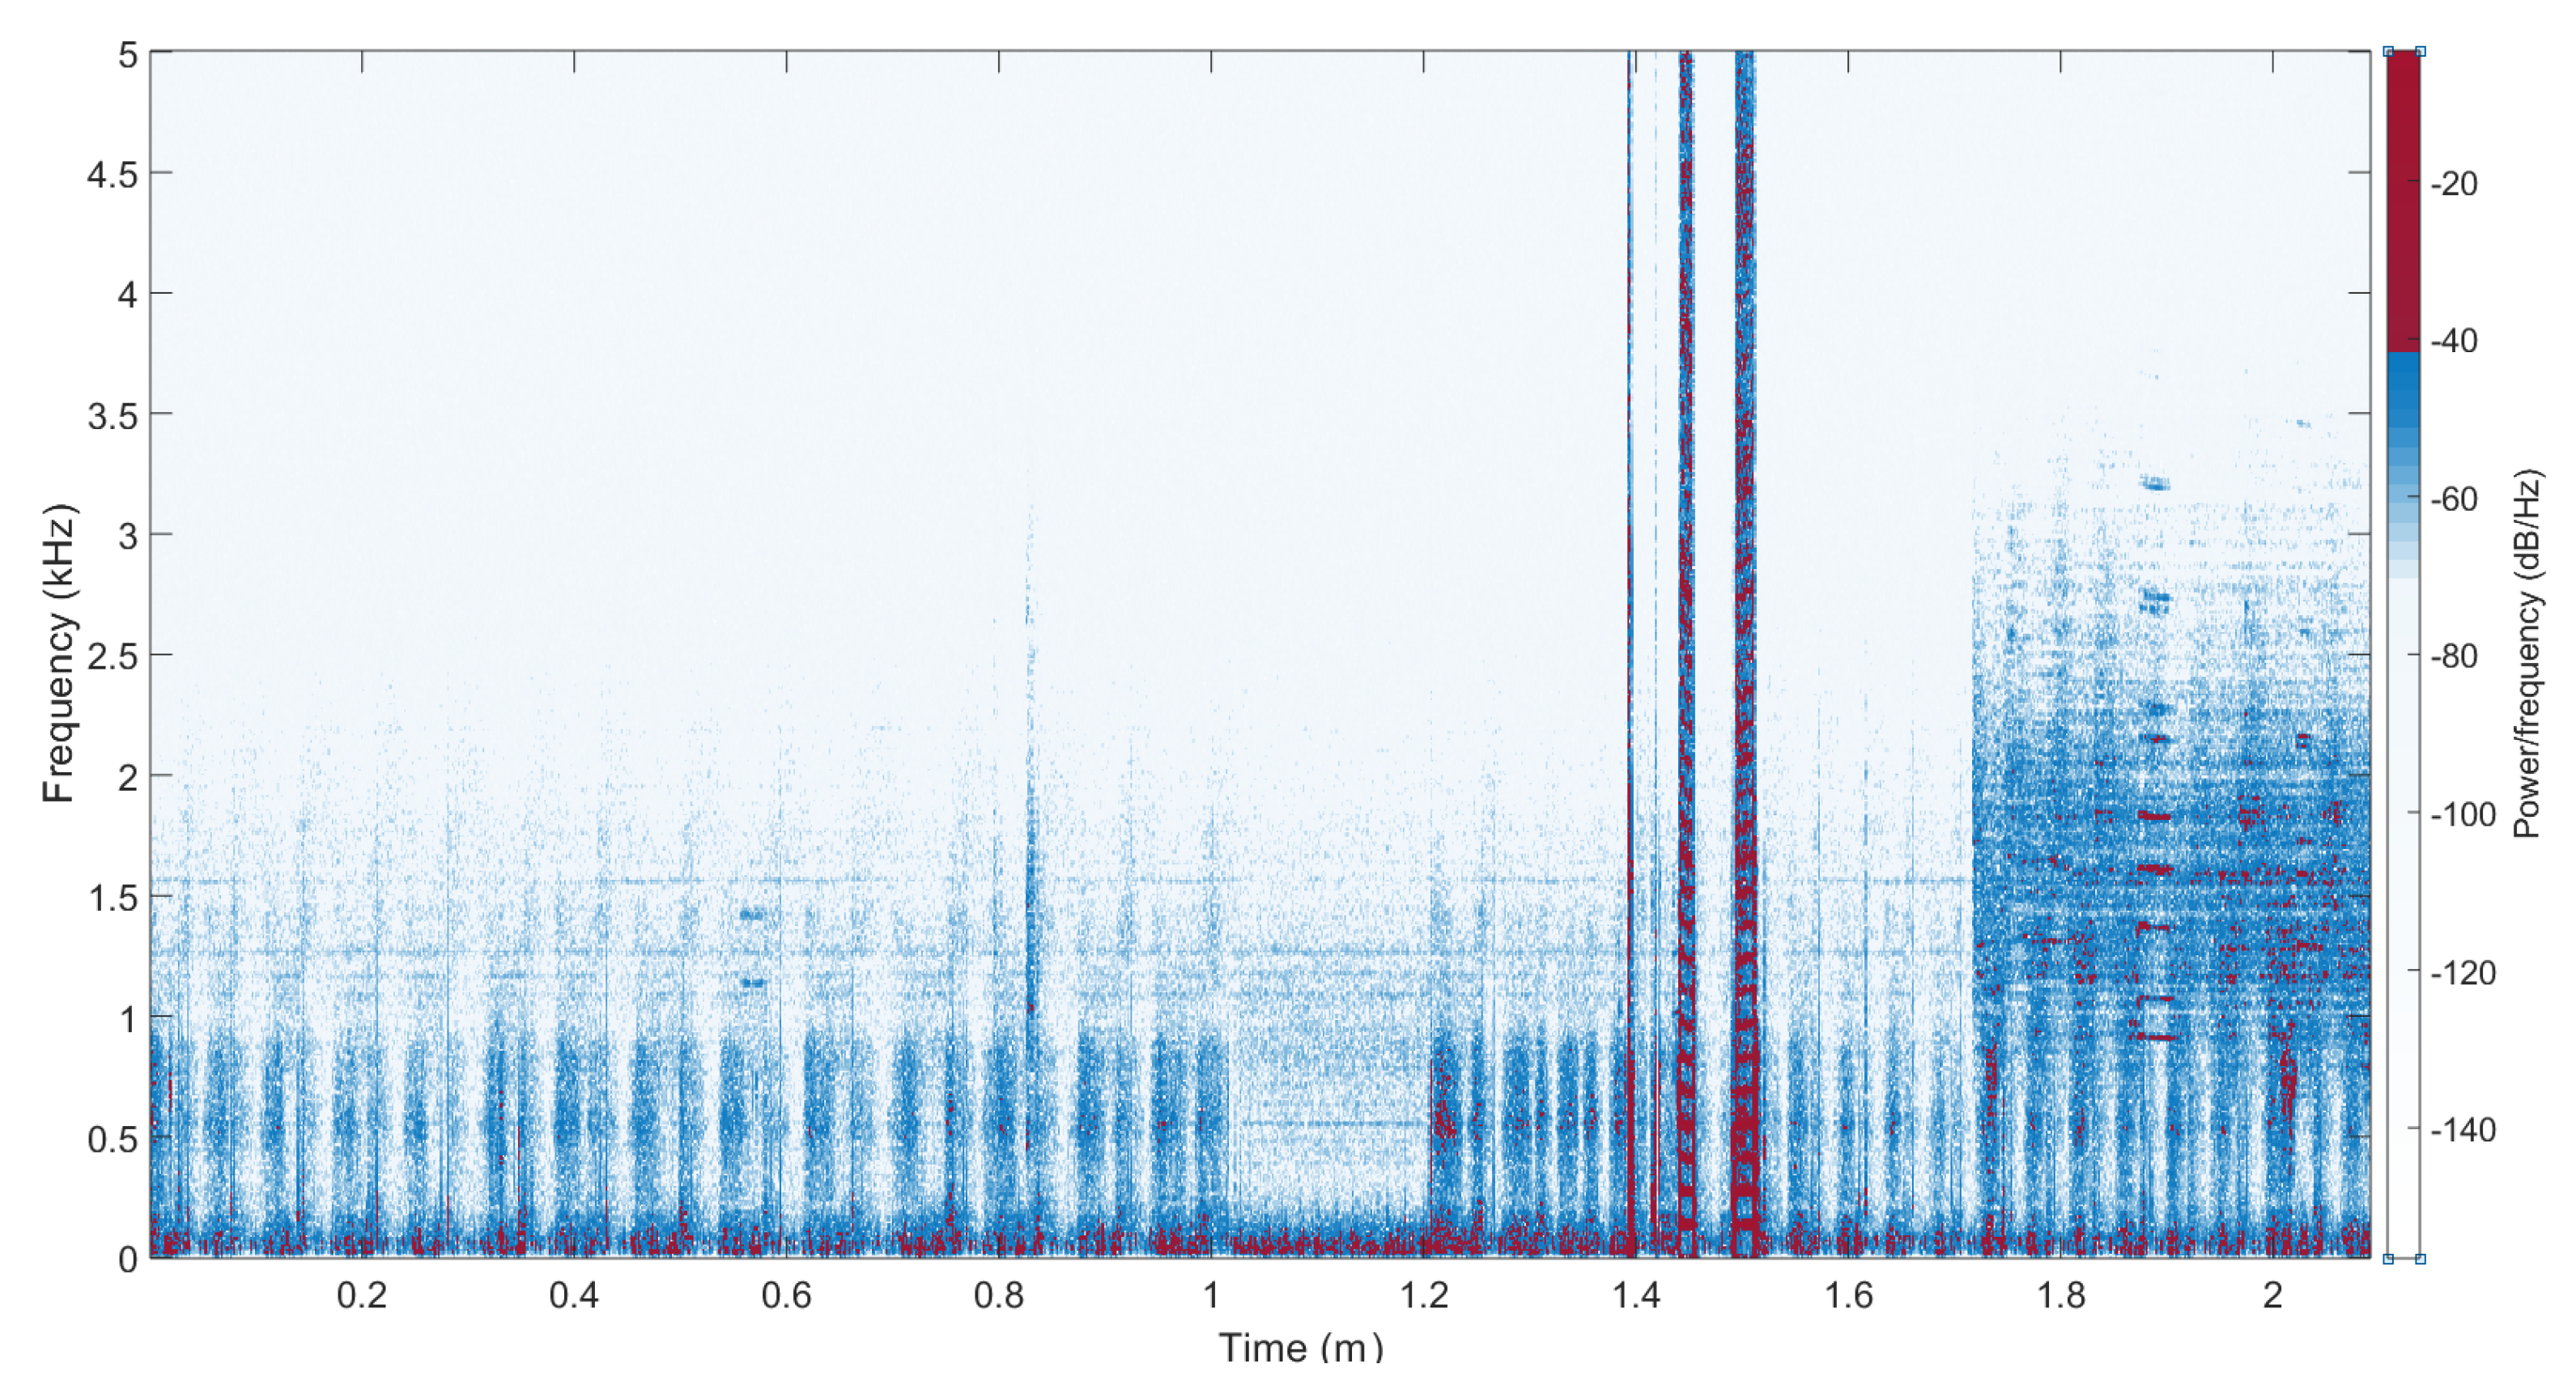
Figure 5.
The spectrogram for one recording.
Figure 5.
The spectrogram for one recording.
Figure 6.
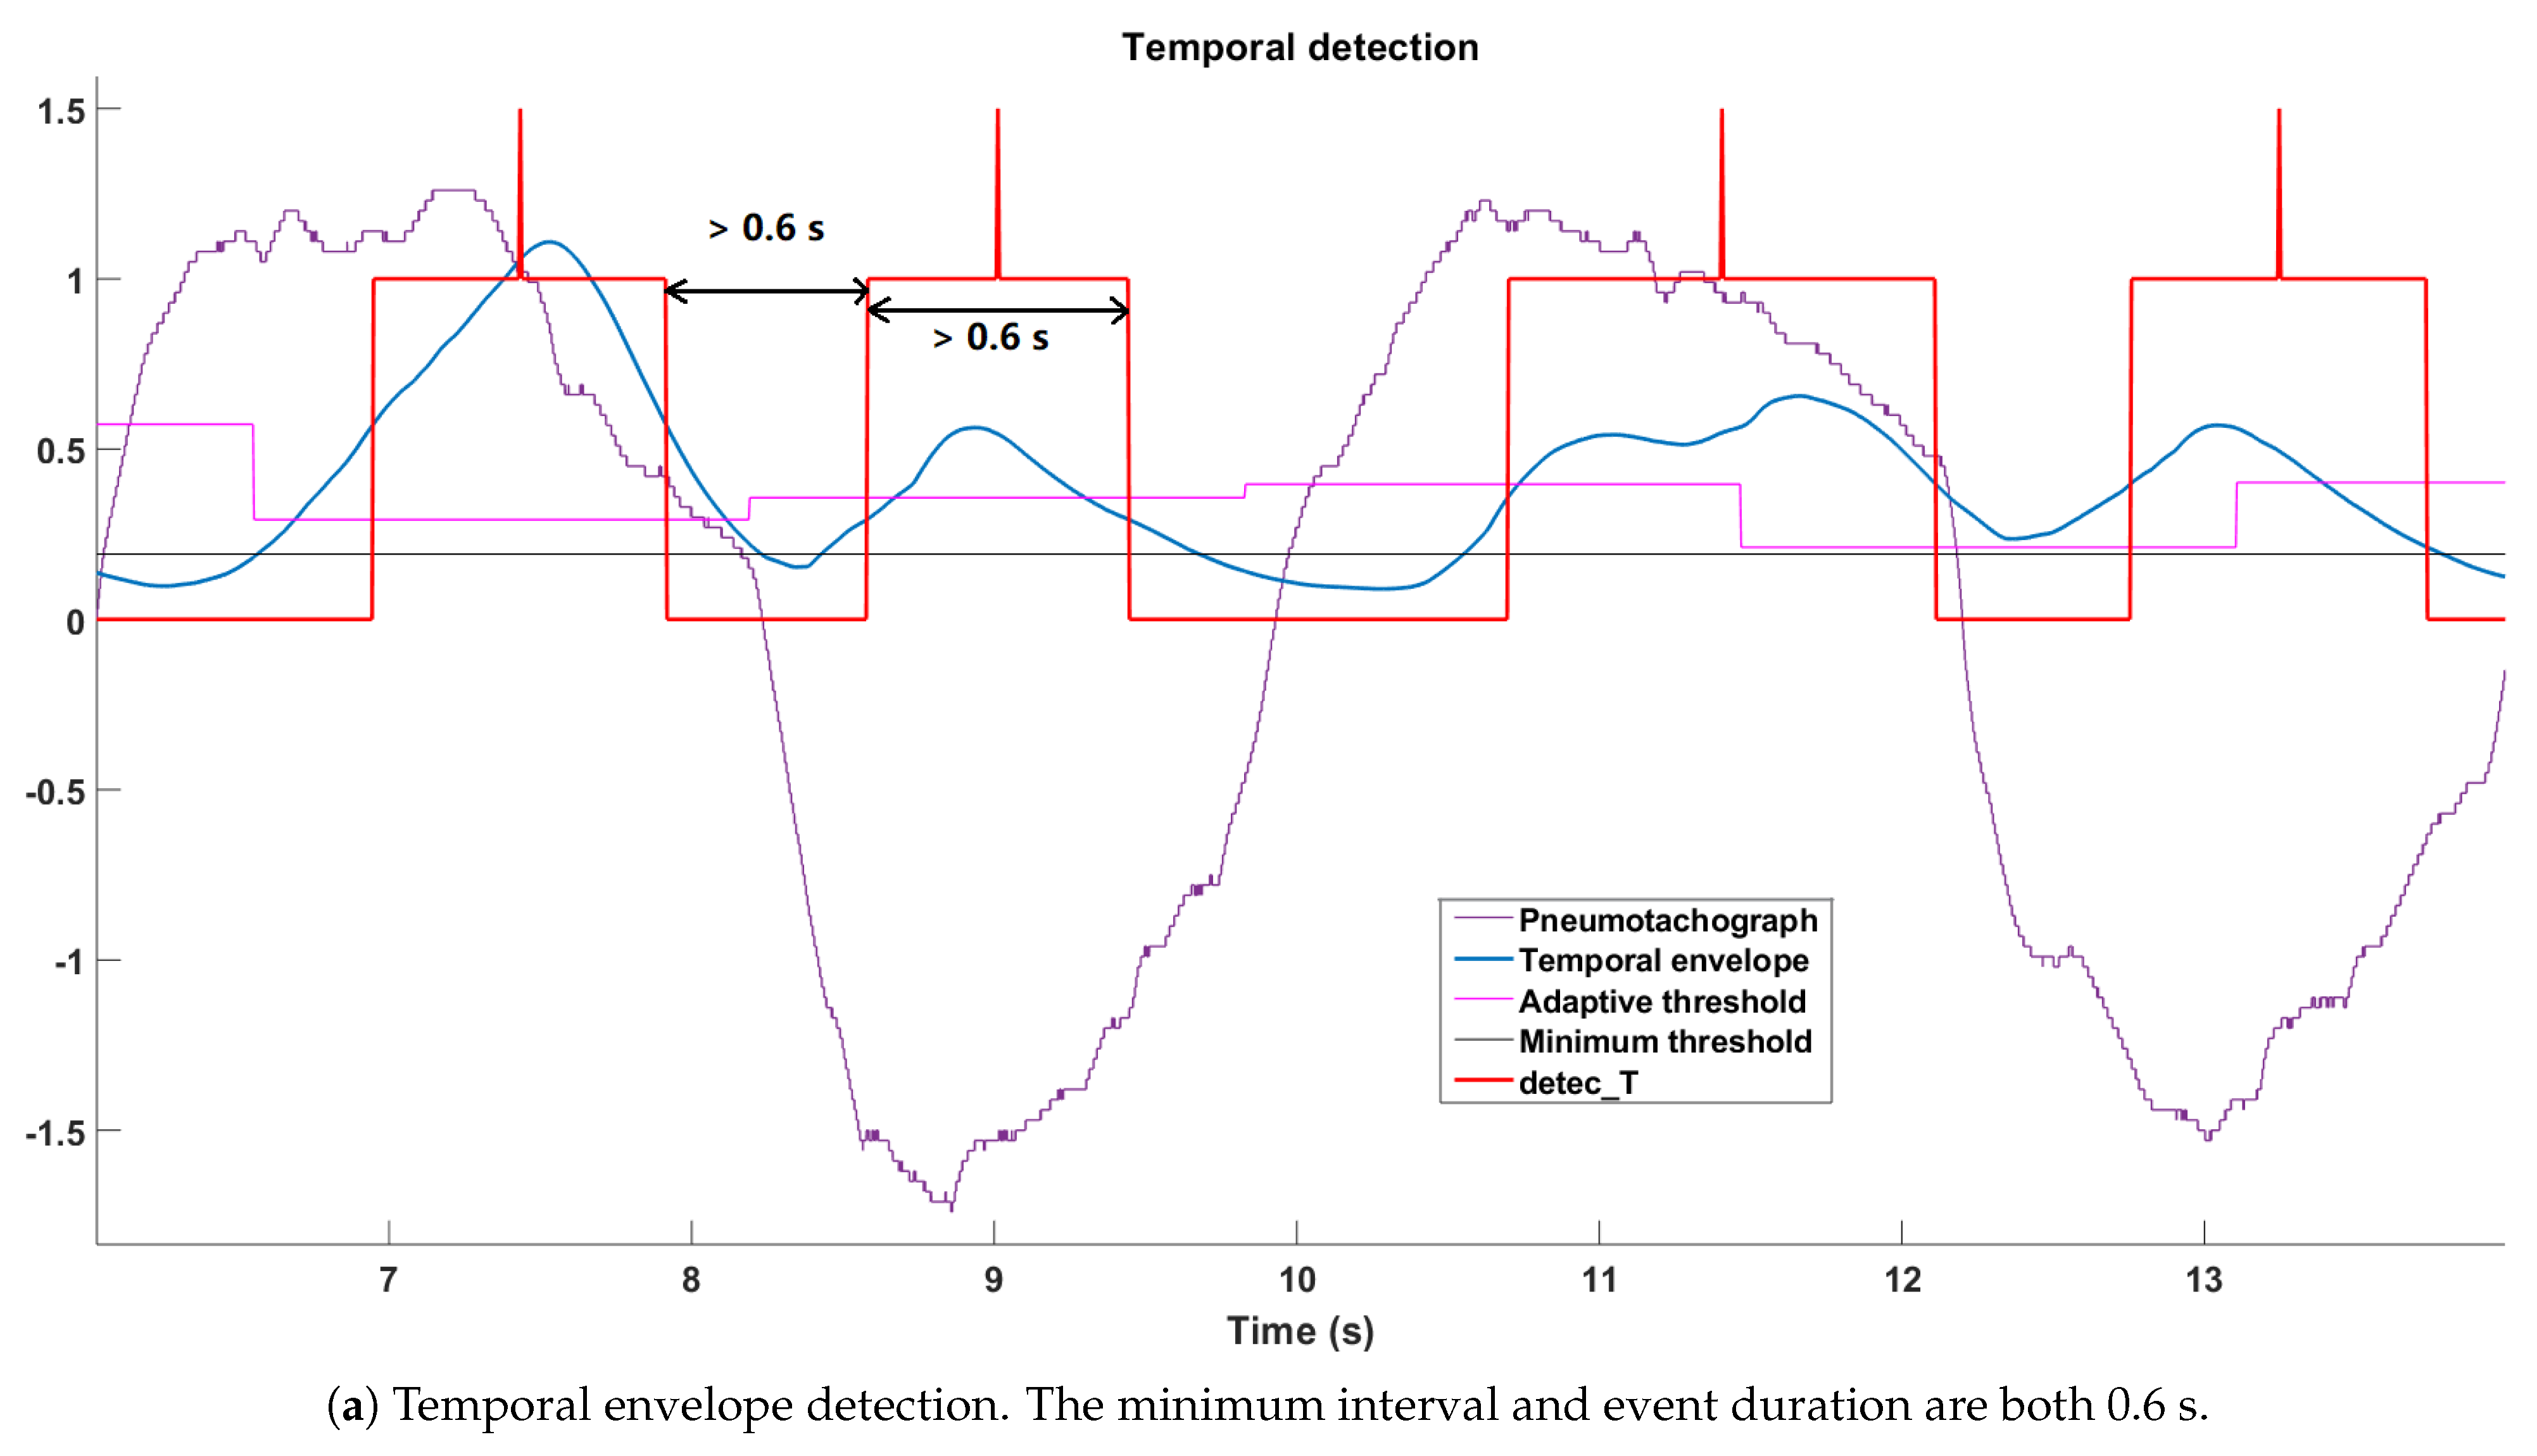
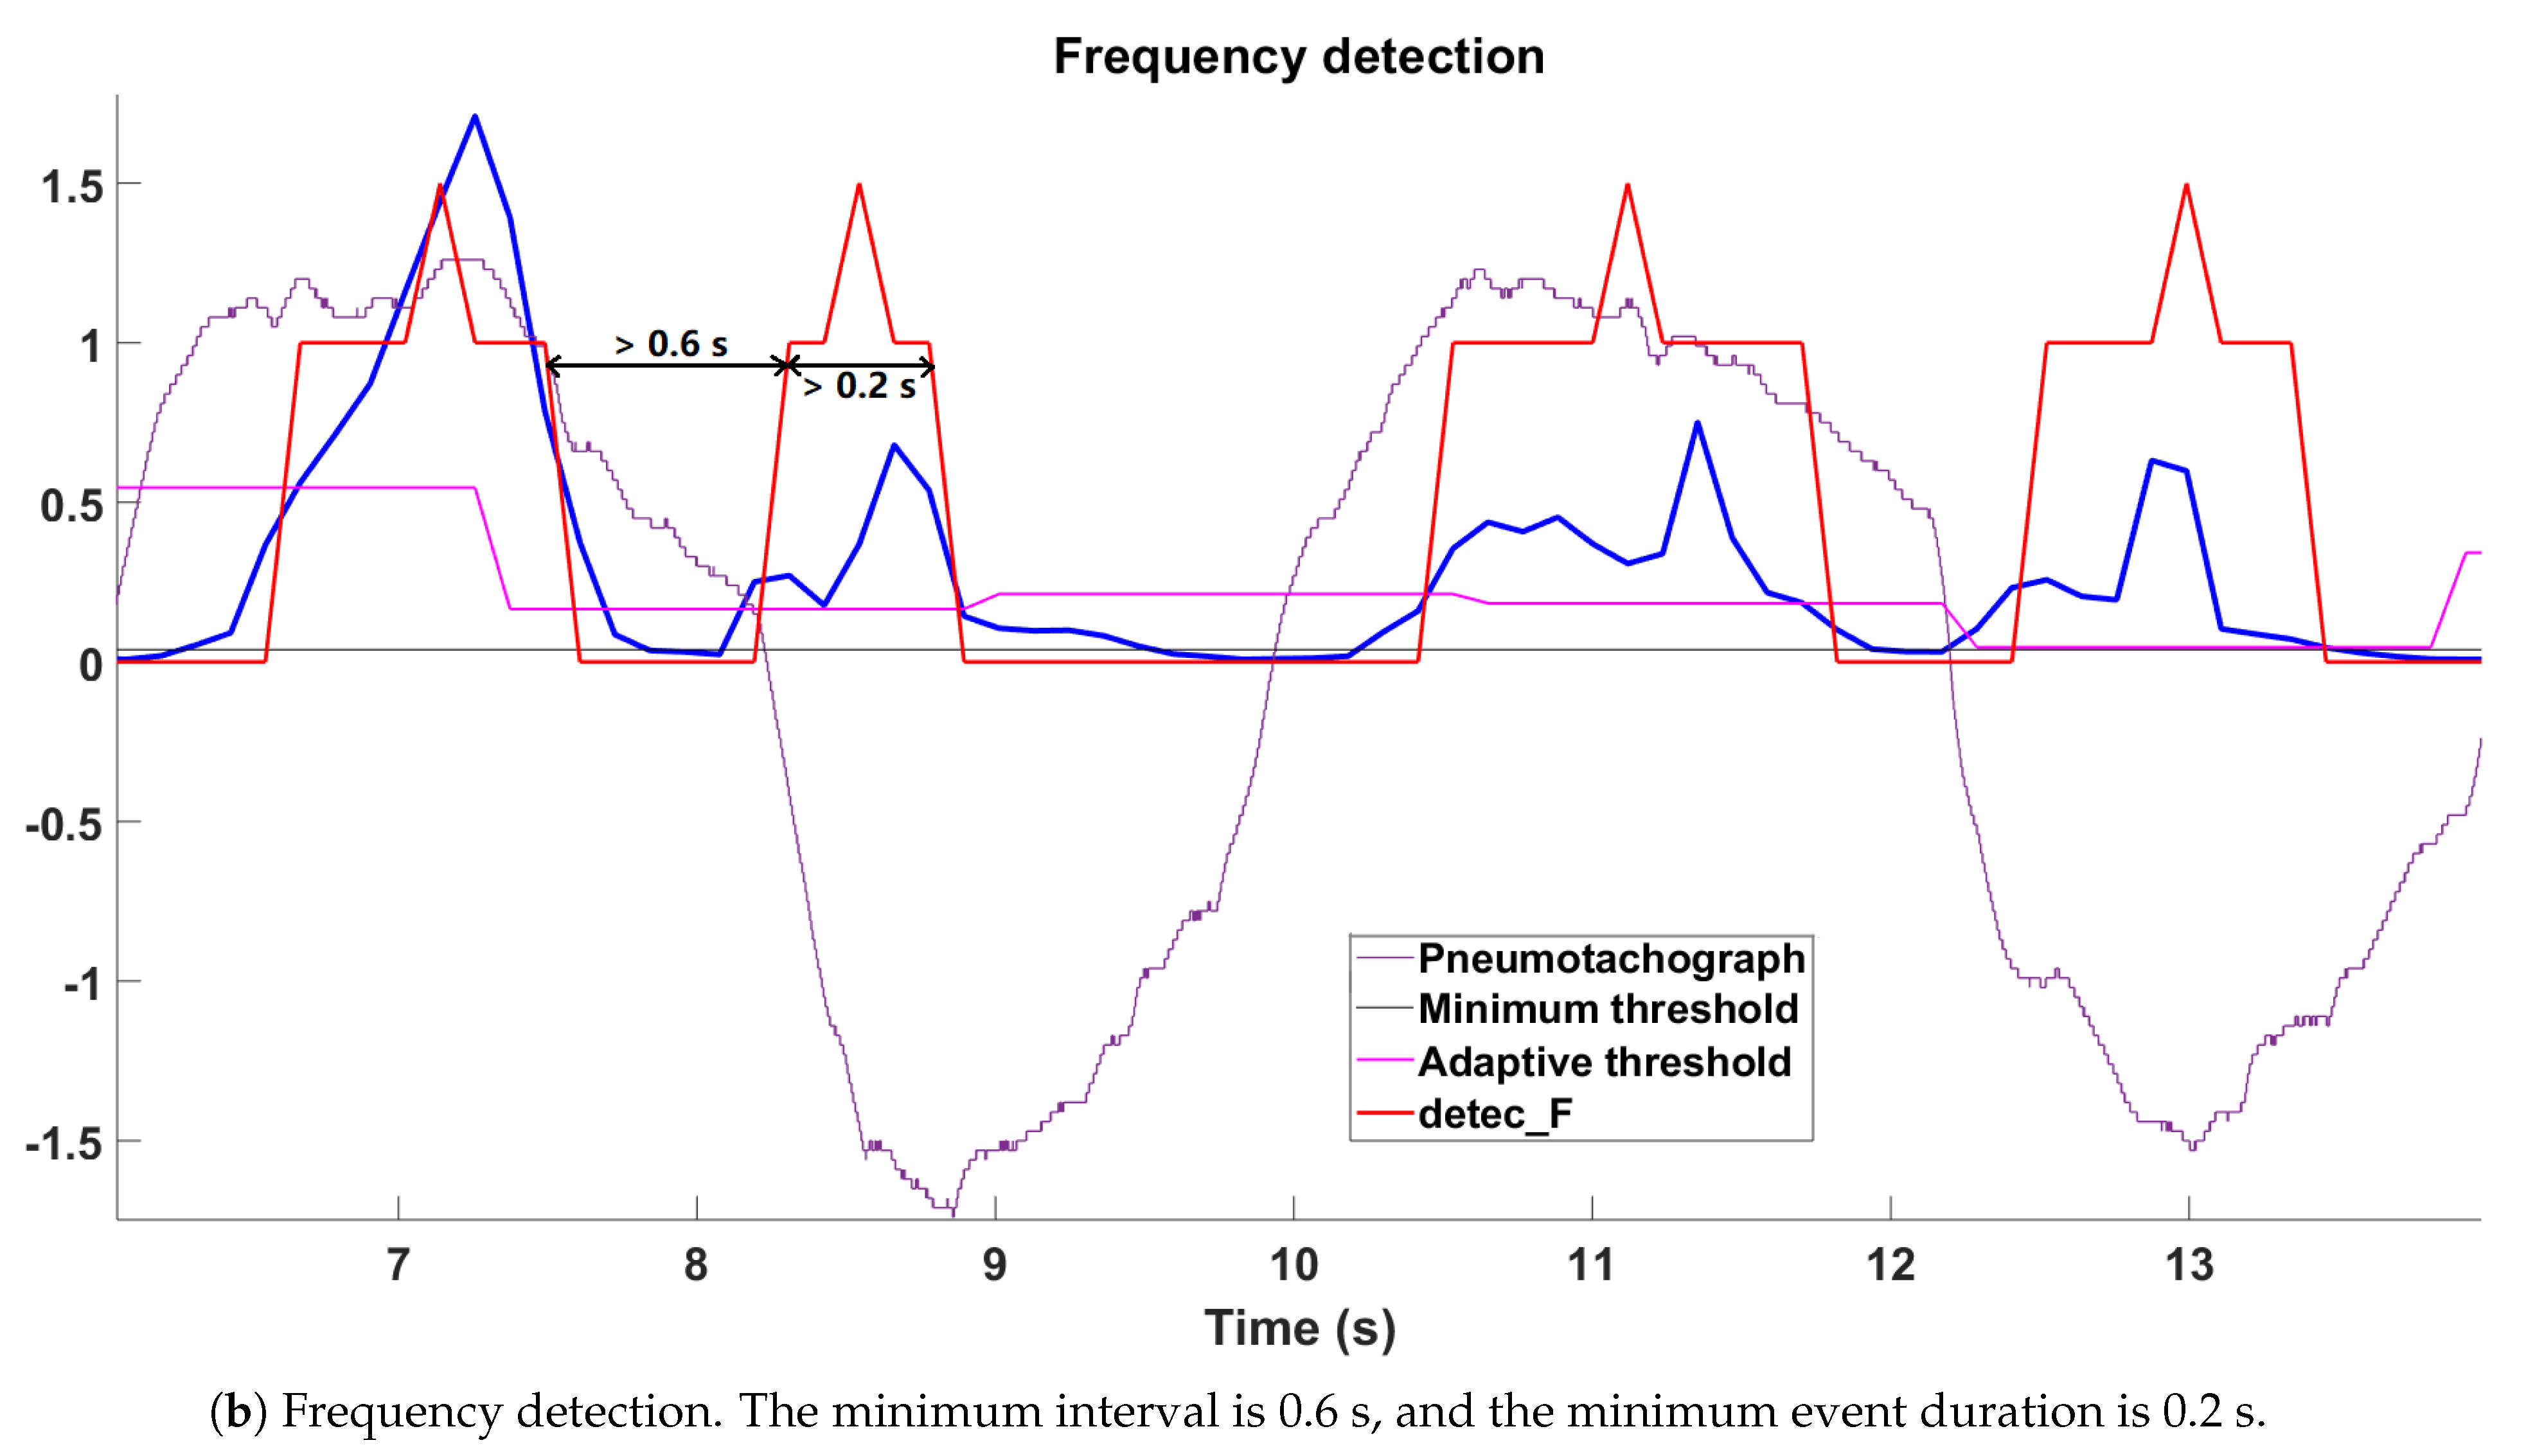
Temporal and frequency detection result of the same period from the same recording. A positive (resp. negative) pneumotachograph reference signal (purple) indicates inspiration (resp. expiration). The adaptive (pink) and minimum thresholds (gray) are marked in the figure. The envelope signal (temporal or PSD) is in blue, and the final detection result is in red with the peak “middle-timing moment”.
Figure 6.
Temporal and frequency detection result of the same period from the same recording. A positive (resp. negative) pneumotachograph reference signal (purple) indicates inspiration (resp. expiration). The adaptive (pink) and minimum thresholds (gray) are marked in the figure. The envelope signal (temporal or PSD) is in blue, and the final detection result is in red with the peak “middle-timing moment”.
Figure 7.
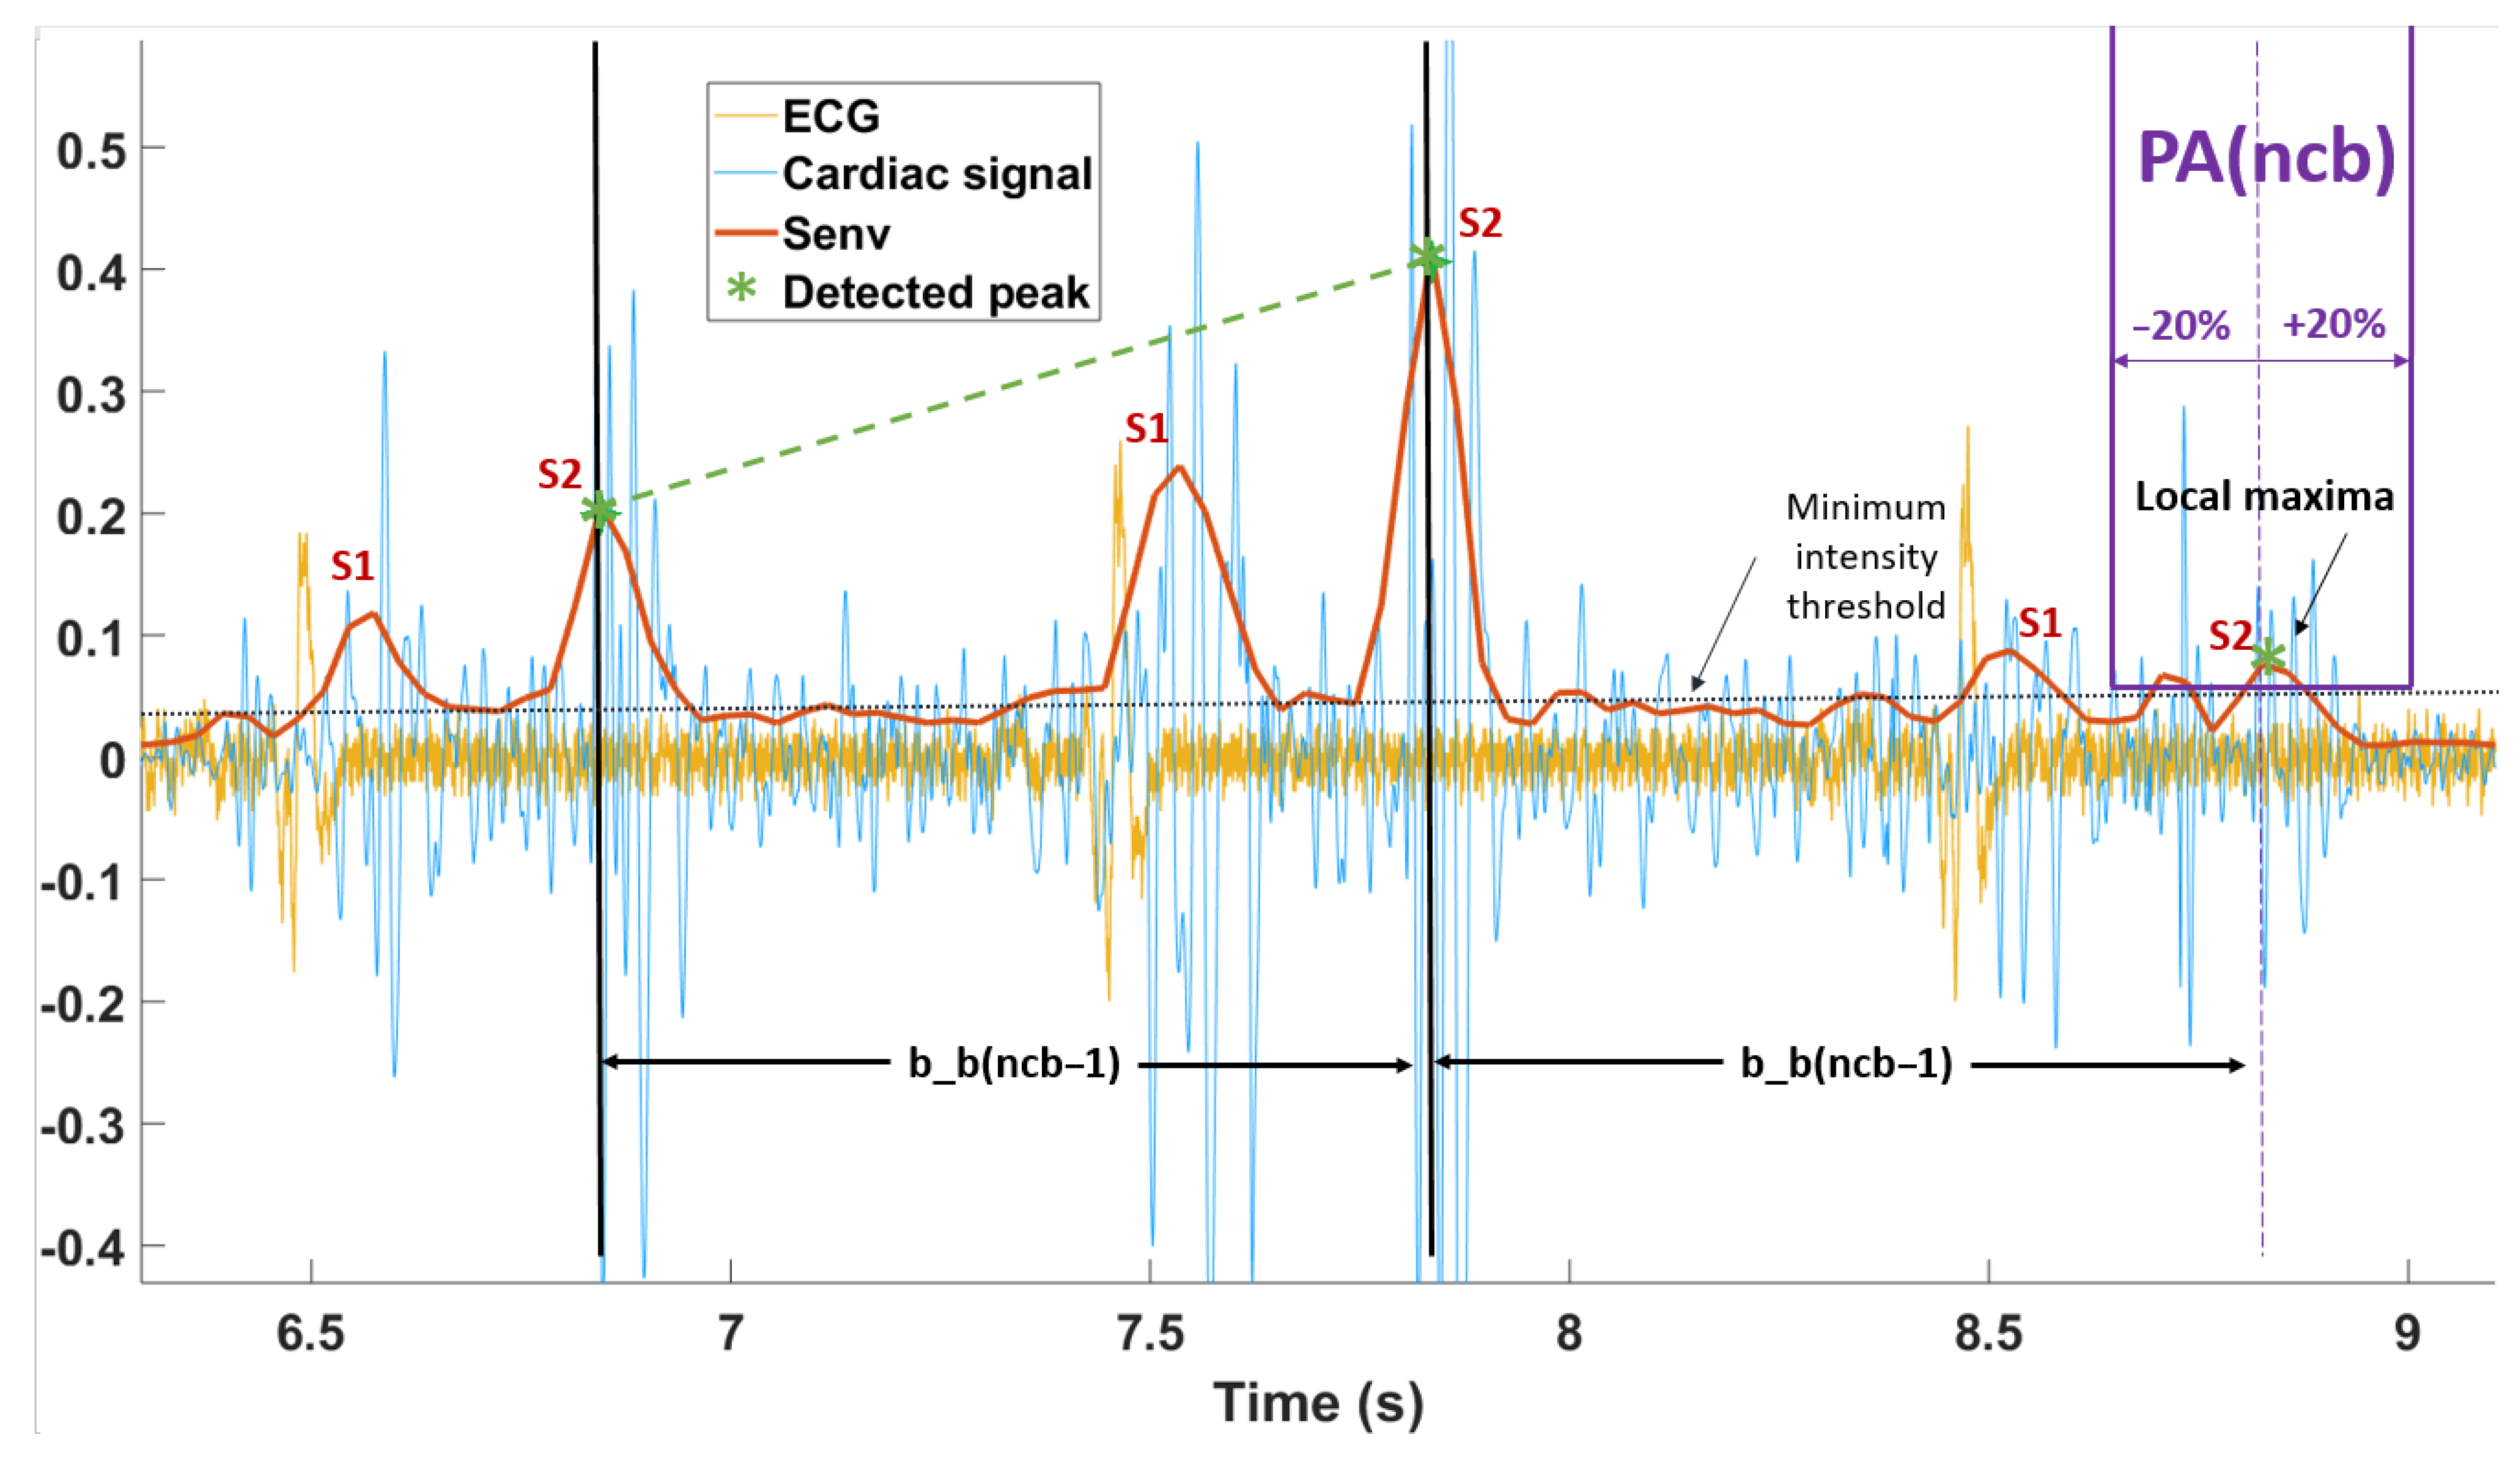
Cardiac S peak detection. There is a small delay between the electrocardiogram (ECG) (yellow) and the extracted cardiac signal (blue). Predicting area PA(ncb) (purple) defined by of last heart beat-to-beat interval and the adaptive threshold. The cardiac envelogram is in red, and the detected cardiac peak (S1/S2) is marked by a green star.
Figure 7.
Cardiac S peak detection. There is a small delay between the electrocardiogram (ECG) (yellow) and the extracted cardiac signal (blue). Predicting area PA(ncb) (purple) defined by of last heart beat-to-beat interval and the adaptive threshold. The cardiac envelogram is in red, and the detected cardiac peak (S1/S2) is marked by a green star.
Figure 8.
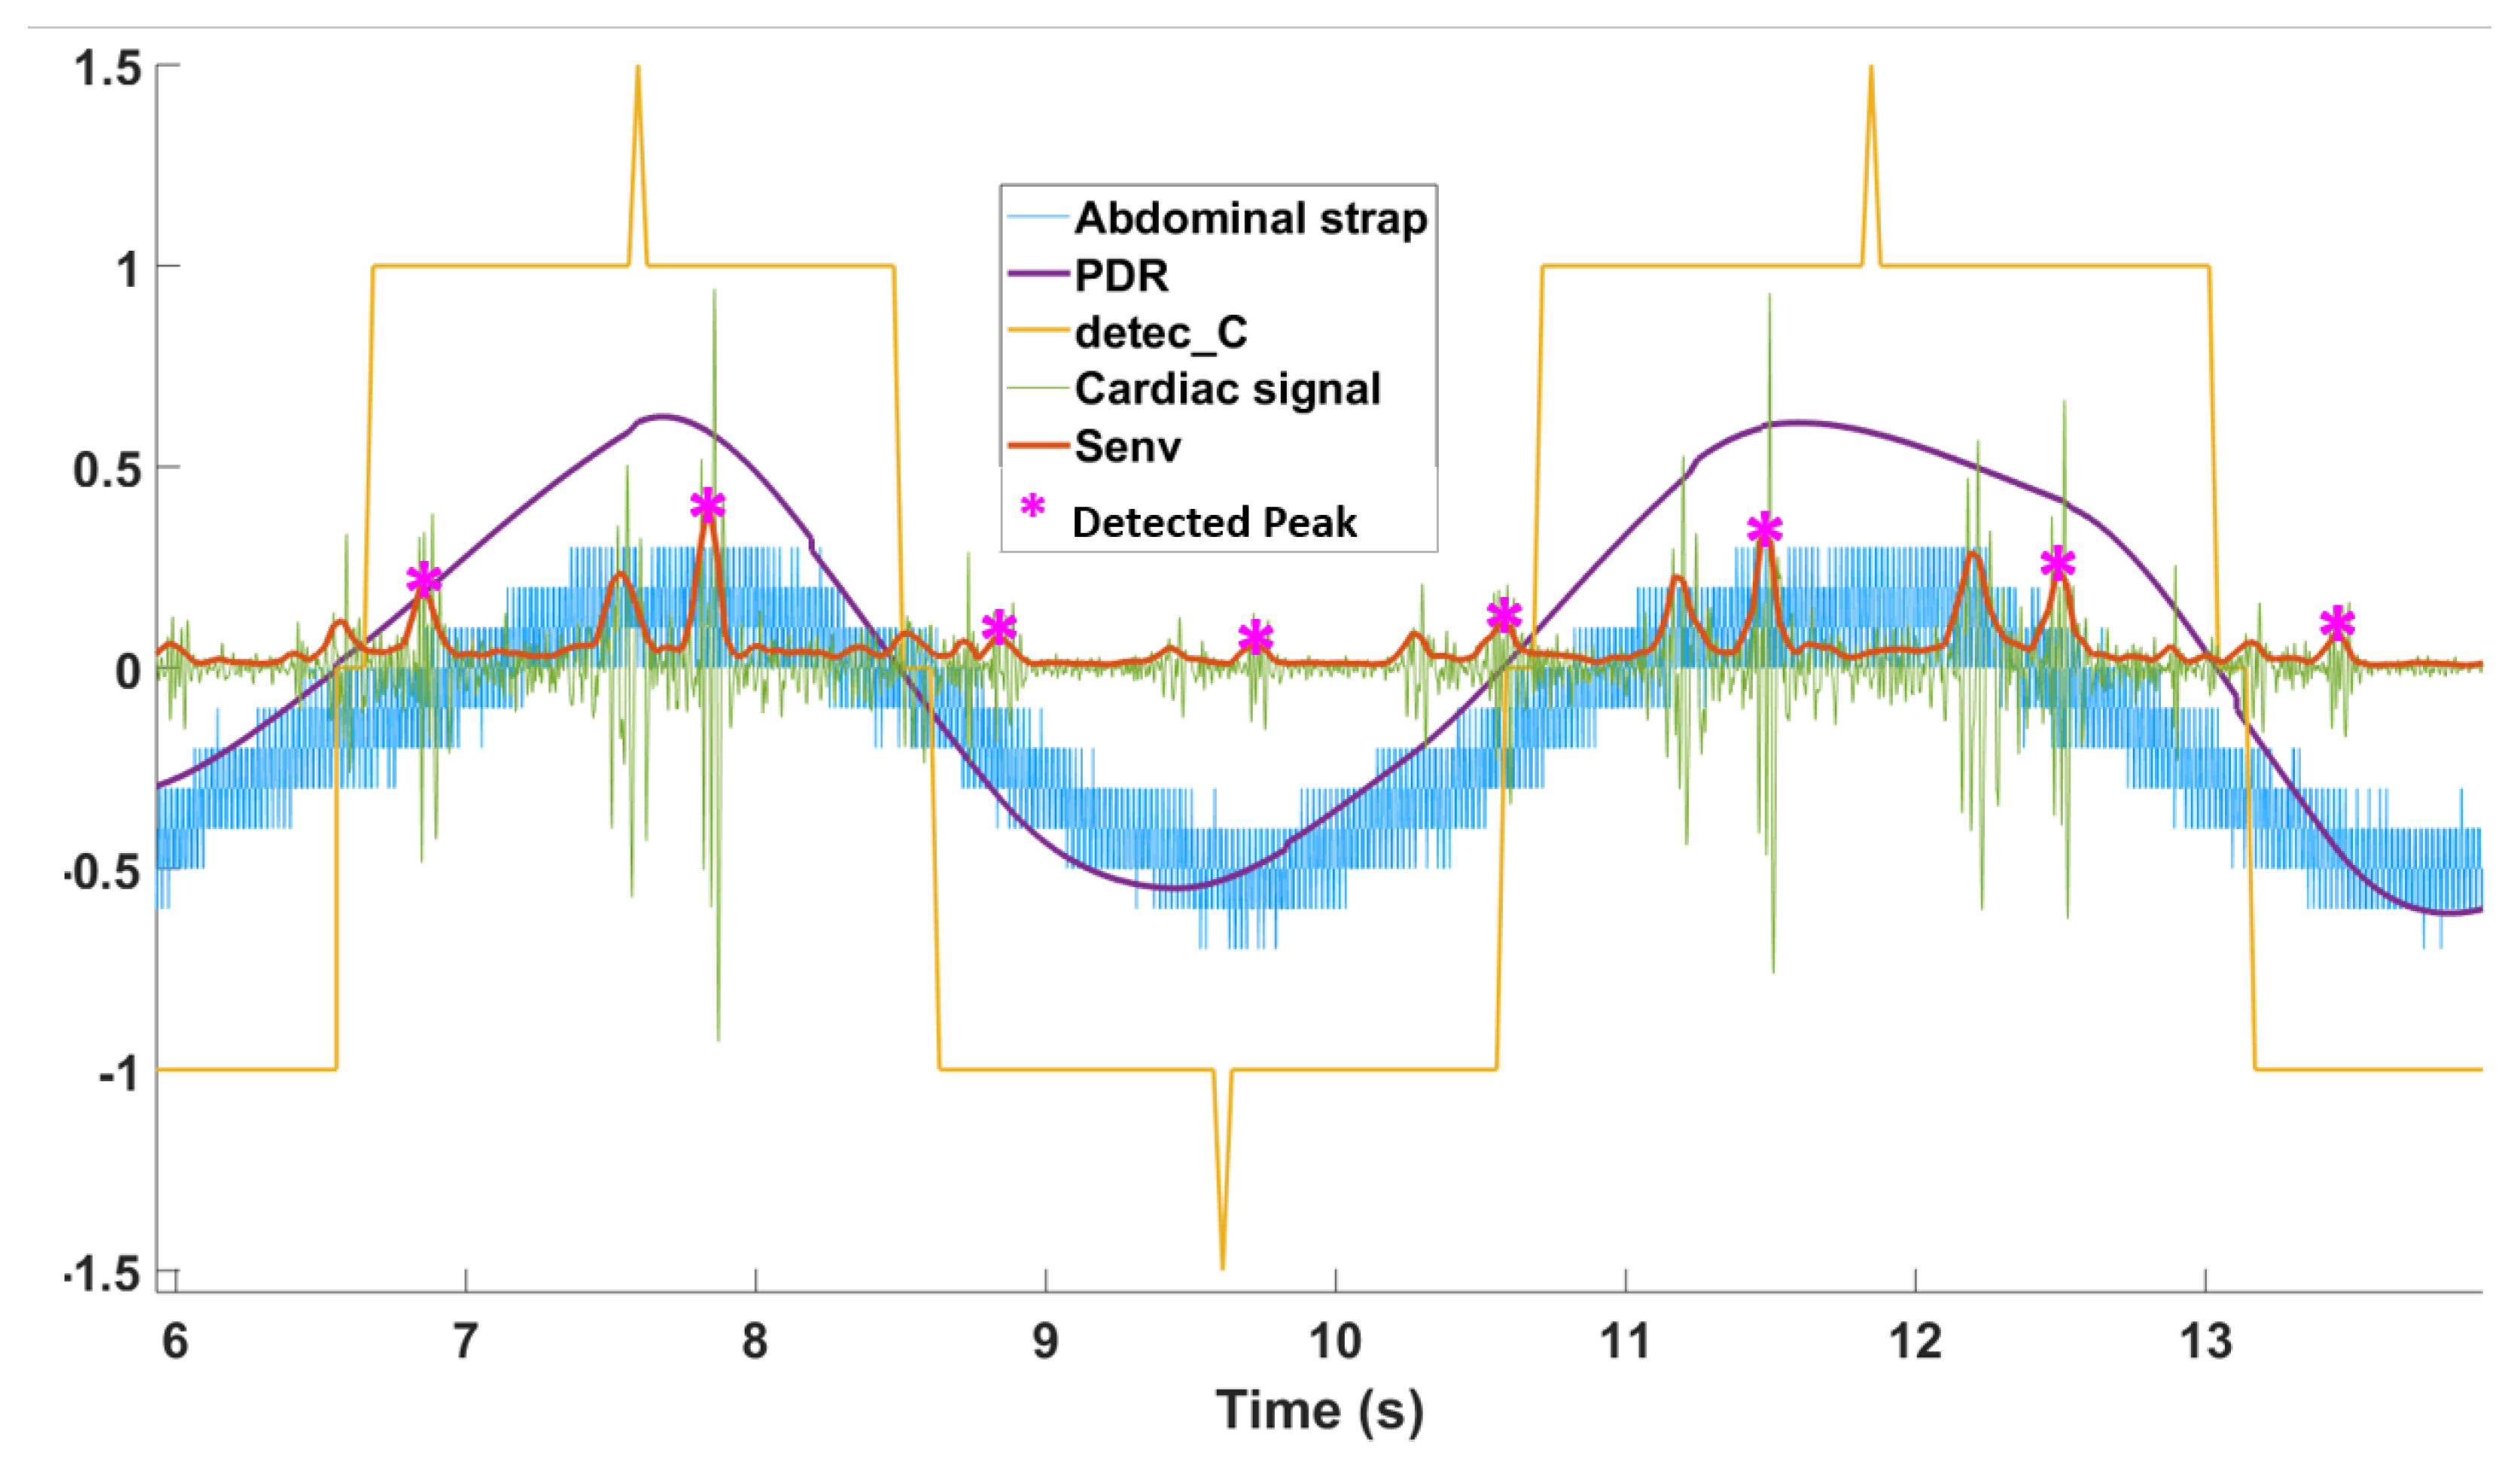
PDR. The extracted cardiac signal is shown in green, and the processed envelogram is in red. Only one cardiac peak (S1/S2) detected (pink star) for each cardiac cycle. Positive (Negative) of the PDR detection result (yellow) indicates the inspiration (expiration) as reference signal.
Figure 8.
PDR. The extracted cardiac signal is shown in green, and the processed envelogram is in red. Only one cardiac peak (S1/S2) detected (pink star) for each cardiac cycle. Positive (Negative) of the PDR detection result (yellow) indicates the inspiration (expiration) as reference signal.
Figure 9.
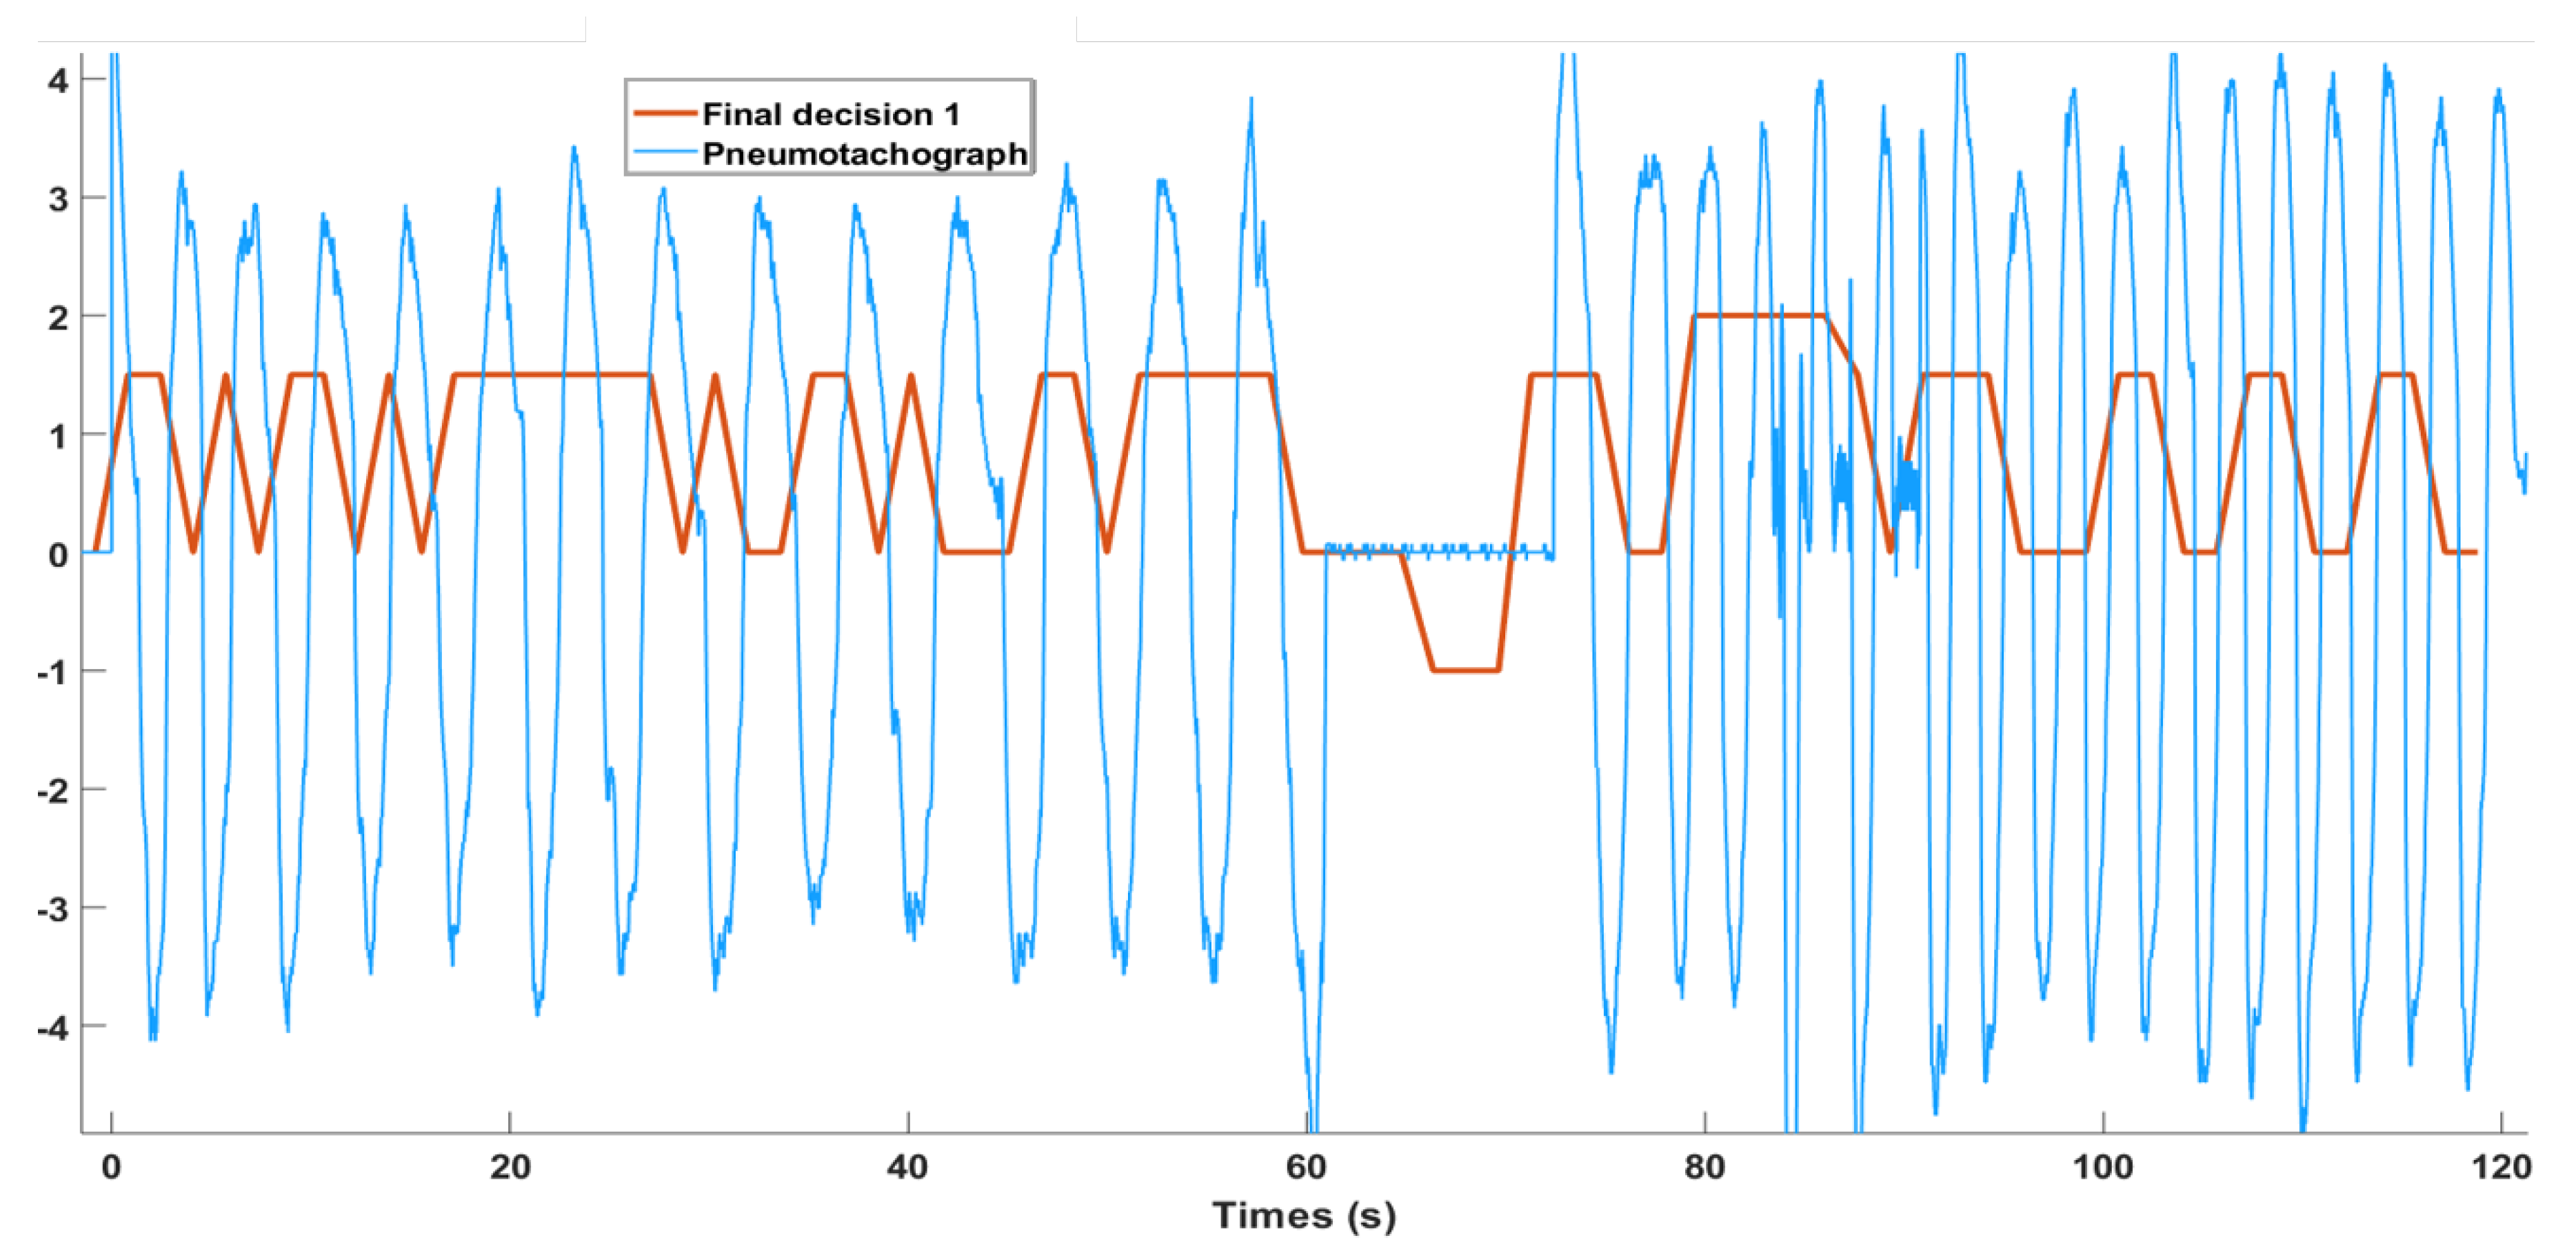
Final decision-making for apnea detection. Detection stat: 2—Speech; 1.5—Respiration; 0—Pauses; −1—apnea. The reference signal: pneumotachograph is in blue, and the apnea detection signal is in red.
Figure 9.
Final decision-making for apnea detection. Detection stat: 2—Speech; 1.5—Respiration; 0—Pauses; −1—apnea. The reference signal: pneumotachograph is in blue, and the apnea detection signal is in red.
Figure 10.
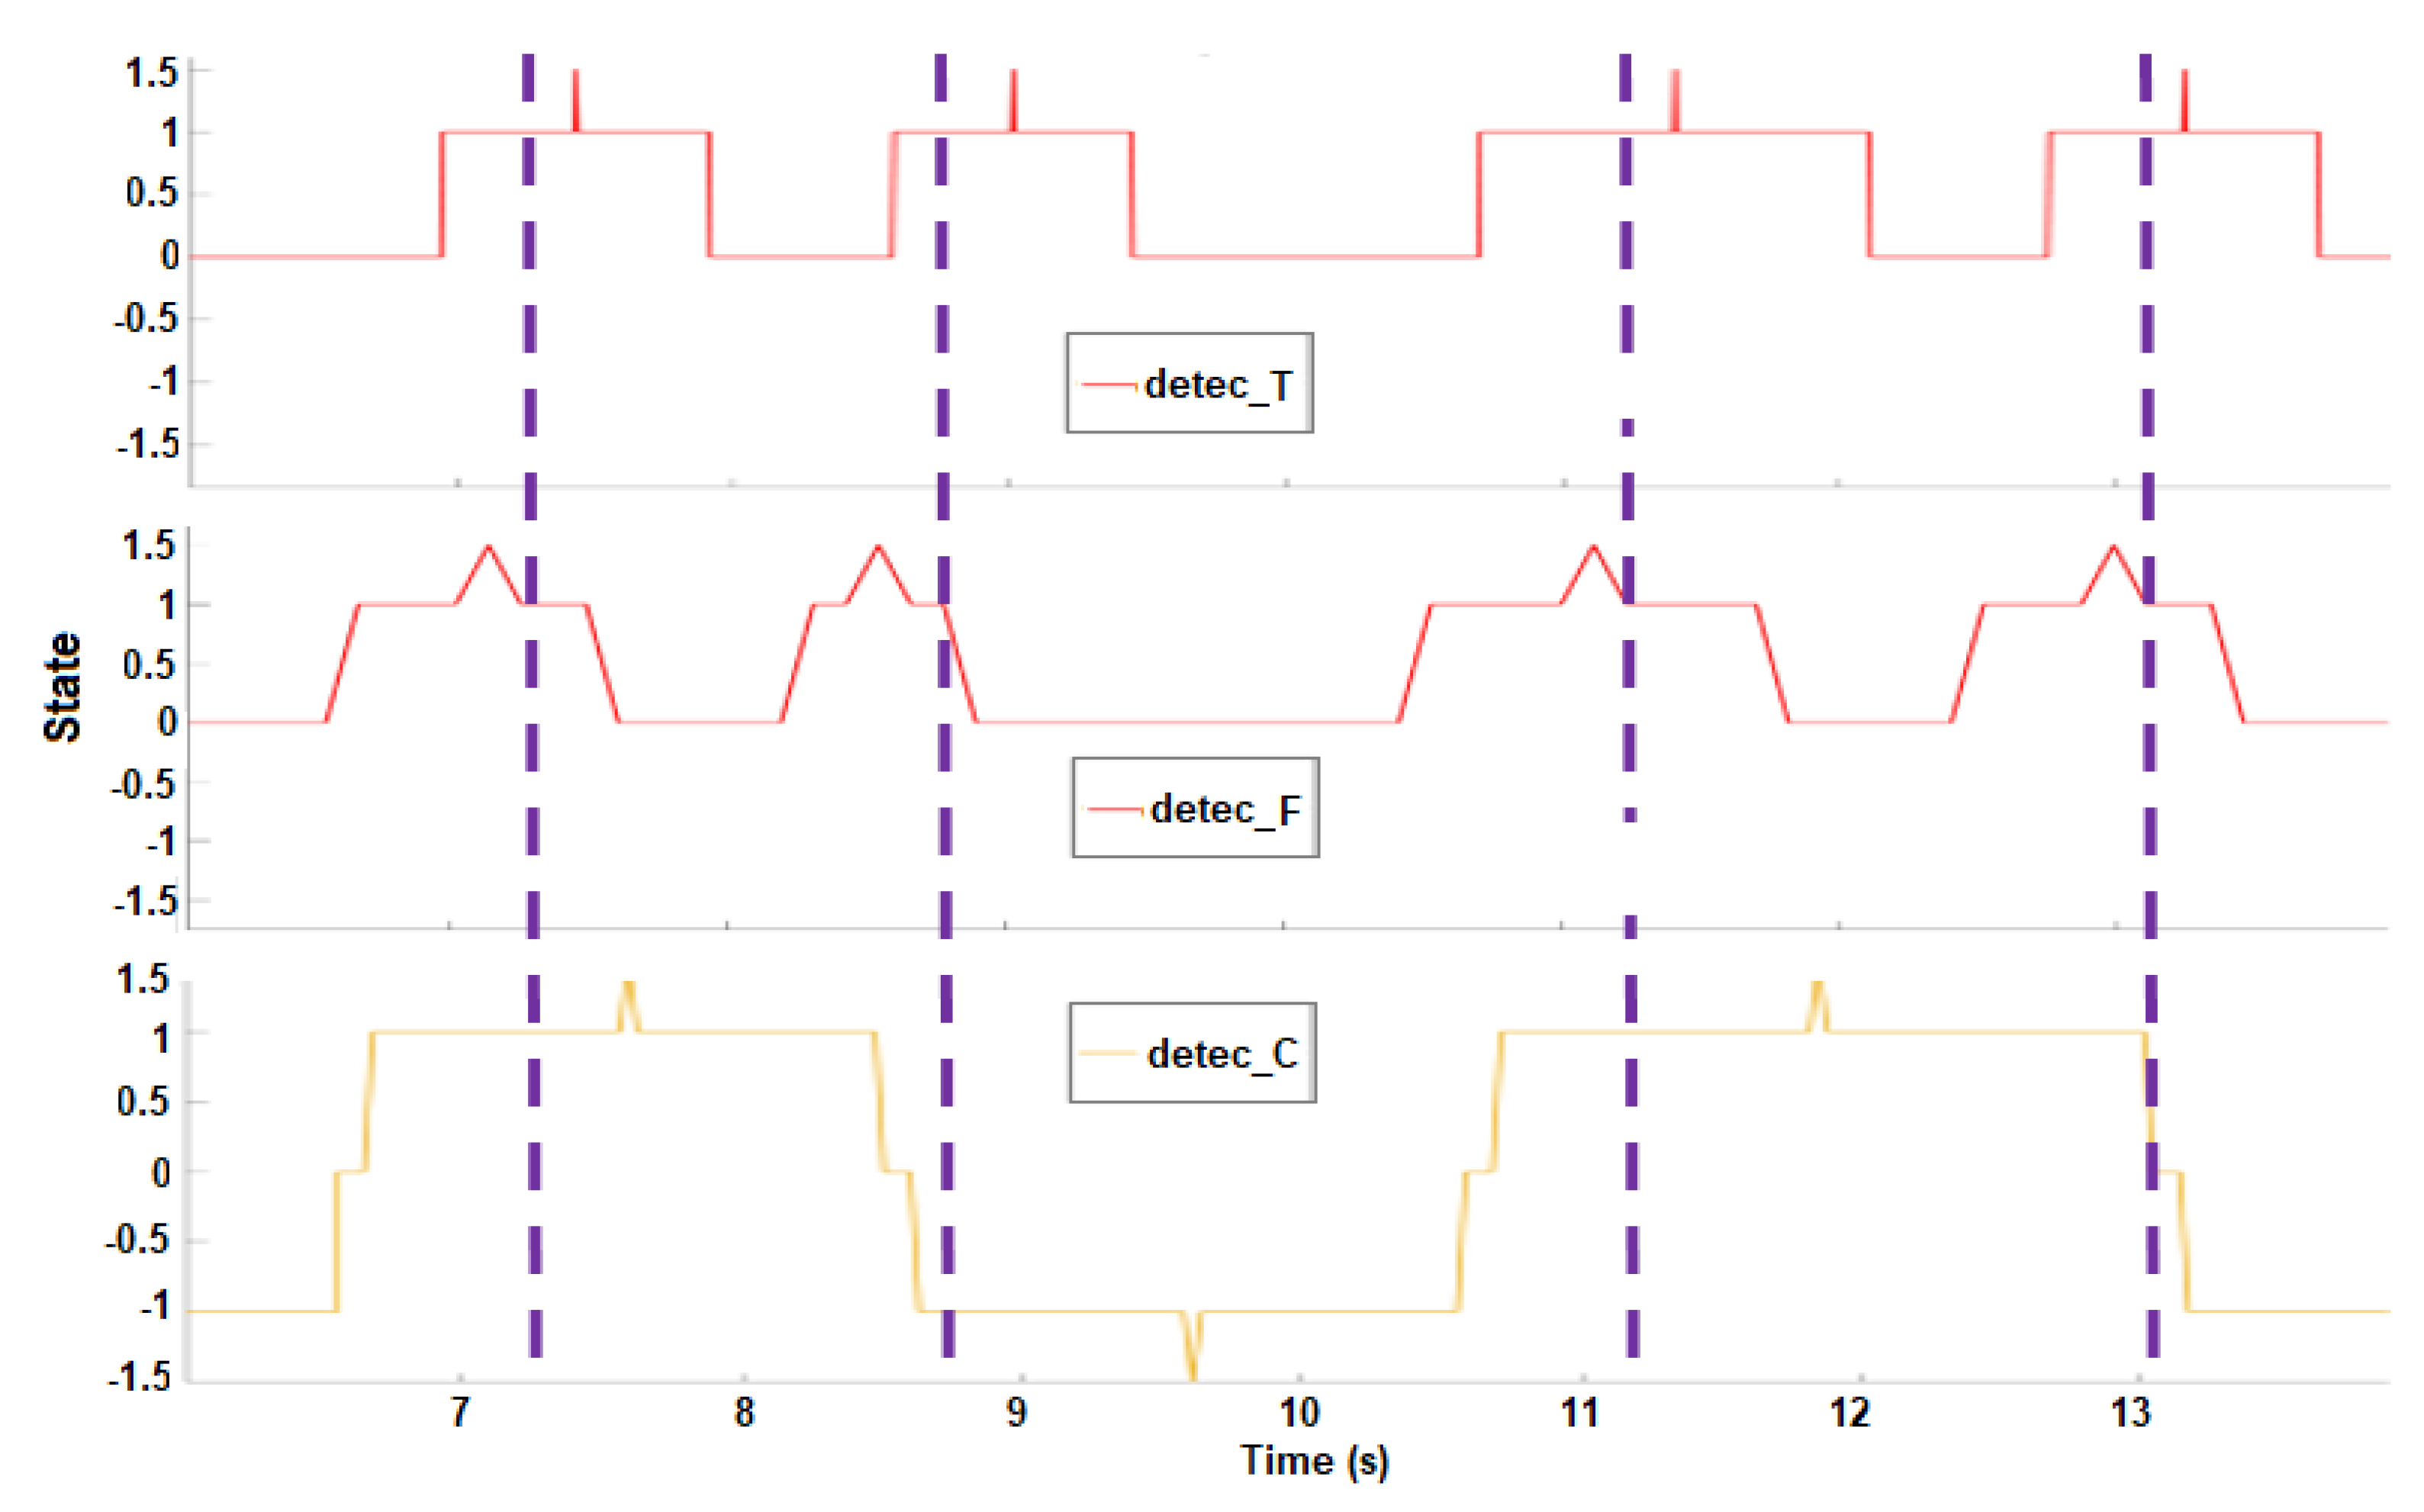
Final decision-making for breathing activities assessment. (Top): results from temporal detection. (Middle): results from frequency detection. (Bottom): results from cardiac (PDR) detection. The final detected events are marked in purple dashed lines.
Figure 10.
Final decision-making for breathing activities assessment. (Top): results from temporal detection. (Middle): results from frequency detection. (Bottom): results from cardiac (PDR) detection. The final detected events are marked in purple dashed lines.
Figure 11.
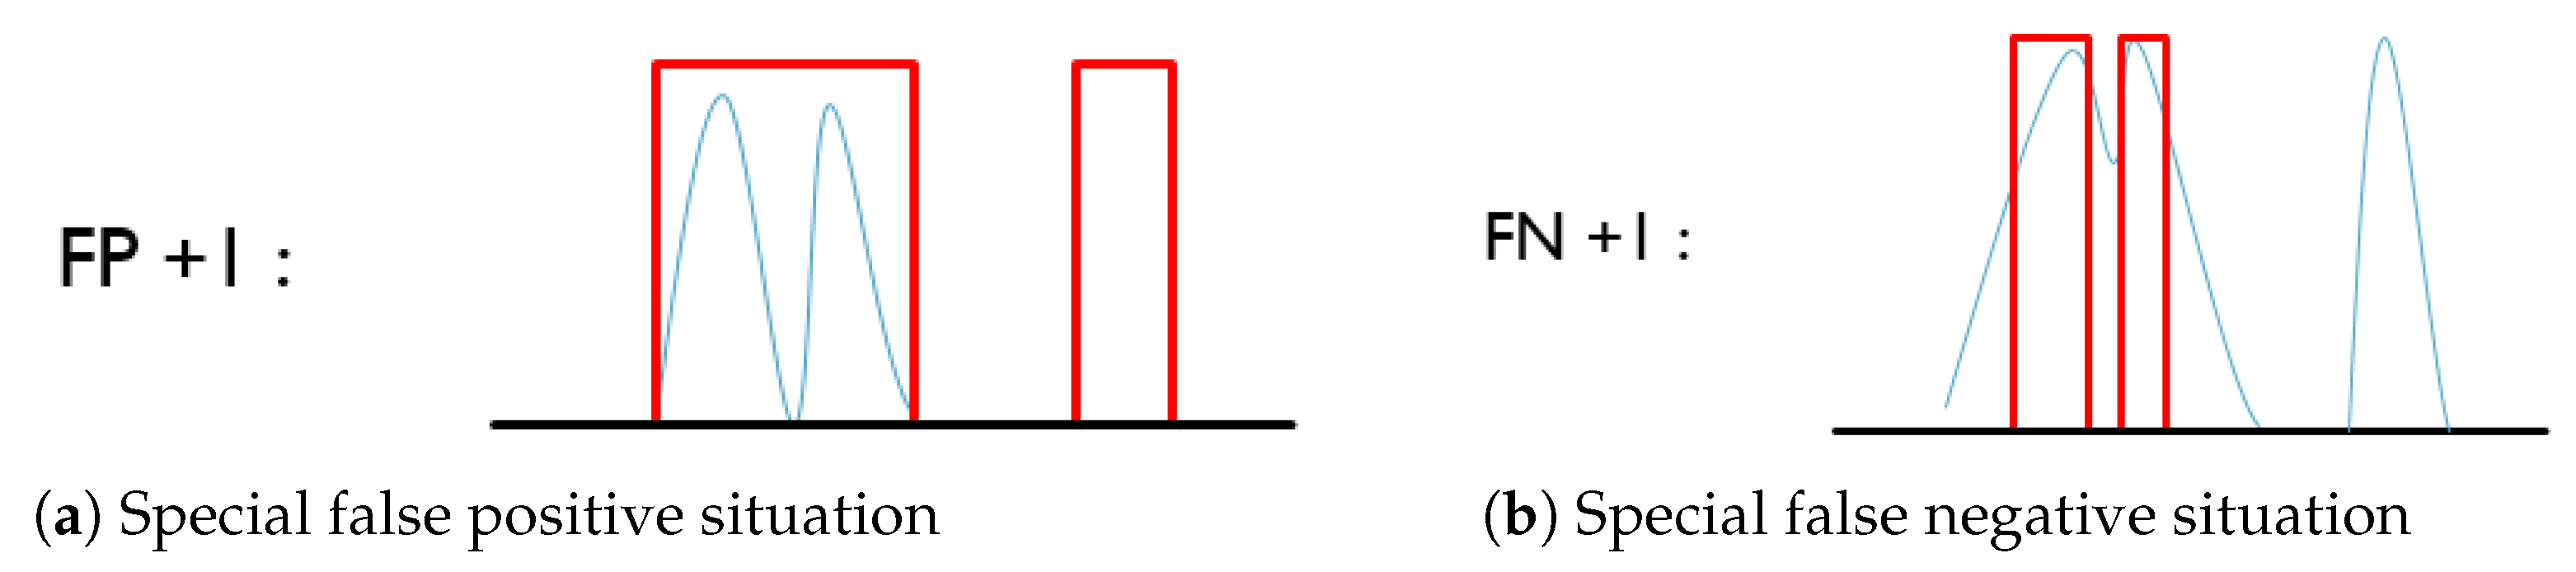
Example of breathing activity counting. Respiratory envelope (in blue), detection signal (in red). (a) If two continuous breathing activities are recognized as a single event, or the pause/apnea is detected as one breathing activity, a false positive detection will be reported; (b) if one breathing activity is recognized as two events, or one breathing activity is not detected, a false negative detection will be reported.
Figure 11.
Example of breathing activity counting. Respiratory envelope (in blue), detection signal (in red). (a) If two continuous breathing activities are recognized as a single event, or the pause/apnea is detected as one breathing activity, a false positive detection will be reported; (b) if one breathing activity is recognized as two events, or one breathing activity is not detected, a false negative detection will be reported.
Figure 12.
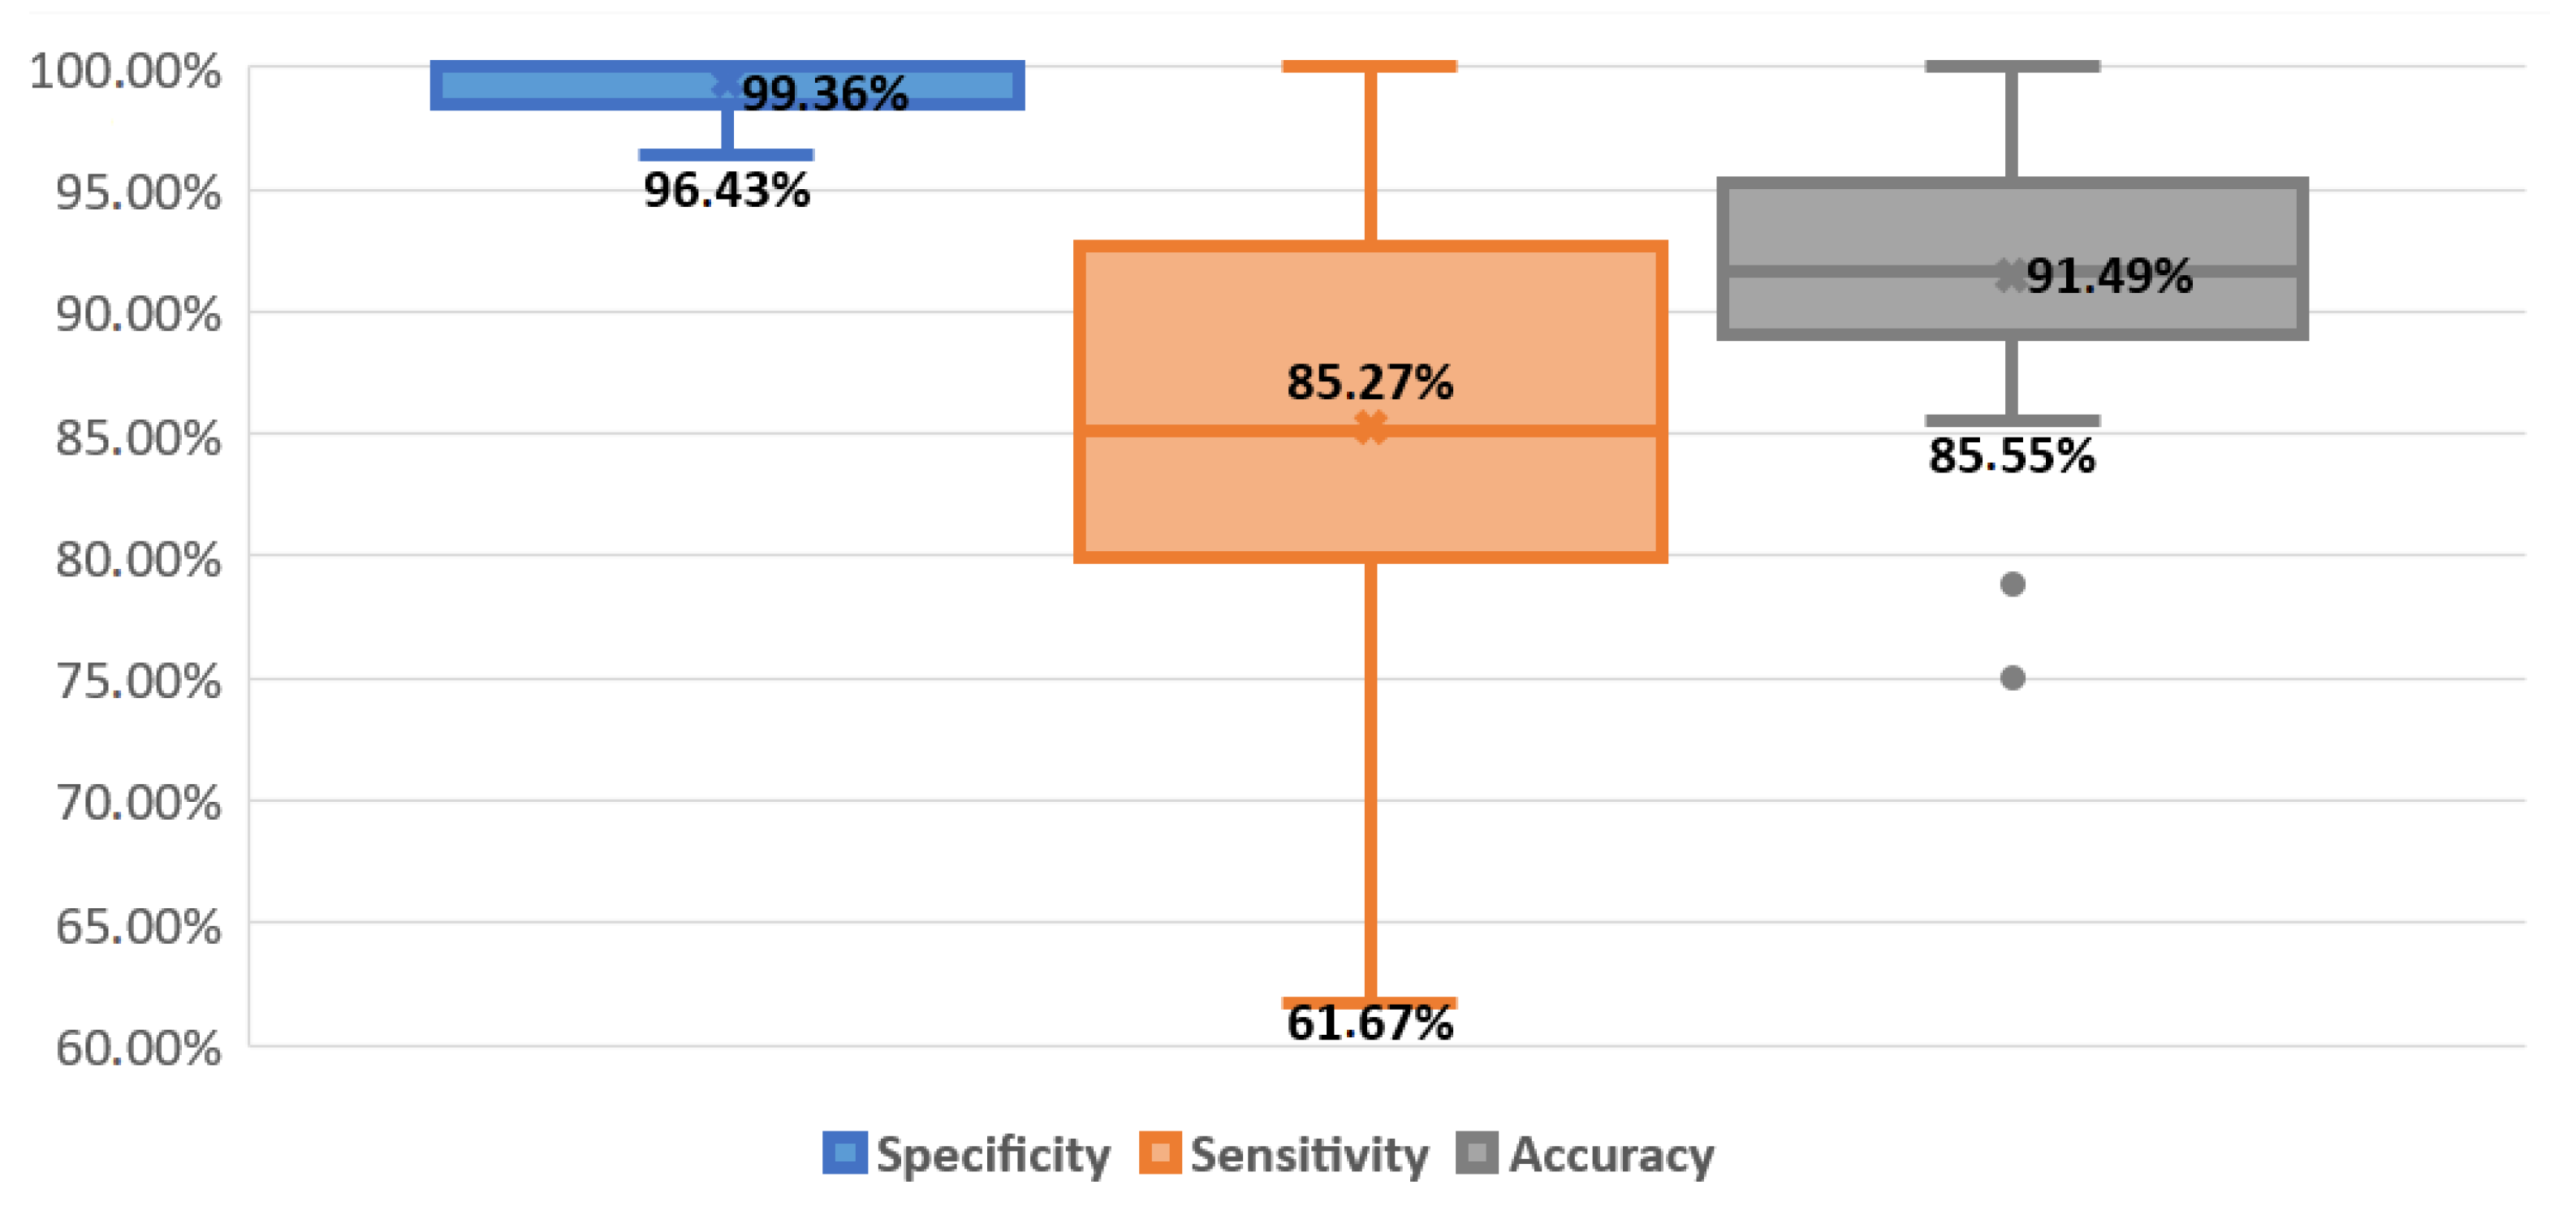
Box plot for final respiratory detection result. The line and the cross inside the box correspond to the median and the mean value, respectively. The box-limits represent the first and the third quartiles, the points highlight outliers, and the upper and lower bars represent the maximum and minimum values, respectively. Specificity: blue box. Sensitivity: orange box. Accuracy: gray box.
Figure 12.
Box plot for final respiratory detection result. The line and the cross inside the box correspond to the median and the mean value, respectively. The box-limits represent the first and the third quartiles, the points highlight outliers, and the upper and lower bars represent the maximum and minimum values, respectively. Specificity: blue box. Sensitivity: orange box. Accuracy: gray box.
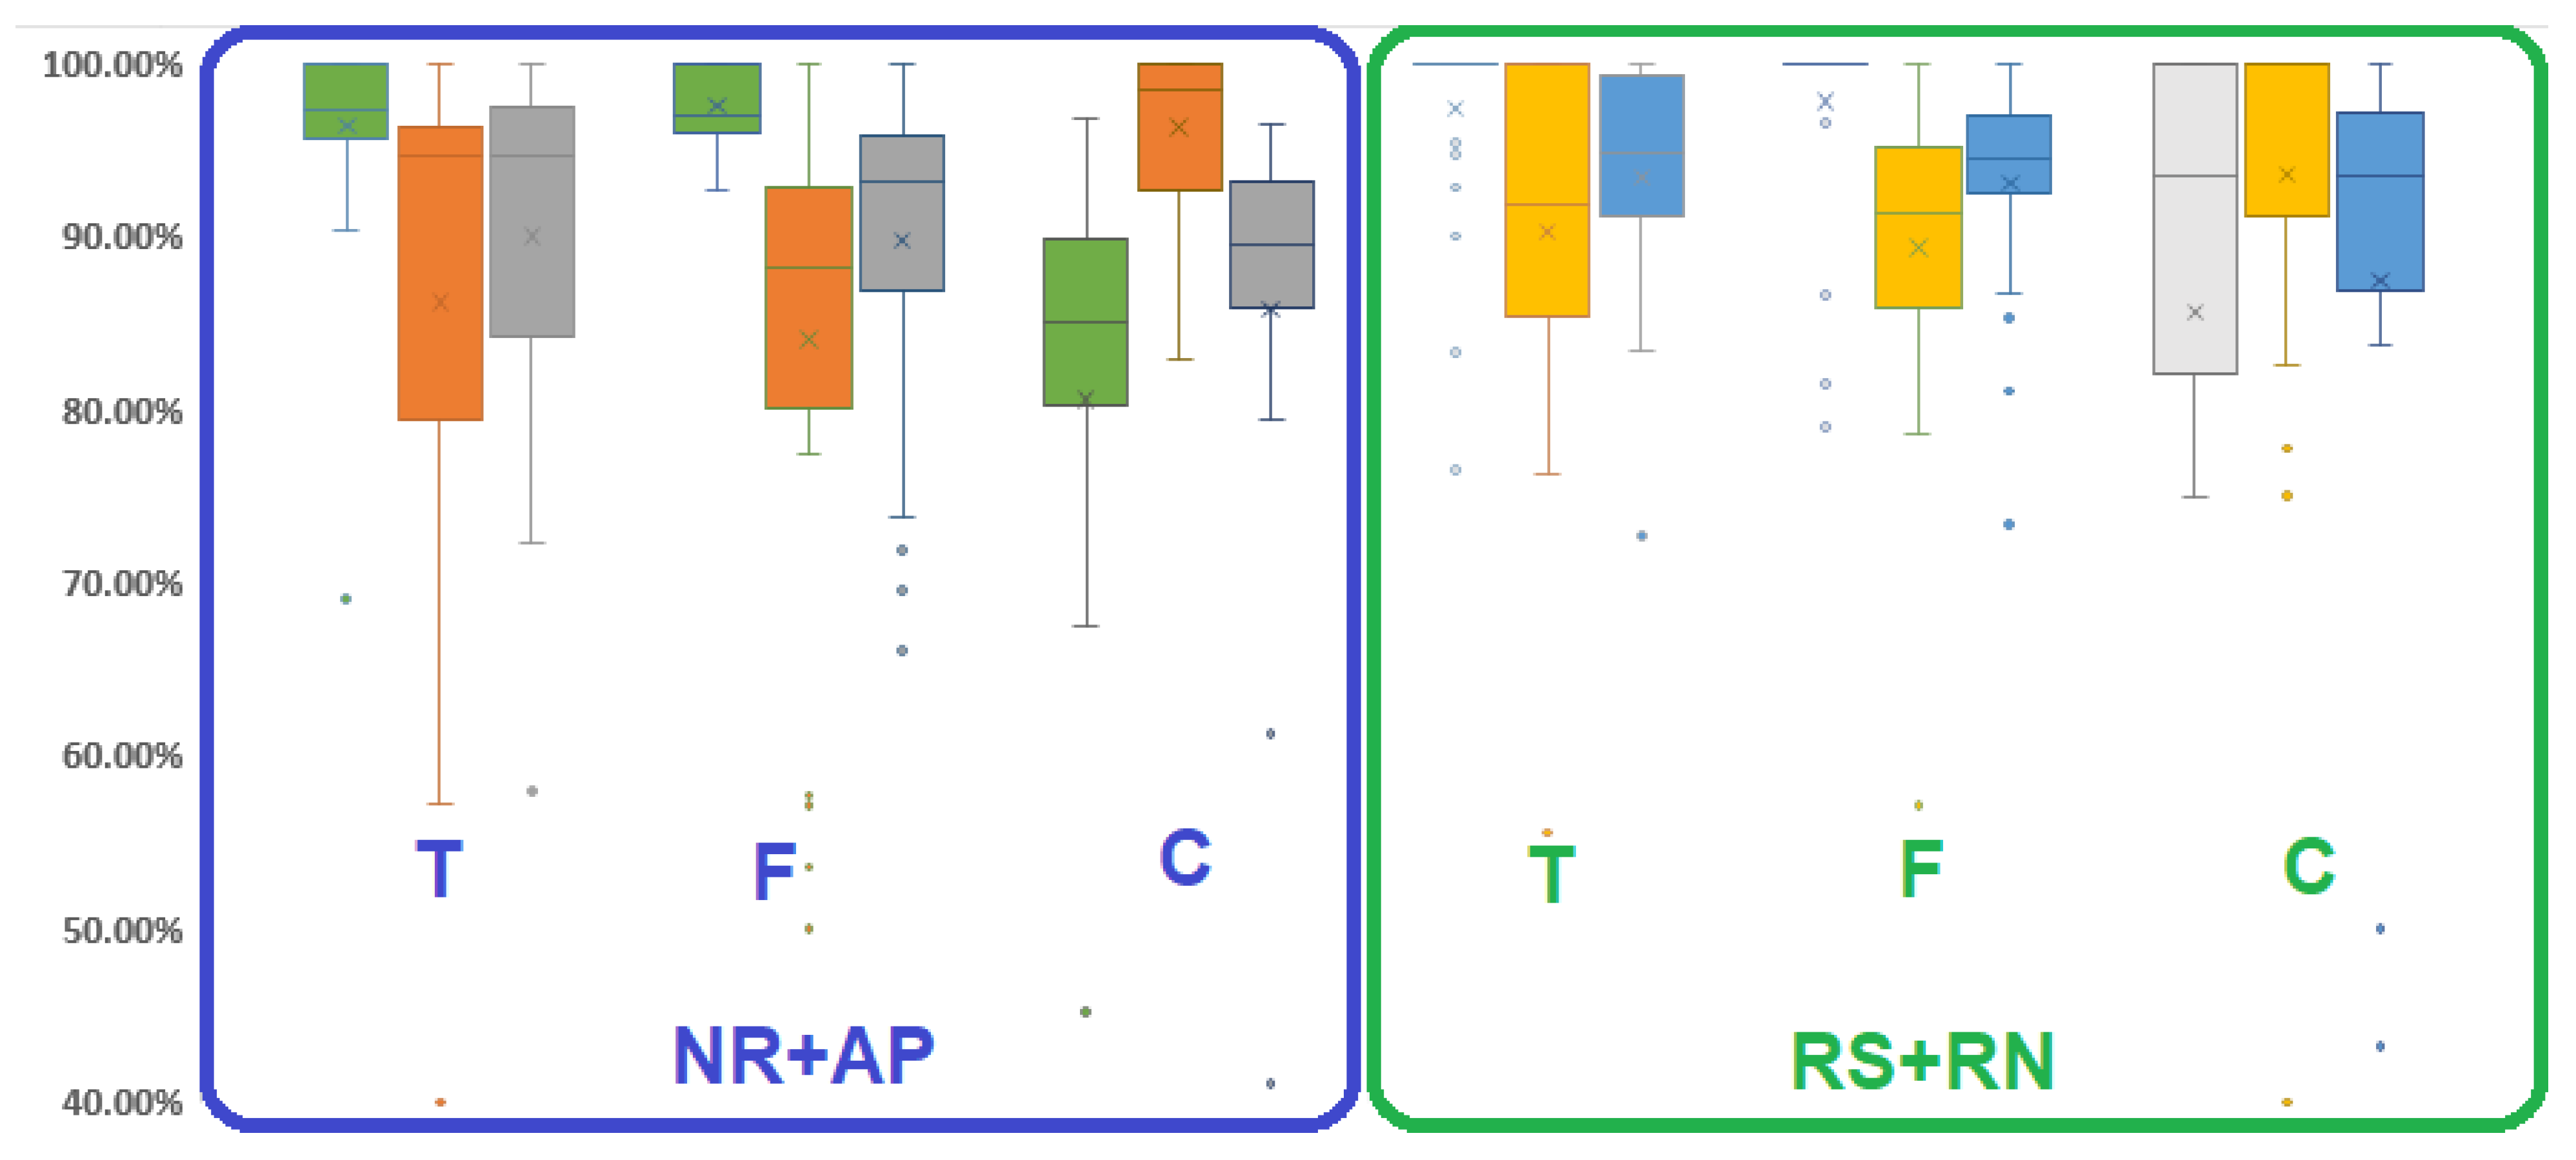
Figure 13.
Influence of speech and noise on respiratory detection. Box plot (as box plot of
Figure 12) for specificity (green and light gray boxes), sensitivity (orange and yellow boxes) and accuracy (dark gray and blue boxes) of temporal (T), frequency (F), and cardiac (C) detection domains, separated in NR+AP phases (in blue square) and RS + RN phases (in green square).
Figure 14.
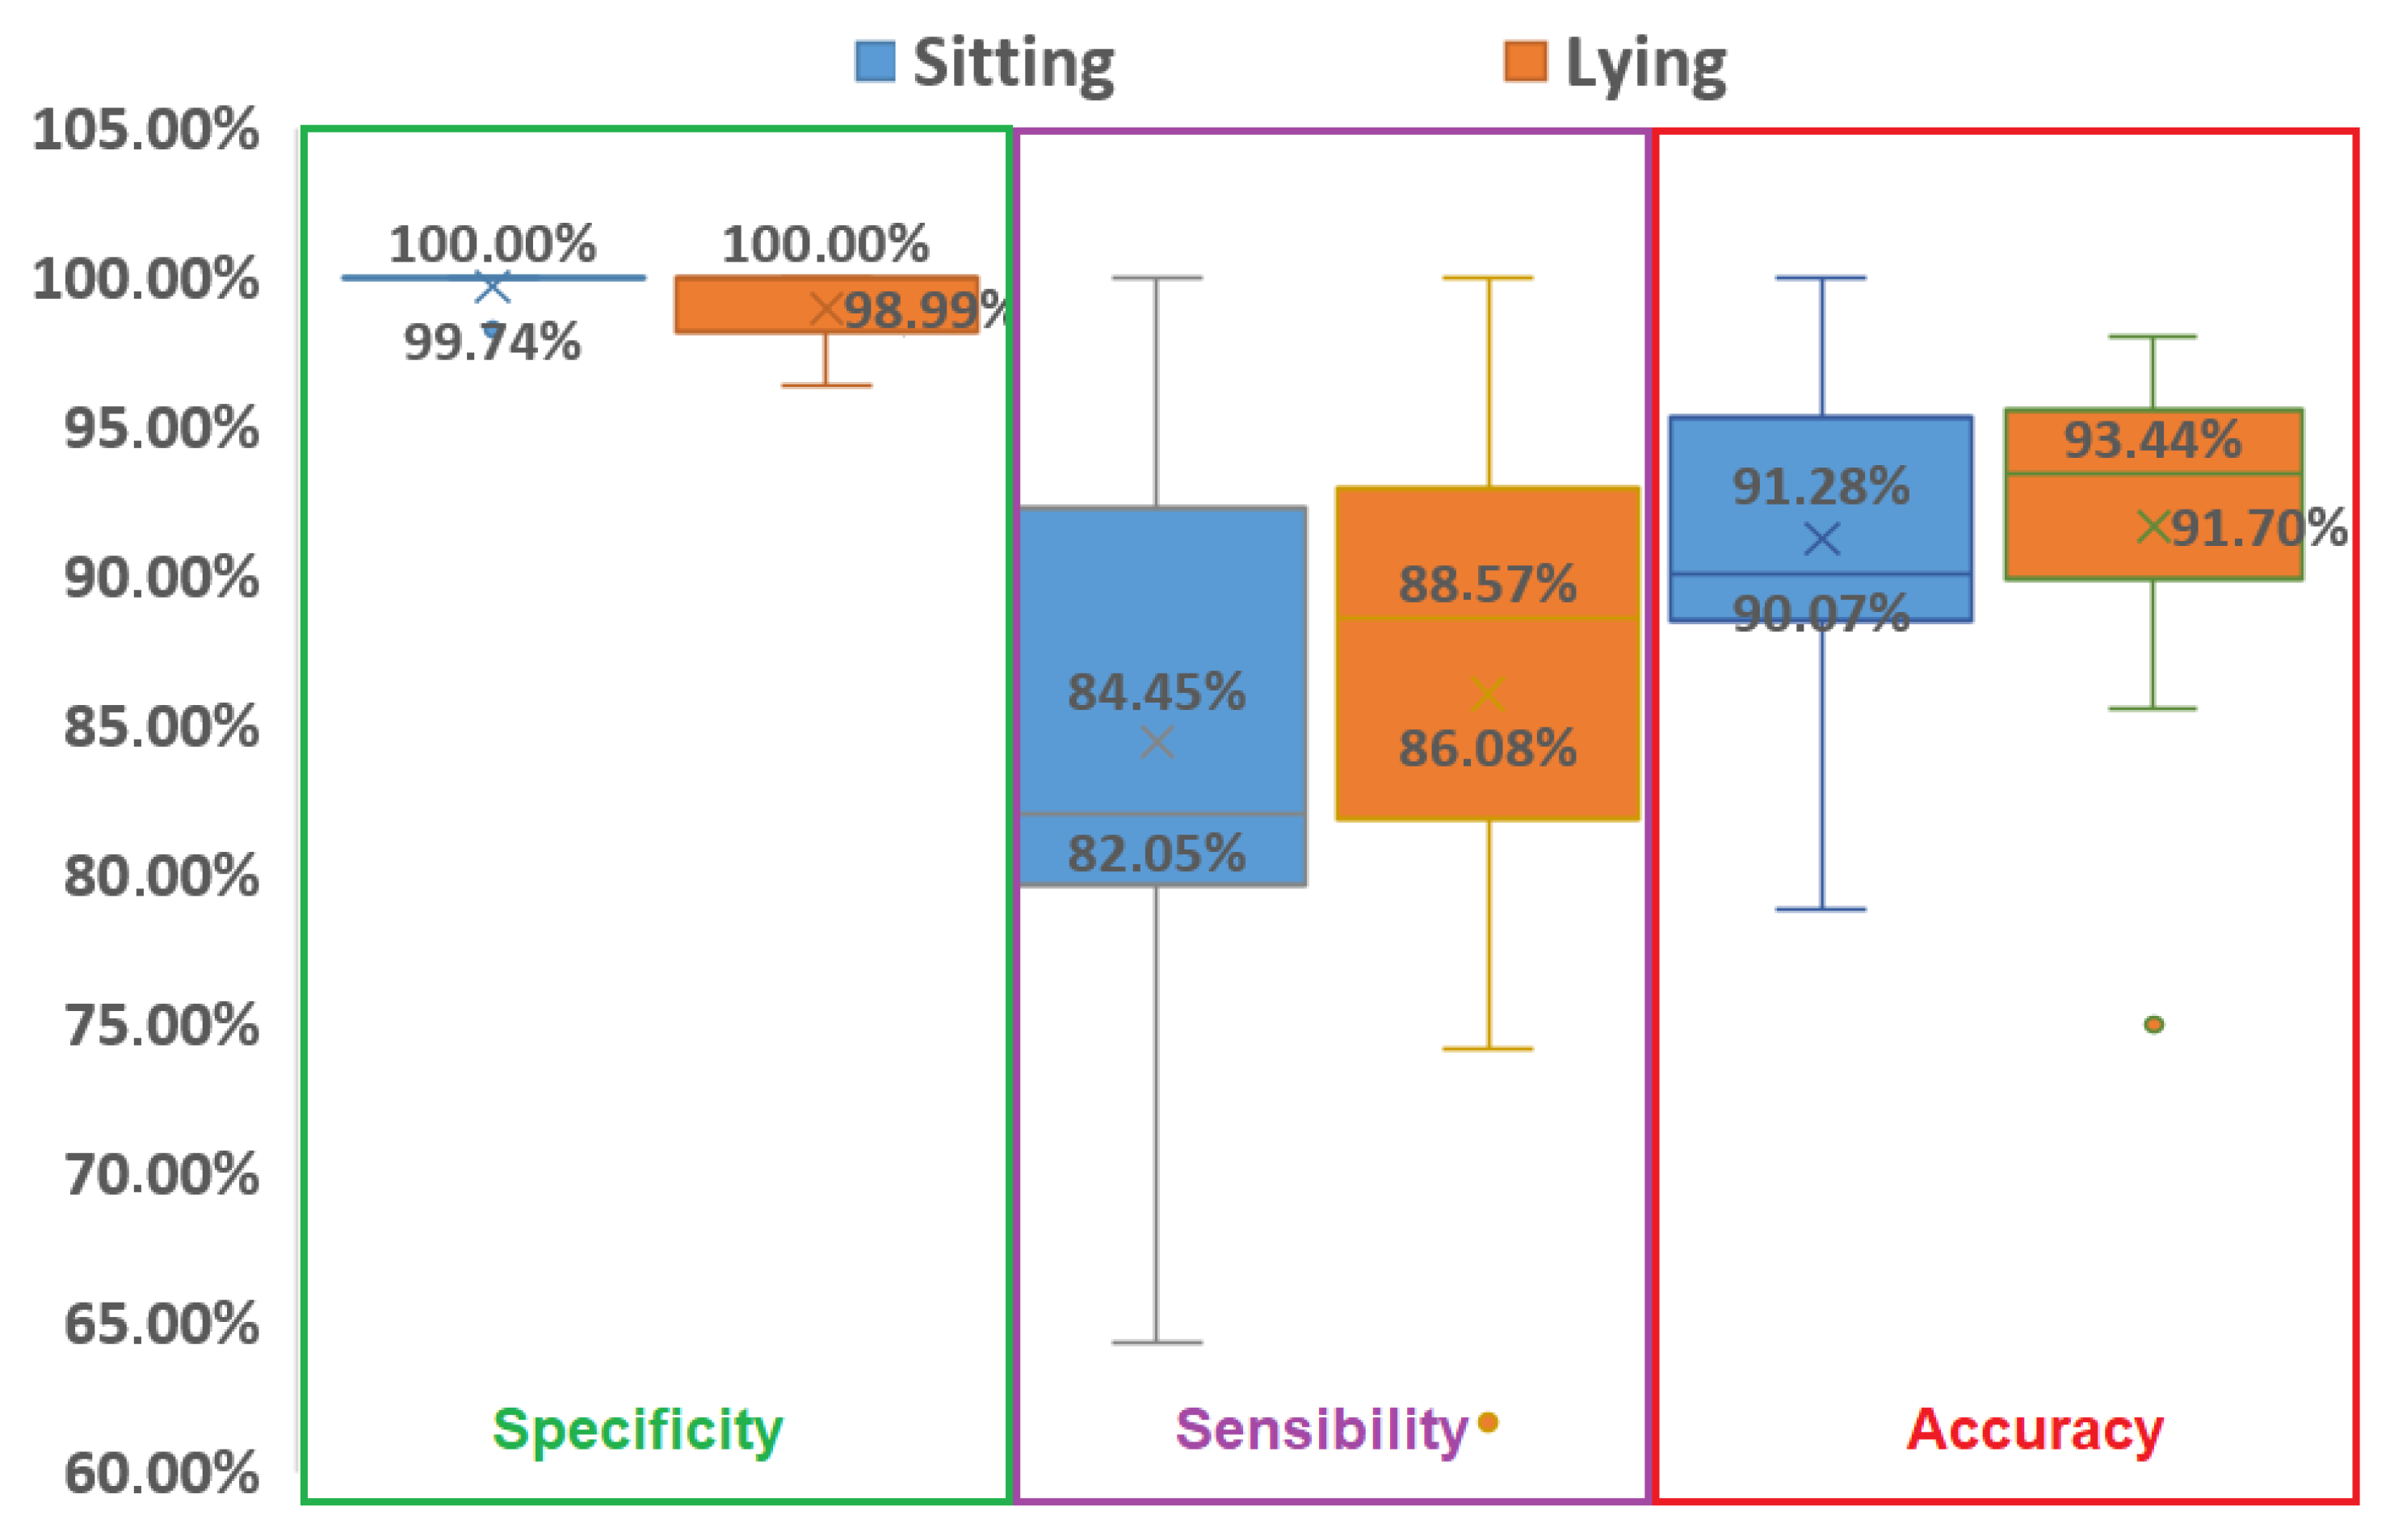
Box plot (like box plot of
Figure 12) for specificity (green rectangle), sensitivity (purple rectangle), and accuracy (red rectangle) in sitting (orange boxes) and lying (blue boxes) positions.
Figure 14.
Box plot (like box plot of
Figure 12) for specificity (green rectangle), sensitivity (purple rectangle), and accuracy (red rectangle) in sitting (orange boxes) and lying (blue boxes) positions.
Figure 15.
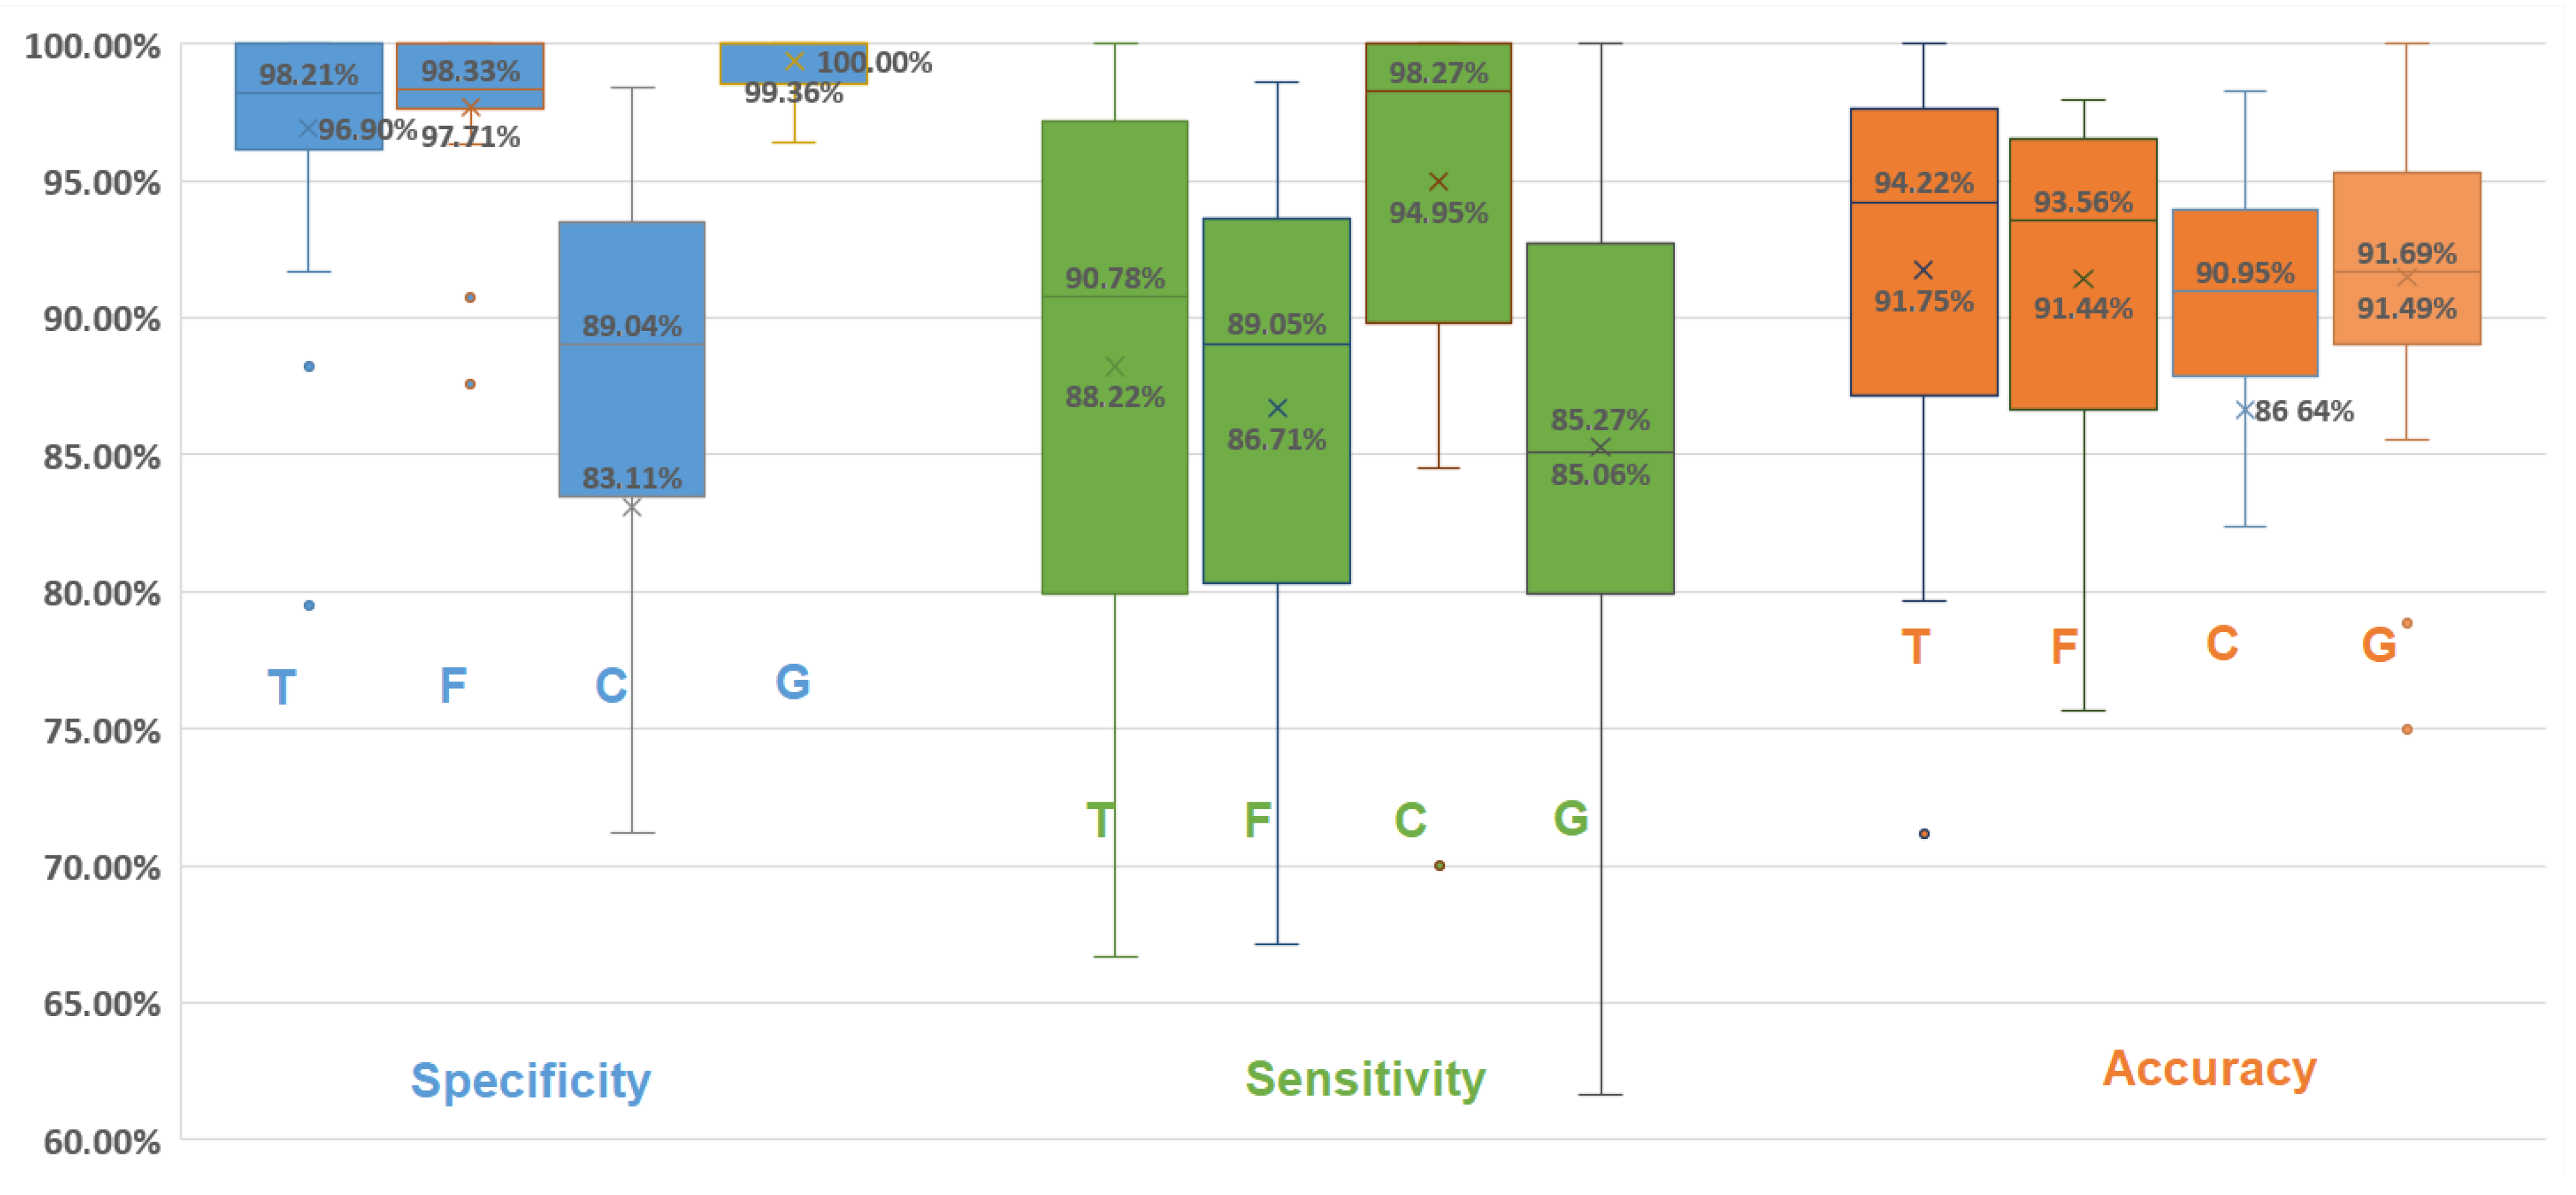
Box plot (as box plot of
Figure 12) for specificity (blue), sensitivity (green), and accuracy (orange) of temporal (T), frequency (F), and cardiac (C) detection domains, as well as global result (G).
Figure 15.
Box plot (as box plot of
Figure 12) for specificity (blue), sensitivity (green), and accuracy (orange) of temporal (T), frequency (F), and cardiac (C) detection domains, as well as global result (G).
Figure 16.
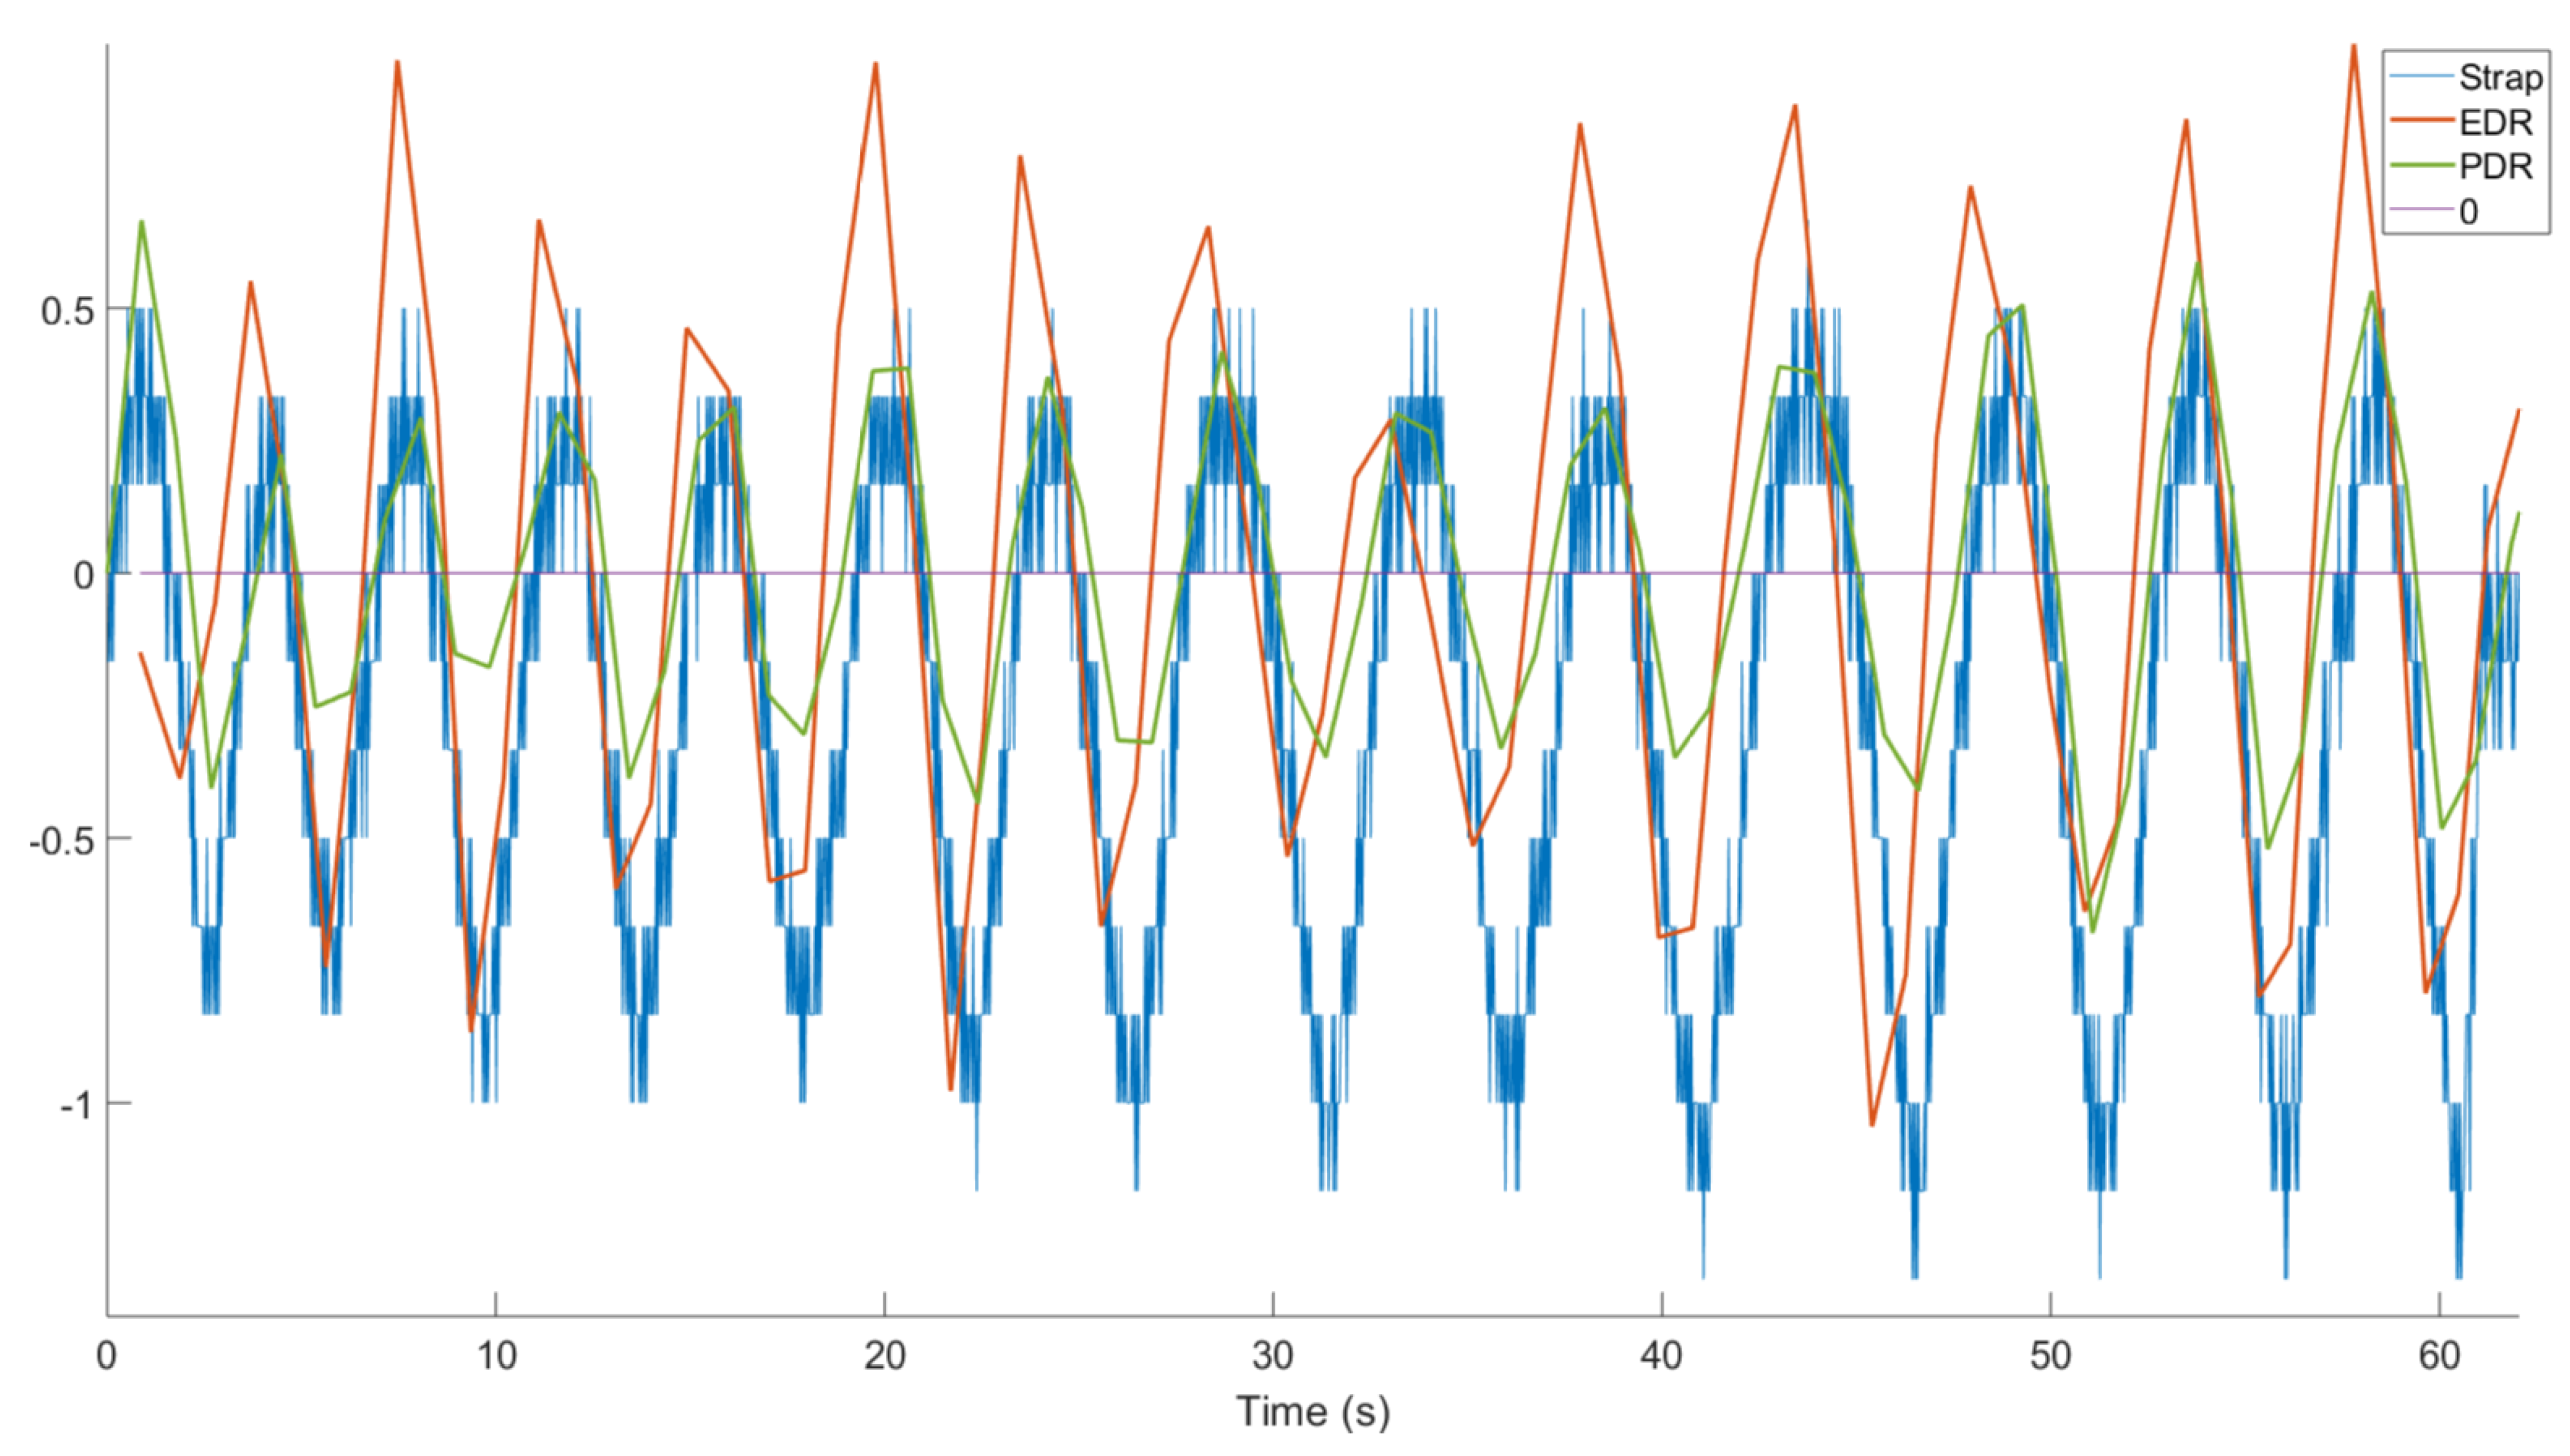
PDR (green) processed from tracheal sounds and ECG-Derived Respiration (EDR) (red) processed from ECG and the thoracic strap signal (blue). Their positive (negative) slopes indicate inspiration (expiration).
Figure 16.
PDR (green) processed from tracheal sounds and ECG-Derived Respiration (EDR) (red) processed from ECG and the thoracic strap signal (blue). Their positive (negative) slopes indicate inspiration (expiration).
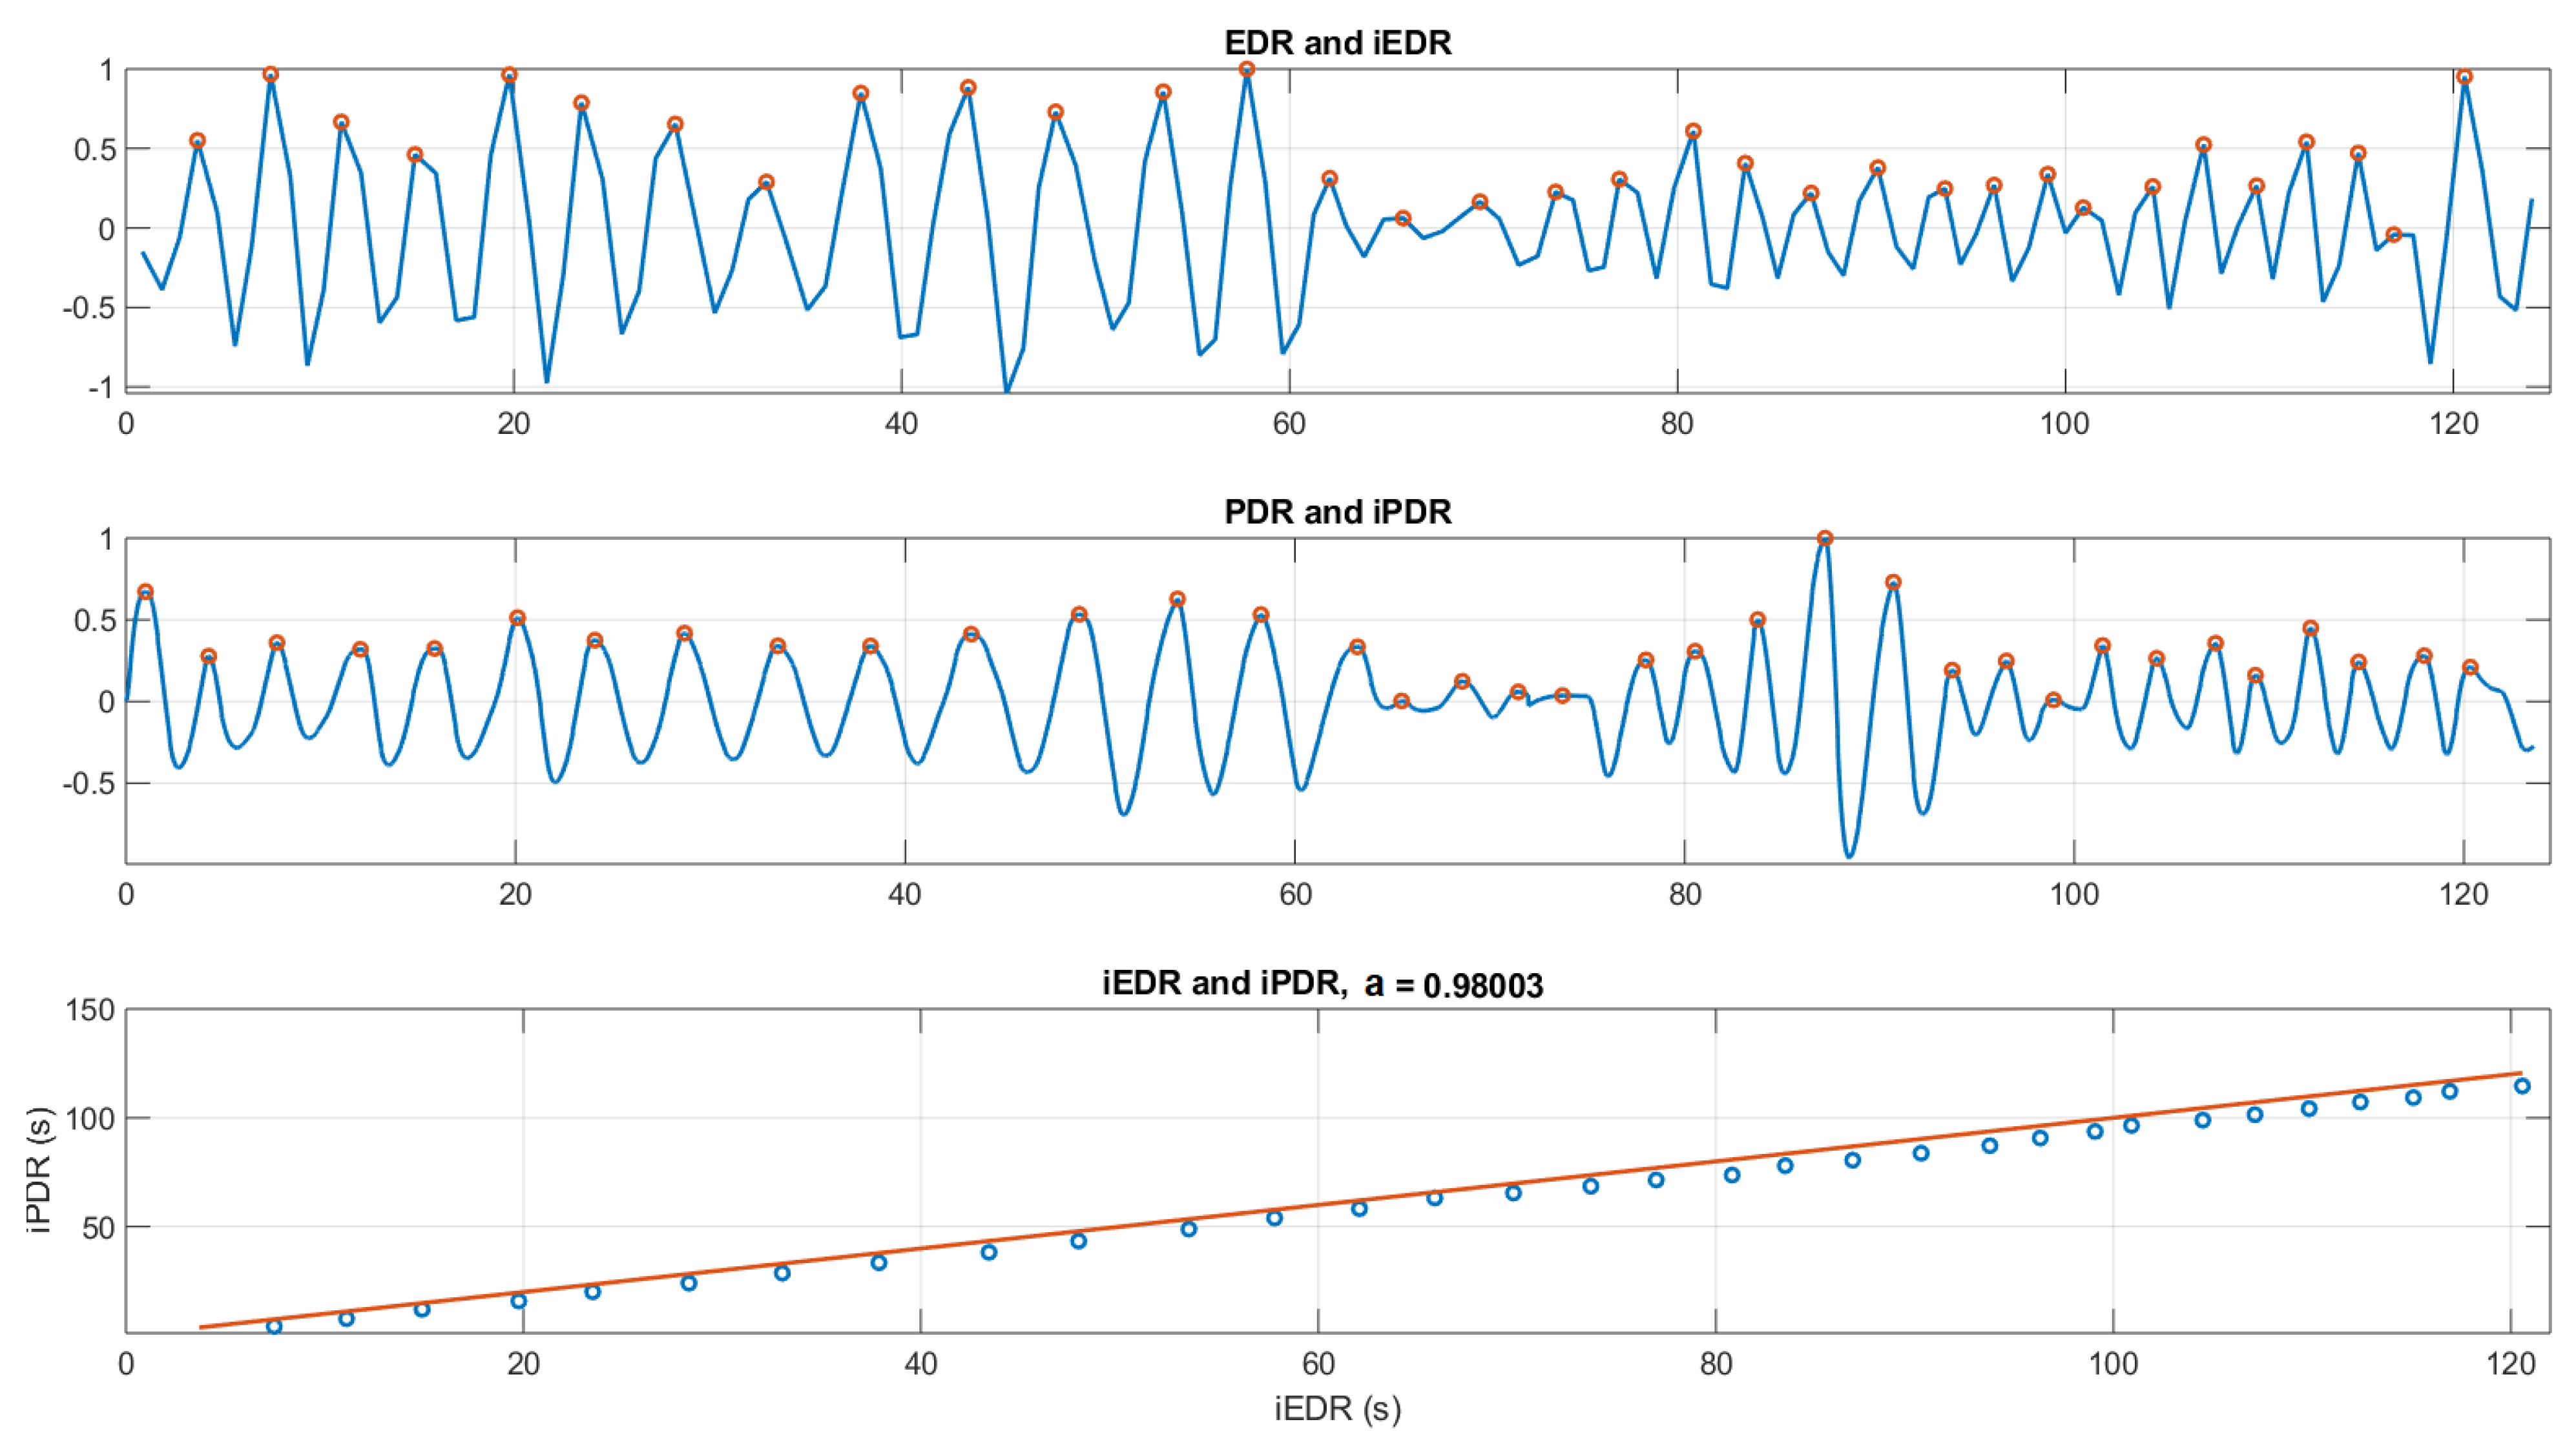
Figure 17.
(Top): the EDR signal and its local maxima (peaks) . (Middle): the PDR signal and its local maxima . (Bottom): the linear regression fit line between iEDR and iPDR ().
Figure 17.
(Top): the EDR signal and its local maxima (peaks) . (Middle): the PDR signal and its local maxima . (Bottom): the linear regression fit line between iEDR and iPDR ().
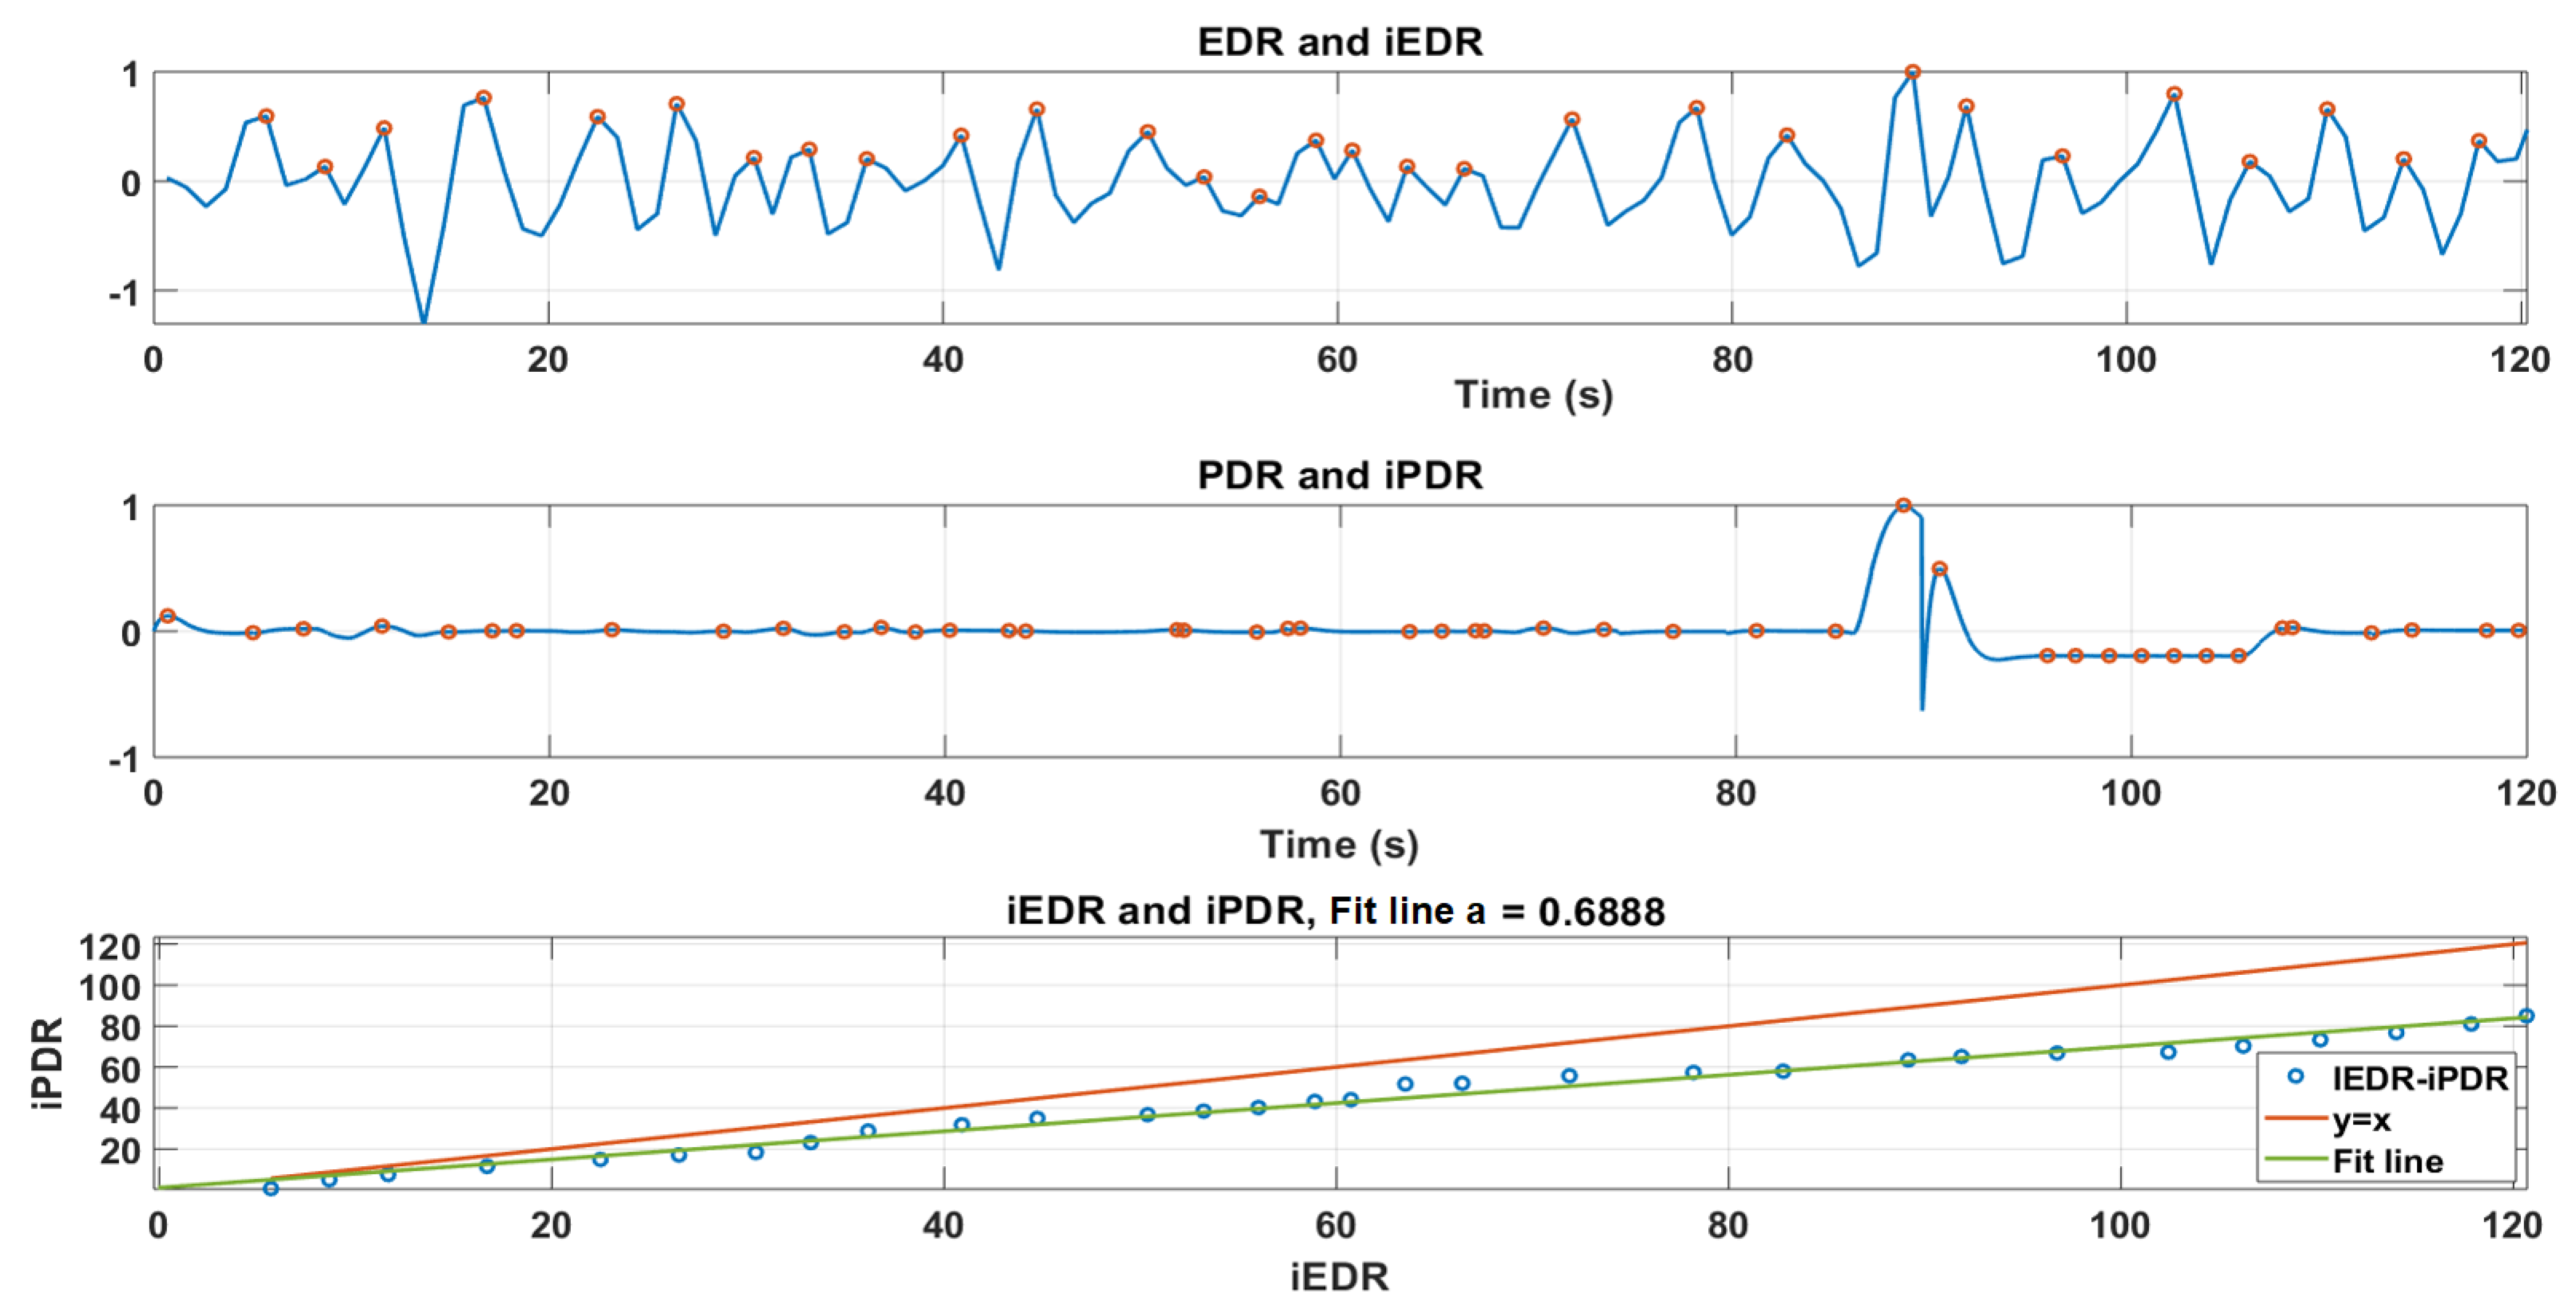
Figure 18.
(Top): the EDR signal and its local maxima (peaks) . (Middle): the PDR signal and its local maxima . (Bottom): the theory fit line(y = x) in red and the linear regression fit line between iEDR and iPDR ().
Figure 18.
(Top): the EDR signal and its local maxima (peaks) . (Middle): the PDR signal and its local maxima . (Bottom): the theory fit line(y = x) in red and the linear regression fit line between iEDR and iPDR ().
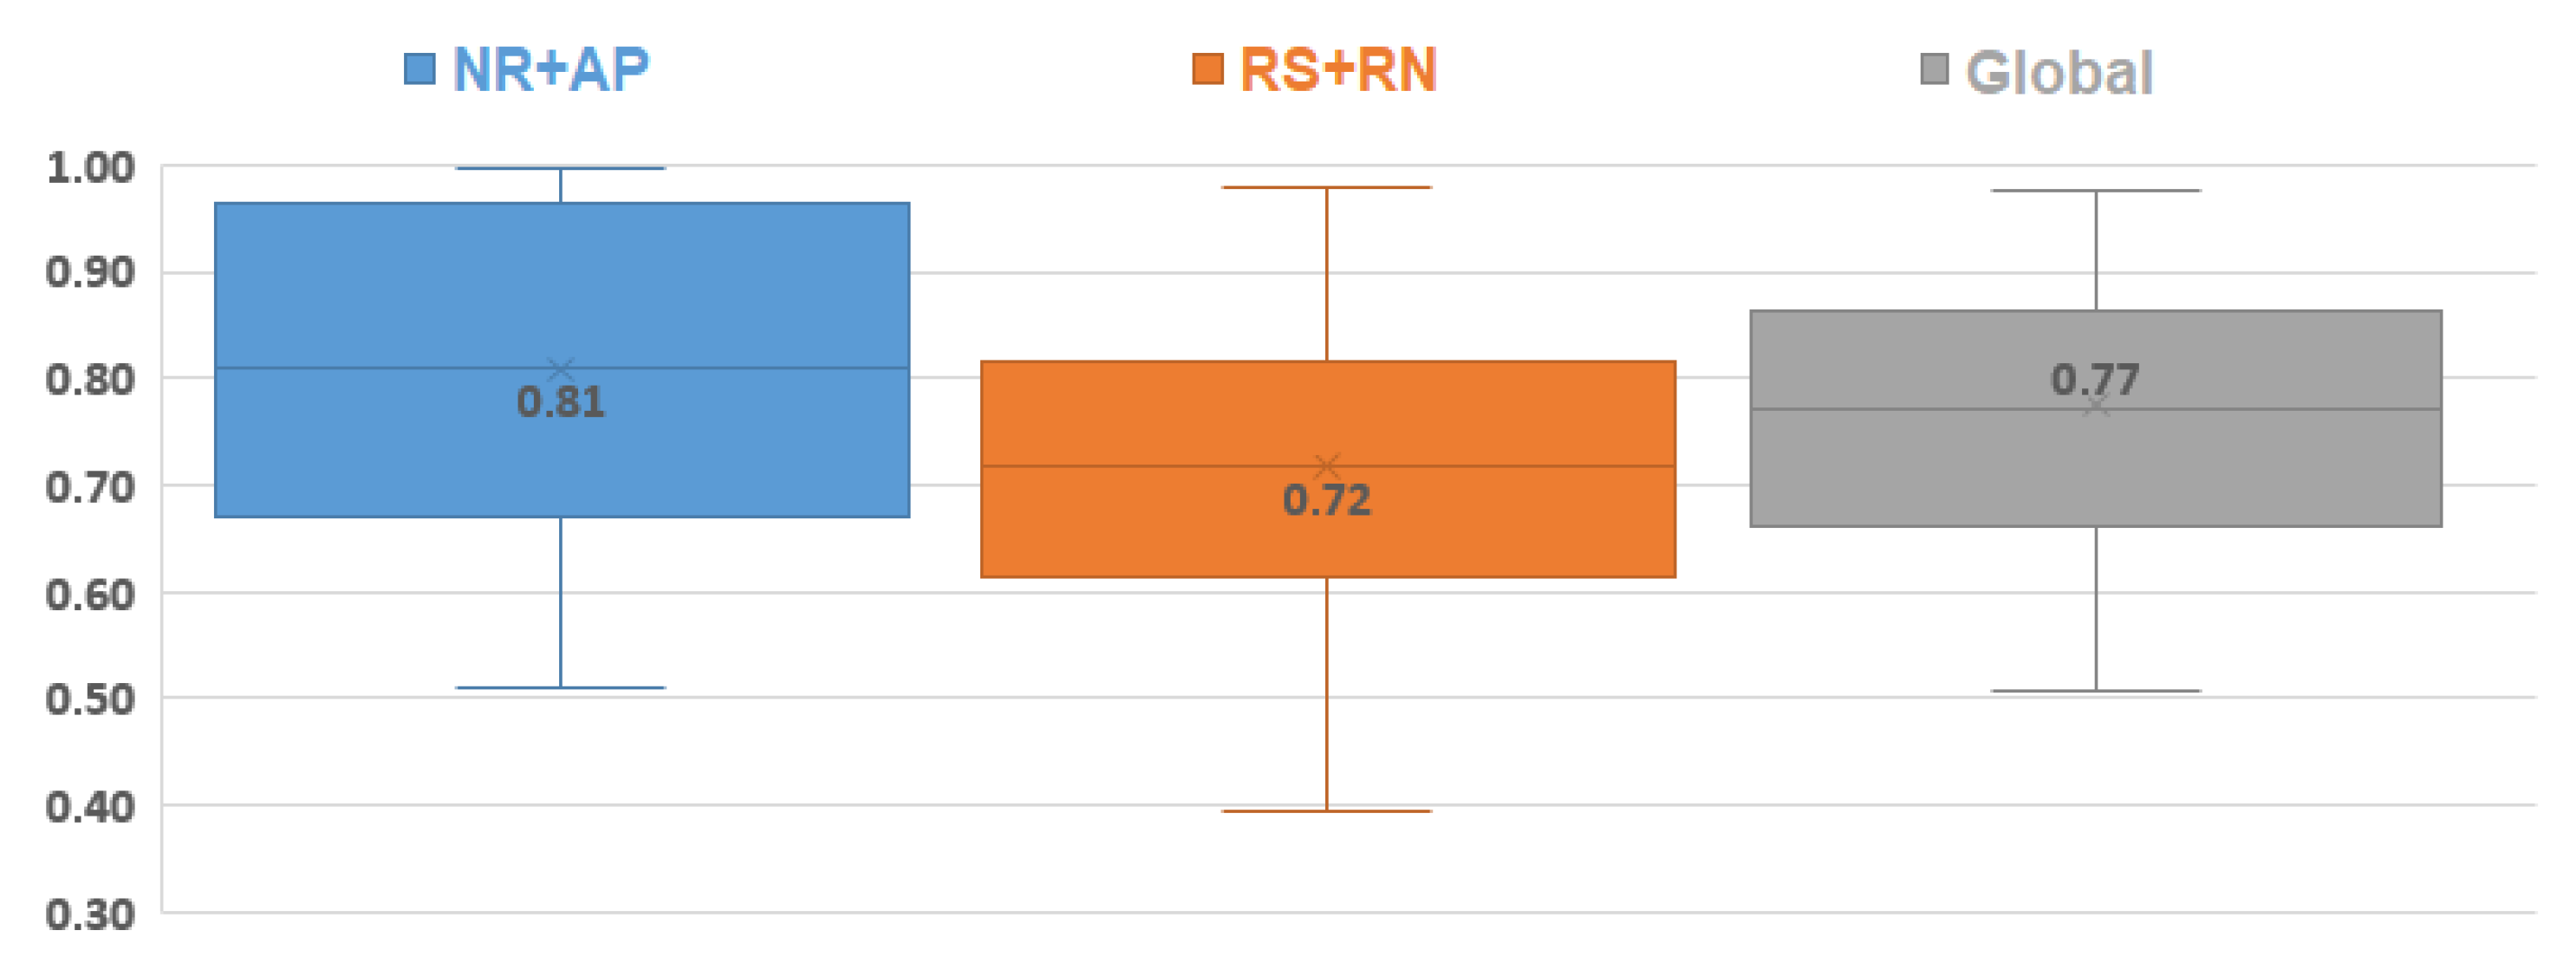
Figure 19.
Box plot (like box plot of
Figure 12) for the evaluation of the results of PDR according to EDR, separated into NR+AP (blue), RS+SN (orange), and global results (gray).
Figure 19.
Box plot (like box plot of
Figure 12) for the evaluation of the results of PDR according to EDR, separated into NR+AP (blue), RS+SN (orange), and global results (gray).
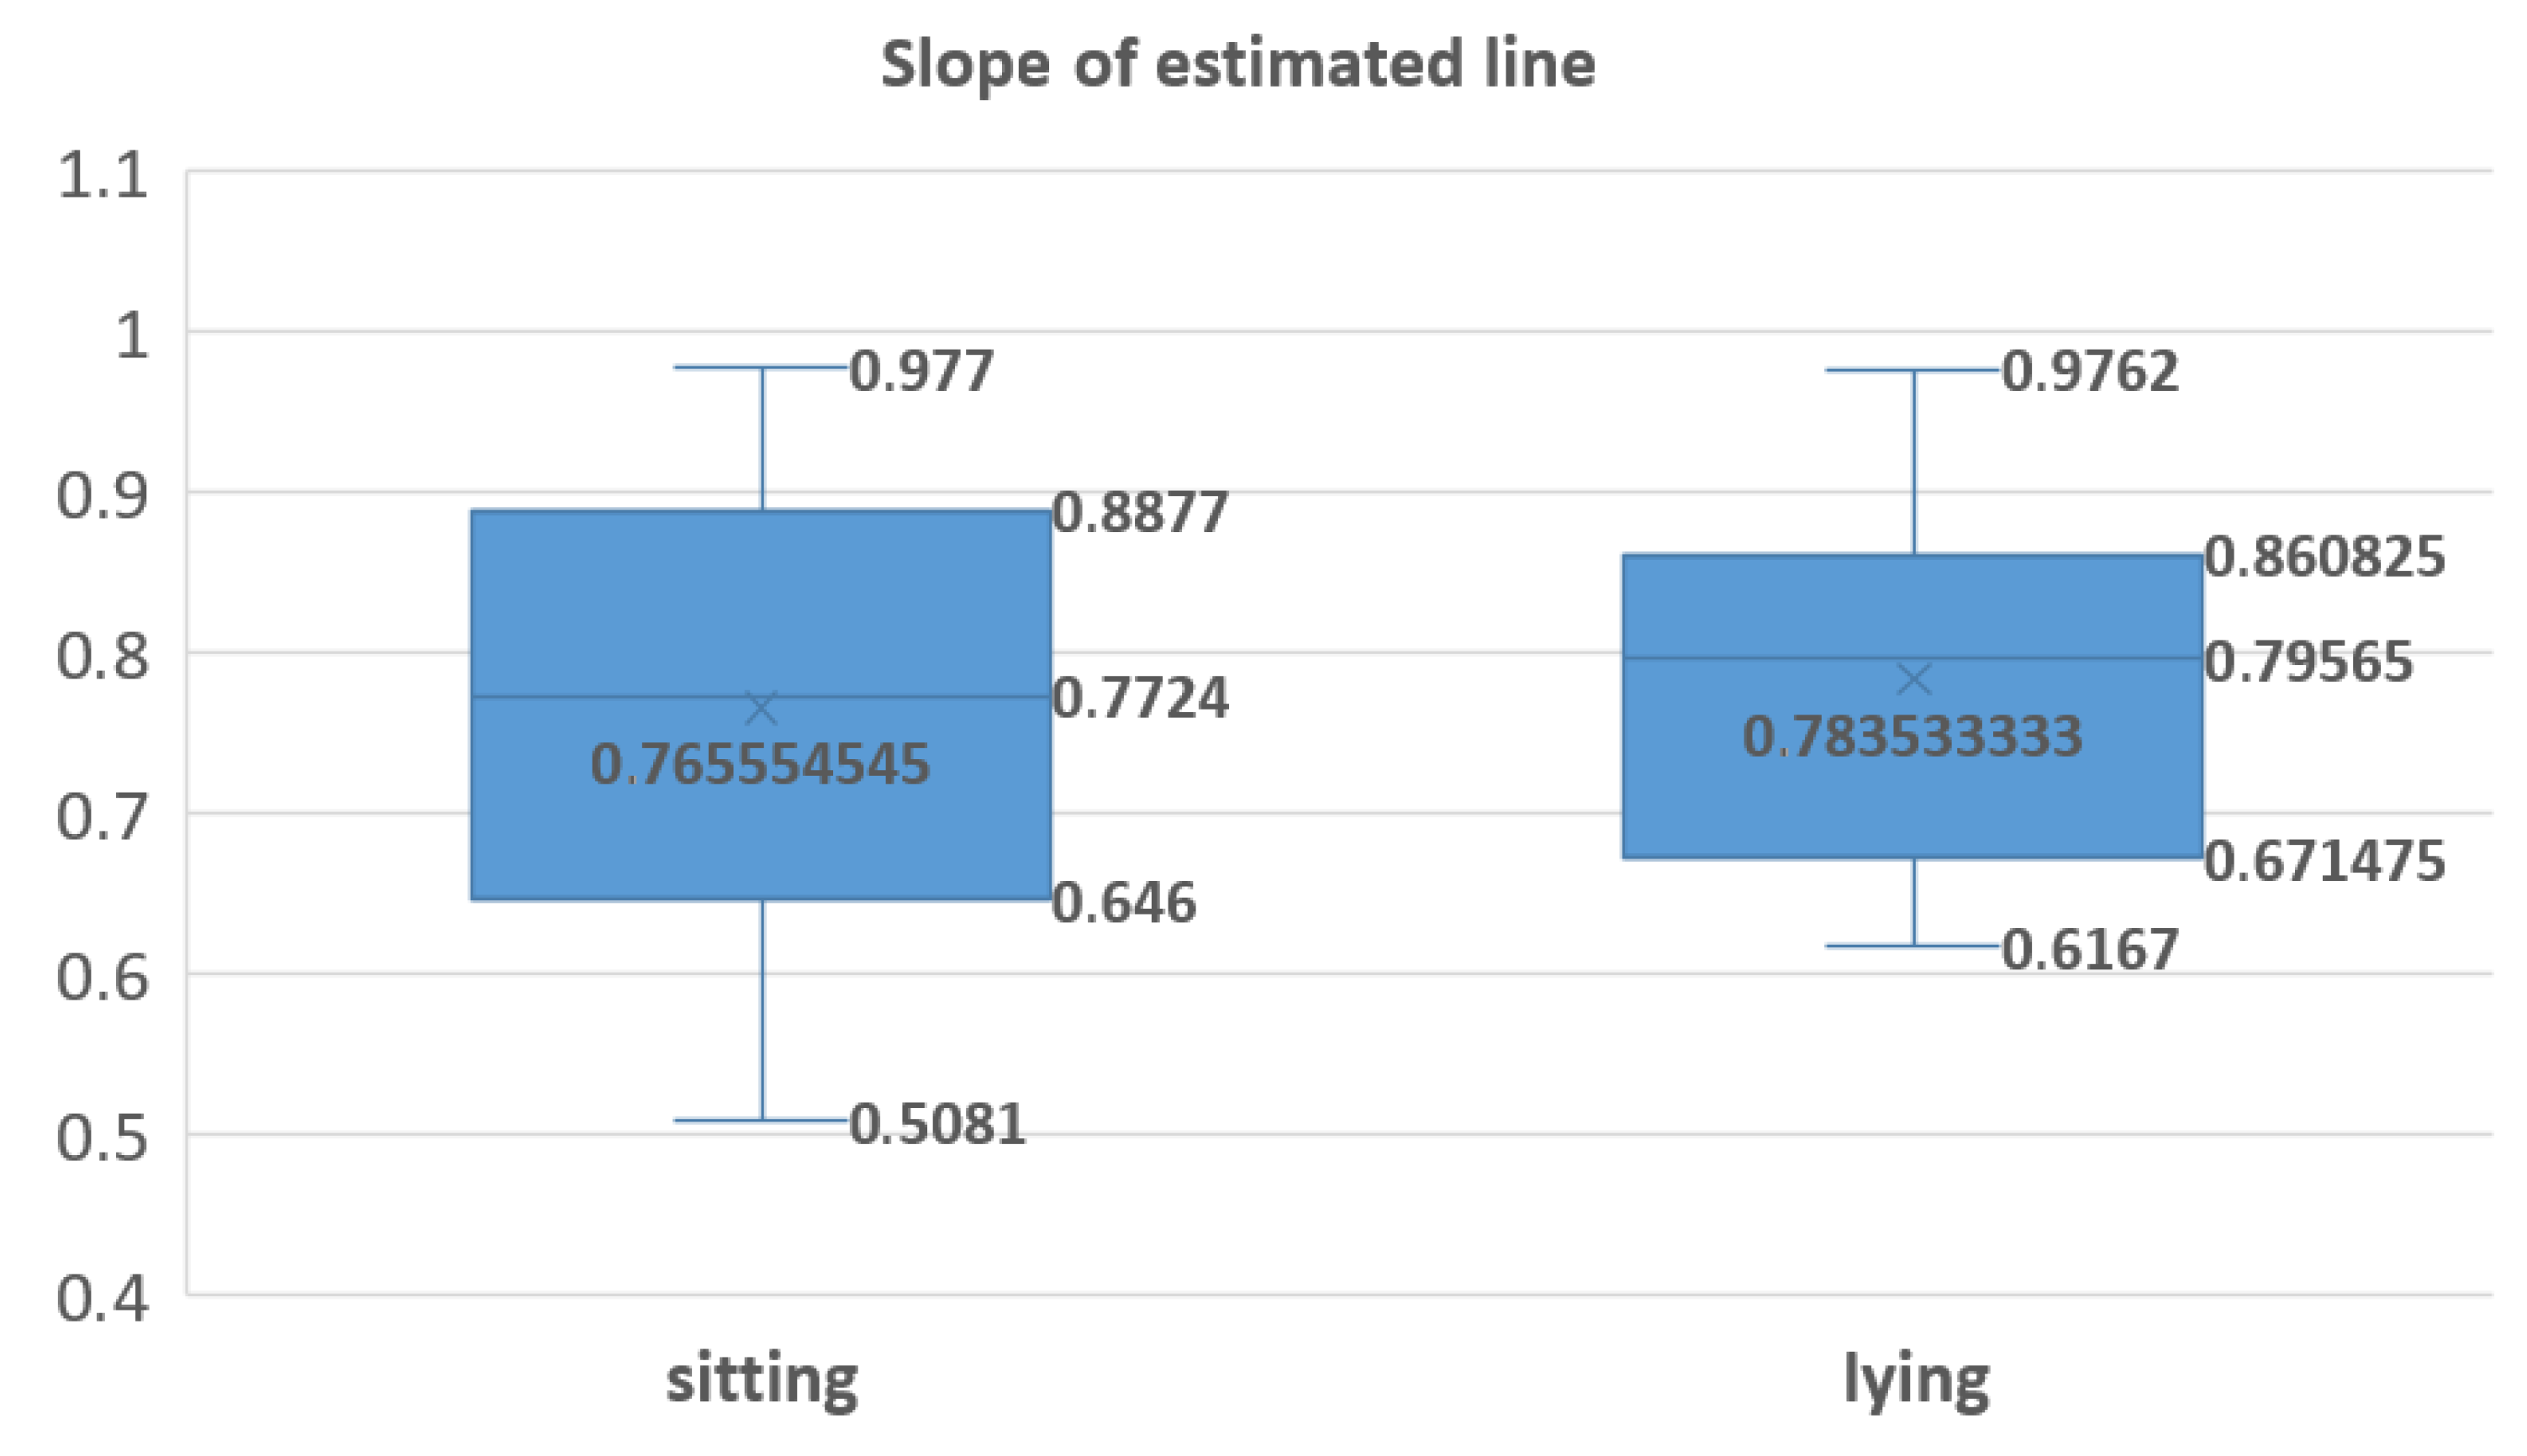
Figure 20.
Box plot (like box plot of
Figure 12) for the evaluation of the results of PDR according to EDR, separated in sitting (
left) and lying (
right) positions.
Figure 20.
Box plot (like box plot of
Figure 12) for the evaluation of the results of PDR according to EDR, separated in sitting (
left) and lying (
right) positions.
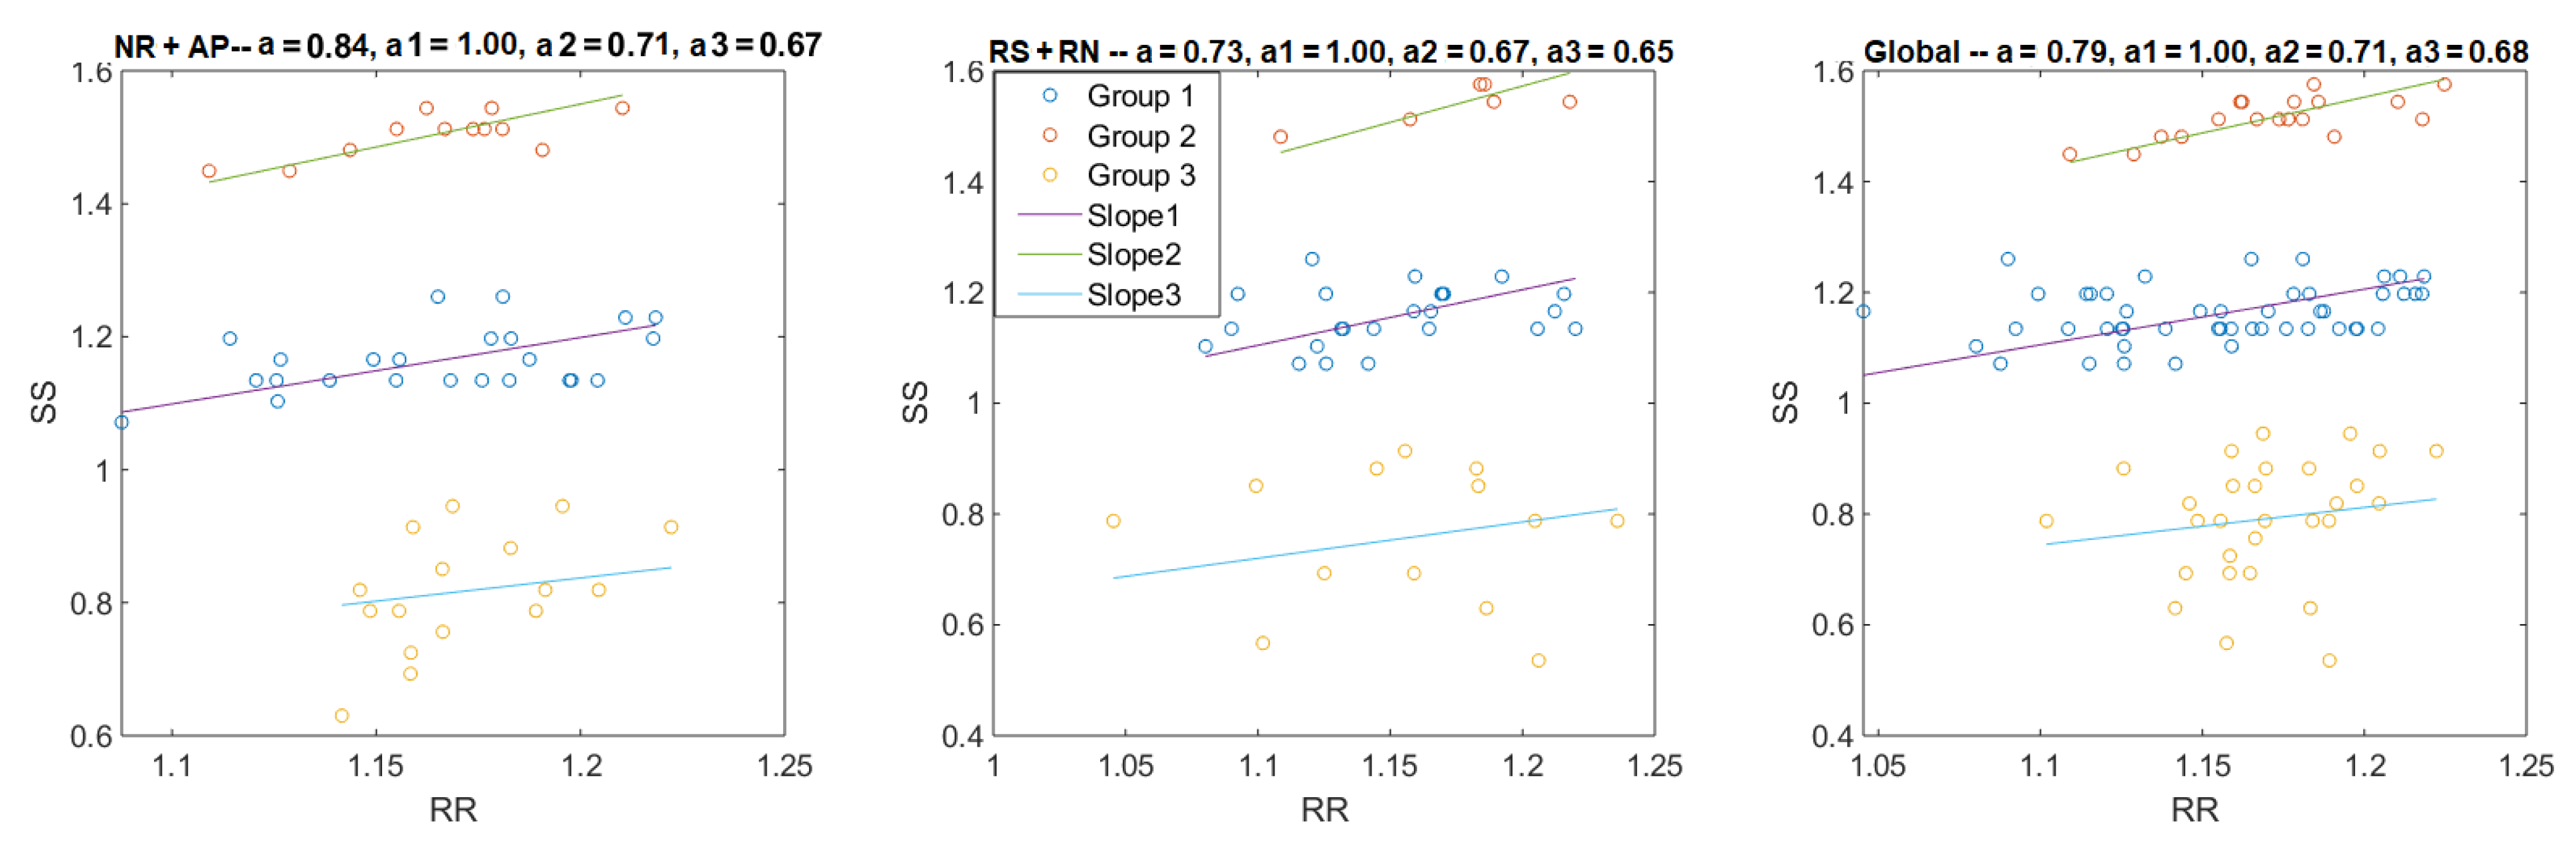
Figure 21.
The left, middle, and right figures show the linear regressions for NR + AP, RS + RN, and the whole recording. The blue points are from the group of R-R vs. S1-S1 or S2-S2 (group 1, at the middle group of each figure), the orange points are from the group of R-R vs. S2-S1 (group 2, at the top of each figure), and the yellow points are from the group of R-R vs. S1-S2 (group 3, at the bottom of each figure). The slopes of each fit line are presented the in figure title (, , and are slopes for the group 1, group 2, and group 3, respectively).
Figure 22.
Box plot (like the box plot of
Figure 12) for the distribution of fit line slopes for each group in each part and the global signal (in different rectangle).
Figure 22.
Box plot (like the box plot of
Figure 12) for the distribution of fit line slopes for each group in each part and the global signal (in different rectangle).
Table 1.
Temporal detection states.
Table 1.
Temporal detection states.
| State of | Explication | Conditions |
|---|
| 0 | Pause/apnea | |
| 1 | Inspiration/Expiration | |
| 2 | Speech/Snoring | |
Table 2.
Frequency detection stats.
Table 2.
Frequency detection stats.
| State of | Explication | Conditions |
|---|
| 0 | Pause/apnea | |
| 1 | Inspiration/Expiration | |
| 2 | Speech/Snoring | |
Table 3.
Cardiac detection (phonocardiogram (PCG)-derived respiration (PDR)) stats.
Table 3.
Cardiac detection (phonocardiogram (PCG)-derived respiration (PDR)) stats.
| State of | Explication | Conditions |
|---|
| −1 | expiration | |
| 1 | Inspiration | |
| 0 | Pause/apnea | s s |
| 2 | Speech/Snoring | |
Table 4.
Median values comparing for specificity, sensitivity and accuracy of each detection domain—NR + AP vs. RS + RN. * p-value < 0.05, difference between the two paired samples was significantly different.
Table 4.
Median values comparing for specificity, sensitivity and accuracy of each detection domain—NR + AP vs. RS + RN. * p-value < 0.05, difference between the two paired samples was significantly different.
| Detection Domain | Median Comparison | p-Value |
|---|
| Temporal | Specificity | p = 0.0966 |
| sensitivity | p = 0.8829 |
| Accuracy | p = 0.3638 |
| Frequency | Specificity | p = 0.0088 * |
| sensitivity | p = 0.2032 |
| Accuracy | p = 0.1219 |
| Cardiac (PDR) | Specificity | p = 0.016 * |
| sensitivity | p = 0.7369 |
| Accuracy | p = 0.0851 |
Table 5.
Median values comparing for specificity, sensitivity, and accuracy—sitting vs. lying.
Table 5.
Median values comparing for specificity, sensitivity, and accuracy—sitting vs. lying.
| Median Comparison | p-Value |
|---|
| Specificity | p = 0.2079 |
| sensitivity | p = 0.7354 |
| Accuracy | p = 1 |
Table 6.
Median values comparing for specificity, sensitivity, and accuracy of each detection domain—single detection domain vs. combining detection domain. * p-value < 0.05, difference between the two paired samples was significantly different.
Table 6.
Median values comparing for specificity, sensitivity, and accuracy of each detection domain—single detection domain vs. combining detection domain. * p-value < 0.05, difference between the two paired samples was significantly different.
| Median Comparison | Detection Domain | p-Value |
|---|
| Specificity | Temporal | p = 0.00889 * |
| Frequency | p = 0.01489 * |
| Cardiac | p = 9.896 × 10 * |
| Sensitivity | Temporal | p = 0.09933 |
| Frequency | p = 0.6348 |
| Cardiac | p = 0.001801 * |
| Accuracy | Temporal | p = 0.8417 |
| Frequency | p = 0.8028 |
| Cardiac | p = 0.2079 |

 ,
, 


