Article

Influence of Dispersed Oil on the Remote Sensing Reflectance—Field Experiment in the Baltic Sea

1
Department of Physics, Gdynia Maritime University, ul. Morska 81-87, 81-125 Gdynia, Poland
2
Department of Marine Physics, Institute of Oceanology of Polish Academy of Sciences, ul. Powstańców Warszawy 55, 81-712 Sopot, Poland
*
Author to whom correspondence should be addressed.
Sensors 2021, 21(17), 5733; https://doi.org/10.3390/s21175733
Submission received: 11 June 2021 / Revised: 31 July 2021 / Accepted: 20 August 2021 / Published: 25 August 2021
(This article belongs to the Special Issue Remote Sensing of Water Quality and Water Environment)

Abstract

:
Remote sensing techniques currently used to detect oil spills have not yet demonstrated their applicability to dispersed forms of oil. However, oil droplets dispersed in seawater are known to modify the local optical properties and, consequently, the upwelling light flux. Theoretically possible, passive remote detection of oil droplets was never tested in the offshore conditions. This study presents a field experiment which demonstrates the capability of commercially available sensors to detect significant changes in the remote sensing reflectance Rrs of seawater polluted by six types of dispersed oils (two crude oils, cylinder lubricant, biodiesel, and two marine gear lubricants). The experiment was based on the comparison of the upwelling radiance Lu measured in a transparent tank floating in full immersion in seawater in the Southern Baltic Sea. The tank was first filled with natural seawater and then polluted by dispersed oils in five consecutive concentrations of 1–15 ppm. After addition of dispersed oils, spectra of Rrs noticeably increased and the maximal increase varied from 40% to over three-fold at the highest oil droplet concentration. Moreover, the most affected Rrs band ratios and band differences were analyzed and are discussed in the context of future construction of algorithms for dispersed oil detection.

1. Introduction

The fates of oil spilled on the sea surface or leaking from underwater sources continue to be an ongoing topic of investigation and monitoring due to the extent environmental consequences of such events. Development of the models and methods for oil spill detection, as well as cleanup techniques, has led to a significant decrease of deliberate discharges. Over the past half-century, statistics for the frequency of medium and large spills (greater than 7 tons) from tankers have shown a downward trend. The yearly average recorded in the 2010s was 6.3 spills, which is less than a tenth of the average, 78.8, recorded in the 1970s [1]. In the extremely highly trafficked Baltic Sea, the total number of detected oil spills reduced from 763 in 1989 (upon the beginning of aerial surveillance of spills) through 472 in 2002, to 62 in 2018, pointing towards a steady decrease [2]. However, even statistically less numerous, and of smaller volume, oil spills continue to occur, and destructively affect the local and global environment, to name only a few: marine and near-shore fauna [3,4,5], marine flora [6], human health [7], and the seashore activities [8,9]. Oil spilled on the sea surface immediately starts passing along a series of chemical and physical processes known as “weathering”, with the degree and speed dependent on the type of oil and the environmental factors, including spreading, evaporation of volatile fractions, dissolution of low molecular weight PAHs (Policyclic Aromatic Hydrocarbons), emulsification, dispersion, biodegradation, etc., described in detail in [10,11,12]. While the majority of research focuses on the detection and monitoring of surface slick, much less attention is paid to the further stages of still ongoing weathering [13,14].
Currently, the oil spill response is based on the active and passive remote oil slick detection supported by various signal processing methods as well as oil spill modeling. Spaceborne detection techniques include extensively studied synthetic aperture radar (SAR) together with numerous classification algorithms [15,16,17,18] and radiometric (optical) imagery [19,20,21]. On the other hand, aerial surveillance for oil spill response is commonly equipped in side-looking airborne radars (SLAR) and laser fluorosensors, as well as the complementary thermal infrared sensors [2,22,23]. Both, the passive and active systems have their unique advantage and limitations; however, they never showed applicability to dispersed forms of oil.
Currently the fastest and most efficient methods combine the satellite SAR and airborne multispectral imagery to detect oil slicks and stable water-in-oil emulsions (containing 60–80% of water) [16,24]. However, monitoring of the fates of oil should not finish at the stage of water-in-oil emulsion. Remote detection limits, expressed in terms of the oil slick thickness, continue to shift as new methods are implemented [25]. Although satellite SAR cannot distinguish between thick slicks and a sheen, it can discriminate between thick stable emulsions and non-emulsified oil [26,27]. Nevertheless, sun glint-based spaceborne sensors have already demonstrated their capability to estimate oil slick thickness [28,29]. Still more precise are the airborne techniques which apply to the non-emulsified oil slicks covering the sea surface with a film of 0.05–3 mm thickness (e.g., passive microwave radar MWR-P, Optimare Systems, Bremerhaven, Germany) or even down to 0.05 µm for laser fluorosensors [30,31]. Laser-induced fluorescence was used to detect and classify the fresh and emulsified forms of hydrocarbons [32,33,34]. Fluorescence-based methods were also successful in underwater in situ detection of dissolved hydrocarbons [35,36].
Nevertheless, there are no commonly applied methods for the remote detection and monitoring of the remaining after-spill dispersed oil droplets. All techniques applied to oil slicks are based on the oil–water contrast in terms of the backscattered signal and its spatial or spectral distribution. Advanced oil spill models help predict the dynamics and evolution of an oil slick [14], assisting the scientists and the authorities in forecasting their trajectories in order to develop the best clean-up plans. Such models calculate the probable amount of oil in the water column at specified points of time [37]; however, the results highly depend on the model input data, the assumptions about the character of oil weathering processes, and a multitude of other factors [14]. The challenge of model execution in real time points toward the need for fast remote verification methods.
From the optical point of view, dispersed oil droplets modify the light propagation in seawater in the area of their occurrence, sometimes very significantly [38,39,40,41]; however, the character of such changes is completely unlike the oil slicks. Oil droplets do not cause sun glint, nor do they smooth the sea surface; also, their spreading properties and interfacial tension differ from the continuous oil film [42,43]. This is why their detection and monitoring need a different approach. New generation of sensors with constantly improving sensitivity combined with the appropriate experiment-based methods shall enable detection and monitoring of dispersed forms of oil in the near future [44].
This paper presents the results of a field experiment which demonstrates the change of intensity and spectral characteristics of the upwelling radiance Lu(λ) in seawater polluted by various concentrations and different types of dispersed oil in comparison to the unpolluted one. We show that Lu(λ) is sensitive to subtle changes caused by 1–15 parts per million (ppm) pollution of six types of oils: two crude oils, two marine gear lubricant oils, a cylinder oil, and a biodiesel. Afterwards, we discuss the possible consequences of the presence of dispersed oil for the retrieval of other seawater characteristics from the bio-optical models based on Rrs band ratios and band differences. Furthermore, we point to the Rrs ratios and differences most affected by dispersed oil, which can be useful in the outlook of dispersed oil detection.

2. Materials and Methods

This study was based on the measurements performed in the Southern Baltic Sea in April 2016 during a research ship cruise onboard the research vessel Oceania (Institute of Oceanology, Polish Academy of Sciences). The field experiment was designed in order to verify the possibility of the remote detection of dispersed oil. The remote sensing reflectance Rrs of natural seawater was compared to the Rrs of seawater polluted by dispersed oils in controlled conditions.

2.1. Description of the Tank

The oil-polluted area was limited to the dimensions of a transparent floating tank of 1.2 m × 1.2 m × 0.8 m, containing 1.152 m3 of water in the full immersion. Figure 1 shows the scheme of the tank and its implementation, first placed on the sea surface and then floating during the natural immersion.
The tank was made of transparent 2 cm thick blocks of plexiglass. Transparent walls ensured the maximum comparability of the experiment results with the natural light regime, modified only by the presence of dispersed oil. The construction of the tank allowed us to conduct Lu measurements in almost natural conditions. The tank was strengthened on the top by a metal frame used to transport it from the ship deck onto seawater. The frame was also designed to hold the sensors inside the tank. Under the frame, eight cylindrical buoys were mounted to ensure the self-floating of the tank fully filled with seawater. The bottom of the tank had 12 round holes of 3 cm diameter each, designed for the fast self-filling of the tank after placing it on the sea surface. The leakage of dispersed oil through the holes during the measurements was negligible, considering the construction of the tank and its horizontal floating motion. Construction elements of the tank could potentially, but only to a minor extent, influence the measured upwelling radiance; however, their influence should be alike for unpolluted and polluted seawater. Such influence did not affect the result of this experiment and was considered as inessential, because the primary focus of this study was on the changes in the upwelling light caused by dispersed oil pollution.
For the measurements, the tank was transported from the ship deck onto seawater. It was allowed to float awhile until it reached a position not affected by ship shadow. The scheme of the experiment concept is presented in Figure 2. Radiometric measurements were first carried out in the tank filled with natural seawater. Then, the tank was supplied with five consecutive portions of dispersed oil, and radiometric data were collected after each supplementation.

2.2. Optical Characteristics of the Background Natural Seawater

The Baltic Sea belongs to one of the basins most vulnerable to oil pollution. It is a very highly trafficked, semi-enclosed water basin with over 250 rivers, including nine large rivers flowing into it. The drainage area of the Baltic Sea is about four times larger than its surface area and is inhabited by around 85 million people [45]. Southern Baltic Sea coastal areas are rich in particulate organic matter from two major sources: autochthonous primary production and allochthonous riverine discharges [46]. Excess nutrient input is the main cause of eutrophication and, consequently, frequent algal blooms. This is why the inherent optical properties of the Baltic are measured on a regular basis, both in situ [47,48,49] and from space [50,51,52].
Our field experiment was conducted during a ship cruise of the Oceania r/v in the spring season on 13, 16, and 17 April 2016 at three stations: JA1 (N 54.65, E 18.68), Tank (N 54.81, E 18.40), and Mech1 (N 54.60, E 18.58). Locations of the stations are presented on the maps in Figure 3. Additionally, weather conditions and seawater characteristics from the stations are listed in Table 1. Figure 4 shows spectra of absorption a(λ) and scattering b(λ) coefficients collected in the surface layer (0–1 m) of natural seawater at the measurement stations using an absorption and attenuation meter AC-9 (WETLabs, Philomath, Oregon, USA). AC-9 data were registered with the frequency of six measurements per second, with the lowering speed 20–30 cm/s, which gives 20–30 measurements per each meter. Measurements were then interpolated to 1 m intervals from sea surface to sea bottom. Temperature and salinity corrections were applied to these measurements [53]. The signal was also corrected for scattering errors, which assumes zero absorption at 715 nm according to the recommended procedure [54].
Absorption coefficient at JA1 and Mech1, both placed in the Puck Bay, was comparable, as well as chlorophyll concentration level (see the last line in Table 1). The station Tank was placed in the open sea; therefore, the chlorophyll concentration and the absorption coefficient were accordingly lower. On the other hand, the highest scattering coefficient was at Mech1 and the lowest at JA1.
Light attenuation coefficient c(λ) was used to estimate the fraction of measured light intensity coming from inside the tank, shown in Figure 5. It was estimated in three directions from the radiance sensor: horizontal of 0.6 m, vertical of 0.8 m and the longest slant of 1.17 m. Measured upwelling signal came from the tank interior in 48–76% from horizontal direction, in 59–85% from vertical direction, and in 72–94% from the longest slant. The lowest contribution was always related to 555 nm, which was the minimum of c(λ), and the highest to 715 and 412 nm—the maximum of c(λ). On average, about 60–90% of the measured upwelling signal originates inside the tank.
In the presence of additional absorbing and scattering components in the water, the measured signal is even more determined by the volume of water present in the tank, so from that point of view, we assumed that filling up the tank of the size described above with dispersed oil should sufficiently represent the upwelling radiance in the presence of dispersed oil in the natural conditions. The authors are aware that potential presence of dispersed oil outside the tank could make additional modifications of the light field within the tank, but these should be only minor and, if present, should only enhance the effect of dispersed oil on the Rrs.

2.3. Preparation of Dispersed Oil Samples

Measurements were carried out for six types of oils. Their characteristics and their optical properties are summarized in Table 2. The oils included:
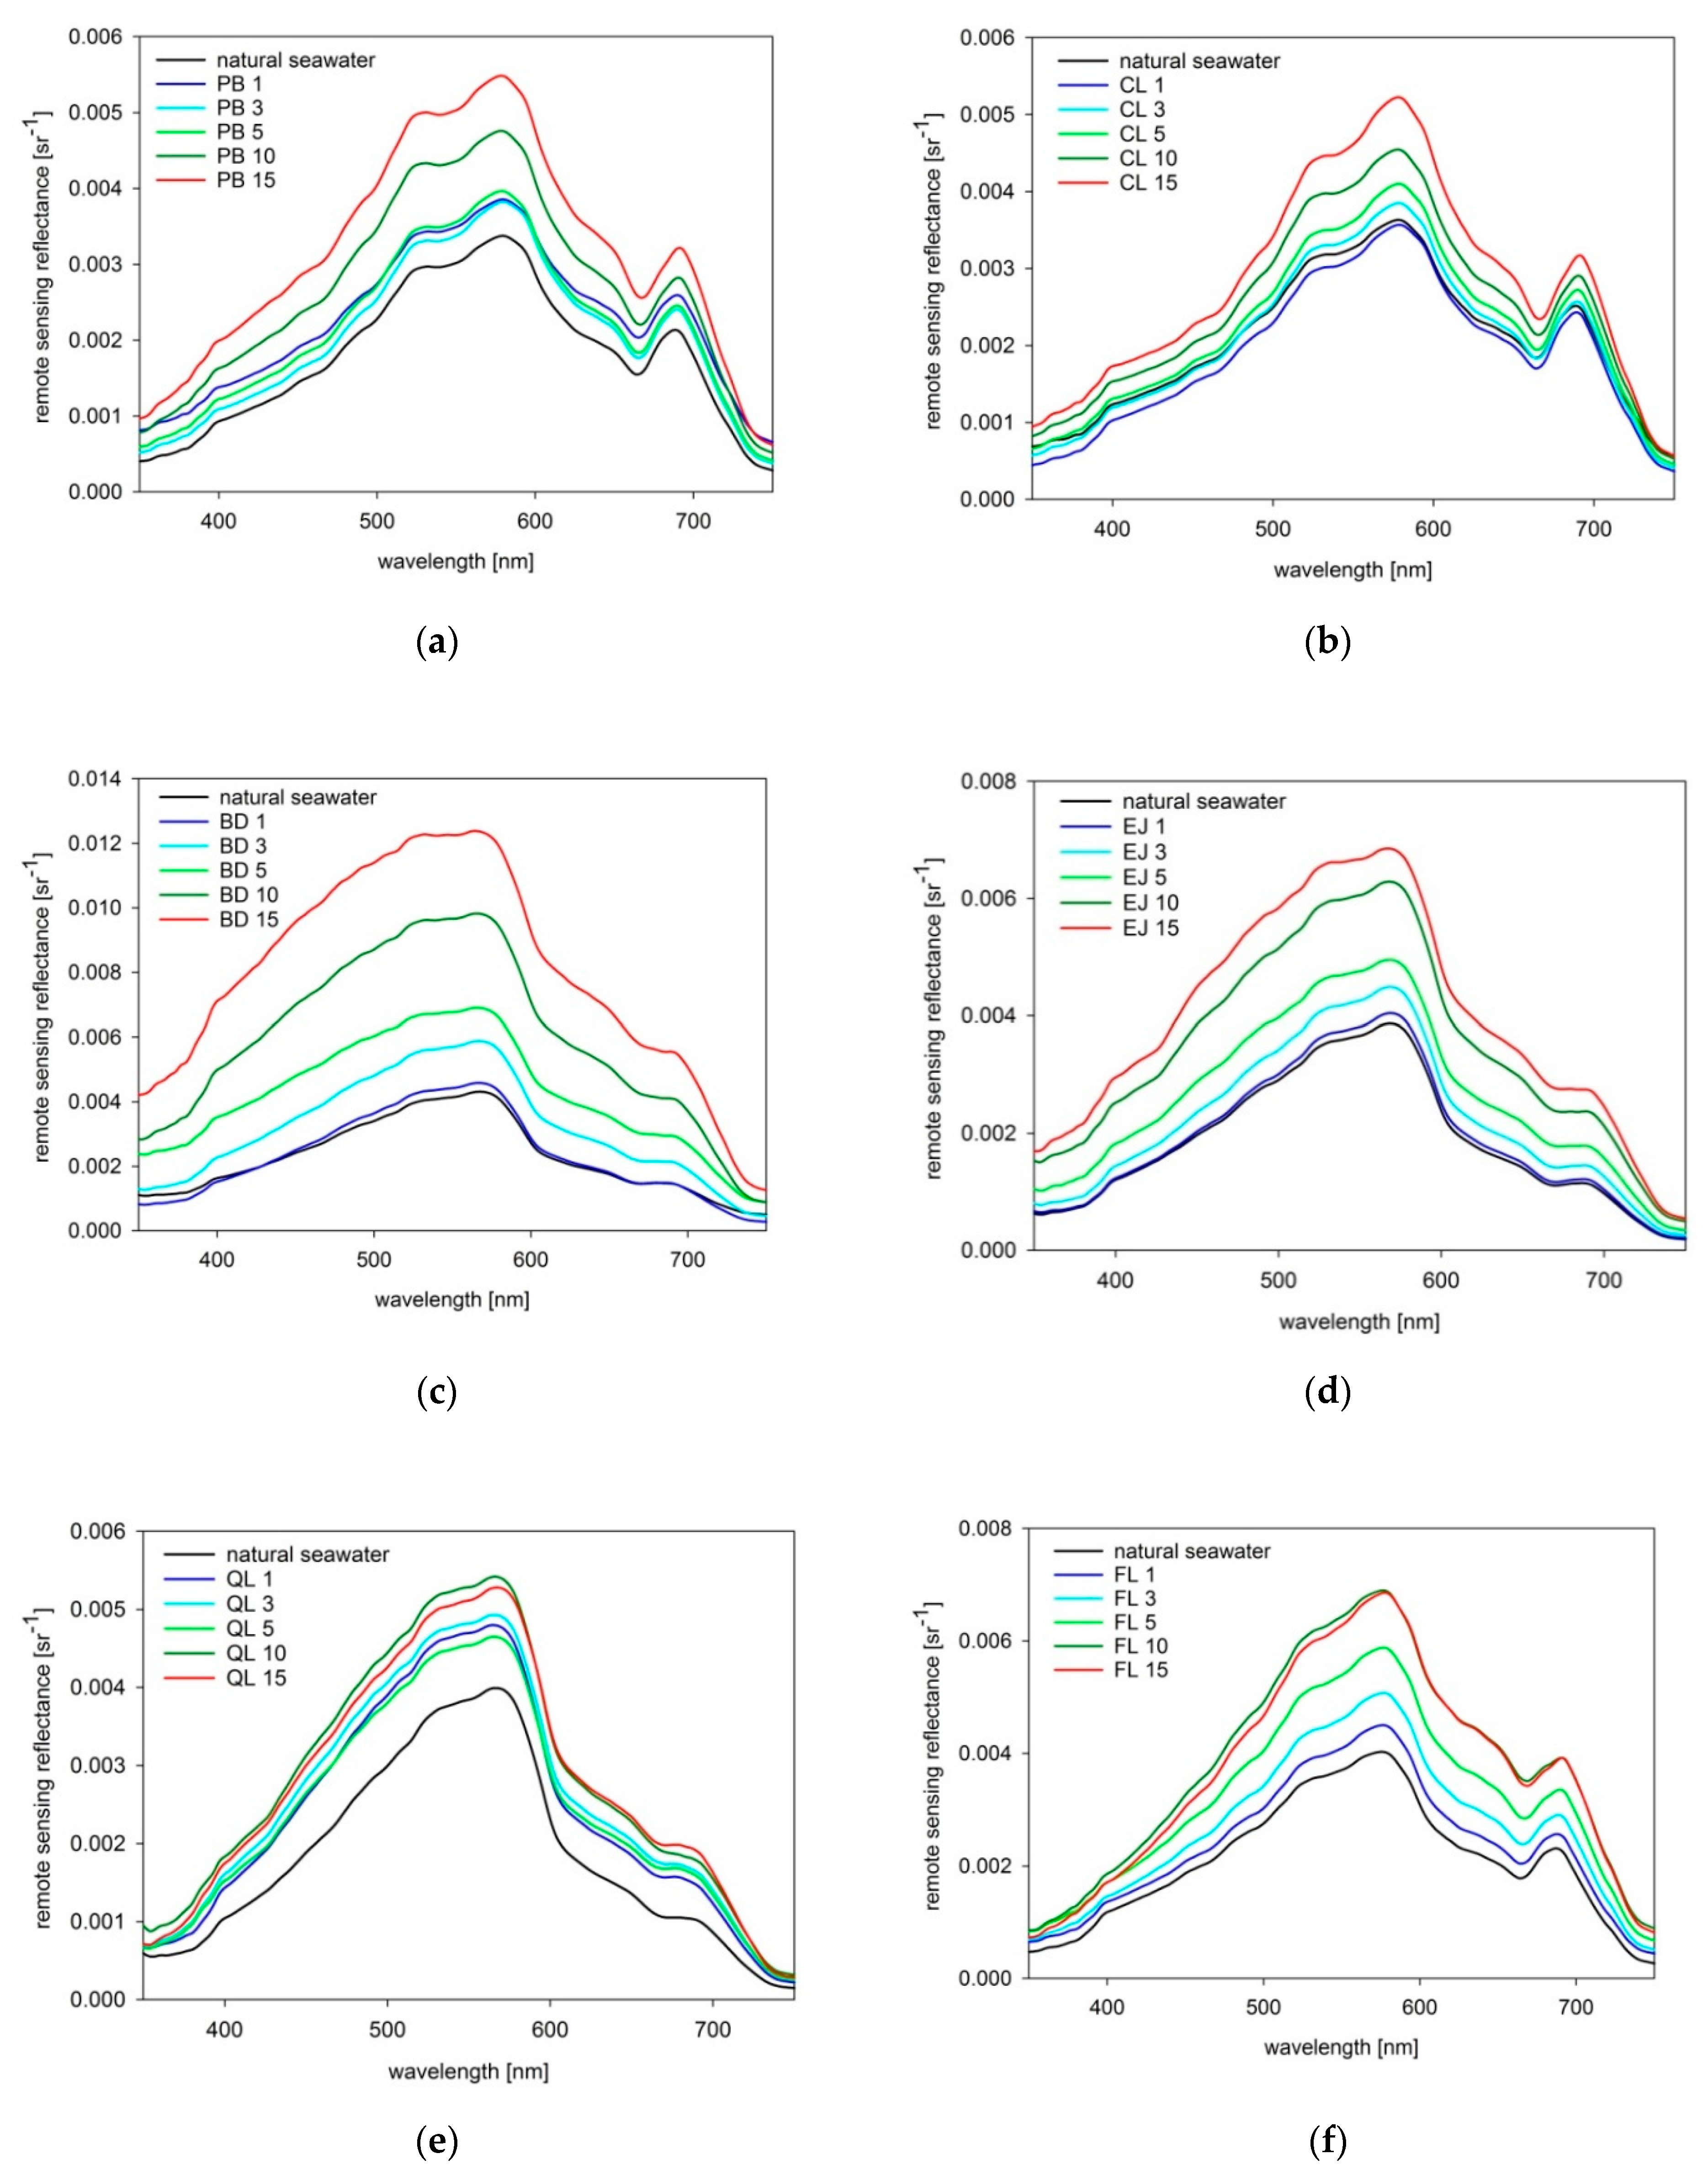
  • Crude oil Petrobaltic (PB), extracted offshore in the Southern Baltic in the Polish exclusive economic zone by LOTOS Petrobaltic S.A. (Gdańsk, Poland). PB is also known as Rozewie crude oil and it is extracted in majority from the B3 oil field located about 73 km north of Rozewie. It is characterized by about 73% of hydrocarbon content, an API gravity of 42–43, and a very low total sulfur content of 0.07–0.12 wt% [55]. PB belongs to light, very sweet crude oils.
  • Crude oil Flotta Blend (FL), extracted offshore in the North Sea in the British exclusive economic zone. It is a mixture of paraffin–naphthene-based hydrocarbons, characterized by an API gravity of 35–37, total sulfur content of 0.6–1.12 wt%, and total wax content of 6.75 wt% [55,56]. FL is a medium-heavy crude oil, significantly heavier than PB. Its sulfur content places it on the border between sweet and sour crudes, although it is more often referred to as a sweet or medium crude oil.
  • Cylinder lubricant oil Cyliten N460 (CL), produced by LOTOS Oil S.A (Gdańsk, Poland). Its formula is based on >80% deeply refined, dewaxed, and hydrorefined mineral oils characterized by low susceptibility to coking, and greased with <20% vegetable oil for improving of the lubrication properties [57]. Cyliten is applied for lubrication of high-pressure compressors as well as low-speed gears, used, among others, in marine engine systems. It is distinguished by extremely high dynamic viscosity.
  • Biodiesel BIO-100 (BD), purchased from PKN Orlen S.A. (Płock, Poland). It is a biofuel made of over 96% of fatty acid methyl esters. BIO-100 is made from vegetable oils, usually rapeseed or sunflower oils. It is applicable for most diesel engines [58,59]. It is very bright to transparent by appearance and has extremely low viscosity.
  • Marine gear lubricant Quicksilver Premium Gear Lube 80W-90 (QL), manufactured by Mercury Marine (Fond du Lac, WI, USA) for all kinds of outboards, recommended for use in marine gear cases with marine engines below 75 HP. It contains an emulsifier that improves protection of the gearbox against water ingress into the gear housing and additives improving the adhesion of the oil film.
  • Marine gear lubricant Evinrude Johnson HPFXR (EJ) manufactured by BRP US Inc. (Sturtevant, WI, USA). It is the fill gearcase lubricant for two-stroke outboards. It is described as a high-viscosity blend of enhanced friction reducers, anti-foam agents, and synthetic extreme pressure additives.
Samples of mechanically dispersed oils were prepared onboard the ship 12–18 h prior to measurement, according to the procedure described in [44,60,61]. Obtained stable concentrated oil-in-water dispersions, pictured in Figure 6, were stored in glass bottles at room temperature.
Then, during field measurements, concentrated oil dispersions were poured into the floating tank filled with natural seawater in five consecutive portions in order to receive the intended final volume concentrations of 1 ppm, 3 ppm, 5 ppm, 10 ppm, and 15 ppm. Tank content was then mixed for 2 min by means of slow-speed mechanical stirring using a paddle. Maximal possible uniformity of oil distribution was ensured by thorough mixing, relatively low tank volume, and low oil concentrations.
Prior to the field experiment, we had measured droplet size distributions of oil samples prepared in the same way as during the field experiment, presented in Figure 7. Measurements were performed in April 2014 in the laboratory using a Laser In Situ Scattering and Transmissometer LISST-100X (type B, Sequoia Scientific, Inc., Bellevue, WA, USA) in a stationary mode. Droplet size distributions were registered in 3 s intervals in real-time operation mode. We collected a minimum of 100 scans for each measurement and averaged three repetitions for each sample of dispersed oil to minimize the heterogeneity uncertainties.
All oil dispersions consisted mostly of micrometer-sized droplets and reached main maxima between 5 and 7 µm. Dispersed BD, EJ, PB, and FL also contained smaller oil particles which contribute very significantly to the backscatter signal [62,63]. Dispersed EJ, QL, and CL (as well as FL and BD in a minor degree) also contained large oil droplets of tens of micrometers. Such droplets tend to absorb more light than small droplets.

2.4. In Situ Measurements of the Remote Sensing Reflectance Rrs

The measurements carried out in the offshore conditions included the upwelling radiance Lu measured just below sea surface and the downwelling irradiance Ed measured by a reference sensor mounted on the ship deck. At every station, first Lu was measured in the tank filled with natural seawater (see Figure 2). Next, the first portion of dispersed oil was poured into the floating tank and the content of the tank was stirred. The upwelling radiance was measured in the tank, and after each measurement, the optical windows of the sensor were cleaned. Then, the second portion of dispersed oil was poured into the floating tank, mixed, and Lu data were collected again. This sequence was repeated for the third, fourth, and fifth portions of dispersed oil. At the end of each series of measurements, the tank was thoroughly washed and cleaned. Upwelling radiance measurements were averaged from a minimum of 430 measurements in order to minimize any heterogeneity and surface wave influence.
Upwelling radiance Lu(0,λ) (W m−2 nm−1 sr−1) just below the water surface was measured using the RAMSES−MRC (TriOS GmbH, Rastede, Germany) hyperspectral radiance sensor mounted on a special float, positioning the optical window approximately 2–5 cm below the sea surface. The head of the radiometer was custom designed with a narrow diameter in order to minimize the instrument self-shading effect. Simultaneously, downwelling irradiance Ed(0+,λ) (W m−2 nm−1) above the water was measured using the RAMSES−ACC−VIS (TriOS GmbH, Rastede, Germany) hyperspectral irradiance sensor. To calculate the remote sensing reflectance, Lu(0,λ) was transferred into the air medium Lu(0+,λ) by applying the immersion factor of Zibordi and Darecki [64]. Then, the remote sensing reflectance Rrs(0+,λ) was calculated using the following equation:
R r s ( 0 + , λ ) = L u ( 0 + , λ ) E d ( 0 + , λ )
The variability of Lw measurements was almost negligible because of the use of well-stabilized and calibrated radiometer and calm water conditions. Standard deviation did not exceed 2% in the analyzed spectral range.

3. Results and Discussion

3.1. Measurements of the Remote Sensing Reflectance

Results of the remote sensing reflectance Rrs measured in the transparent tank filled with natural seawater and seawater polluted by dispersed oil droplets in five consecutive concentrations are illustrated in Figure 8. We observed a significant increase of the upwelling signal, especially clearly visible for high oil droplet concentrations of 10–15 ppm. Maximal Rrs increase varied from about 40% for CL droplets to over three-fold for BD droplets.
Dispersed crude oil droplets have been already demonstrated as a substantial influence on optical characteristics of seawater in several radiative transfer modeling studies, e.g., [38,40,65]. Most of the past studies were limited to the analyses of one or two types of crude oils. The main conclusion of these studies was that at even as low a concentration as 1 ppm of oil, droplets can cause significant changes to the Rrs. This effect was dependent on oil type [65], droplet size distribution [62], and seawater optical properties [61], as well as wind conditions and sensor geometry [66]. In this study, we took a step forward from modeling to in situ experiment in a unique attempt to measure the Rrs of dispersed oil pollution in open sea conditions. We applied the idea of a comparative study between natural seawater and seawater polluted by oil droplets, as commonly practiced in ocean optics, e.g., on phytoplankton species [67] or other aquatic vegetation [68].

3.2. The Character of Rrs Changes Caused by Dispersed Oil Droplets

Figure 9 displays spectral characteristics and the degree of changes of Rrs caused by addition of five consecutive portions of dispersed oil droplets. PB and BD oil droplets (see Figure 9a,c) affected mostly the short (blue) visible waves of the upwelling light; CL droplets (see Figure 9b) most significantly increased the central (green) visible bands, while droplets of EJ, QL, and FL (see Figure 9d–f) resulted in the highest Rrs increase at long (red) visible bands.
For some types of oils, Rrs increases continuously proportional to the oil concentration (see Figure 9a–d). It should be noted that low oil concentrations of 1 and 3 ppm were characterized by higher relative uncertainties caused by limited oil dispersibility, deposition on walls, or heterogeneity of the mixed volume of water and oil. This is visible in Figure 8a where the Rrs for 1, 3, and 5 ppm partially overlap, but when we compare the Rrs for 5, 10, and 15 ppm we can see a steady increase, consistent with previous modeling results for similar droplet size distributions [38]. Another type of dispersed oil, CL (Figure 8b), decreased Rrs at their lowest concentration, and then caused a steady increase at higher concentrations. A similar effect was observed in our previous modeling results for Romashkino crude oil, characterized by extremely high absorption coefficient which decreases the Rrs [65]. Absorptive properties of CL are much lower than of Romashkino; however, they may be more significant at low droplet concentration than backscattering properties, which directly increases the Rrs, and enhances with the growing number of tiny droplets. On the other hand, the gentle drop of Rrs after adding the last oil portion, observed for QL and FL (Figure 8e,f), can be caused by spectral saturation. This might be connected to oil droplet coagulation, and thus explained by prevailing absorptive properties of larger droplets over backscattering properties [41,62].

3.3. Influence of Dispersed Oil on Rrs Band Ratios and Band Differences

The influence of dispersed oil on the selected Rrs band ratios and Rrs band differences is presented in Figure 10. Values of these factors, relative to natural seawater, are plotted for the maximal concentration of dispersed oil droplets of 15 ppm, and the following discussion refers to this concentration. Presented here is a brief analysis focusing on three types of Rrs band ratios, described in the subsections below.

3.3.1. “Blue-to-Green” Rrs Ratios Typically Applied in Ocean Color Algorithms

Ocean color is the spectral variation of the water-leaving radiance that can be related to the concentrations of optically active constituents. Satellite detection of ocean color is commonly applied in global and local bio-optical algorithms in order to retrieve seawater characteristic properties, such as the concentration of chlorophyll-a or suspended particulate matter [69,70,71]. Most of the examined oils, except for CL and FL, increased the blue-to-green Rrs ratios. Among NASA’s standard OCx algorithm band ratios [72], the highest increase was registered for the ratio of Rrs(440)/Rrs(555) (see the first three ratios on the polar plots in Figure 10). In particular, addition of dispersed PB, BD, EJ, and QL in the concentration of 10–15 ppm resulted in 20–40% increase of that ratio. On the other hand, CL oil droplets decreased that ratio by 6–9%, and FL oil droplets did not affect it in a significant way.
The next three ratios in Figure 10 illustrate other blue-to-green waveband combinations significantly affected by dispersed oils in our study. The ratio of Rrs(400)/Rrs(570) was the most sensitive to dispersed marine gear lubricant oils QL and EJ, as well as biodiesel BD and crude oil PB, and it increased by 26–52%. Dispersed biodiesel BD showed the greatest influence among all investigated oils on both Rrs absolute values and band ratios. Results of measurements are in agreement with previously modeled data [38] for PB dispersions described by log-normal type of size distribution function, characterized by the peak diameter of 1 µm (when we compare absolute values of Rrs) and characterized by the peak diameter of 0.5 µm (when we compare blue-to-green Rrs band ratios).

3.3.2. “Blue-to-Red” Rrs Ratios

A further five ratios in Figure 10 represent blue-to-red Rrs band ratios which do not have any standard global application in bio-optical algorithms in the ocean, however they are used locally in coastal waters, e.g., to derive surface concentrations of suspended particulate matter (SPM) and particulate organic carbon (POC) [71,73]. We found that there are Rrs band ratios affected by all or most types of investigated oils. As an example, the ratio of Rrs(490)/Rrs(690) increased by 19.5% after addition of 15 ppm of PB, and decreased by 9–22% for BD, EJ, and QL. Similarly, the ratio of Rrs(420)/Rrs(690) was increased by 8–39% by some oils (CL, BD, PB) and decreased by others by 5–12% (EJ, FL, QL). Some particular Rrs band ratios demonstrated the maximal influence for each type of oil droplets. Specifically, light crude PB oil droplets increased the ratio of Rrs(400)/Rrs(680) from 6% to almost 50% depending on droplet concentration. The maximal change caused by FL oil droplets was a 36% decrease observed for the ratio of Rrs(412)/Rrs(650).
Previous results of modeling carried out for dispersed Petrobaltic crude oil characterized by log-normal one-modal droplet size distribution [62] showed a reduction of blue-to-red Rrs band ratios regardless of the size distribution peak diameter. In this experiment, the real field size structure of dispersed oils had a two-modal shape. On the other side, blue-to-red ratios decreased for FL, EJ, and QL, and their size distributions contain much more large (>10 µm) droplets. This is how we see that droplet size distribution plays a significant role in the remote detection of dispersed oils.

3.3.3. “Green-to-Red” Rrs Ratios

The last four Rrs band ratios illustrated in Figure 10 represent green-to-red ratios, which are sometimes applied in bio-optical algorithms of complex waters, e.g., for estimation of chlorophyll-a concentration [70,71]. In this group of Rrs ratios, we found some that may be potentially applicable for specific type of oil. Ratios Rrs(550)/Rrs(660) and Rrs(570)/Rrs(660) decreased by 36–40% for BD, EJ, and QL oil droplets and by 18% for FL, while the ratios Rrs(550)/Rrs(680) and Rrs(530)/Rrs(680) demonstrated 14–18% increase for PB and CL, and over 20% decrease for other oils. Marine lubricant oil droplets EJ and QL had the greatest effect on “green-to-red” Rrs band ratios, reaching almost 50% for the ratio of Rrs(532)/Rrs(715). In addition, FL crude oil droplets noticeably increased that ratio by up to 30%. Oil influence on green-to-red ratios might be also dependent on natural seawater composition. Chlorophyll-a concentration was much lower at the Tank station, where the measurements were carried out for dispersed BD, EJ, and QL, and for these oils we noticed significant decrease of such ratios.

3.3.4. Rrs Band Differences

Furthermore, the analysis of three Rrs differences is included and plotted in Figure 11. Considering high oil droplet concentrations (10–15 ppm), the “green–blue” difference of Rrs(550)–Rrs(440) increased from over 10% for CL oil droplets to over 70% for dispersed FL. The increase of the “red–green” difference of Rrs(660)–Rrs(560) varied from about 20% for QL oil droplets to 125% for BD oil droplets. The greatest effect was noticed for the “red-blue” difference of Rrs(680)–Rrs(430) reaching over a five-fold increase for dispersed BD, 88% for FL, and 77% for EJ. What is interesting is that PB oil droplets decreased that difference by 43% in comparison to natural seawater. Presented here, Rrs band ratios and differences are good candidates for the structure of future algorithms for the remote detection of dispersed oil in seawater.

4. Conclusions

The first successful attempts of in situ measurements have been made in a self-designed floating tank. The promising results of this experiment provide an outlook for future research including continuation of in situ measurements and improving the model applicability on the basis of the field results. The field experiment was conducted during a cruise of the Oceania r/v in April 2016 in the Southern Baltic Sea. Remote sensing reflectance measured for natural seawater was compared to the one polluted by dispersed oils in controlled conditions. Data were collected for six types of oils. For most of the considered oils, there was a noticeable increase of the Rrs values with oil droplet concentration. Maximal increase varied from about 40% for lubricant oil Cyliten N460 (CL) droplets to over three-fold for biodiesel BIO-100 (BD) droplets. The effect depended on oil type and on natural seawater composition. Petrobaltic (PB) and BD oil droplets mostly affected the short visible waves of the upwelling light, and CL droplets most significantly increased the central visible bands, while droplets of marine lubricants Evinrude Johnson (EJ) and Quicksilver (QL), as well as crude oil Flotta (FL), resulted in the highest Rrs increase at long visible bands. Additionally, the impact of dispersed oils on Rrs band ratios that are commonly used in ocean color and other bio-optical models was evaluated. Some “blue-to-green” ratios increased by up to 40%, while other ratios specific for each oil even indicated over a 50% increase. The field experiment provided a solid ground for future advancements and opens a new chapter for the remote sensing of dispersed oil.

Author Contributions

Conceptualization, K.H.; methodology, K.H. and M.D.; software, K.H., M.D., K.B. and H.T.; validation, M.D.; investigation, K.H., M.D. and H.T.; resources, K.B.; data curation, K.H., M.D., K.B. and H.T.; writing—original draft preparation, K.H.; writing—review and editing, M.D. and K.B.; visualization, K.H. and K.B.; supervision, M.D.; project administration, H.T. All authors have read and agreed to the published version of the manuscript.

Funding

This research was funded by the National Science Centre of Poland, grant number UMO-2012/05/N/ST10/03707, and within the framework of the statutory research of the Institute of Oceanology of Polish Academy of Sciences.

Data Availability Statement

The data presented in this study are available on request from the corresponding author.

Acknowledgments

The paper was supported by an internal grant of Gdynia Maritime University, Faculty of Marine Engineering, no. WM/2021/PI/09. The authors would like to thank the crew of the Oceania r/v for the kind assistance with the measurements; the Head of the Department of Physics of Gdynia Maritime University, Włodzimierz Freda, for assistance in field measurements and administrative support; and Aneta Ocieczek for the access to her laboratory.

Conflicts of Interest

The authors declare no conflict of interest. The funders had no role in the design of the study; in the collection, analyses, or interpretation of data; in the writing of the manuscript, or in the decision to publish the results. The results of the experiment have been mentioned in the introduction of a Ph.D. thesis, as a part of the Ph.D. project [44] but have never been published or attempted to be published in any journal before.

References

  1. Oil Tanker Spill Statistics. International Tanker Owners Pollution Federation (ITOPF). 2020. Available online: https://www.itopf.org/knowledge-resources/documents-guides/document/oil-tanker-spill-statistics-2020/ (accessed on 23 May 2021).
  2. HELCOM Annual Report on Discharges Observed During Aerial Surveillance in the Baltic Sea. HELCOM 2018. Available online: https://helcom.fi/wp-content/uploads/2020/01/HELCOM-Aerial-Surveillance-Report-2018.pdf (accessed on 23 May 2021).
  3. Chilvers, B.L.; Morgan, K.J.; White, B.J. Sources and reporting of oil spills and impacts on wildlife 1970–2018. Environ. Sci. Pollut. Res. 2021, 28, 754–762. [Google Scholar] [CrossRef] [PubMed]
  4. King, M.D.; Elliott, J.E.; Williams, T.D. Effects of petroleum exposure on birds: A review. Sci. Total Environ. 2021, 755, 142834. [Google Scholar] [CrossRef]
  5. Langangen, O.; Olsen, E.; Stige, L.C.; Ohlberger, J.; Yaragina, N.A.; Vikebø, F.B.; Bogstad, B.; Stenseth, N.C.; Hjermann, D.O. The effects of oil spills on marine fish: Implications of spatial variation in natural mortality. Mar. Pollut. Bull. 2017, 119, 102–109. [Google Scholar] [CrossRef] [PubMed]
  6. Keesing, J.K.; Gartner, A.; Westera, M.; Edgar, G.J.; Myers, J.; Hardman-Mountford, N.J.; Bailey, M. Impacts and environmental risks of oil spills on marine invertebrates, algae and seagrass: A global review from an Australian perspective. In Oceanography and Marine Biology, 1st ed.; Hawkins, S.J., Evans, A.J., Dale, A.C., Firth, L.B., Smith, I.P., Eds.; CRC Press: Boca Raton, FL, USA, 2018; Volume 56, pp. 311–370. [Google Scholar] [CrossRef]
  7. Aguilera, F.; Méndez, J.; Pásaroa, E.; Laffona, B. Review on the effects of exposure to spilled oils on human health. J. Appl. Toxicol. 2010, 30, 291–301. [Google Scholar] [CrossRef] [PubMed]
  8. Hawkins, S.J.; Evans, A.J.; Mieszkowska, N.; Adams, L.C.; Bray, S.; Burrows, M.T.; Firth, L.B.; Genner, M.J.; Leung, K.M.Y.; Moore, P.J.; et al. Distinguishing globally-driven changes from regional- and local-scale impacts: The case for long-term and broad-scale studies of recovery from pollution. Mar. Pollut. Bull. 2017, 124, 573–586. [Google Scholar] [CrossRef] [PubMed] [Green Version]
  9. Owens, E.; Santner, R. Integration of a shoreline response program (SRP) and shoreline assessment surveys into an Incident Management System for oil spill response. J. Environ. Manag. 2021, 279, 111637. [Google Scholar] [CrossRef] [PubMed]
  10. Mishra, A.K.; Kumar, G.S. Weathering of Oil Spill: Modeling and Analysis. Aquat. Procedia 2015, 4, 435–442. [Google Scholar] [CrossRef]
  11. Kasimu, A.; Wu, D.D.; Bian, Y. System Dynamic-Based Oil Weathering Processes: Simulation and Analysis. IEEE Syst. J. 2020, 14, 1375–1383. [Google Scholar] [CrossRef]
  12. Boniewicz-Szmyt, K.; Pogorzelski, S.J. Influence of Surfactant Concentration and Temperature Gradients on Spreading of Crude-oil at Sea. Front. Mar. Sci. 2018, 5, 2296–7745. [Google Scholar] [CrossRef]
  13. Gong, Y.; Zhao, X.; Cai, Z.; O’Reilly, S.E.; Hao, X.; Zhao, D. A review of oil, dispersed oil and sediment interactions in the aquatic environment: Influence on the fate, transport and remediation of oil spills. Mar. Pollut. Bull. 2014, 79, 16–33. [Google Scholar] [CrossRef] [PubMed]
  14. Keramea, P.; Spanoudaki, K.; Zodiatis, G.; Gikas, G.; Sylaios, G. Oil spill modeling: A critical review on current trends, perspectives, and challenges. J. Mar. Sci. Eng. 2021, 9, 181. [Google Scholar] [CrossRef]
  15. Fingas, M.; Brown, C. A Review of oil spill remote sensing. Sensors 2017, 18, 91. [Google Scholar] [CrossRef] [PubMed] [Green Version]
  16. Alpers, W.; Holt, B.; Zeng, K. Oil spill detection by imaging radars: Challenges and pitfalls. Remote Sens. Environ. 2017, 201, 133–147. [Google Scholar] [CrossRef]
  17. Topouzelis, K.N. Oil spill detection by SAR images: Dark formation detection, feature extraction and classification algorithms. Sensors 2008, 8, 6642–6659. [Google Scholar] [CrossRef] [Green Version]
  18. Konik, M.; Bradtke, K. Object-oriented approach to oil spill detection using ENVISAT ASAR images. ISPRS J. Photogramm. Remote Sens. 2016, 118, 37–52. [Google Scholar] [CrossRef]
  19. Brekke, C.; Solberg, A.H.S. Oil spill detection by satellite remote sensing. Remote Sens. Environ. 2005, 95, 1–13. [Google Scholar] [CrossRef]
  20. Liu, S.; Chi, M.; Zou, Y.; Samat, A.; Benediktsson, J.A.; Plaza, A. Oil Spill Detection via Multitemporal Optical Remote Sensing Images: A Change Detection Perspective. IEEE Geosci. Remote Sens. Lett. 2017, 14, 324–328. [Google Scholar] [CrossRef]
  21. Jha, M.N.; Levy, J.; Gao, Y. Advances in remote sensing for oil spill disaster management: State-of-the-art sensors technology for oil spill surveillance. Sensors 2008, 8, 236–255. [Google Scholar] [CrossRef] [Green Version]
  22. Sun, S.; Hu, C. The Challenges of Interpreting Oil-Water Spatial and Spectral Contrasts for the Estimation of Oil Thickness: Examples from Satellite and Airborne Measurements of the Deepwater Horizon Oil Spill. IEEE Trans. Geosci. Remote Sens. 2019, 57, 2643–2658. [Google Scholar] [CrossRef]
  23. Gil, P.; Alacid, B. Oil spill detection in terma-side-looking airborne radar images using image features and region segmentation. Sensors 2018, 18, 151. [Google Scholar] [CrossRef] [Green Version]
  24. Leifer, I.; Lehr, W.J.; Simecek-Beatty, D.; Bradley, E.; Clark, R.; Dennison, P.; Hu, Y.; Matheson, S.; Jones, C.E.; Holt, B.; et al. State of the art satellite and airborne marine oil spill remote sensing: Application to the BP Deepwater Horizon oil spill. Remote Sens. Environ. 2012, 124, 185–209. [Google Scholar] [CrossRef] [Green Version]
  25. Garcia-Pineda, O.; Staples, G.; Jones, C.E.; Hu, C.; Holt, B.; Kourafalou, V.; Graettinger, G.; DiPinto, L.; Ramirez, E.; Streett, D.; et al. Classification of oil spill by thicknesses using multiple remote sensors. Remote Sens. Environ. 2020, 236, 111421. [Google Scholar] [CrossRef]
  26. Fingas, M. The challenges of remotely measuring oil slick thickness. Remote Sens. 2018, 10, 319. [Google Scholar] [CrossRef] [Green Version]
  27. Guo, J.; Zhang, T.; Zhang, X.; Liu, G. Impact of emulsification of crude oil on normalized radar cross section. J. Oceanol. Limnol. 2020, 38, 42–54. [Google Scholar] [CrossRef]
  28. De Carolis, G.; Adamo, M.; Pasquariello, G. On the estimation of thickness of marine oil slicks from sun-glittered, near-infrared MERIS and MODIS imagery: The Lebanon oil spill case study. IEEE Trans. Geosci. Remote Sens. 2014, 52, 559–573. [Google Scholar] [CrossRef]
  29. He, S.; Dong, H. Simultaneous estimation of the refractive index and thickness of marine oil slick from the degree of linear polarization of the sun-glint reflection. Prog. Electromagn. Res. 2018, 163, 133–142. [Google Scholar] [CrossRef] [Green Version]
  30. Suo, Z.; Lu, Y.; Liu, J.; Ding, J.; Yin, D.; Xu, F.; Jiao, J. Ultraviolet remote sensing of marine oil spills: A new approach of Haiyang-1C satellite. Opt. Express 2021, 29, 13486–13495. [Google Scholar] [CrossRef] [PubMed]
  31. Lu, Y.; Zhan, W.; Hu, C. Detecting and quantifying oil slick thickness by thermal remote sensing: A ground-based experiment. Remote Sens. Environ. 2016, 181, 207–217. [Google Scholar] [CrossRef]
  32. Brown, C.E.; Fingas, M.F.; Marois, R.; Fieldhouse, B.; Gamble, R.L. Remote sensing of water-in-oil emulsions: Initial laser fluorosensor studies. In Proceedings of the 27 Arctic and Marine Oilspill Program (AMOP) Technical Seminar (V1), Ottawa, ON, Canada, 1 July 2004; p. 1046. [Google Scholar]
  33. Baszanowska, E.; Otremba, Z. Fluorometric index for sensing oil in the sea environment. Sensors 2017, 17, 1276. [Google Scholar] [CrossRef] [Green Version]
  34. Baszanowska, E.; Otremba, Z. Detecting the presence of different types of oil in seawater using a fluorometric index. Sensors 2019, 19, 3774. [Google Scholar] [CrossRef] [Green Version]
  35. Bukin, O.; Proschenko, D.; Alexey, C.; Korovetskiy, D.; Bukin, I.; Yurchik, V.; Sokolova, I.; Nadezhkin, A. New Solutions of Laser-Induced Fluorescence for Oil Pollution Monitoring at Sea. Photonics 2020, 7, 36. [Google Scholar] [CrossRef]
  36. Conmy, R.N.; Coble, P.G.; Farr, J.; Wood, A.M.; Lee, K.; Pegau, W.S.; Walsh, I.D.; Koch, C.R.; Abercrombie, M.I.; Miles, M.S.; et al. Submersible optical sensors exposed to chemically dispersed crude oil: Wave tank simulations for improved oil spill monitoring. Environ. Sci. Technol. 2014, 48, 1803–1810. [Google Scholar] [CrossRef]
  37. Fingas, M.F.; Yetilmezsoy, K.; Bahramian, M. Development of an Algorithm for Chemically Dispersed Oil Spills. Front. Mar. Sci. 2020, 7, 982. [Google Scholar] [CrossRef]
  38. Haule, K.; Freda, W.; Darecki, M.; Toczek, H. Possibilities of optical remote sensing of dispersed oil in coastal waters. Estuar. Coast. Shelf Sci. 2017, 195, 76–87. [Google Scholar] [CrossRef]
  39. Haule, K.; Darecki, M.; Toczek, H. Light penetration in seawater polluted by dispersed oil: Results of radiative transfer modelling. J. Eur. Opt. Soc. Rapid Publ. 2015, 10, 15052. [Google Scholar] [CrossRef] [Green Version]
  40. Baszanowska, E.; Otremba, Z.; Piskozub, J. Modelling remote sensing reflectance to detect dispersed oil at sea. Sensors 2020, 20, 863. [Google Scholar] [CrossRef] [Green Version]
  41. Freda, W. Comparison of the spectral-angular properties of light scattered in the Baltic Sea and oil emulsions. J. Eur. Opt. Soc.-Rapid Publ. 2014, 9, 14017. [Google Scholar] [CrossRef] [Green Version]
  42. Boniewicz-Szmyt, K.; Pogorzelski, S.; Mazurek, A. Hydrocarbons on sea water: Steady-state spreading signatures determined by an optical method. Oceanologia 2007, 49, 413–437. [Google Scholar]
  43. Boniewicz-Szmyt, K.; Pogorzelski, S.J. Crude oil derivatives on sea water: Signatures of spreading dynamics. J. Mar. Syst. 2008, 74, S41–S51. [Google Scholar] [CrossRef]
  44. Haule, K. Modelling the Influence of Dispersed oil Droplets on the Upwelling Light Flux in Seawater in Application to Satellite Remote Sensing. Ph.D. Thesis, Institute of Oceanology of Polish Academy of Sciences, Sopot, Poland, 2019. Available online: www.kamilahaule.com (accessed on 24 May 2021).
  45. State of the Baltic Sea—Second HELCOM Holistic Assessment 2011–2016. Baltic Sea Environment Proceedings 155, HELCOM 2018. Available online: www.helcom.fi/baltic-sea-trends/holistic-assessments/state-of-the-baltic-sea-2018/reports-and-materials/ (accessed on 24 May 2021).
  46. Maksymowska, D.; Richard, P.; Piekarek-Jankowska, H.; Riera, P. Chemical and Isotopic Composition of the Organic Matter Sources in the Gulf of Gdansk (Southern Baltic Sea). Estuar. Coast. Shelf Sci. 2000, 51, 585–598. [Google Scholar] [CrossRef]
  47. Śliwińska-Wilczewska, S.; Cieszyńska, A.; Konik, M.; Maculewicz, J.; Latała, A. Environmental drivers of bloom-forming cyanobacteria in the Baltic Sea: Effects of salinity, temperature, and irradiance. Estuar. Coast. Shelf Sci. 2019, 219, 139–150. [Google Scholar] [CrossRef]
  48. Woźniak, S.B.; Sagan, S.; Zabłocka, M.; Stoń-Egiert, J.; Borzycka, K. Light scattering and backscattering by particles suspended In the Baltic Sea In relation to the mass concentration of particles and the proportions of their organic and inorganic fractions. J. Mar. Syst. 2018, 182, 79–96. [Google Scholar] [CrossRef]
  49. Freda, W. Spectral dependence of the correlation between the backscattering coefficient and the volume scattering function measured in the southern Baltic Sea. Oceanologia 2012, 54, 355–367. [Google Scholar] [CrossRef] [Green Version]
  50. Woźniak, S.B.; Darecki, M.; Sagan, S. Empirical Formulas for Estimating Backscattering and Absorption Coefficients in Complex Waters from Remote-Sensing Reflectance Spectra and Examples of Their Application. Sensors 2019, 19, 4043. [Google Scholar] [CrossRef] [PubMed] [Green Version]
  51. Woźniak, B.; Bradtke, K.; Darecki, M.; Dera, J.; Dzierzbicka-Głowacka, L.; Ficek, D.; Furmańczyk, K.; Kowalewski, M.; Krężel, A.; Majchrowski, R.; et al. SatBałtyk—A Baltic environmental satellite remote sensing system—An ongoing project in Poland. Part 1: Assumptions, scope and operating range. Oceanologia 2011, 53, 897–924. [Google Scholar] [CrossRef] [Green Version]
  52. Woźniak, B.; Bradtke, K.; Darecki, M.; Dera, J.; Dudzińska-Nowak, J.; Dzierzbicka-Głowacka, L.; Ficek, D.; Furmańczyk, K.; Kowalewski, M.; Krężel, A.; et al. SatBałtyk—A Baltic Environmental Satellite Remote Sensing System—An Ongoing Project in Poland Part 2: Practical applicability and preliminary results. Oceanologia 2011, 53, 925–958. [Google Scholar] [CrossRef] [Green Version]
  53. Twardowski, M.S.; Sullivan, J.M.; Donaghay, P.L.; Zaneveld, J.R.V. Microscale quantification of the absorption by dissolved and particulate material in coastal waters with an ac-9. J. Atmos. Ocean. Technol. 1999, 16, 691–707. [Google Scholar] [CrossRef]
  54. Zaneveld, J.R.V.; Kitchen, J.C.; Moore, C.M. The scattering error correction of reflecting-tube absorption meters. Proc. SPIE 1994, 2258, 44–55. [Google Scholar] [CrossRef]
  55. Crude Oil Terminal & Custody Transfer Data, SGS Oil, Gas & Chemicals Services, Geneva 2011. Available online: Sgs.com/ogc (accessed on 24 May 2021).
  56. Flotta Terminal. Available online: https://www.repsolsinopecuk.com/operations/infrastructure-code-of-practice/provision-of-information#Flotta (accessed on 24 May 2021).
  57. Cyliten 460N. Available online: https://www.lotos.pl/en/859/p,790,c,567/for_business/industrial_lubes/compressor_oils/cyliten_460n (accessed on 24 May 2021).
  58. Alleman, T.L.; McCormick, R.L.; Christensen, E.D.; Fioroni, G.; Moriarty, K.; Yanowitz, J. Biodiesel Handling and Use Guide, 4th ed.; DOE/GO-102016-4875; U.S. Department of Energy: Washington, DC, USA, 2016. Available online: https://afdc.energy.gov/fuels/biodiesel_basics.html (accessed on 24 May 2021).
  59. Biodiesel BIO-100. Available online: https://www.orlen.pl/EN/ForBusiness/Fuel/Diesel/Pages/Biodiesel.aspx (accessed on 24 May 2021).
  60. Haule, K.; Toczek, H. Fluorescence properties of mechanically dispersed crude oil. J. KONES Powertrain Transp. 2014, 21, 161–167. [Google Scholar] [CrossRef] [Green Version]
  61. Haule, K.; Freda, W. Remote Sensing of Dispersed Oil Pollution in the Ocean—The Role of Chlorophyll Concentration. Sensors 2021, 21, 3387. [Google Scholar] [CrossRef] [PubMed]
  62. Haule, K.; Freda, W. The effect of dispersed Petrobaltic oil droplet size on photosynthetically active radiation in marine environment. Environ. Sci. Pollut. Res. 2016, 23, 6506–6516. [Google Scholar] [CrossRef]
  63. Król, T.; Stelmaszewski, A.; Freda, W. Variability in the optical properties of a crude oil—Seawater emulsion. Oceanologia 2006, 48, 203–211. [Google Scholar]
  64. Zibordi, G.; Darecki, M. Immersion factor for the RAMSES series of hyperspectral underwater radiometers. J. Opt. Pure Appl. Opt. 2005, 8, 252–258. [Google Scholar] [CrossRef]
  65. Rudź, K.; Darecki, M.; Toczek, H. Modelling the influence of oil content on optical properties of seawater in the Baltic Sea. J. Eur. Opt. Soc.-Rapid Publ. 2013, 8, 13063. [Google Scholar] [CrossRef] [Green Version]
  66. Baszanowska, E.; Otremba, Z.; Piskozub, J. Modelling a Spectral Index to Detect Dispersed Oil in a Seawater Column Depending on the Viewing Angle: Gulf of Gdansk Case Study. Sensors 2020, 20, 5352. [Google Scholar] [CrossRef] [PubMed]
  67. Soja-Woźniak, M.; Darecki, M.; Wojtasiewicz, B.; Bradtke, K. Laboratory measurements of remote sensing reflectance of selected phytoplankton species from the Baltic Sea. Oceanologia 2018, 60, 86–96. [Google Scholar] [CrossRef]
  68. Wolf, P.; Rößler, S.; Schneider, T.; Melzer, A. Collecting in situ remote sensing reflectances of submersed macrophytes to build up a spectral library for lake monitoring. Eur. J. Remote Sens. 2013, 46, 401–416. [Google Scholar] [CrossRef] [Green Version]
  69. Woźniak, M.; Bradtke, K.M.; Krężel, A. Comparison of satellite chlorophyll a algorithms for the Baltic Sea. J. Appl. Remote Sens. 2014, 8, 083605. [Google Scholar] [CrossRef] [Green Version]
  70. Darecki, M.; Kaczmarek, S.; Olszewski, J. SeaWiFS ocean colour chlorophyll algorithms for the southern Baltic Sea. Int. J. Remote Sens. 2005, 26, 247–260. [Google Scholar] [CrossRef]
  71. Woźniak, S.B.; Darecki, M.; Zabłocka, M.; Burska, D.; Dera, J. New simple statistical formulas for estimating surface concentrations of suspended particulate matter (SPM) and particulate organic carbon (POC) from remote-sensing reflectance in the southern Baltic Sea. Oceanologia 2016, 58, 161–175. [Google Scholar] [CrossRef] [Green Version]
  72. IOCCG. Synergy between Ocean Colour and Biogeochemical/Ecosystem Models; IOCCG Report Series; Dutkiewicz, S., Ed.; International Ocean Colour Coordinating Group: Dartmouth, NS, Canada, 2020. [Google Scholar]
  73. Tran, T.K.; Duforêt-Gaurier, L.; Vantrepotte, V.; Jorge, D.S.F.; Mériaux, X.; Cauvin, A.; Fanton d’Andon, O.; Loisel, H. Deriving Particulate Organic Carbon in Coastal Waters from Remote Sensing: Inter-Comparison Exercise and Development of a Maximum Band-Ratio Approach. Remote Sens. 2019, 11, 2849. [Google Scholar] [CrossRef] [Green Version]
Figure 1. (a) Scheme of the floating tank for controlled assessment of the upwelling light in seawater polluted by dispersed oil droplets; (b) picture from field experiment illustrating placing the tank on the sea surface; (c) picture of the floating tank.
Sensors 21 05733 g001
Figure 2. Pictorial drawing illustrating the concept of the field experiment. Hyperspectral remote sensing reflectance Rrs measured in natural seawater was compared to the Rrs in seawater polluted by dispersed oil droplets.
Sensors 21 05733 g002
Figure 3. Field measurement locations in the Southern Baltic Sea.
Sensors 21 05733 g003
Figure 4. Spectra of absorption a(λ) and scattering b(λ) coefficients of the surface water layer of 0–1 m collected during the field campaign in April 2016 by AC-9 sensor at three stations: JA1 (13 April 2016), Tank (16 April 2016), and Mech1 (17 April 2016).
Sensors 21 05733 g004
Figure 5. The fraction of the signal formed inside the tank at 555 nm (the lowest values) and 715 nm (the highest values) evaluated from the total attenuation coefficient c(λ) at three measurement stations: JA1, Tank, and Mech1 in three directions from the radiance sensor: horizontal of 0.6 m, vertical of 0.8 m, and the longest slant of 1.17 m.
Sensors 21 05733 g005
Figure 6. Samples of mechanically dispersed oils: (a) Petrobaltic PB, biodiesel BD, Flotta FL (small bottles contains pure oils, large bottles—concentrated oil dispersions); (b) Evinrude Johnson EJ, Cyliten CL, Quicksilver Lube QL.
Sensors 21 05733 g006
Figure 7. Size distributions measured by LISST-100X of oil-in-water dispersions normalized to 1 ppm for 6 types of oils: (a) Petrobaltic (PB), Flotta (FL), BIO-100 (BD); (b) Quicksilver Lube (QL), Cyliten N460 (CL), and Evinrude Johnson Lubricant (EJ).
Sensors 21 05733 g007
Figure 8. Remote sensing reflectance measured in natural seawater and seawater polluted by dispersed oil droplets in five consecutive concentrations for 6 types of oils: (a) Petrobaltic (PB); (b) Cyliten N460 (CL); (c) biodiesel BIO-100 (BD); (d) Evinrude Johnson HPF-XR (EJ); (e) Quicksilver Lube (QL); (f) Flotta (FL).
Sensors 21 05733 g008
Figure 9. Percentage increase of the Rrs plotted for 9 wavelengths (corresponding to AC-9 spectral bands) caused by dispersed oil droplets of (a) Petrobaltic (PB); (b) Cyliten N460 (CL); (c) biodiesel B-100 (BD); (d) Evinrude Johnson HPF-XR (EJ); (e) Quicksilver Lube (QL); (f) Flotta (FL).
Sensors 21 05733 g009
Figure 10. Polar plots of the impact of dispersed oils in the concentration of 15 ppm on selected Rrs band ratios: (a) Petrobaltic (PB), biodiesel B-100 (BD) and Flotta (FL); (b) Cyliten N460 (CL), Evinrude Johnson (EJ) and Quicksilver Lubricant (QL). The scale shows values relative to the corresponding natural seawater band ratios.
Sensors 21 05733 g010
Figure 11. Relative Rrs band differences of seawater polluted by dispersed oil droplets in the concentration of 15 ppm.
Sensors 21 05733 g011
Table 1. Field experiment weather conditions and seawater characteristics.
StationJA1TankMech1
Date13 April 201616 April 201617 April 2016
PositionN 54.65, E 18.68N 54.81, E 18.40N 54.60, E 18.58
Measured oilsPB, CLBD, EJ, QLFL
SkyFull overcast, diffusive conditions, drizzleClear sky (BD), single clouds (EJ), overcast (QL)Full overcast, diffusive conditions, rain
Sea surfaceGentle to medium waves, thickly roughGentle waves, slightly roughGentle waves, slightly rough
Secchi depth5.5 m4.5 m
Sea depth78 m11 m12 m
Sea surface temperature6.1 °C5.7 °C7.7 °C
Salinity7.31–7.44 PSU7.53–7.55 PSU7.28 PSU
Chlorophyll concentration8.91 mg/m32.36 mg/m311.49 mg/m3
Table 2. Characteristics and properties of oils selected for the marine experiment.
MarkPBFLCLBDEJQL
Full NamePetrobalticFlottaCyliten 460NBiodiesel BIO-100Evinrude Johnson HPFXRQuicksilver Premium Gear Lube
Type of oilLight, very sweet crude oillight, Sweet-sour crude oilMineral oil, cylinder lubricantBiofuelMineral oil, marine gear lubricantMineral oil, marine gear lubricant
Main applicationEnergy industryEnergy industryHigh-pressure compressors, low speed gearsDiesel enginesMotorboats, two-stroke outboardsMotorboats, all outboards
Dynamic viscosity in 20 °C, mPa·s 19.9122.7721404.86183.5164.2
Refractive index at 20 °C (400–700 nm)1.4878–1.46491.5233–1.49091.5148–1.49181.4721–1.45231.4998–1.47971.5011–1.4805
Dispersion effectiveness *30%80%86%~100%~100%91%
ColorDark brown with golden shadeDeep dark brownGolden yellowYellow–greenDark greenDark red
* Estimated on the basis of the total volume concentration measured by the LISST-100X.
Publisher’s Note: MDPI stays neutral with regard to jurisdictional claims in published maps and institutional affiliations.

