Article

Evaluation of Periodontal Risk Factors with Quantitative Light-Induced Fluorescence Based Fluorescent Plaque Index, in Comparison to Radiographic and Oral Health Habit Scoring: A Retrospective Case Study

1
Department of Oral and Maxillofacial Radiology, Graduate School of Dentistry, Kyung Hee University, Seoul 02447, Korea
2
Department of Orthodontics, Graduate School of Dentistry, Kyung Hee University, Seoul 02447, Korea
*
Author to whom correspondence should be addressed.
Contributed equally as co-first authors.
Sensors 2021, 21(17), 5774; https://doi.org/10.3390/s21175774
Submission received: 2 August 2021 / Revised: 17 August 2021 / Accepted: 24 August 2021 / Published: 27 August 2021

Abstract

:
The aim of this study was to evaluate periodontal risk factors with oral health habits and fluorescent plaque index (FPI) using quantitative light-induced fluorescence (QLF) images, and to evaluate their effect on the degree of radiographic bone loss (RBL). Selected were 276 patients over 19 years of age to complete the questionnaire for oral health habit and take QLF images, periapical and panoramic radiographs. Oral health habit score, age, and sex showed a statistically significant correlation with FPI. FPI showed a lower value as the oral health habit score increased and the age decreased. Moreover, females showed lower FPI values than did males. RBL showed a statistically significant positive correlation with age but did not show any correlation with oral health habit scores and sex. There was no correlation between FPI and RBL. The results of this study suggest that the clinical use of QLF allows plaque detection by non-invasive procedures and can aid in a more objective estimation for oral hygiene status.

1. Introduction

Periodontal diseases, including gingivitis and periodontitis, are some of the most common diseases in humans. Periodontitis is the sixth most prevalent disease worldwide [1]. It is a chronic inflammatory disease that can lead to alveolar bone loss and tooth loss. Alveolar bone loss and tooth loss result from periodontal tissue destruction due to the host’s immune response to the dental biofilm formed on the tooth surfaces. Tooth loss may lead to edentulous and masticatory dysfunction that reduces the oral health-related quality of life in daily life [2]. Periodontitis is a representative oral disease that is related to systemic diseases, such as cardiovascular disease and diabetes [3,4]. Periodontitis affects the individual’s quality of life and self-esteem and imposes huge healthcare costs and socioeconomic impact. In periodontal diseases, the first disease driver is the accumulation of dental plaque (also known as the biofilm) as a result of poor oral hygiene [5]. Dental biofilm is a complex oral microbial ecosystem, where pathogenic bacteria exhibiting periodonto-pathic properties are increased depending on the predominant species present, the metabolites, and host responses [6,7]. Therefore, to prevent and manage periodontal disease, it is important to detect and predict the pathogenic levels of dental plaque. Dental plaque is difficult to observe with the naked eye. Traditionally, to aid with visual examination, a disclosing solution to dye the tooth was used. Currently, this method is not used worldwide because of several disadvantages. First, a disclosing solution stains both the acquired pellicle (which contains few bacteria) and the dental plaque (which is rich in bacteria) non-discriminatively [8,9]. Second, disclosing the plaque visualizes the area covered by dental plaque, but not the thickness or maturity of the plaque. Recently, a new optical method that can replace disclosing agents has been introduced to evaluate dental plaque. Quantitative light-induced fluorescence (QLF) is an optical technique that uses blue visible light with a peak wavelength of 405 nm in combination with a long-pass filter. Using QLF and based on the red fluorescence emission of porphyrins and bacterial metabolites inside the biofilm, the presence and properties of the dental plaque can be determined [10,11,12]. In this way, clinicians can evaluate plaque without using a disclosing solution, and objectively evaluate the dental plaque by quantifying the red fluorescence coverage [13,14]. The intensity of the red fluorescence of QLF is indicative of the dental plaque’s thickness, maturity, and pathogenicity. The classification of periodontitis has been repeatedly revised over the past 30 years based on emerging scientific evidence [15]. In 2017, the American Academy of Periodontology and the European Federation of Periodontology provided a new definition and classification framework for periodontitis, based on a multidimensional staging and grading system [16]. The stage is related to the severity and extent of the current periodontitis, and the grade takes into account the rate at which the disease is progressing [16]. Clinically, periodontal health is indicated by clinical attachment loss, which is assessed by measuring the probing pocket depths and gingival recession. Probing depth measurements are influenced by the probing force, placement, angulation, and tip diameter. These parameters affect the reliability of probing depths [17,18,19]. If clinical attachment loss is not available, radiographic bone loss (RBL) should be used. Radiological imaging is one of the best methods for diagnosing periodontitis [16]. However, detection of initial RBL through X-ray images is limited, and even if detected, it tends to be underestimated [20]. Additionally, it is a factor to consider that X-ray only provides information on bone structure and bone loss, but does not provide information on the current clinical condition (Figure 1) [21,22]. Therefore, in the case of initial periodontal disease, there is a limit in accurately diagnosing with only radiologic images. Periodontal disease tends to be influenced by oral health habits and can be detected early. Disease progression can be prevented through prevention and early treatment. To lower the prevalence of oral diseases such as periodontal disease, prevention is more effective than treatment. Oral care by correcting habits is also necessary. Therefore, we intend to present a more objective clinical guideline for periodontal disease diagnosis and prevention by conducting a comparative analysis of oral health habits using a questionnaire, quantitative fluorescent imaging, and radiographic images among patients who visited the dental health care center for an oral examination.

2. Materials and Methods

2.1. Study Participants

This study was approved by the Institutional Review Board of Kyung Hee University (IRB No. KH-DT21014), following tenets of the Declaration of Helsinki. Clinical data were collected between July 2020 and June 2021 at the Kyung Hee University Dental Hospital, South Korea. All participants who visited the Kyung Hee Dental Healthcare Center were provided with explanations regarding the objectives and procedures of this study. Patients over 19 years of age and in good health, who provided written agreement to participate were included in the study (N = 276). Forty-four participants were excluded because they presented with orthodontic appliances, esthetic restorations, dental fluorosis, dental caries, stained anterior teeth, or multiple tooth loss due to severe periodontitis. Among the 232 participants (37.0 ± 13.7 years old), 93 were men (33.7 ± 12.3 years old) and 139 were women (39.2 ± 14.0 years old). Participants were not allowed to eat or drink anything, except water, for four hours before the evaluation.

2.2. Questionnaire

The questionnaire for oral health management status was modified and supplemented by referring to Yoon et al.’s research tool [23]. The questionnaire included five items, including tooth brushing behavior and the use of oral hygiene products, to investigate oral health habits (Table 1). The oral health habit score was defined as the sum of the scores for each questionnaire item.

2.3. QLF Analysis

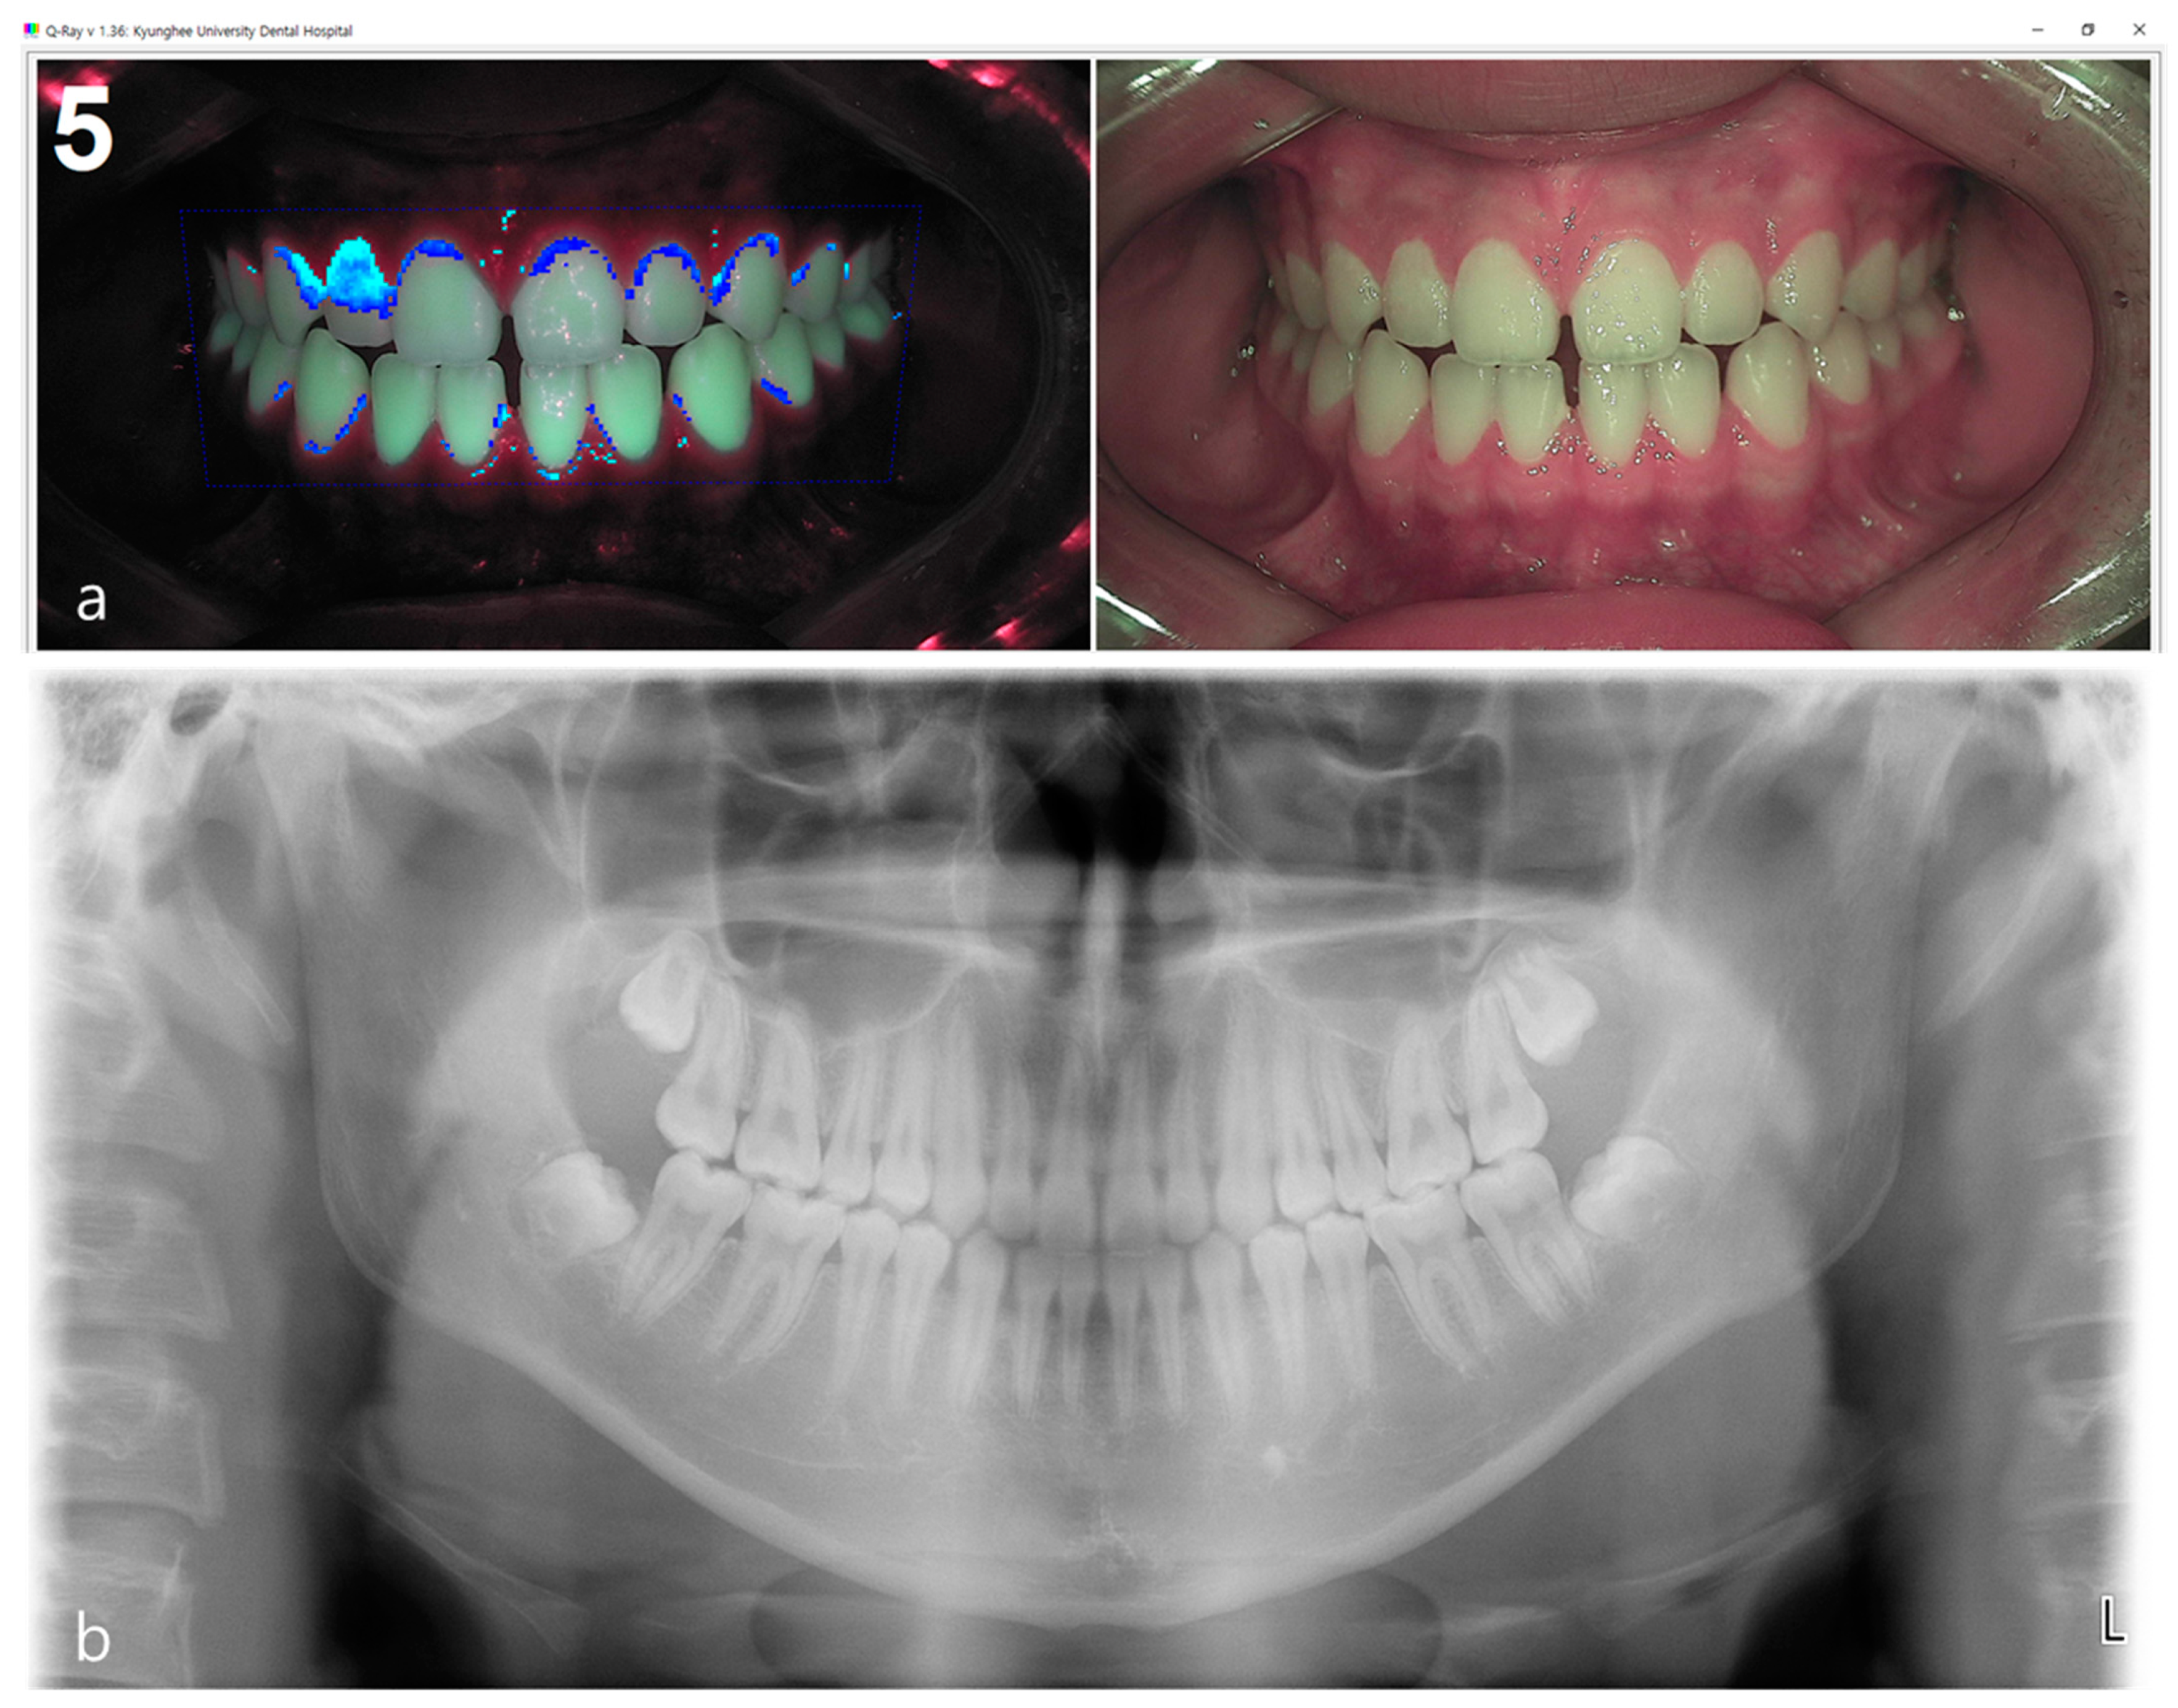
2.3.1. Acquisition of White-Light and Fluorescent Images

White-light and fluorescent images of the anterior teeth were captured using a Qraycam Pro® (AIOBIO, Seoul, Korea). The QLF images were captured using ‘anterial’ imaging mode. According to the manufacturer’s instructions, the distance between the specimens and the Qraycam Pro® device was 8 cm. The QLF system was equipped with a metal tube that blocked external light to prevent contamination of the fluorescent image. The participants maintained an edge-to-edge occlusion while capturing the images (Figure 2).

2.3.2. Fluorescent Plaque Index (FPI) Scoring

The FPI score for the fluorescent image of the QLF images was automatically calculated with the “Simple Hygiene Score” function of the proprietary analysis program (Q-ray version 1.24, Inspektor Research Systems BV) (Figure 3). FPI was a score calculated by applying two variables (A30 and A120), which are regions of red fluorescent plaques corresponding to pixels with ΔR > 30% and ΔR > 120%, to a specific function. FPI scores were calculated in one of six categories (from 0 to 5) (Figure 4), according to the classification rules as follows [24]. (1) A30 < 0.5 % and A120 < 0.4%, FPI score was classified as 0; (2) 0.5% ≤ A30 < 2.5% and A120 < 0.4% was classified as FPI score 1; (3) 2.5%≤ A30 < 4.5% and A120 < 0.4% was classified as FPI score 2; (4) 4.5 % ≤ A30 or 0.4% ≤ A120 < 0.9% was classified as FPI score 3; (5) 0.9% ≤ A120 < 2.1% was classified as FPI score 4; (5) 2.1% ≤ A120 was classified as FPI score 5. The variable ΔR indicates that porphyrin, a metabolite secreted by bacteria, is present in the oral cavity and assesses the level of bacterial activity.

2.4. Radiographic Image Analysis

2.4.1. Acquisition of Panoramic and Periapical Images

The panoramic radiographs were acquired using a dental panoramic X-ray machine (Planmeca Promax®, Planmeca, Helsinki, Finland). Periapical radiographs were obtained digitally using a sensor (Kodak RVG 6000, Carestream Dental, Rochester, NY, USA). The radiographs were collected retrospectively after removing identifiable patient information. The radiographic images were assessed using the image analysis tool of the Zetta PACS (Tae Young Soft, Anyang, Korea).

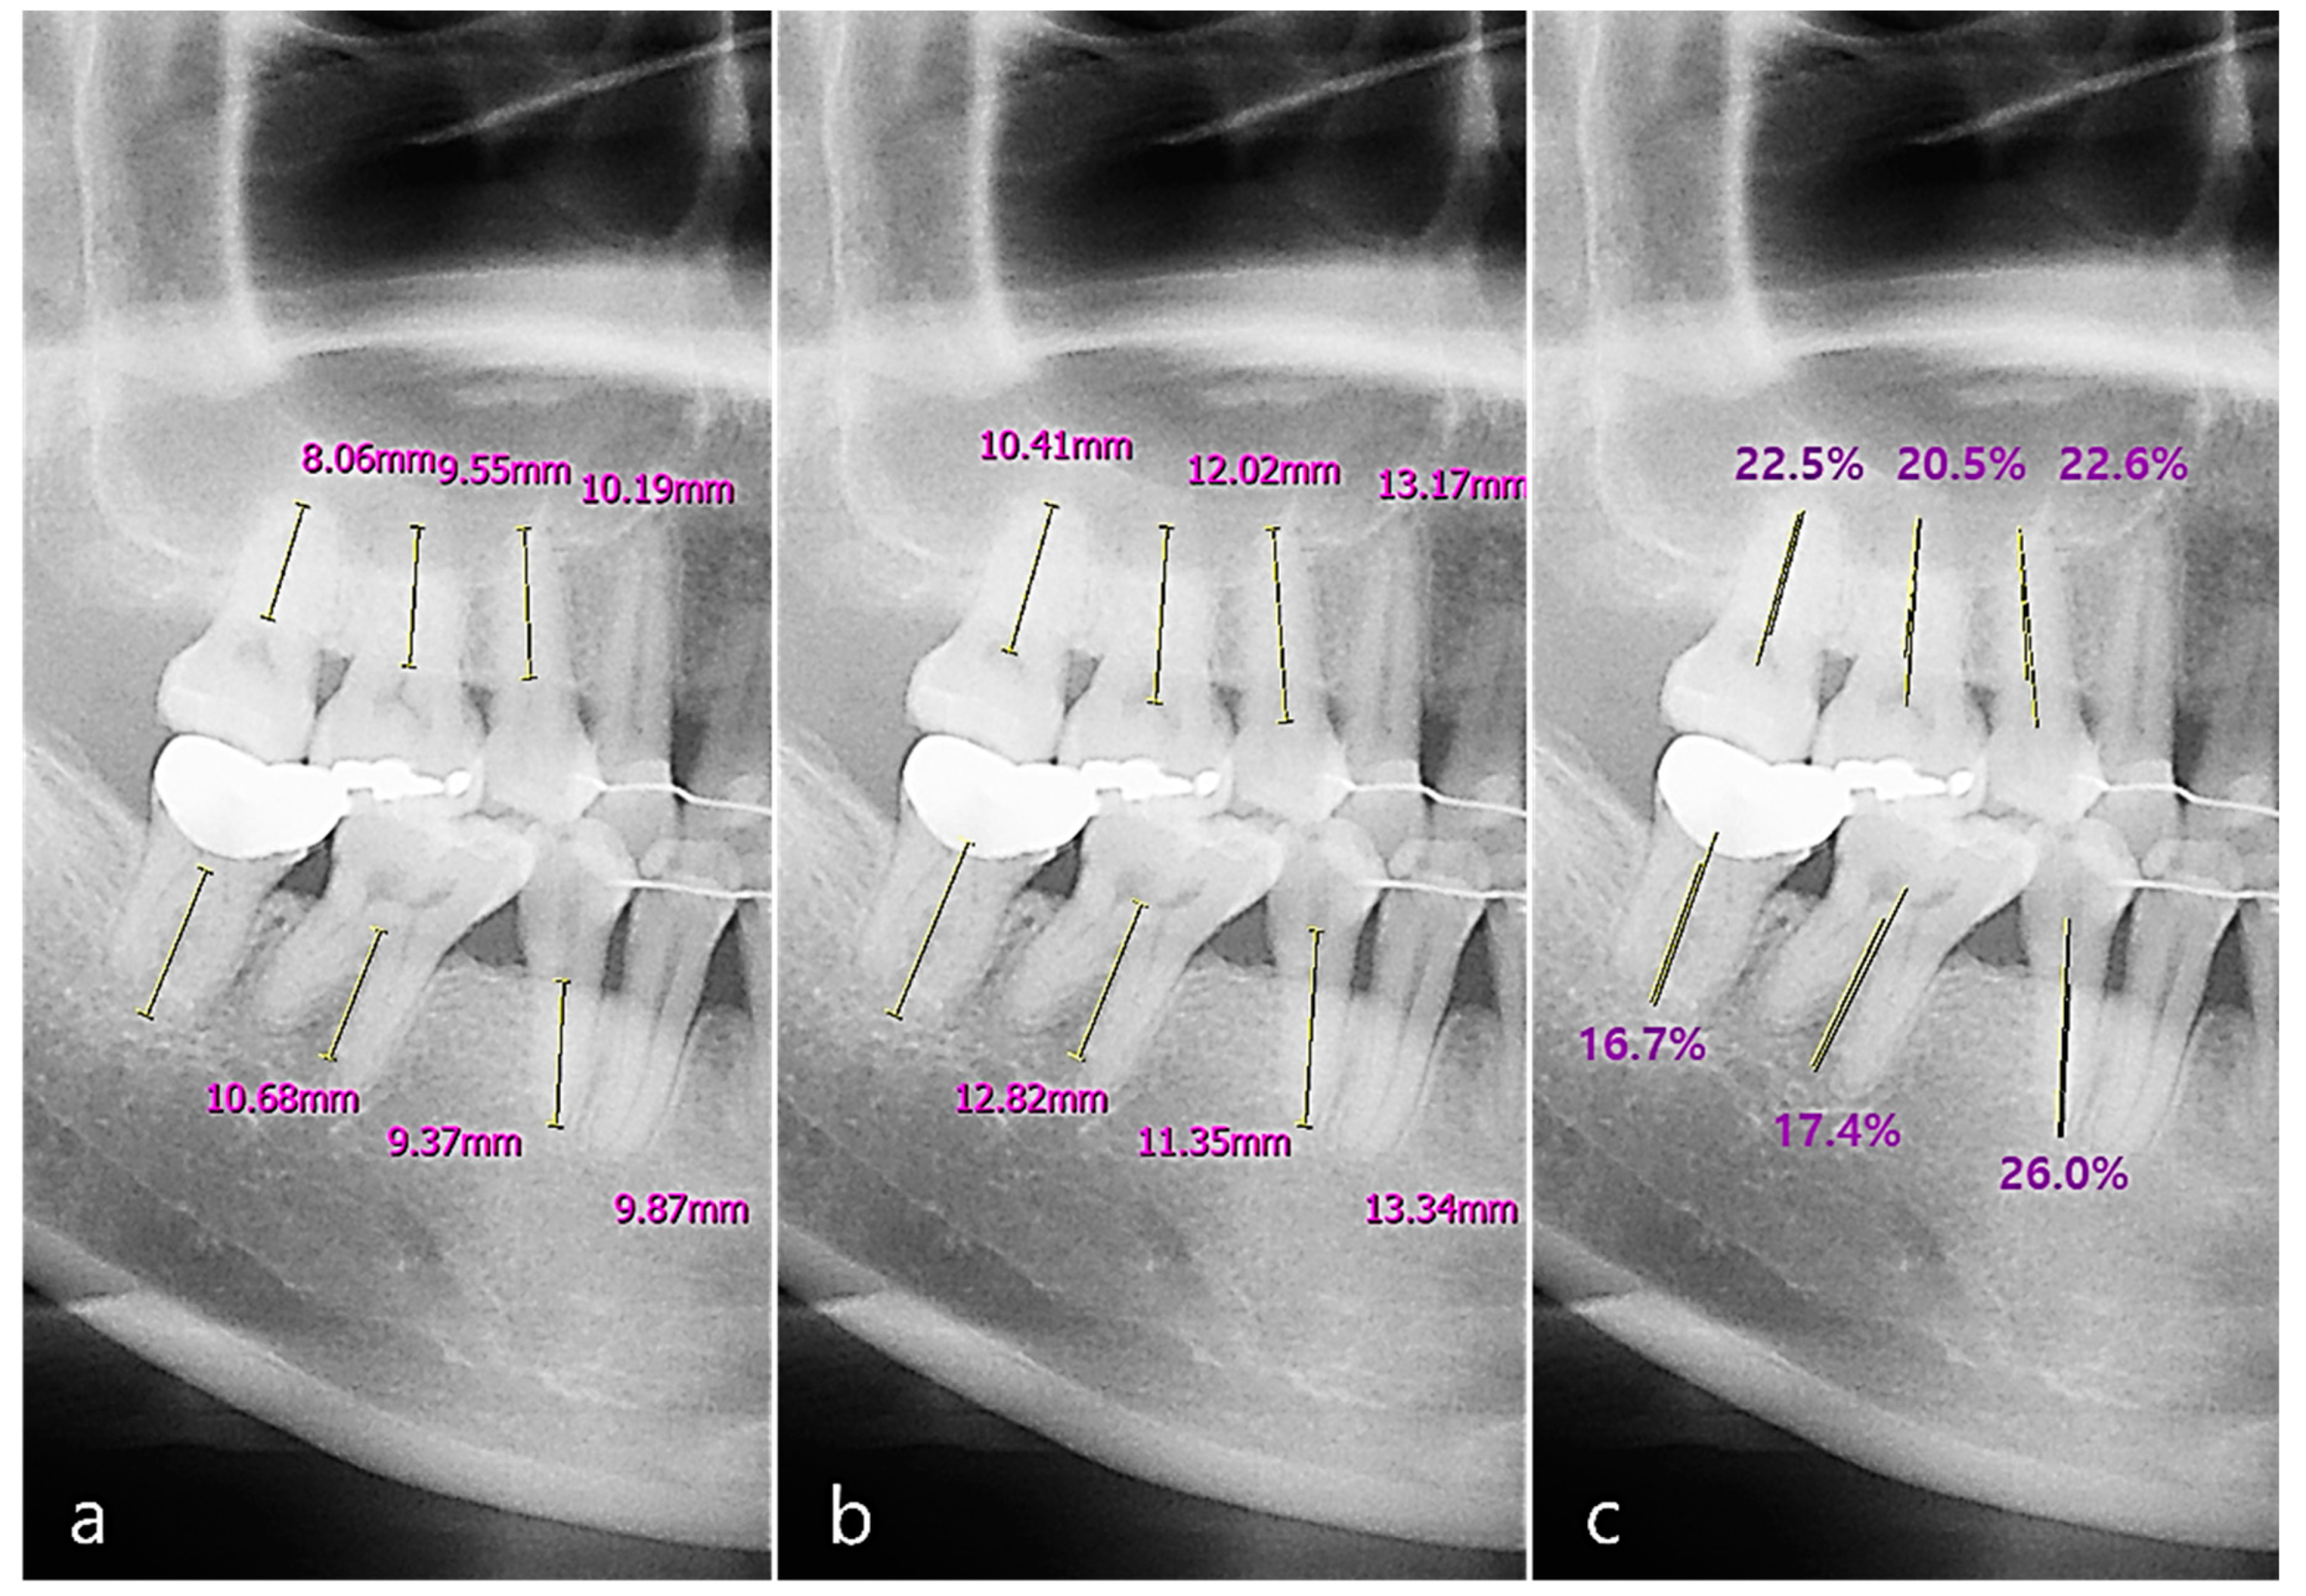
2.4.2. Radiographic Bone Loss (RBL) Scoring

We used 232 image sets, including both panoramic and periapical images, to detect the periodontal bone level (PBL) and cementoenamel junction level (CEJL) of the teeth. We calculated the two tooth intersection lengths as the distances between the points and the root apex of the tooth. We defined the RBL percentage of the tooth (implant) as the ratio of the intersection length of the periodontal bone level to the CEJ (or the top fixture level for an implant) (Figure 5).
Based on the percentage rate, periodontal bone loss of the tooth was classified according to the new criteria proposed at the 2017 World Workshop on the Classification of Periodontal and Peri-implant Diseases and Conditions [16]. The classification criteria for periodontitis staging based on the RBL of the tooth were as follows. (1) RBL < 15% (in the coronal third of the root), the periodontitis was classified as stage one. (2) RBL between 15% and 33% (in the coronal third of the root) was classified as stage two. (3) RBL between 34% and 66% (in the middle third of the root) was classified as stage three. (4) RBL > 66% (extending to the apical third of the root and beyond) was classified as stage four (Figure 6) [16,25]. The average of the RBL scores of the total, maxillary, mandibular, anterior, and posterior teeth were calculated.

2.5. Statistical Analysis

The intra-examiner reproducibility of the RBL score was assessed in a second examination of 20 sets of randomly selected teeth two weeks later, in which the Cohen’s kappa value showed significant and excellent agreement (κ values > 0.87). Generalized linear models and regression analyses were used to evaluate the FPI or RBL scores according to oral health habits, sex, and age. The correlations between the FPI and RBL scores were evaluated using Spearman’s correlation coefficient. Statistical analyses were performed using SAS software (version 9.4; SAS Institute Inc., Cary, NC, USA). The results were considered statistically significant at p < 0.05.

3. Results

Oral health habit was scored out of 12 points. The overall average was 7.52 ± 2.07 (male 6.98 ± 2.20, female 7.88 ± 1.91). The oral health habit score of females was significantly higher than that of males. The FPI distribution showed a value of 1 or less in 78.5% of the patients. The overall average RBL score was 1.50 ± 0.32, and the RBL score did not show a statistically significant difference according to the tooth position (maxilla, mandible, anterior, or posterior) (Table 2).
Oral health habit score, age, and sex showed a statistically significant correlation with FPI. FPI showed a lower value as the oral health habit score increased and the age decreased. Moreover, females showed lower FPI values than did males. RBL showed a statistically significant positive correlation with age but did not show any correlation with oral health habit scores and sex (Table 3 and Table 4).
Spearman’s correlation analysis to examine the mutual effects showed that there was no correlation between FPI and RBL scores (Table 5).

4. Discussion

Dental plaque is a complex oral microbial ecosystem that maintains microbial homeostasis through dynamic ecological changes resulting from local environmental conditions [6]. The imbalanced state of the microbial ecosystem results in the formation of pathogenic dental plaques with cariogenic or periodontopathic properties according to the predominant bacteria, their metabolites, and host responses [6,7]. In order to prevent and manage oral diseases, it is necessary to focus on detecting pathogenic dental plaques and predicting the degree of pathogenicity. The optical phenomenon of red fluorescence (RF) used by QLF technology can be explained by the strong fluorescence of endogenous metal-free fluorescent porphyrins such as protoporphyrin IX. It exhibits strong fluorescence in the red spectral region when excited by visible violet light in the 400–420 nm range [26,27]. These porphyrins are produced by certain oral microbes in dental plaque. Previous studies utilizing QLF technology have shown that red fluorescence can be attributed to mature dental plaques. These properties make it easier to detect dental plaque without performing additional staining procedures [14,28]. Compared with non-RF plaques, more periodontopathic bacteria were detected in RF plaques, and it was confirmed that RF plaques were more associated with gingival inflammation [29]. Another previous study found that anaerobic bacteria such as Fusobacterium, Treponema, Tannerella, and Prevotella increased rapidly in mature dental plaques over 4 days, and that they were associated with gingivitis and periodontitis [30]. As such, it seemed reasonable to infer that the stronger the red fluorescence emitted by the dental plaque is indicative of increased dental plaque maturity and pathogenicity. Therefore, dental plaques with higher red fluorescence intensity can be evaluated as having higher periodontal pathogenicity. It is speculated that the FPI could be used by clinicians to assess the degree of risk for periodontal disease. In this study, no correlation was found between FPI using QLF images and the periodontitis stage using radiographic images. This may be related to the study’s limitations. First, when evaluating pathogenic plaque in the oral cavity of a patient, it is necessary to consider the error caused by assessing only the anterior labial surfaces and using anterior measurements to represent the values of the entire dentition. Therefore, a further study to compare and evaluate the dental plaque index and the degree of radiographic bone loss in each tooth of the dentition should be performed. Second, the clinical indicators of gingivitis were not investigated. Further studies should be performed to evaluate the usefulness of FPI in screening periodontal disease. Radiographic images continue to be regarded as one of the best methods to evaluate alveolar changes associated with periodontitis [16,31,32,33]. However, the radiological findings of periodontal disease in our study were evaluated as the ratio of the root length to the distance between the CEJL and the alveolar ridge without any aids. This subjective assessment might be considered a weak point of diagnosis based on radiological findings. According to Lange [20], it has only limited value in detecting initial RBL through X-ray imaging, and that initial loss of proximal bone tended to either be not detected or be underestimated. [21,34,35,36]. However, according to Ziebioz [36], the measurement of RBL in panoramic images is reproducible and valid, providing reliable results for evaluating the degree of periodontal bone loss in patients with advanced bone loss. In addition, it should be taken into account that X-ray only provides information on bone structure and bone loss and does not reflect current clinical issues [21,22]. It is difficult to make an accurate diagnosis with only X-rays in the case of initial periodontal disease [37]. Therefore, it is necessary to add the results of QLF analysis that can detect pathogenic dental plaque and predict the degree of pathogenicity or questionnaire information that objectively shows oral health habits for a comprehensive diagnosis. Panoramic radiography and periapical radiography have been mainly used to evaluate RBL. In this study, we evaluated RBL using both modalities. The RBL of posterior teeth was evaluated using panoramic images, and the RBL of anterior teeth, which was somewhat distorted in the panorama image, was measured using periapical radiography. Previous study demonstrated that there was a high level of agreement between periapical and panoramic radiographic measurements of the distance between the CEJL and the PBL, as well as the proportional values related to root length [38]. It is time-consuming and labor-intensive to manually measure the RBL of all teeth on panoramic radiographs. Recently, computer-aided diagnosis (CAD) based on deep learning has been widely used to solve complex problems in the field of radiographic interpretation [39]. CAD has been used in oral and maxillofacial radiology to identify caries and periodontal disease, as well as osteoporosis, maxillary sinusitis, and other diseases [40]. A method for automatically diagnosing periodontal bone loss on dental panoramic radiographs for periodontitis staging was developed according to the new criteria proposed at the 2017 World Workshop [16]. This high detection performance of the periodontal bone level (or CEJ level) was achieved by using deep learning to simplify the complexity of bone destruction patterns due to periodontitis [40]. This new strategy can provide a valuable second opinion for dental professionals who need to diagnose periodontitis by automatically detecting and staging pathological changes called periodontal bone loss. This may also substantially improve the diagnosis and treatment of periodontitis [41].
Considering the factors affecting oral health that have been studied so far, not only dietary habits and smoking, but also oral health habits such as dental visits, toothbrushing, and the use of oral hygiene products have been reported as factors affecting oral health [42,43,44,45]. Lifestyle habits account for about 60% of the causes of chronic diseases, highlighting the importance of self-management and professional education programs for correct lifestyle changes [46]. Therefore, for the prevention of periodontal disease, a tool that can measure oral health habits including various risk variables is needed. In this study, a questionnaire was used as a tool to evaluate oral health habits related to periodontal disease, and the results were scored to analyze the effects of oral health habits. As a result, it was shown that the oral health habit score was closely related to the degree of pathogenicity of dental plaque analyzed through QLF images. For individuals with periodontal disease, a high level of oral hygiene is one of the key factors for achieving and maintaining periodontal health [47,48,49]. Therefore, in order to improve individual periodontal disease, professional periodontal treatment is important, but also it is necessary to identify risk factors that may occur in oral health habits, and to change oral health habits in the direction of lowering such risk factors. Educating how to manage these risks in daily life is also necessary. According to Jönsson, based on an integrated cognitive/behavioral and oral health approach, a personalized oral health education program is more effective than standard treatments of reducing plaque and gingivitis by achieving appropriate long-term oral hygiene behaviors [50]. In conclusion, understanding and educating individuals on lifestyle-related risks such as oral health habits, as well as bacterial factors, are necessary for the prevention and treatment of periodontal disease.

5. Conclusions

The results of this study suggest that the clinical use of QLF allows plaque detection by non-invasive procedures and can aid in a more objective estimation for oral hygiene status. However, it should be recognized that the presence of bacterial plaque is only one of the factors that influence the development of periodontal disease, and further studies are needed on the bacterial plaque effect on periodontal tissues including alveolar crestal bone.

Author Contributions

Conceptualization, S.H.O., J.-Y.C. and S.-H.K.; methodology, S.H.O., J.-Y.C. and S.-H.K.; software, S.H.O. and J.-Y.C.; validation, S.H.O. and S.R.L.; formal analysis, S.H.O. and J.-Y.C.; investigation, S.-H.K.; resources, S.H.O.; data curation, S.R.L.; writing—original draft preparation, S.H.O. and J.-Y.C.; writing—review and editing, S.H.O. and S.-H.K.; visualization, S.H.O. and S.-H.K.; supervision, S.-H.K.; project administration, S.H.O. and S.-H.K.; funding acquisition, S.-H.K. All authors have read and agreed to the published version of the manuscript.

Funding

This research received no external funding.

Institutional Review Board Statement

The study was conducted according to the guidelines of the Declaration of Helsinki and approved by the Institutional Review Board of Kyung Hee University Dental Hospital (protocol code KH-DT21014 and date of approval July 2021).

Informed Consent Statement

Informed consent was obtained from all subjects involved in the study.

Data Availability Statement

Data sharing not applicable.

Acknowledgments

The authors want to show special thanks to Kyu-Rhim Chung President Emeritus and Doo-Hee Lee, Korean Society of Biocreative Orthodontic Strategy for the donation of QrayPen QLF devices (AIOBIO, Seoul, Korea) to the Kyung Hee University Dental Health Care Center of Kyung Hee University Dental Hospital, Seoul, Korea.

Conflicts of Interest

The authors declare no conflict of interest.

References

  1. Tonetti, M.S.; Jepsen, S.; Jin, L.; Otomo-Corgel, J. Impact of the global burden of periodontal diseases on health, nutrition and wellbeing of mankind: A call for global action. J. Clin. Periodontol. 2017, 44, 456–462. [Google Scholar] [CrossRef] [Green Version]
  2. Lang, N.P.; Bartold, P.M. Periodontal health. J. Periodontol. 2018, 89, S9–S16. [Google Scholar] [CrossRef] [Green Version]
  3. Kim, J.W.; Kwon, H.J.; Lee, S.G.; Choi, Y.H. The relationship between periodontal disease and the prevalence of cardiovascular diseases. J. Korean Acad. Oral Health 2007, 31, 387–395. [Google Scholar]
  4. Baek, H.J.; Choi, Y.H.; Lee, S.G.; Song, K.B.; Kwon, H.J. The association of metabolic syndrome and periodontitis in Korean adult population. J. Korean Acad. Oral Health 2010, 34, 338–345. [Google Scholar]
  5. Marsh, P.D. Are dental diseases examples of ecological catastrophes? Microbiology 2003, 149, 279–294. [Google Scholar] [CrossRef] [PubMed]
  6. Marsh, P.D.; Head, D.A.; Devine, D.A. Ecological approaches to oral biofilms: Control without killing. Caries Res. 2015, 49 (Suppl. S1), 46–54. [Google Scholar] [CrossRef] [PubMed] [Green Version]
  7. Rosier, B.T.; Marsh, P.D.; Mira, A. Resilience of the Oral Microbiota in Health: Mechanisms That Prevent Dysbiosis. J. Dent. Res. 2018, 97, 371–380. [Google Scholar] [CrossRef]
  8. Lang, N.P.; Ostergaard, E.; Löe, H. A fluorescent plaque disclosing agent. J. Periodontal Res. 1972, 7, 59–67. [Google Scholar] [CrossRef] [PubMed]
  9. Mandel, I.D. Indices for measurement of soft accumulations in clinical studies of oral hygiene and periodontal disease. J. Periodontal Res. 1974, 9 (Suppl. S14), 7–30. [Google Scholar] [CrossRef]
  10. Park, S.W.; Kim, S.K.; Lee, H.S.; Lee, E.S.; de Jong, E.D.; Kim, B.I. Comparison of fluorescence parameters between three generations of QLF devices for detecting enamel caries in vitro and on smooth surfaces. Photodiagnosis Photodyn. Ther. 2019, 25, 142–147. [Google Scholar] [CrossRef]
  11. Kim, H.E.; Kwon, H.K.; Kim, B.I. Recovery percentage of remineralization according to severity of early caries. Am. J. Dent. 2013, 26, 132–136. [Google Scholar]
  12. Jun, M.K.; Park, S.W.; Lee, E.S.; Kim, B.R.; Kim, B.I. Diagnosis and management of cracked tooth by quantitative light-induced fluorescence technology. Photodiagnosis Photodyn. Ther. 2019, 26, 324–326. [Google Scholar]
  13. Han, S.Y.; Kim, B.R.; Ko, H.Y.; Kwon, H.K.; Kim, B.I. Validity and reliability of autofluorescence-based quantification method of dental plaque. Photodiagnosis Photodyn. Ther. 2015, 12, 587–591. [Google Scholar] [CrossRef]
  14. Han, S.Y.; Kim, B.R.; Ko, H.Y.; Kwon, H.K.; Kim, B.I. Assessing the use of Quantitative Light-induced Fluorescence-Digital as a clinical plaque assessment. Photodiagnosis Photodyn. Ther. 2016, 13, 34–39. [Google Scholar] [CrossRef]
  15. Caton, J.G.; Armitage, G.; Berglundh, T.; Chapple, I.L.C.; Jepsen, S.; Kornman, K.S.; Mealey, B.L.; Papapanou, P.N.; Sanz, M.; Tonetti, M.S. A new classification scheme for periodontal and peri-implant diseases and conditions-Introduction and key changes from the 1999 classification. J. Periodontol. 2018, 89, S1–S8. [Google Scholar] [CrossRef]
  16. Tonetti, M.S.; Greenwell, H.; Kornman, K.S. Staging and grading of periodontitis: Framework and proposal of a new classification and case definition. J. Periodontol. 2018, 89, S159–S172. [Google Scholar] [CrossRef] [Green Version]
  17. Garnick, J.J.; Silverstein, L. Periodontal probing: Probe tip diameter. J. Periodontol. 2000, 71, 96–103. [Google Scholar] [CrossRef]
  18. Keagle, J.G.; Garnick, J.J.; Searle, J.R.; King, G.E.; Morse, P.K. Gingival resistance to probing forces. I. Determination of optimal probe diameter. J. Periodontol. 1989, 60, 167–171. [Google Scholar] [CrossRef]
  19. Trombelli, L.; Farina, R.; Silva, C.O.; Tatakis, D.N. Plaque-induced gingivitis: Case definition and diagnostic considerations. J. Periodontol. 2018, 45, S46–S73. [Google Scholar] [CrossRef] [Green Version]
  20. Lange, D.E. Failure of periodontal treatment as a result of diagnostic mistakes. Dtsch. Zahnärztl. Z. 1982, 37, 604–609. (In German) [Google Scholar] [PubMed]
  21. Gröndahl, H.G.; Jönsson, E.; Lindahl, B. Diagnosis of marginal bone destruction with orthopantomography and intraoral full mouth radiography. Swed. Dent. J. 1971, 64, 439–446. [Google Scholar]
  22. Walsh, T.F.; Al-Hokail, O.S.; Fosam, E.B. The relationship of bone loss observed on panoramic radiographs with clinical periodontal screening. J. Clin. Periodontol. 1997, 24, 153–157. [Google Scholar] [CrossRef]
  23. Yoon, S.U.; Lee, E.S.; Park, Y.N. Subjective oral status perceptionand oral health impact profile (OHIP) according to the oral health management among international and domestic university students. J. Korean Soc. Dent. Hyg. 2021, 21, 203–209. [Google Scholar]
  24. Park, S.W.; Kahharova, D.; Lee, J.Y.; Lee, E.S.; de Josselin de Jong, E.; Khudanov, B.; Kim, B.I. Clinical assessment of an automated fluorescent plaque index scoring with quantitative light-induced fluorescence. Photodiagnosis Photodyn. Ther. 2020, 32, 102011. [Google Scholar] [CrossRef] [PubMed]
  25. Shaker, Z.M.H.; Parsa, A.; Moharamzadeh, K. Development of a Radiographic Index for Periodontitis. Dent. J. 2021, 9, 19. [Google Scholar] [CrossRef] [PubMed]
  26. Coulthwaite, L.; Pretty, I.A.; Smith, P.W.; Higham, S.M.; Verran, J. The microbiological origin of fluorescence observed in plaque on dentures during QLF analysis. Caries Res. 2006, 40, 112–116. [Google Scholar] [CrossRef]
  27. Thomas, R.Z.; van der Mei, H.C.; van der Veen, M.H.; de Soet, J.J.; Huysmans, M.C. Bacterial composition and red fluorescence of plaque in relation to primary and secondary caries next to composite: An in situ study. Oral Microbiol. Immunol. 2008, 23, 7–13. [Google Scholar] [CrossRef]
  28. van der Veen, M.H.; Volgenant, C.M.; Keijser, B.; Ten Cate, J.B.; Crielaard, W. Dynamics of red fluorescent dental plaque during experimental gingivitis--A cohort study. J. Dent. 2016, 48, 71–76. [Google Scholar] [CrossRef]
  29. Lee, E.S.; de Josselin de Jong, E.; Kim, B.I. Detection of dental plaque and its potential pathogenicity using quantitative light-induced fluorescence. J. Biophotonics 2019, 12, e201800414. [Google Scholar] [CrossRef] [PubMed]
  30. Jakubovics, N.S. Intermicrobial Interactions as a Driver for Community Composition and Stratification of Oral Biofilms. J. Mol. Biol. 2015, 427, 3662–3675. [Google Scholar] [CrossRef] [PubMed]
  31. Albandar, J.M.; Abbas, D.K. Radiographic quantification of alveolar bone level changes. Comparison of 3 currently used methods. J. Clin. Periodontol. 1986, 13, 810–813. [Google Scholar] [CrossRef]
  32. Björn, H.; Holmberg, K. Radiographic determination of periodontal bone destruction in epidemiological research. Odontol. Revy 1966, 17, 232–250. [Google Scholar]
  33. Lang, N.P.; Hill, R.W. Radiographs in periodontics. J. Clin. Periodontol. 1977, 4, 16–28. [Google Scholar] [CrossRef] [Green Version]
  34. Soikkonen, K.; Wolf, J.; Tenkanen, M. Clinical and panoramic assessment of marginal bone loss. A cadaver study. Proc. Finn. Dent. Soc. 1990, 86, 137–141. [Google Scholar]
  35. Akesson, L.; Häkansson, J.; Rohlin, M. Comparison of panoramic and intraoral radiography and pocket probing for the marginal bonelevel. J. Clin. Periodontol. 1992, 19, 326–332. [Google Scholar] [CrossRef]
  36. Pepelassi, E.A.; Tsiklakis, K.; Diamanti-Kipioti, A. Radiographic detection and assessment of the periodontal endosseous defects. J. Clin. Periodontol. 2000, 27, 224–230. [Google Scholar] [CrossRef]
  37. Ziebolz, D.; Szabadi, I.; Rinke, S.; Hornecker, E.; Mausberg, R.F. Initial periodontal screening and radiographic findings—A comparison of two methods to evaluate the periodontal situation. BMC Oral Health 2011, 11, 3. [Google Scholar] [CrossRef] [Green Version]
  38. Persson, R.E.; Tzannetou, S.; Feloutzis, A.G.; Brägger, U.; Persson, G.R.; Lang, N.P. Comparison between panoramic and intra-oral radiographs for the assessment of alveolar bone levels in a periodontal maintenance population. J. Clin. Periodontol. 2003, 30, 833–839. [Google Scholar] [CrossRef]
  39. Schmidhuber, J. Deep learning in neural networks: An overview. Neural Netw. 2015, 61, 85–117. [Google Scholar] [CrossRef] [Green Version]
  40. Wang, C.W.; Huang, C.T.; Lee, J.H.; Li, C.H.; Chang, S.W.; Siao, M.J.; Lai, T.M.; Ibragimov, B.; Vrtovec, T.; Ronneberger, O.; et al. A benchmark for comparison of dental radiography analysis algorithms. Med. Image Anal. 2016, 31, 63–76. [Google Scholar] [CrossRef]
  41. Chang, H.J.; Lee, S.J.; Yong, T.H.; Shin, N.Y.; Jang, B.G.; Kim, J.E.; Huh, K.H.; Lee, S.S.; Heo, M.S.; Choi, S.C.; et al. Deep Learning Hybrid Method to Automatically Diagnose Periodontal Bone Loss and Stage Periodontitis. Sci. Rep. 2020, 10, 1–8. [Google Scholar] [CrossRef]
  42. Sheiham, A.; Nicolau, B. Evaluation of social and psychological factors in periodontal disease. Periodontol. 2000 2005, 39, 118–131. [Google Scholar] [CrossRef]
  43. Sakki, T.K.; Knuuttila, M.L.; Vimpari, S.S.; Kivelä, S.L. Lifestyle, dental caries and number of teeth. Community Dent. Oral Epidemiol. 1994, 22, 298–302. [Google Scholar] [CrossRef] [PubMed]
  44. Shizukuishi, S. [Smoking and periodontal disease]. Clin. Calcium. 2007, 17, 226–232. [Google Scholar]
  45. Chen, M.S.; Stone, D.B. Toothbrushing, flossing, and dental visits in relation to socioeconomic characteristics of white American families. Community Dent. Oral Epidemiol. 1983, 11, 325–332. [Google Scholar] [CrossRef]
  46. Davis, M.M.; Jones, D.W. The role of lifestyle management in the overall treatment plan for prevention and management of hypertension. Semin. Nephrol. 2002, 22, 35–43. [Google Scholar] [CrossRef]
  47. Nyman, S.; Rosling, B.; Lindhe, J. Effect of professional tooth cleaning on healing after periodontal surgery. J. Clin. Periodontol. 1975, 2, 80–86. [Google Scholar] [CrossRef]
  48. Rosling, B. Periodontally treated dentitions: Their maintenance and prognosis. Int. Dent. J. 1983, 33, 147–151. [Google Scholar]
  49. Westfelt, E.; Rylander, H.; Dahlén, G.; Lindhe, J. The effect of supragingival plaque control on the progression of advanced periodontal disease. J. Clin. Periodontol. 1998, 25, 536–541. [Google Scholar] [CrossRef] [PubMed]
  50. Jönsson, B.; Ohrn, K.; Oscarson, N.; Lindberg, P. The effectiveness of an individually tailored oral health educational programme on oral hygiene behaviour in patients with periodontal disease: A blinded randomized-controlled clinical trial (one-year follow-up). J. Clin. Periodontol. 2009, 36, 1025–1034. [Google Scholar] [CrossRef]
Figure 1. (a) Fluorescent plaque index (FPI) score using propriety software of the quantitative light-induced fluorescence (QLF) system was 5 which shows a serious degree of dental plaque pathogenicity, (b) while the score of radiographic bone loss (RBL) shown in the panoramic image was 1.1 which was close to normal.
Sensors 21 05774 g001
Figure 2. White-light and fluorescent images of the anterior teeth were captured using a Qraycam Pro® (AIOBIO, Seoul, Korea). (a,b) QLF system was equipped with a metal tube that blocked external light to prevent contamination of the fluorescent image. The participants maintained an edge-to-edge occlusion while capturing the images. (c) White-light image; (d) fluorescent image.
Sensors 21 05774 g002
Figure 3. FPI score is automatically calculated with the “Simple Hygiene Score” function of the proprietary analysis program (Q-ray version 1.24, Inspektor Research Systems BV, Amsterdam, The Netherlands).
Sensors 21 05774 g003
Figure 4. FPI is a score calculated by applying two variables (A30 and A120), which are regions of red fluorescent plaques corresponding to pixels with ΔR > 30% and ΔR > 120%, to a specific function. FPI scores were calculated in one of six categories (from 0 to 5).
Sensors 21 05774 g004
Figure 5. The measurement of RBL (radiographic bone loss) on a panoramic image: (a) the distance from the root tip of the tooth to the periodontal bone level (PBL); (b) the distance from the root tip of the tooth to the cementoenamel junction level (CEJL); (c) the percentage rate of the intersection length of the PBL and the other CEJL.
Sensors 21 05774 g005
Figure 6. RBL scoring on a panoramic image (a) and periapical radiographic image (b) based on the percentage rate, to classify the periodontal bone loss of the tooth for periodontitis staging according to the new criteria. The classification criteria were as follows. Score 1: RBL < 15%. Score 2: 15% ≤ RBL ≤ 33%. Score 3: 34% ≤ RBL ≤ 66%. Score 4: RBL > 66%.
Sensors 21 05774 g006
Table 1. Scoring to evaluate oral health habits in patients.
Oral Health HabitsScore
Tooth brushing/day
None0
1~21
3 or more2
Tooth brushing before bed/week
00
1~31
4~62
73
Use of oral hygiene products
No0
Yes1
Use of interdental brush or dental floss
No0
Sometimes1
Always use with toothbrush2
Scaling experience
None0
>2 years1
<2 years2
<1 year3
<6 months4
Table 2. Average and classification of oral habit score, FPI and RBL.
The average of oral health habit scoreTotal7.52 ± 2.07
Male6.98 ± 2.20
Female7.88 ± 1.91
The patient number of FPI0125 (53.9%)
157 (24.6%)
26 (2.6%)
316 (6.9%)
415 (6.5%)
513 (5.6%)
The average of RBL scoreTotal1.50 ± 0.32
Maxilla1.50 ± 0.33
Mandible1.50 ± 0.36
Anterior1.44 ± 0.36
Posterior1.56 ± 0.33
FPI: fluorescent plaque index; RBL: radiographic bone loss.
Table 3. The multiple generalized linear model estimate between the FPI adjusted by oral health habit score, age and sex.
Variable Multiple Generalized Linear Model
B EstimateCIp-Value
Oral health habit scoreFPI−0.241 −0.332 −0.150 <0.0001
A30−0.352 −0.537 −0.167 0.000
A120−0.122 −0.208 −0.035 0.006
AgeFPI0.018 0.004 0.032 0.010
A300.027 −0.001 0.055 0.051
A1200.001 −0.012 0.014 0.851
Sex (female)FPI−0.458 −0.846 −0.070 0.021
A30−0.674 −1.463 0.114 0.093
A120−0.187 −0.555 0.181 0.318
FPI: fluorescent plaque index; A30 and A120, percentual areas with to tooth area corresponding to all pixels where ΔR over 30 % and 120 %, respectively.
Table 4. The multiple generalized linear model estimate between the RBL adjusted by oral health habit score, age and sex.
Variable Multiple Generalized Linear Model
B EstimateCIp-Value
Oral health habit scoreRBLTotal0.002 −0.017 0.021 0.8707
Maxilla−0.002 −0.022 0.019 0.8640
Mandible0.005 −0.017 0.027 0.6385
Anterior0.005 −0.017 0.027 0.6590
Posterior−0.002 −0.021 0.017 0.8245
AgeRBLTotal0.009 0.006 0.012 <0.0001
Maxilla0.008 0.005 0.011 <0.0001
Mandible0.010 0.007 0.014 <0.0001
Anterior0.007 0.003 0.010 0.000
Posterior0.011 0.008 0.014 <0.0001
Sex (female)RBLTotal−0.060 −0.141 0.021 0.1477
Maxilla−0.058 −0.146 0.029 0.1893
Mandible−0.077 −0.170 0.015 0.1018
Anterior−0.039 −0.135 0.057 0.4212
Posterior−0.084 −0.167 −0.002 0.044
RBL: radiographic bone loss.
Table 5. Spearman’s correlation analysis of FPI and RBL scores.
Coefficient of Correlationp-Value
RBL_TotalFPI−0.0008 0.9909
A30−0.0347 0.5996
A1200.0585 0.3752
FPI: fluorescent plaque index; RBL: radiographic bone loss; A30 and A120, percentual areas with to tooth area corresponding to all pixels where ΔR over 30 % and 120 %, respectively.
Publisher’s Note: MDPI stays neutral with regard to jurisdictional claims in published maps and institutional affiliations.

