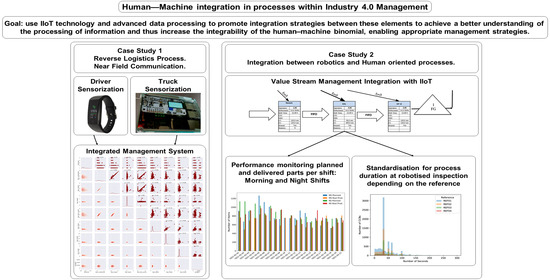
Human–Machine Integration in Processes within Industry 4.0 Management
Abstract
1. Introduction
2. State of the Art
3. Case Studies
- Scope establishment;
- Specification of population and sampling;
- Data collection;
- Standardisation procedure;
- Data analysis.
3.1. Case Study 1. Reverse Logistics Process. near Field Communication
3.1.1. Scope Establishment
3.1.2. Specification of Population and Sampling
3.1.3. Data Collection
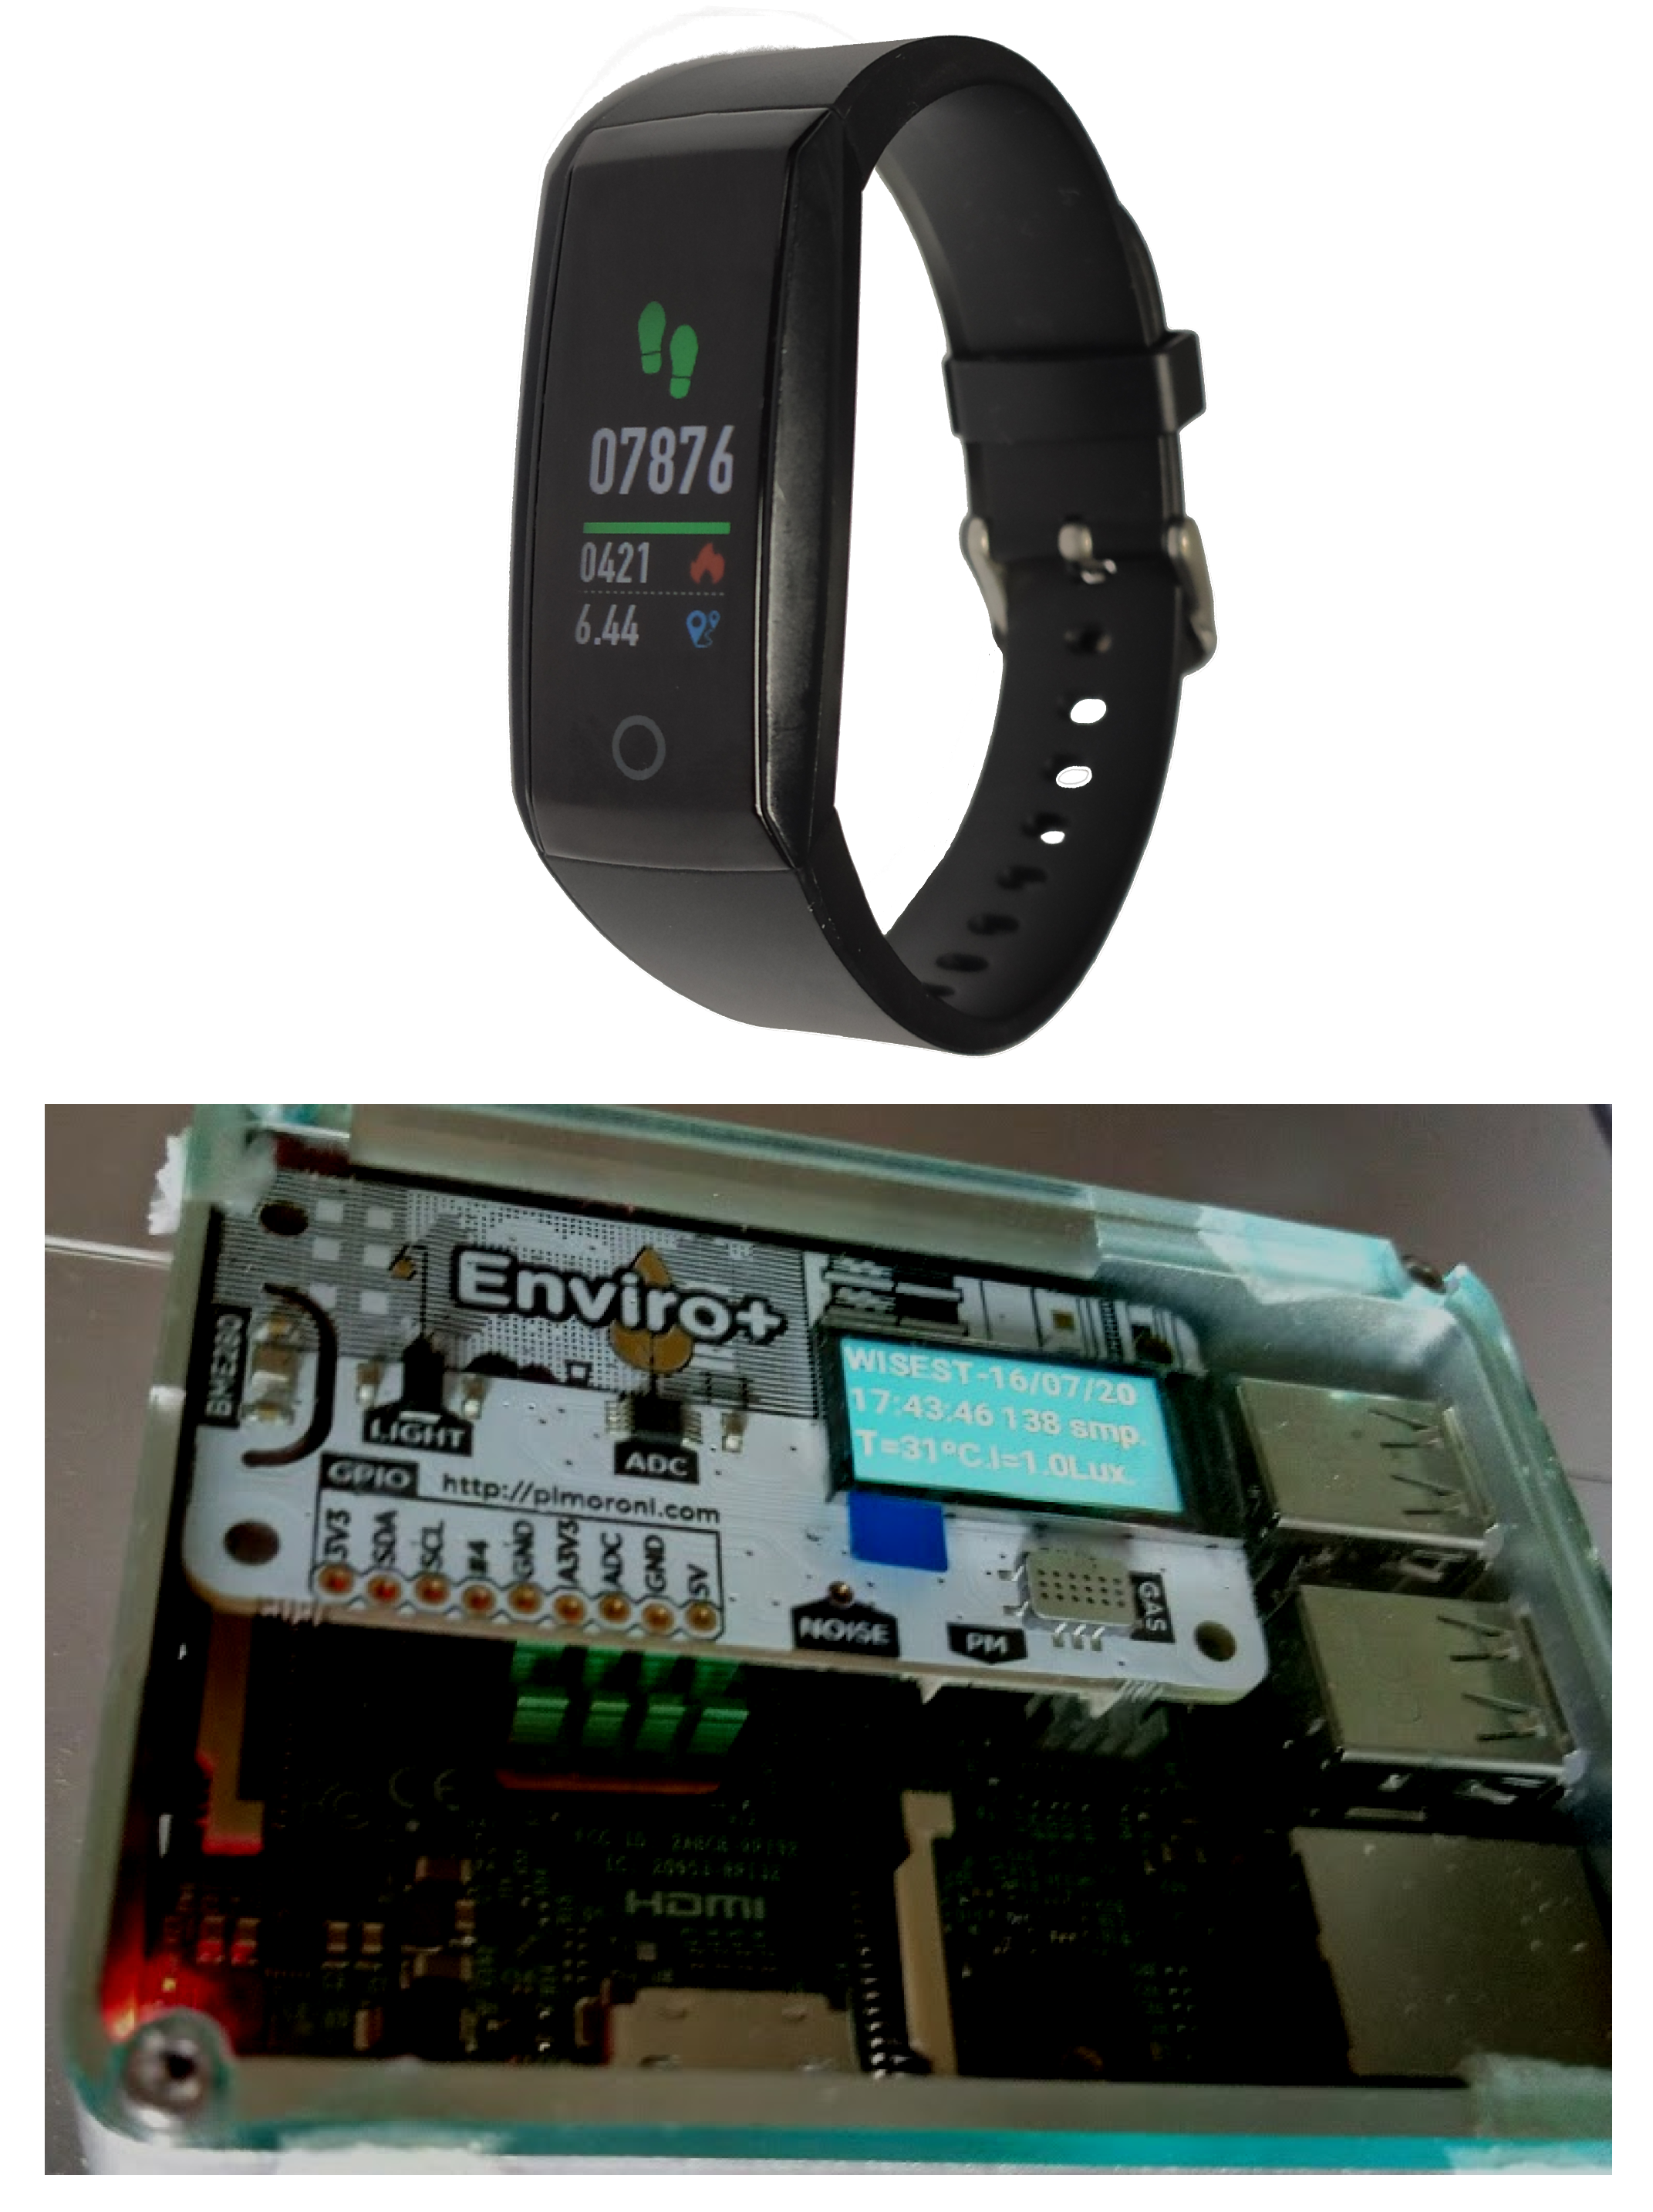
- Health-related parameters are gathered through non-invasive Bluetooth Low Energy (BLE) devices. In this study, we consider as irrelevant the effect that the fact that their health is being measured could have on human behaviour.
- Trucks’ condition monitoring is gathered through solid state based devices.
- Near-field communication (NFC) Technologies.
3.1.4. Standardization Procedure
3.1.5. Data Analysis
3.2. Case Study 2. Integration between Robotics and Human Oriented Processes
3.2.1. Scope Establishment
3.2.2. Specification of Population and Sampling
3.2.3. Data Collection
3.2.4. Standardisation Procedure
3.2.5. Data Analysis
4. Discussion
5. Conclusions
Author Contributions
Funding
Institutional Review Board Statement
Informed Consent Statement
Data Availability Statement
Acknowledgments
Conflicts of Interest
Abbreviations
| AI | Artificial Intelligence |
| BLE | Bluetooth Low Energy |
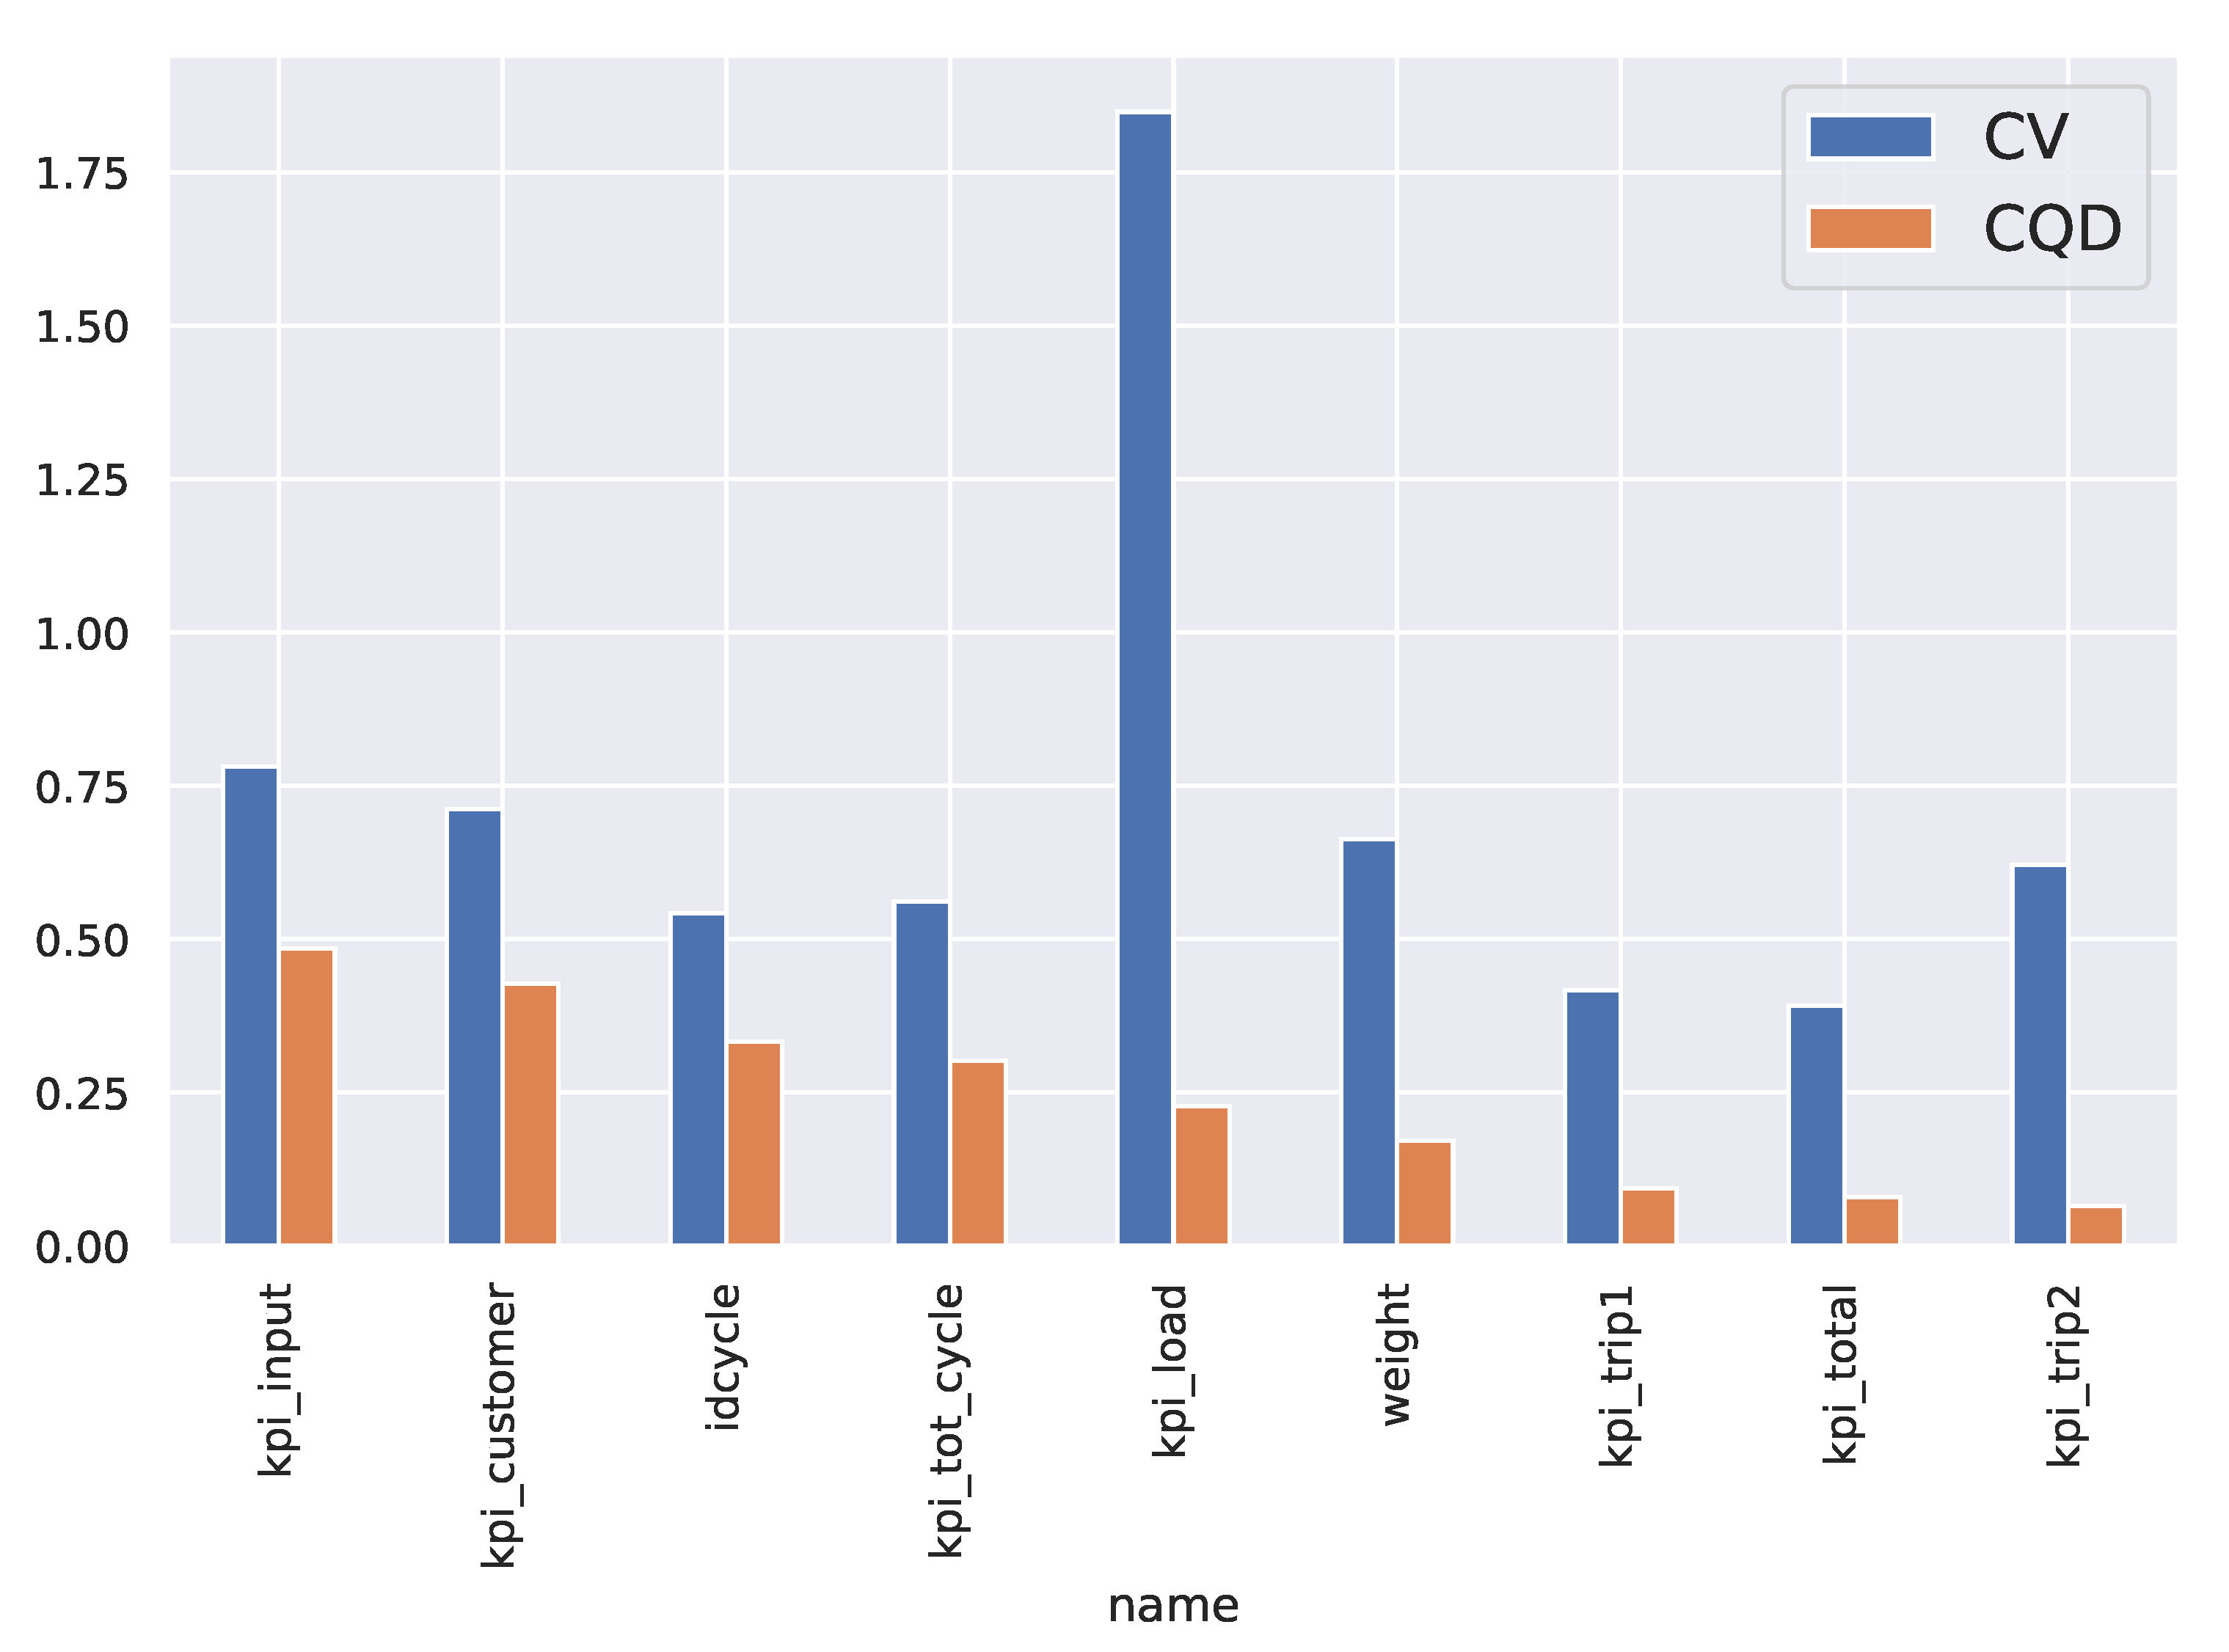
| CQD | Coefficient Interquartile of Dispersion |
| CV | Coefficients of Variation |
| H–CPS | Human–Cyber–Physical Systems |
| I4.0 | Industry 4.0 |
| IIoT | Industrial Internet of Things |
| KPI | Key Performance Indicator |
| NFC | Near-field communication |
| O4.0 | Operator 4.0 |
| VSM | Value Stream Mapping |
| ethical AI | Ethical Artificial Intelligence |
| DM | Data Mining |
| FP-Growth | Frequent-Pattern Growth |
| R.H.S. | Right Hand Side of an Association Rule |
References
- Lee, J.; Bagheri, B.; Kao, H.A. A Cyber-Physical Systems architecture for Industry 4.0-based manufacturing systems. Manuf. Lett. 2015, 3, 18–23. [Google Scholar] [CrossRef]
- Song, H.; Rawat, D.; Jeschke, S.; Brecher, C. (Eds.) Cyber-Physical Systems; Academic Press: New York, NY, USA, 2017. [Google Scholar]
- Schuh, G.; Zeller, V.; Stroh, M.F.; Harder, P. Finding the Right Way Towards a CPS—A Methodology for Individually Selecting Development Processes for Cyber-Physical Systems. In Collaborative Networks and Digital Transformation; Camarinha-Matos, L.M., Antonelli, D., Eds.; Springer International Publishing: Cham, Switzerland, 2019; pp. 81–90. [Google Scholar]
- Lodgaard, E.; Dransfeld, S. Organizational aspects for successful integration of human–machine interaction in the industry 4.0 era. In Proceedings of the 13th CIRP Conference on Intelligent Computation in Manufacturing Engineering, Naples, Italy, 17–19 July 2019; Volume 88, pp. 218–222. [Google Scholar]
- Nardo, M.; Forino, D.; Murino, T. The evolution of man–machine interaction: The role of human in Industry 4.0 paradigm. Prod. Manuf. Res. 2020, 8, 20–34. [Google Scholar] [CrossRef]
- Krupitzer, C.; Müller, S.; Lesch, V.; Züfle, M.; Edinger, J.; Lemken, A.; Becker, C. A Survey on Human Machine Interaction in Industry 4.0. arXiv 2020, arXiv:2002.01025. [Google Scholar]
- Ordieres-Meré, J.; Villalba-Díez, J.; Zheng, X. Challenges and Opportunities for Publishing IIoT Data in Manufacturing as a Service Business. Procedia Manuf. 2019, 39, 185–193. [Google Scholar] [CrossRef]
- Khan, W.Z.; Rehman, M.H.; Zangoti, H.M.; Afzal, M.K.; Armi, N.; Salah, K. Industrial internet of things: Recent advances, enabling technologies and open challenges. Comput. Electr. Eng. 2020, 81, 106522. [Google Scholar] [CrossRef]
- Evjemo, L.D.; Gjerstad, T.; Grøtli, E.I.; Sziebig, G. Trends in Smart Manufacturing: Role of Humans and Industrial Robots in Smart Factories. Curr. Robot. Rep. 2020, 1, 35–41. [Google Scholar] [CrossRef]
- Jardim-Goncalves, R.; Romero, D.; Grilo, A. Factories of the future: Challenges and leading innovations in intelligent manufacturing. Int. J. Comput. Integr. Manuf. 2017, 30, 4–14. [Google Scholar] [CrossRef]
- Zheng, X.; Wang, M.; Ordieres-Meré, J. Comparison of Data Preprocessing Approaches for Applying Deep Learning to Human Activity Recognition in the Context of Industry 4.0. Sensors 2018, 18, 2146. [Google Scholar] [CrossRef]
- Ghosh, A.; Edwards, D.J.; Hosseini, M.R.; Al-Ameri, R.; Abawajy, J.; Thwala, W.D. Real-time structural health monitoring for concrete beams: A cost-effective “Industry 4.0” solution using piezo sensors. Int. J. Build. Pathol. Adapt. 2021, 39, 283–311. [Google Scholar] [CrossRef]
- Aceto, G.; Persico, V.; Pescapé, A. Industry 4.0 and Health: Internet of Things, Big Data, and Cloud Computing for Healthcare 4.0. J. Ind. Inf. Integr. 2020, 18, 100129. [Google Scholar] [CrossRef]
- Bohé, I.; Willocx, M.; Naessens, V. An Extensible Approach for Integrating Health and Activity Wearables in Mobile IoT Apps. In Proceedings of the 2019 IEEE International Congress on Internet of Things (ICIOT), Milan, Italy, 8–13 July 2019; pp. 69–75. [Google Scholar] [CrossRef]
- Grangel-González, I.; Halilaj, L.; Coskun, G.; Auer, S.; Collarana, D.; Hoffmeister, M. Towards a Semantic Administrative Shell for Industry 4.0 Components. In Proceedings of the 2016 IEEE Tenth International Conference on Semantic Computing (ICSC), Laguna Hills, CA, USA, 4–6 February 2016; pp. 230–237. [Google Scholar] [CrossRef]
- Batty, M. Digital twins. Environ. Plan. Urban Anal. City Sci. 2018, 45, 817–820. [Google Scholar] [CrossRef]
- El Saddik, A. Digital Twins: The Convergence of Multimedia Technologies. IEEE Multimed. 2018, 25, 87–92. [Google Scholar] [CrossRef]
- Qi, Q.; Tao, F. Digital Twin and Big Data Towards Smart Manufacturing and Industry 4.0: 360 Degree Comparison. IEEE Access 2018, 6, 3585–3593. [Google Scholar] [CrossRef]
- Guerin, C.; Rauffet, P.; Chauvin, C.; Martin, E. Toward production operator 4.0: Modelling Human-Machine Cooperation in Industry 4.0 with Cognitive Work Analysis. In Proceedings of the 14th IFAC Symposium on Analysis, Design, and Evaluation of Human Machine Systems HMS, Tallinn, Estonia, 16–19 September 2019; Volume 52, pp. 73–78. [Google Scholar] [CrossRef]
- Pacaux-Lemoine, M.P.; Trentesaux, D. Ethical risks of human-machine symbiosis in industry 4.0: Insights from the human-machine cooperation approach. In Proceedings of the 14th IFAC Symposium on Analysis, Design, and Evaluation of Human Machine Systems HMS, Tallinn, Estonia, 16–19 September 2019; Volume 52, pp. 19–24. [Google Scholar] [CrossRef]
- Scafà, M.; Marconi, M.; Germani, M. A critical review of symbiosis approaches in the context of Industry 4.0. J. Comput. Des. Eng. 2020, 7, 269–278. [Google Scholar] [CrossRef]
- Fletcher, S.R.; Johnson, T.; Adlon, T.; Larreina, J.; Casla, P.; Parigot, L.; del Mar Otero, M. Adaptive automation assembly: Identifying system requirements for technical efficiency and worker satisfaction. Comput. Ind. Eng. 2020, 139, 105772. [Google Scholar] [CrossRef]
- Kaasinen, E.; Schmalfuß, F.; Özturk, C.; Aromaa, S.; Boubekeur, M.; Heilala, J.; Walter, T. Empowering and engaging industrial workers with Operator 4.0 solutions. Comput. Ind. Eng. 2020, 139, 105678. [Google Scholar] [CrossRef]
- Zhou, J.; Zhou, Y.; Wang, B.; Zang, J. Human–Cyber–Physical Systems (HCPSs) in the Context of New-Generation Intelligent Manufacturing. Engineering 2019, 5, 624–636. [Google Scholar] [CrossRef]
- Villalba-Diez, J.; Ordieres-Mere, J. Improving manufacturing operational performance by standardizing process management. Trans. Eng. Manag. 2015, 62, 351–360. [Google Scholar] [CrossRef]
- Villalba-Diez, J. The Hoshin Kanri Forest. Lean Strategic Organizational Design, 1st ed.; CRC Press; Taylor and Francis Group LLC: Boca Raton, FL, USA, 2017. [Google Scholar]
- Villalba-Diez, J. The Lean Brain Theory. Complex Networked Lean Strategic Organizational Design; CRC Press; Taylor and Francis Group LLC: Boca Raton, FL, USA, 2017. [Google Scholar]
- Burton, R.M.; Obel, B. Strategic Organizational Diagnosis and Design: The Dynamics of Fit; Kluwer Academic Publishers: Dordrecht, The Netherlands, 2004. [Google Scholar]
- Alberts, D.S. Rethinking Organizational Design for Complex Endeavors. J. Organ. Des. 2012, 1, 14–17. [Google Scholar]
- Burton, R.M.; Øbel, B.; Håkonsson, D.D. Organizational Design: A Step-by-Step Approach, 3rd ed.; Cambridge University Press: Cambridge, UK, 2015. [Google Scholar]
- Cross, R.L.; Singer, J.; Colella, S.; Thomas, R.J.; Silverstone, Y. The Organizational Network Fieldbook: Best Practices, Techniques and Exercises to Drive Organizational Innovation and Performance, 1st ed.; Jossey-Bass: San Francisco, CA, USA, 2010. [Google Scholar]
- Jabeur, N.; Sahli, N.; Zeadally, S. Enabling Cyber Physical Systems with Wireless Sensor Networking Technologies, Multiagent System Paradigm, and Natural Ecosystems. Mob. Inf. Syst. 2015, 2015, 15. [Google Scholar] [CrossRef]
- Fujimoto, T. Evolution of Manufacturing Systems at Toyota; Productivity Press: Portland, OR, USA, 2001. [Google Scholar]
- Durugbo, C.; Tiwari, A.; Alcock, J.R. Modelling information flow for organisations: A review of approaches and future challenges. Int. J. Inf. Manag. 2013, 33, 597–610. [Google Scholar] [CrossRef]
- Powell, D.; Romero, D.; Gaiardelli, P.; Cimini, C.; Cavalieri, S. Towards Digital Lean Cyber-Physical Production Systems: Industry 4.0 Technologies as Enablers of Leaner Production. In Advances in Production Management Systems. Smart Manufacturing for Industry 4.0; Moon, I., Lee, G.M., Park, J., Kiritsis, D., von Cieminski, G., Eds.; Springer International Publishing: Cham, Switzerland, 2018; pp. 353–362. [Google Scholar]
- Romero, D.; Wuest, T.; Stahre, J.; Gorecky, D. Social Factory Architecture: Social Networking Services and Production Scenarios Through the Social Internet of Things, Services and People for the Social Operator 4.0. In Advances in Production Management Systems. The Path to Intelligent, Collaborative and Sustainable Manufacturing; Lödding, H., Riedel, R., Thoben, K.-D., von Cieminski, G., Kiritsis, D., Eds.; Springer International Publishing: Cham, Switzerland, 2017; pp. 265–273. [Google Scholar]
- Sun, S.; Zheng, X.; Villalba-Díez, J.; Ordieres-Meré, J. Indoor Air-Quality Data-Monitoring System: Long-Term Monitoring Benefits. Sensors 2019, 19, 4157. [Google Scholar] [CrossRef]
- Hellebrandt, T.; Ruessmann, M.; Heine, I.; Schmitt, R.H. Conceptual Approach to Integrated Human-Centered Performance Management on the Shop Floor. In Advances in Human Factors, Business Management and Society; Kantola, J.I., Nazir, S., Barath, T., Eds.; Springer International Publishing: Cham, Switzerland, 2019; pp. 309–321. [Google Scholar]
- Schilling, K.; Storms, S.; Herfs, W. Environment-Integrated Human Machine Interface Framework for Multimodal System Interaction on the Shopfloor. In Advances in Human Factors and Systems Interaction; Nunes, I.L., Ed.; Springer International Publishing: Cham, Switzerland, 2019; pp. 374–383. [Google Scholar]
- Tao, F.; Qi, Q.; Wang, L.; Nee, A.Y.C. Digital Twins and Cyber–Physical Systems toward Smart Manufacturing and Industry 4.0: Correlation and Comparison. Engineering 2019, 5, 653–661. [Google Scholar] [CrossRef]
- Al-Masri, E. Enhancing the Microservices Architecture for the Internet of Things. In Proceedings of the 2018 IEEE International Conference on Big Data (Big Data), Seattle, WA, USA, 10–13 December 2018; pp. 5119–5125. [Google Scholar] [CrossRef]
- Ullah, I.; Ul Amin, N.; Zareei, M.; Zeb, A.; Khattak, H.; Khan, A.; Goudarzi, S. A Lightweight and Provable Secured Certificateless Signcryption Approach for Crowdsourced IIoT Applications. Symmetry 2019, 11, 1386. [Google Scholar] [CrossRef]
- Sun, L.; Li, Y.; Memon, R.A. An open IoT framework based on microservices architecture. China Commun. 2017, 14, 154–162. [Google Scholar] [CrossRef]
- Villalba-Diez, J.; Zheng, X.; Schmidt, D.; Molina, M. Characterization of Industry 4.0 Lean Management Problem-Solving Behavioral Patterns Using EEG Sensors and Deep Learning. Sensors 2019, 19, 2841. [Google Scholar] [CrossRef]
- Schmidt, D.; Villalba Diez, J.; Ordieres-Meré, J.; Gevers, R.; Schwiep, J.; Molina, M. Industry 4.0 Lean Shopfloor Management Characterization Using EEG Sensors and Deep Learning. Sensors 2020, 20, 2860. [Google Scholar] [CrossRef]
- Inshakova, A.O.; Frolova, E.E.; Rusakova, E.P.; Kovalev, S.I. The model of distribution of human and machine labor at intellectual production in industry 4.0. J. Intellect. Cap. 2020, 21, 601–622. [Google Scholar] [CrossRef]
- López-Núñez, M.I.; Rubio-Valdehita, S.; Diaz-Ramiro, E.M.; Aparicio-García, M.E. Psychological Capital, Workload, and Burnout: What’s New? The Impact of Personal Accomplishment to Promote Sustainable Working Conditions. Sustainability 2020, 12, 8124. [Google Scholar] [CrossRef]
- Emami, Z.; Chau, T. The effects of visual distractors on cognitive load in a motor imagery brain–computer interface. Behav. Brain Res. 2020, 378, 112240. [Google Scholar] [CrossRef] [PubMed]
- Carvalho, A.V.; Chouchene, A.; Lima, T.M.; Charrua-Santos, F. Cognitive Manufacturing in Industry 4.0 toward Cognitive Load Reduction: A Conceptual Framework. Appl. Syst. Innov. 2020, 3, 55. [Google Scholar] [CrossRef]
- Chaijaroen, N.; Jackpeng, S.; Chaijaroen, S. The Development of Constructivist Web-Based Learning Environments to Enhance Learner’s Information Processing and Reduce Cognitive Load. In Innovative Technologies and Learning; Huang, T.-C., Wu, T.-T., Barroso, J., Eika Sandnes, F.E., Martins, P., Huang, Y.-M., Eds.; Springer International Publishing: Cham, Switzerland, 2020; pp. 475–482. [Google Scholar]
- Thees, M.; Kapp, S.; Strzys, M.P.; Beil, F.; Lukowicz, P.; Kuhn, J. Effects of augmented reality on learning and cognitive load in university physics laboratory courses. Comput. Hum. Behav. 2020, 108, 106316. [Google Scholar] [CrossRef]
- Liu, H.; Wang, L. Remote human–robot collaboration: A cyber–physical system application for hazard manufacturing environment. J. Manuf. Syst. 2020, 54, 24–34. [Google Scholar] [CrossRef]
- Li, X.; Wang, L.; Zhu, C.; Liu, Z. Framework for manufacturing-tasks semantic modelling and manufacturing-resource recommendation for digital twin shop-floor. J. Manuf. Syst. 2021, 58, 281–292. [Google Scholar] [CrossRef]
- Caiza, G.; Nuñez, A.; Garcia, C.A.; Garcia, M.V. Human Machine Interfaces Based on Open Source Web-Platform and OPC UA. Procedia Manuf. 2020, 42, 307–314. [Google Scholar] [CrossRef]
- Kinne, S.; Jost, J.; Terharen, A.; Feldmann, F.; Fiolka, M.; Kirks, T. Process Development for CPS Design and Integration in I4. 0 Systems with Humans. In Digital Supply Chains and the Human Factor; Springer: Cham, Switzerland, 2021; pp. 17–32. [Google Scholar]
- Tortorella, G.; Sawhney, R.; Jurburg, D.; de Paula, I.C.; Tlapa, D.; Thurer, M. Towards the proposition of a lean automation framework: Integrating industry 4.0 into lean production. J. Manuf. Technol. Manag. 2020, 32, 593–620. [Google Scholar] [CrossRef]
- Terry Anthony Byrd, D.E.T. Measuring the flexibility of information technology infrastructure: Exploratory analysis of a construct. J. Manag. Inf. Syst. 2000, 17, 167–208. [Google Scholar]
- Eisenhardt, K.M. Building theories from case study research. Acad. Manag. Rev. 1989, 14, 532–550. [Google Scholar] [CrossRef]
- Ordieres, J. jbmere/HealthOperator4.0 v1.0; Zenodo: Geneva, Switzerland, 2020. [Google Scholar]
- Ordieres, J. jbmere/GesOperNFC: First Release; Zenodo: Geneva, Switzerland, 2021. [Google Scholar]
- Bradshaw, S.; Brazil, E. MongoDB: The Definitive Guide, 3rd ed.; O’Reilly Media Inc.: Sebastopol, CA, USA, 2019. [Google Scholar]
- Kenzler, E.; Razzoli, F. MariaDB Essentials; Packt Publishing: Birmingham, UK, 2015. [Google Scholar]
- Fengyi, D.; Zhenyu, L. An ameliorating FP-growth algorithm based on patterns-matrix. J. Xiamen Univ. (Nat. Sci.) 2005, 44, 629–633. [Google Scholar]
- Zhichun, L.; Fengxin, Y. An improved frequent pattern tree growth algorithm. Appl. Sci. Technol. 2008, 35, 47–51. [Google Scholar]
- Jun, C.; Li, G. An improved FP-growth algorithm based on item head table node. Inf. Technol. 2013, 12, 34–35. [Google Scholar]
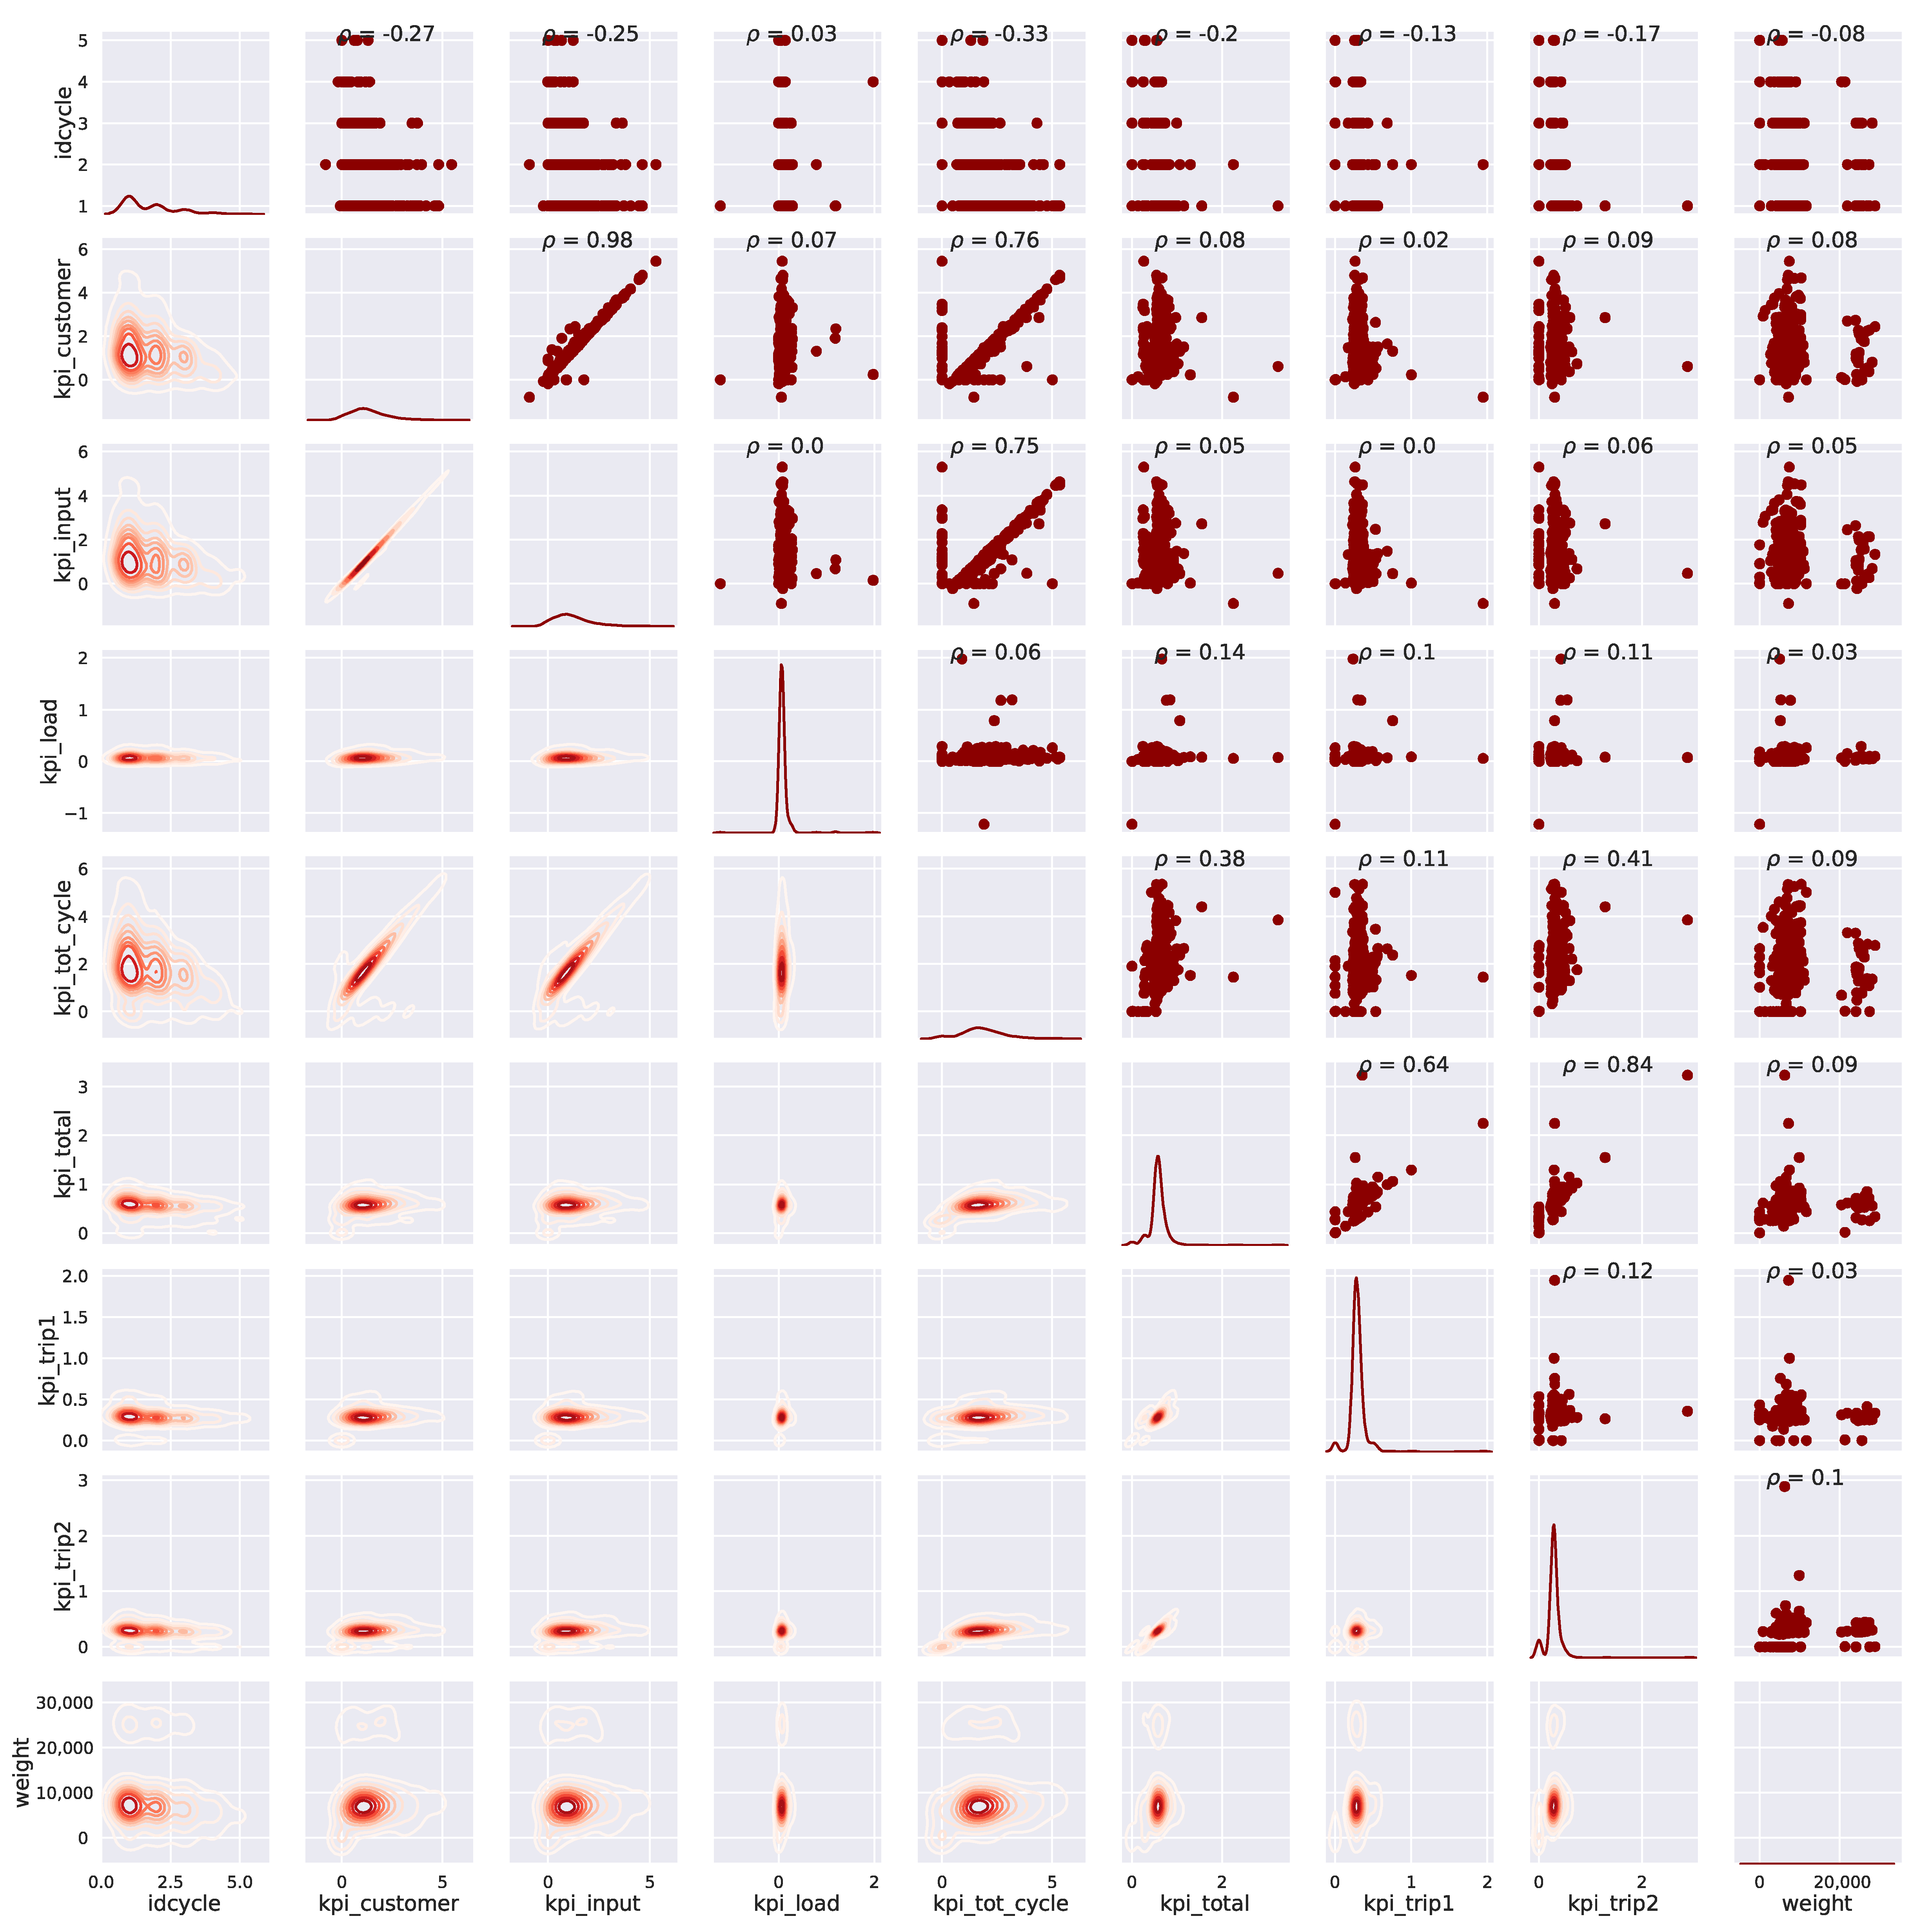


| Name | Meaning |
|---|---|
| date | date for the record. |
| shift | Number of shift. 1: 06:00–14:00; 2: 14:00–22:00; 3: 22:00–06:00+1 |
| plate | Truck plate ID. |
| user | Anonymous user ID (pseudo-anonymity for the truck driver). |
| idcycle | Number of cycle in the working day. |
| kpi_unload | Duration in minutes to unload the truck at the headquarters. |
| kpi_trip1 | Duration in minutes from headquarters to customer facilities for collecting the scrap. |
| kpi_customer | Duration in minutes inside the customer facilities. |
| kpi_input | From customer entrance to loading point. |
| kpi_output | From loading point to the exit. |
| kpi_load | Duration of scrap loading process. |
| kpi_trip2 | Duration in minutes from customer facilities for collecting the scrap to headquarters. |
| kpi_total | Duration of the whole cycle without headquarters movements. |
| kpi_tot_cycle | Duration of the total cycle. |
| weight | Scrap weight. |
| t2 | Absolute time for starting the cycle. |
| KPI (Unit) | Min | Q1-Init | Q2-Init | Q3-Init | Max | StDev |
|---|---|---|---|---|---|---|
| idcycle (h) | 1.000000 | 1.000000 | 1.000000 | 2.000000 | 5.00000 | 0.945672 |
| kpi_customer (h) | −0.801667 | 0.730278 | 1.187360 | 1.821110 | 5.44750 | 0.961633 |
| kpi_input (h) | −0.905833 | 0.574653 | 1.036945 | 1.656458 | 5.29806 | 0.940865 |
| kpi_load (h) | −1.217780 | 0.050208 | 0.063750 | 0.079792 | 1.97444 | 0.151037 |
| kpi_tot_cycle (h) | 0.000000 | 1.283052 | 1.745555 | 2.393260 | 5.34778 | 1.047631 |
| kpi_total (h) | 0.000000 | 0.534722 | 0.571111 | 0.626667 | 3.23611 | 0.228157 |
| kpi_trip1 (h) | 0.000000 | 0.259653 | 0.281805 | 0.313402 | 1.94278 | 0.123308 |
| kpi_trip2 (h) | 0.000000 | 0.267500 | 0.284722 | 0.304791 | 2.88056 | 0.177552 |
| weight (Kg) | 0.000000 | 5830.000000 | 6960.000000 | 8245.000000 | 28,780.00000 | 5271.877027 |
| ItemListID | ItemList |
|---|---|
| 1 | (Plate_01, U_1, Shift_Q1, idcycle_Q0, kpi_customer_Q0, kpi_input_Q0, kpi_load_Q0, |
| kpi_tot_cycle_Q0, kpi_total_Q0, kpi_trip1_Q1, kpi_trip2_Q0, weight_Q0) | |
| 2 | (Plate_02, U_4, Shift_Q1, idcycle_Q0, kpi_customer_Q0, kpi_input_Q0, kpi_load_Q0, |
| kpi_tot_cycle_Q0, kpi_total_Q3, kpi_trip1_Q3, kpi_trip2_Q3, weight_Q3) | |
| ... | ... |
| Antecedent_STR | Consequent_STR | Confidence | |
|---|---|---|---|
| 9 | kpi_customer_Q3^kpi_total_Q3 | kpi_tot_cycle_Q3 | 1.000000 |
| 10 | kpi_input_Q3^kpi_total_Q3 | kpi_tot_cycle_Q3 | 1.000000 |
| 15 | kpi_input_Q3^kpi_total_Q2 | idcycle_Q0^kpi_customer_Q3^kpi_tot_cycle_Q3 | 0.967742 |
| 16 | kpi_customer_Q3^kpi_input_Q3^kpi_total_Q2 | idcycle_Q0^kpi_tot_cycle_Q3 | 1.000000 |
| 18 | idcycle_Q0^kpi_input_Q3^kpi_total_Q2 | kpi_customer_Q3^kpi_tot_cycle_Q3 | 0.967742 |
| 22 | kpi_customer_Q3^kpi_total_Q2 | idcycle_Q0^kpi_tot_cycle_Q3 | 1.000000 |
| 24 | idcycle_Q0^kpi_customer_Q3^kpi_total_Q2 | kpi_tot_cycle_Q3 | 1.000000 |
| 58 | kpi_customer_Q3^kpi_input_Q3^kpi_trip2_Q3 | kpi_tot_cycle_Q3 | 1.000000 |
| 60 | idcycle_Q0^kpi_customer_Q3^kpi_trip2_Q3 | kpi_tot_cycle_Q3 | 1.000000 |
| 62 | idcycle_Q0^kpi_input_Q3^kpi_trip2_Q3 | kpi_tot_cycle_Q3 | 0.975000 |
| Antecedent_STR | Consequent_STR | Confidence | |
|---|---|---|---|
| 1 | idcycle_Q1^kpi_customer_Q0 | kpi_tot_cycle_Q0 | 0.972973 |
| 2 | idcycle_Q1^kpi_input_Q0 | kpi_customer_Q0^kpi_tot_cycle_Q0 | 0.972222 |
| 3 | idcycle_Q1^kpi_customer_Q0^kpi_input_Q0 | kpi_tot_cycle_Q0 | 0.972222 |
Publisher’s Note: MDPI stays neutral with regard to jurisdictional claims in published maps and institutional affiliations. |
© 2021 by the authors. Licensee MDPI, Basel, Switzerland. This article is an open access article distributed under the terms and conditions of the Creative Commons Attribution (CC BY) license (https://creativecommons.org/licenses/by/4.0/).
Share and Cite
Villalba-Diez, J.; Ordieres-Meré, J. Human–Machine Integration in Processes within Industry 4.0 Management. Sensors 2021, 21, 5928. https://doi.org/10.3390/s21175928
Villalba-Diez J, Ordieres-Meré J. Human–Machine Integration in Processes within Industry 4.0 Management. Sensors. 2021; 21(17):5928. https://doi.org/10.3390/s21175928
Chicago/Turabian StyleVillalba-Diez, Javier, and Joaquín Ordieres-Meré. 2021. "Human–Machine Integration in Processes within Industry 4.0 Management" Sensors 21, no. 17: 5928. https://doi.org/10.3390/s21175928
APA StyleVillalba-Diez, J., & Ordieres-Meré, J. (2021). Human–Machine Integration in Processes within Industry 4.0 Management. Sensors, 21(17), 5928. https://doi.org/10.3390/s21175928


