
Precipitation Changes in the Three Gorges Reservoir Area and the Relationship with Water Level Change


Abstract
:1. Introduction
2. Materials
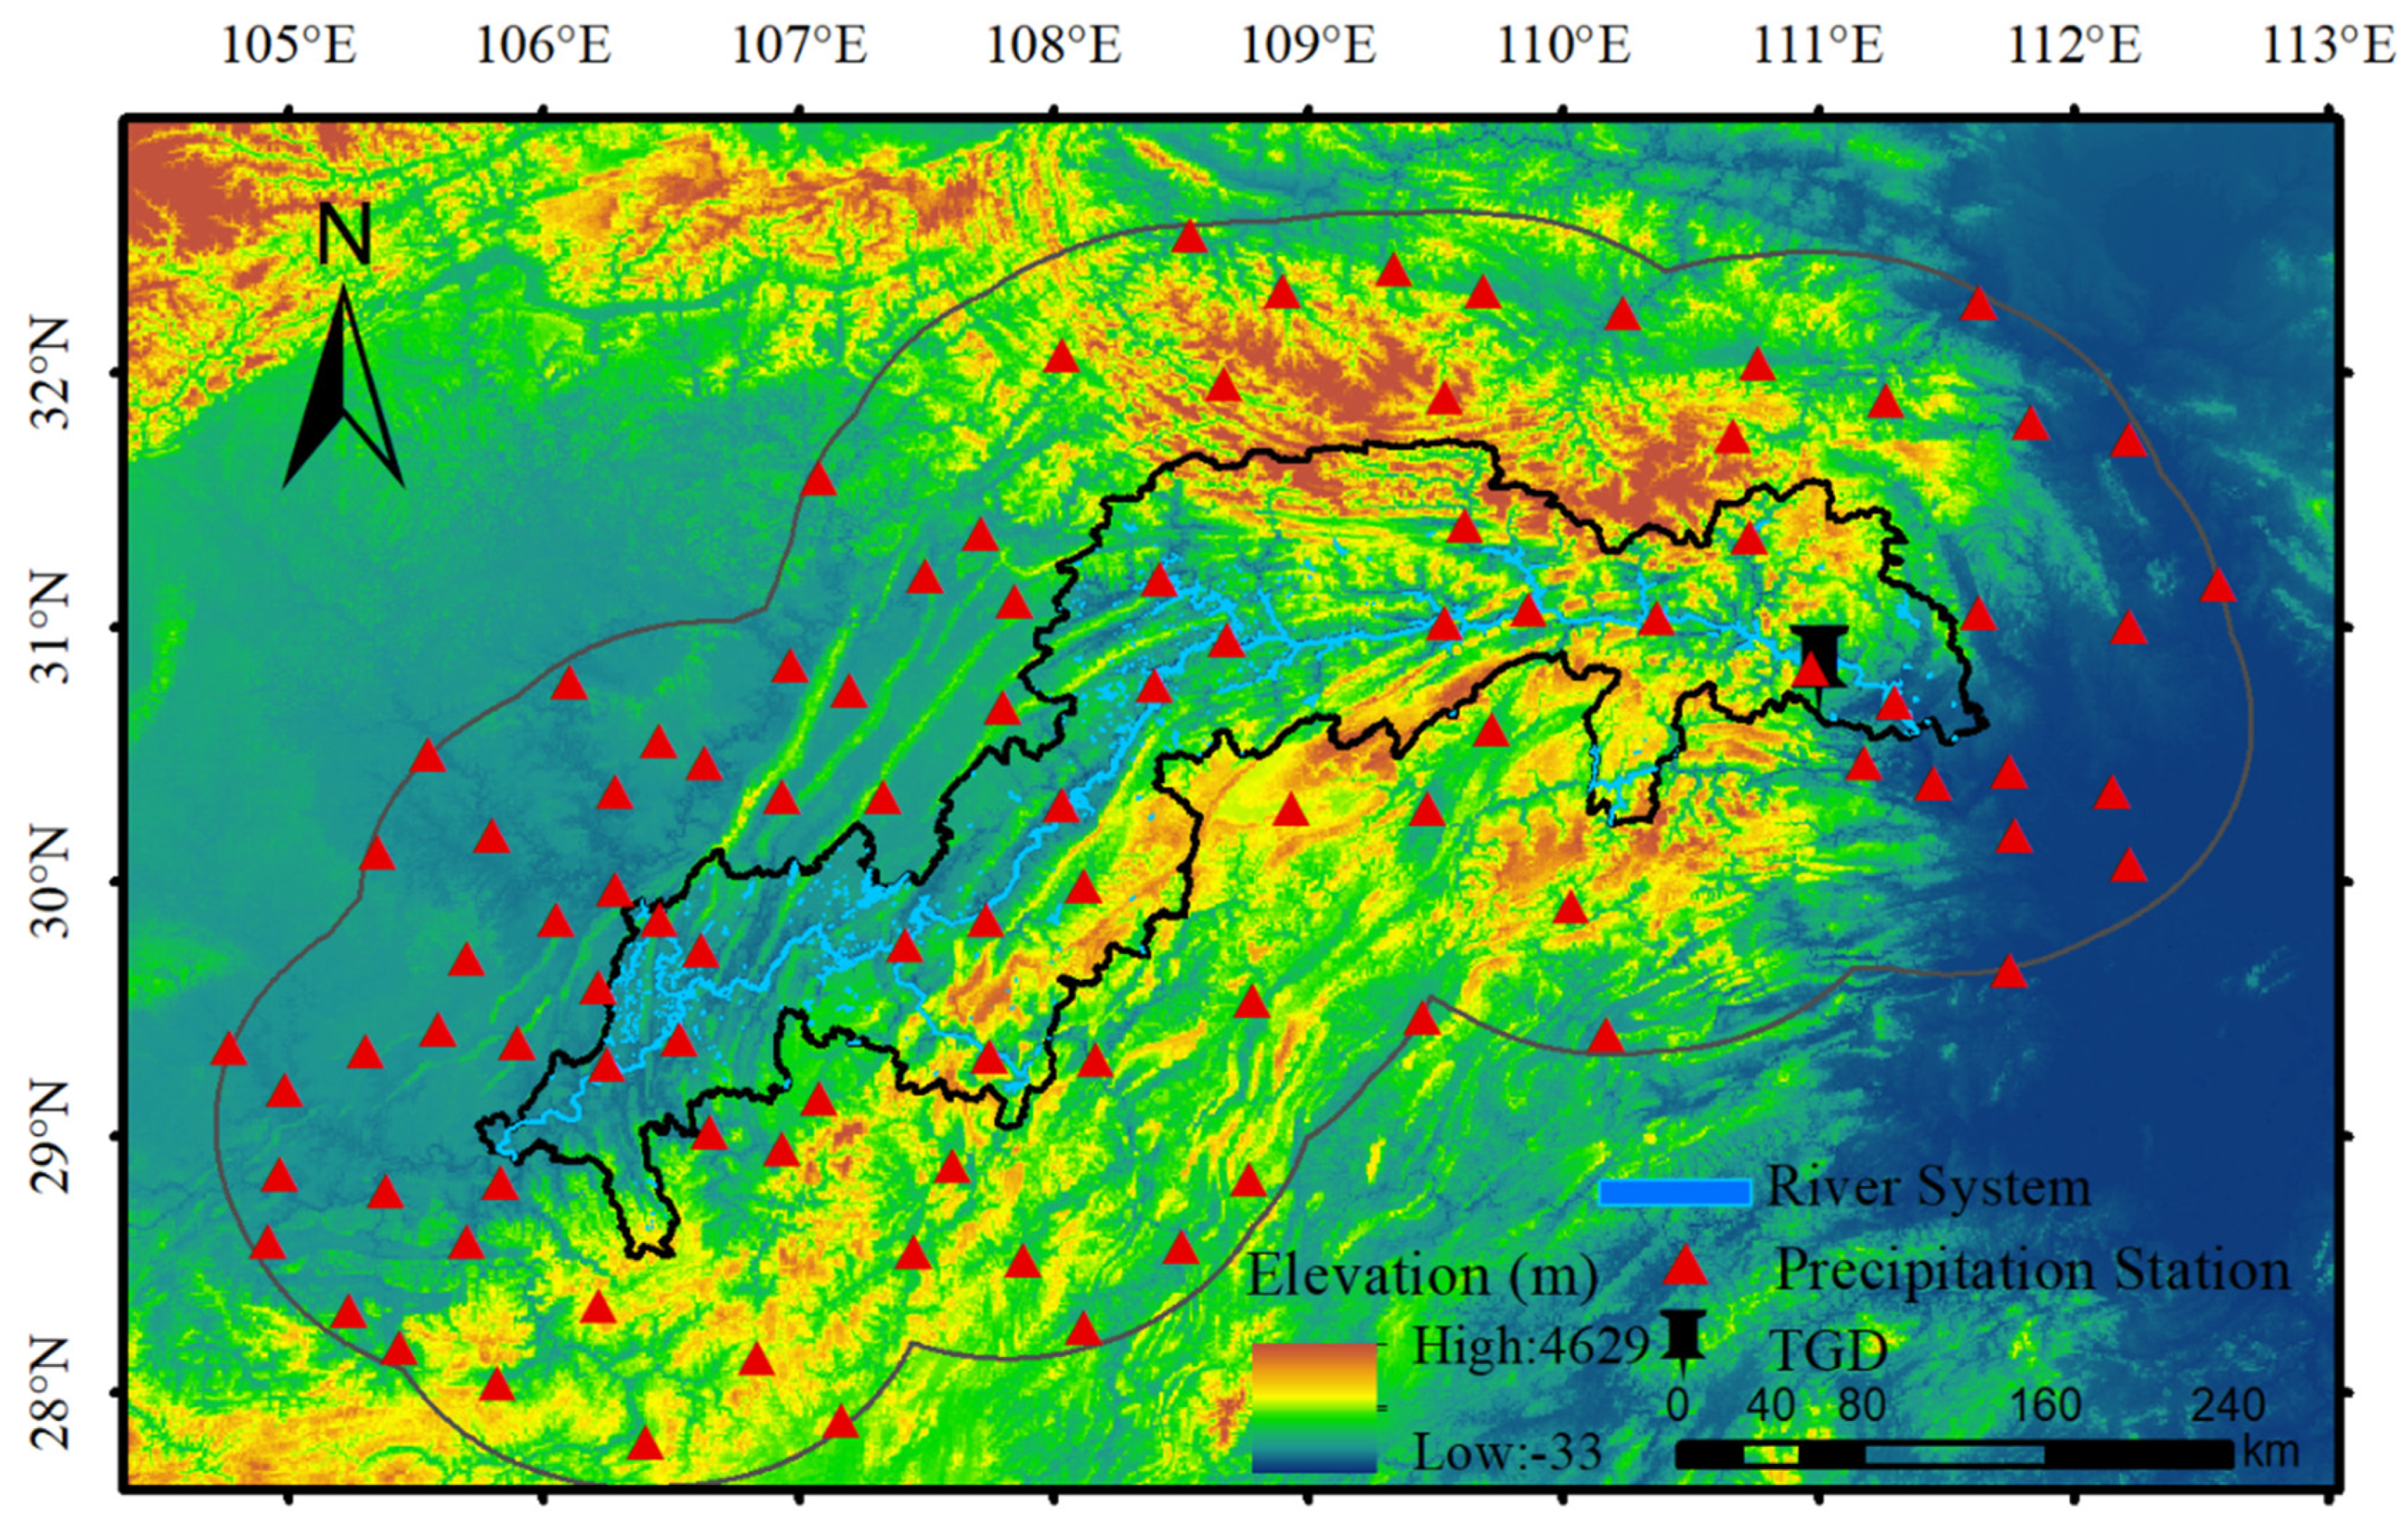
2.1. Study Area
2.2. Data
2.2.1. CN05.1
2.2.2. Station Precipitation Data
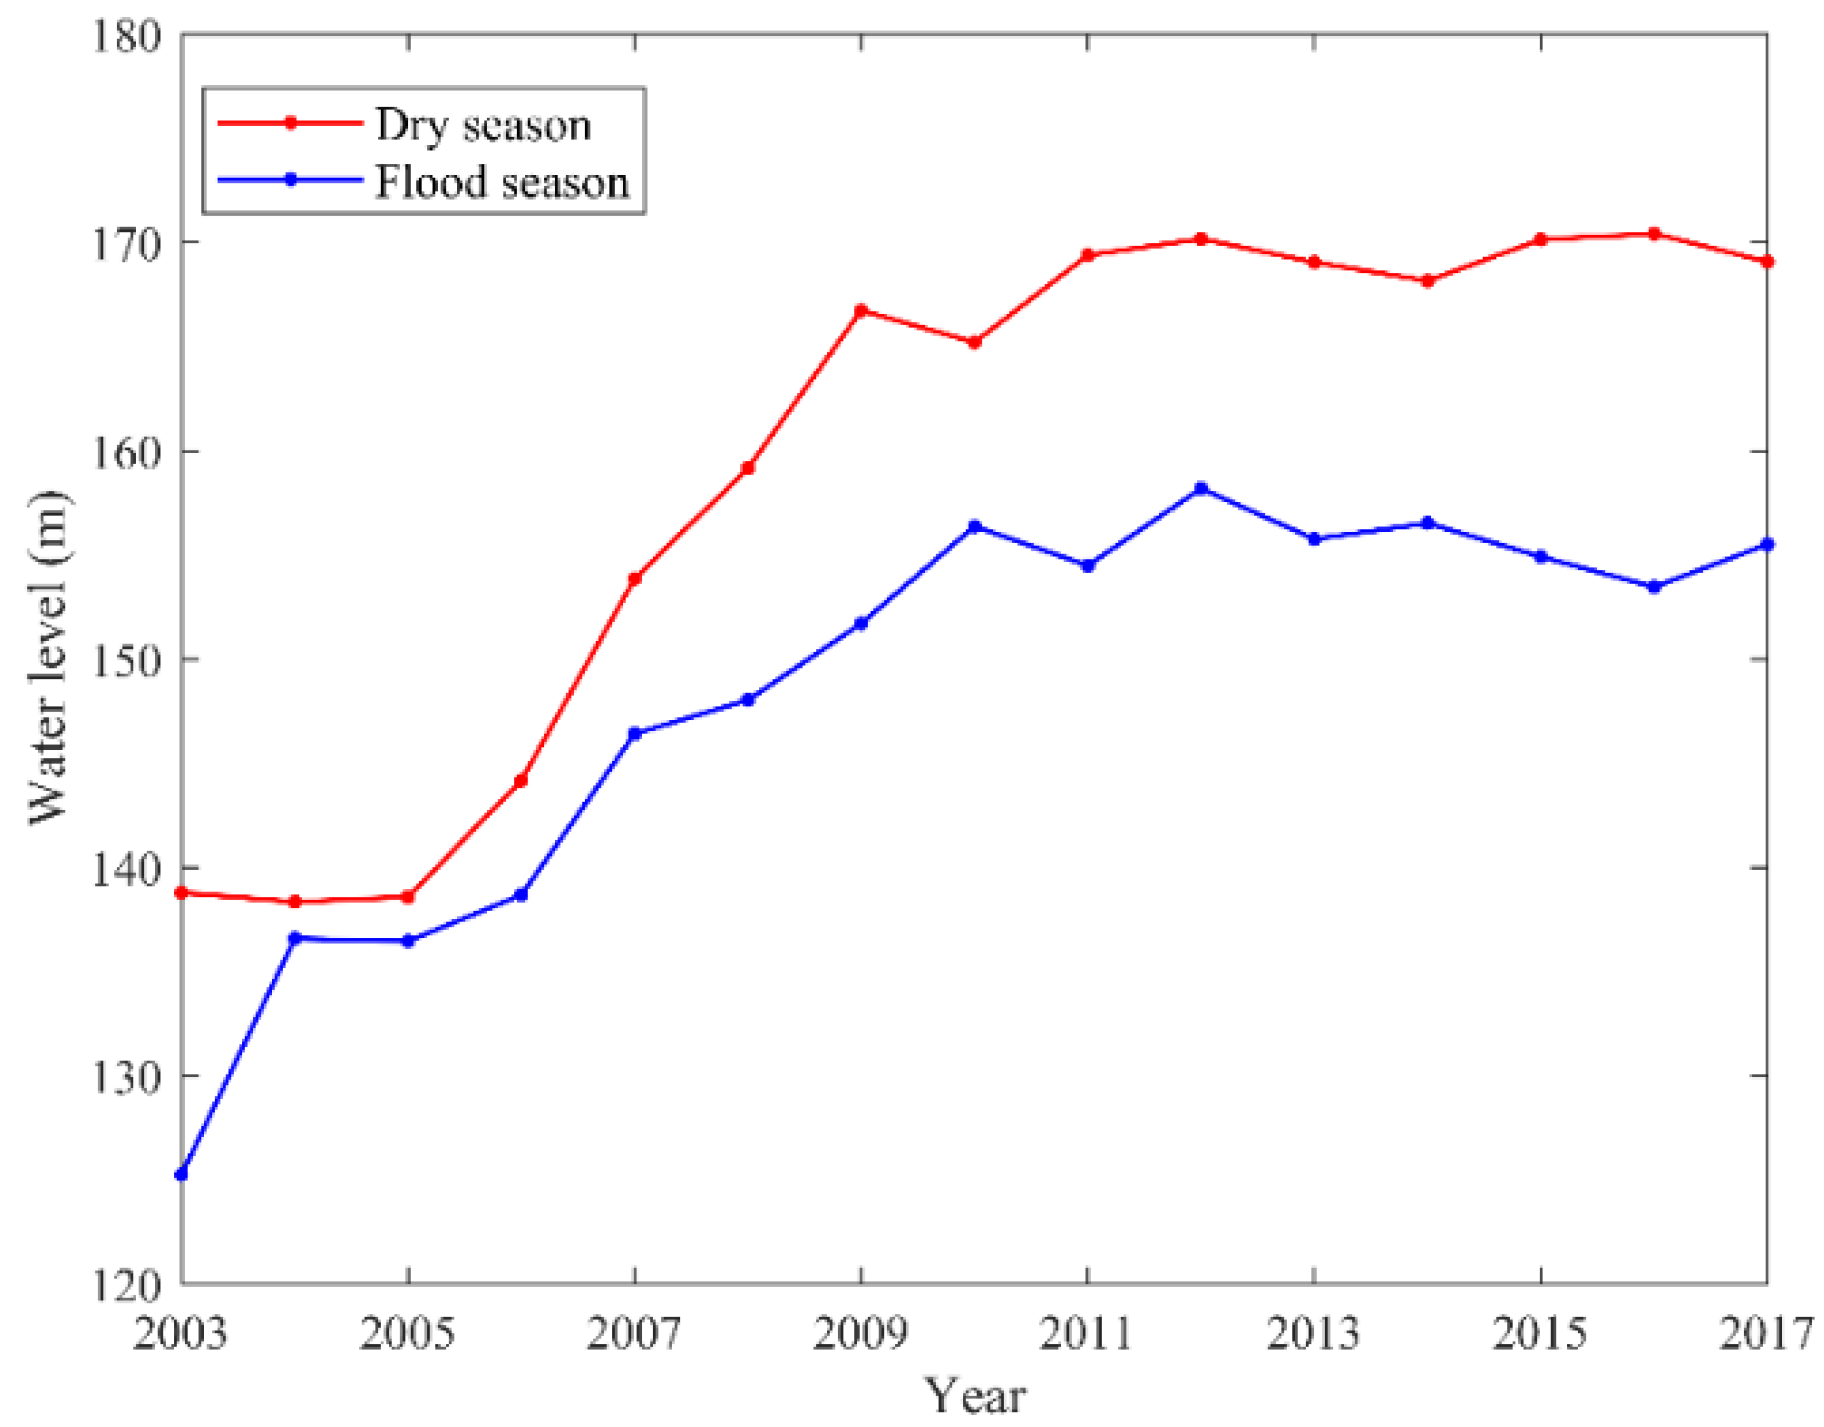
2.2.3. Water Level Data
3. Methods
3.1. Accuracy Evaluation of Precipitation Datasets
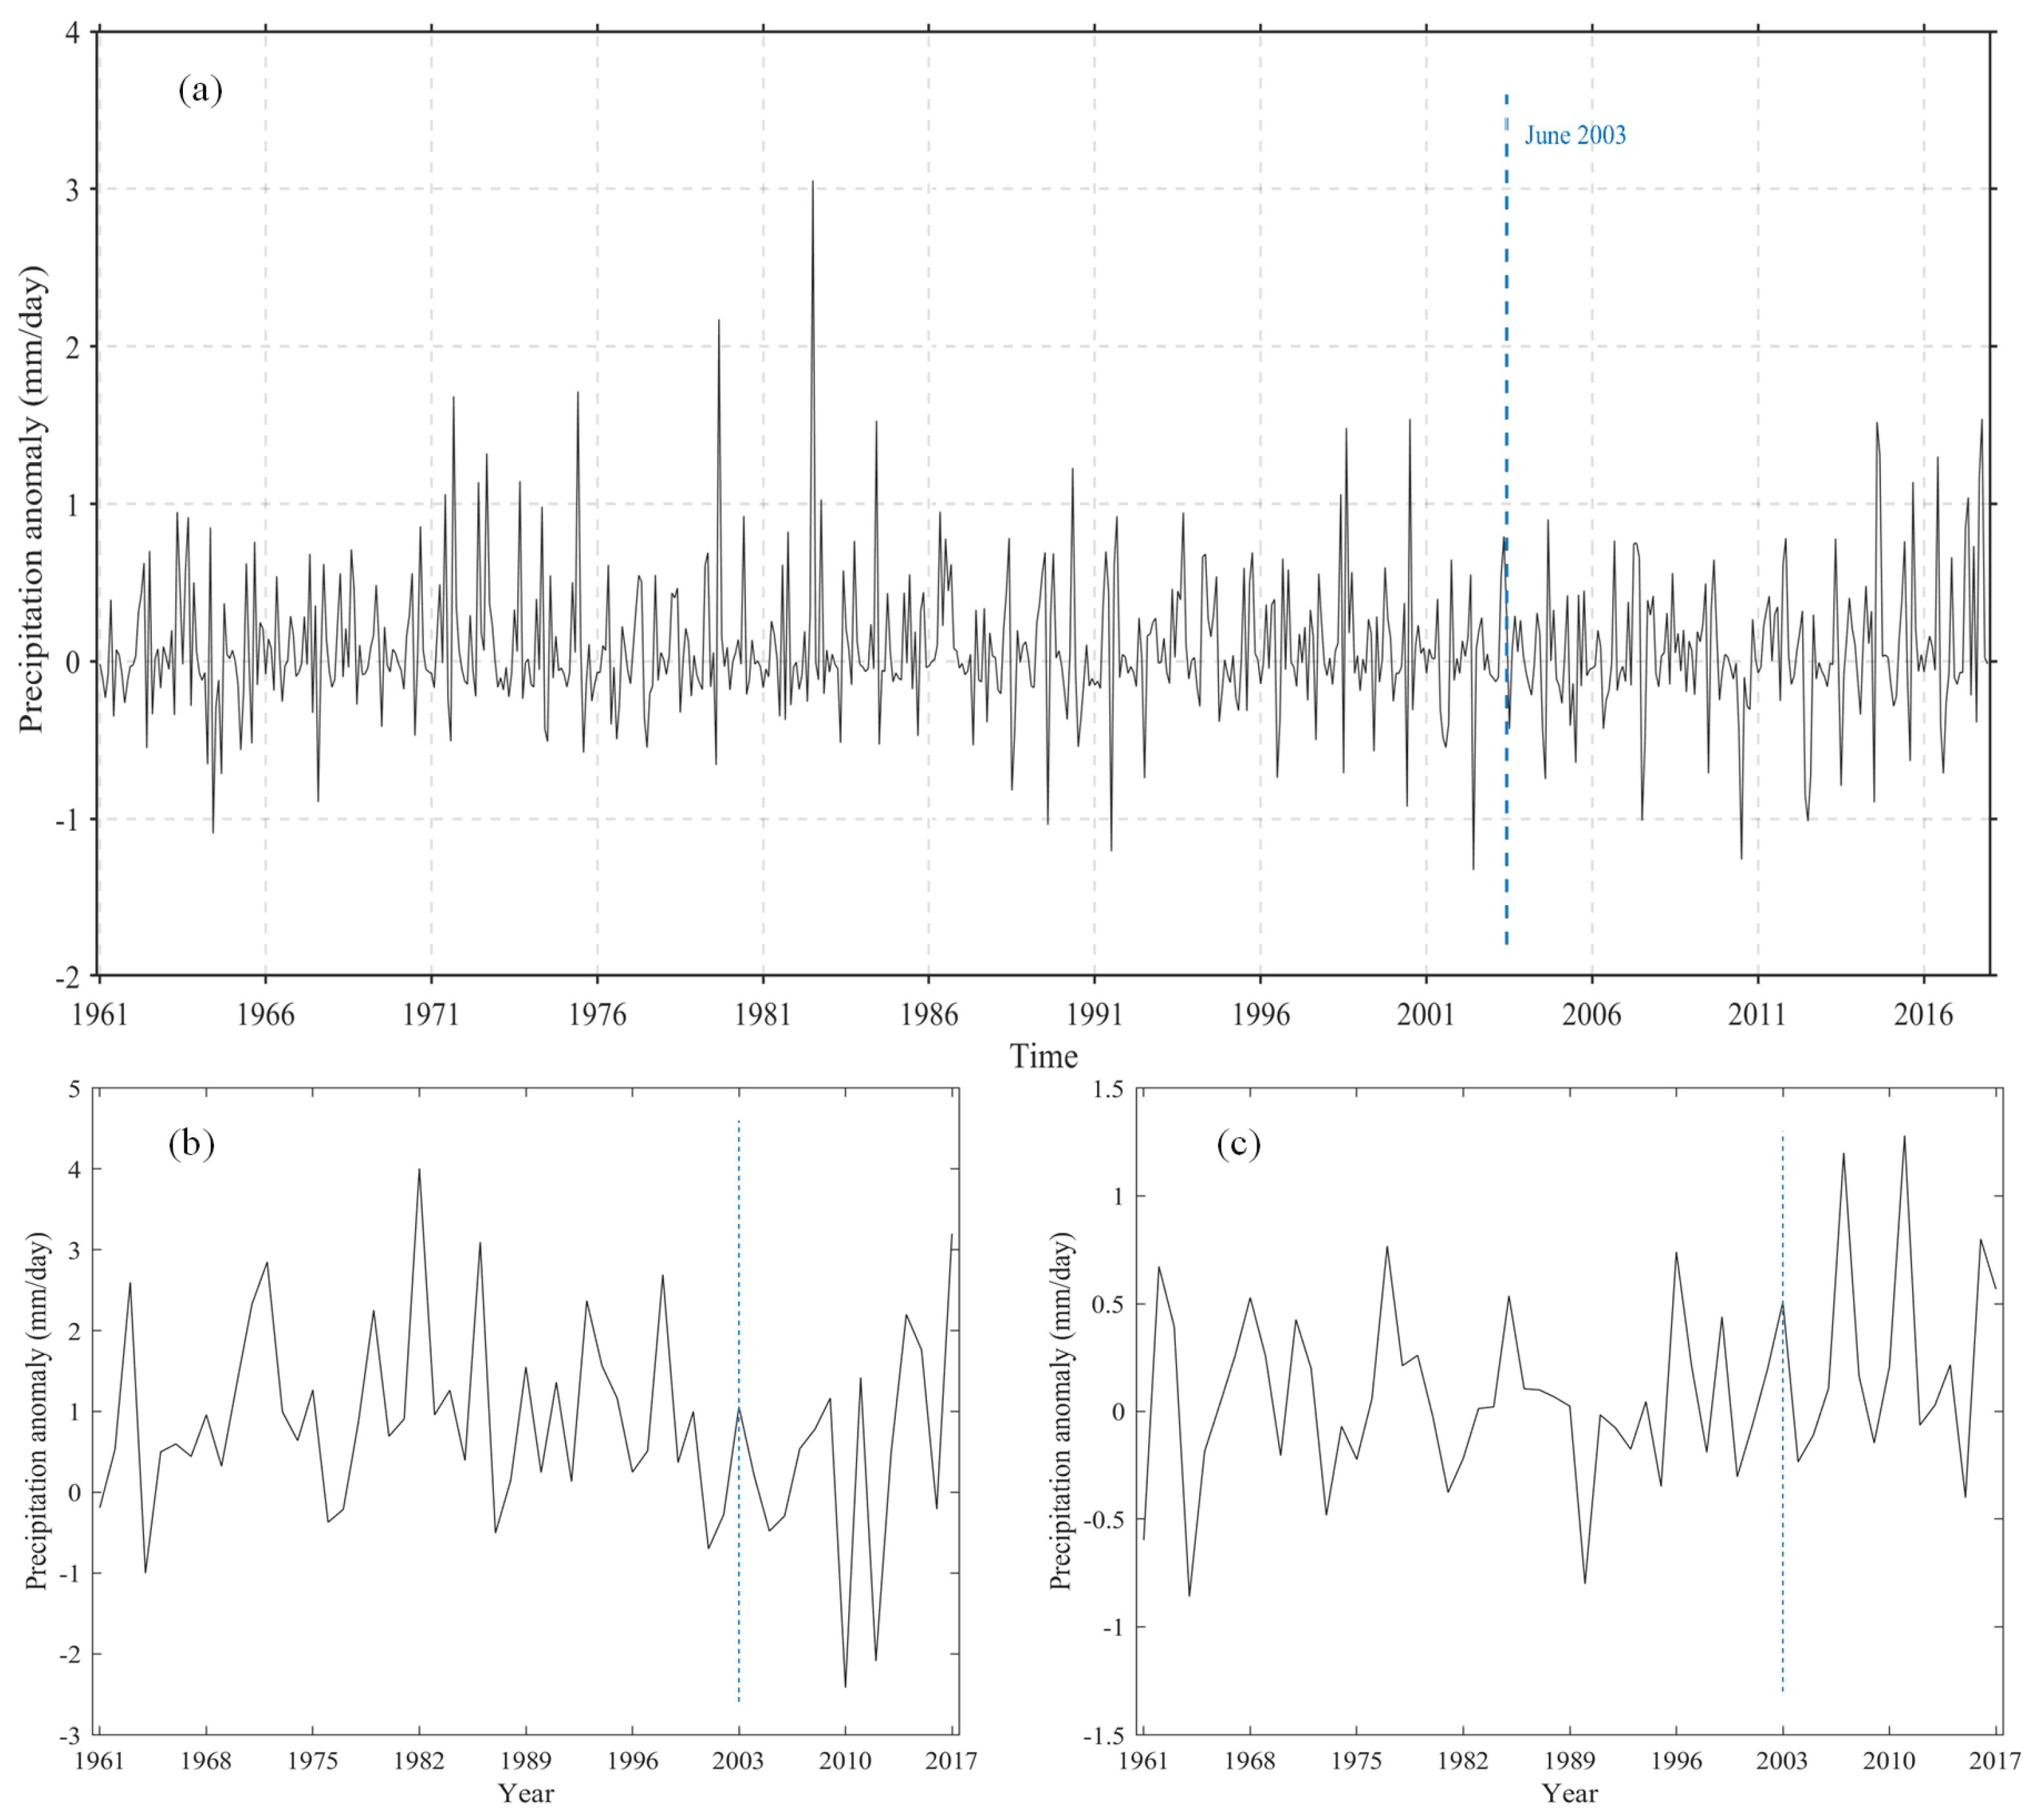
3.2. Precipitation Anomaly and Spatial Trend before and after the Impoundment
3.3. Concentrated Characteristics of Precipitation
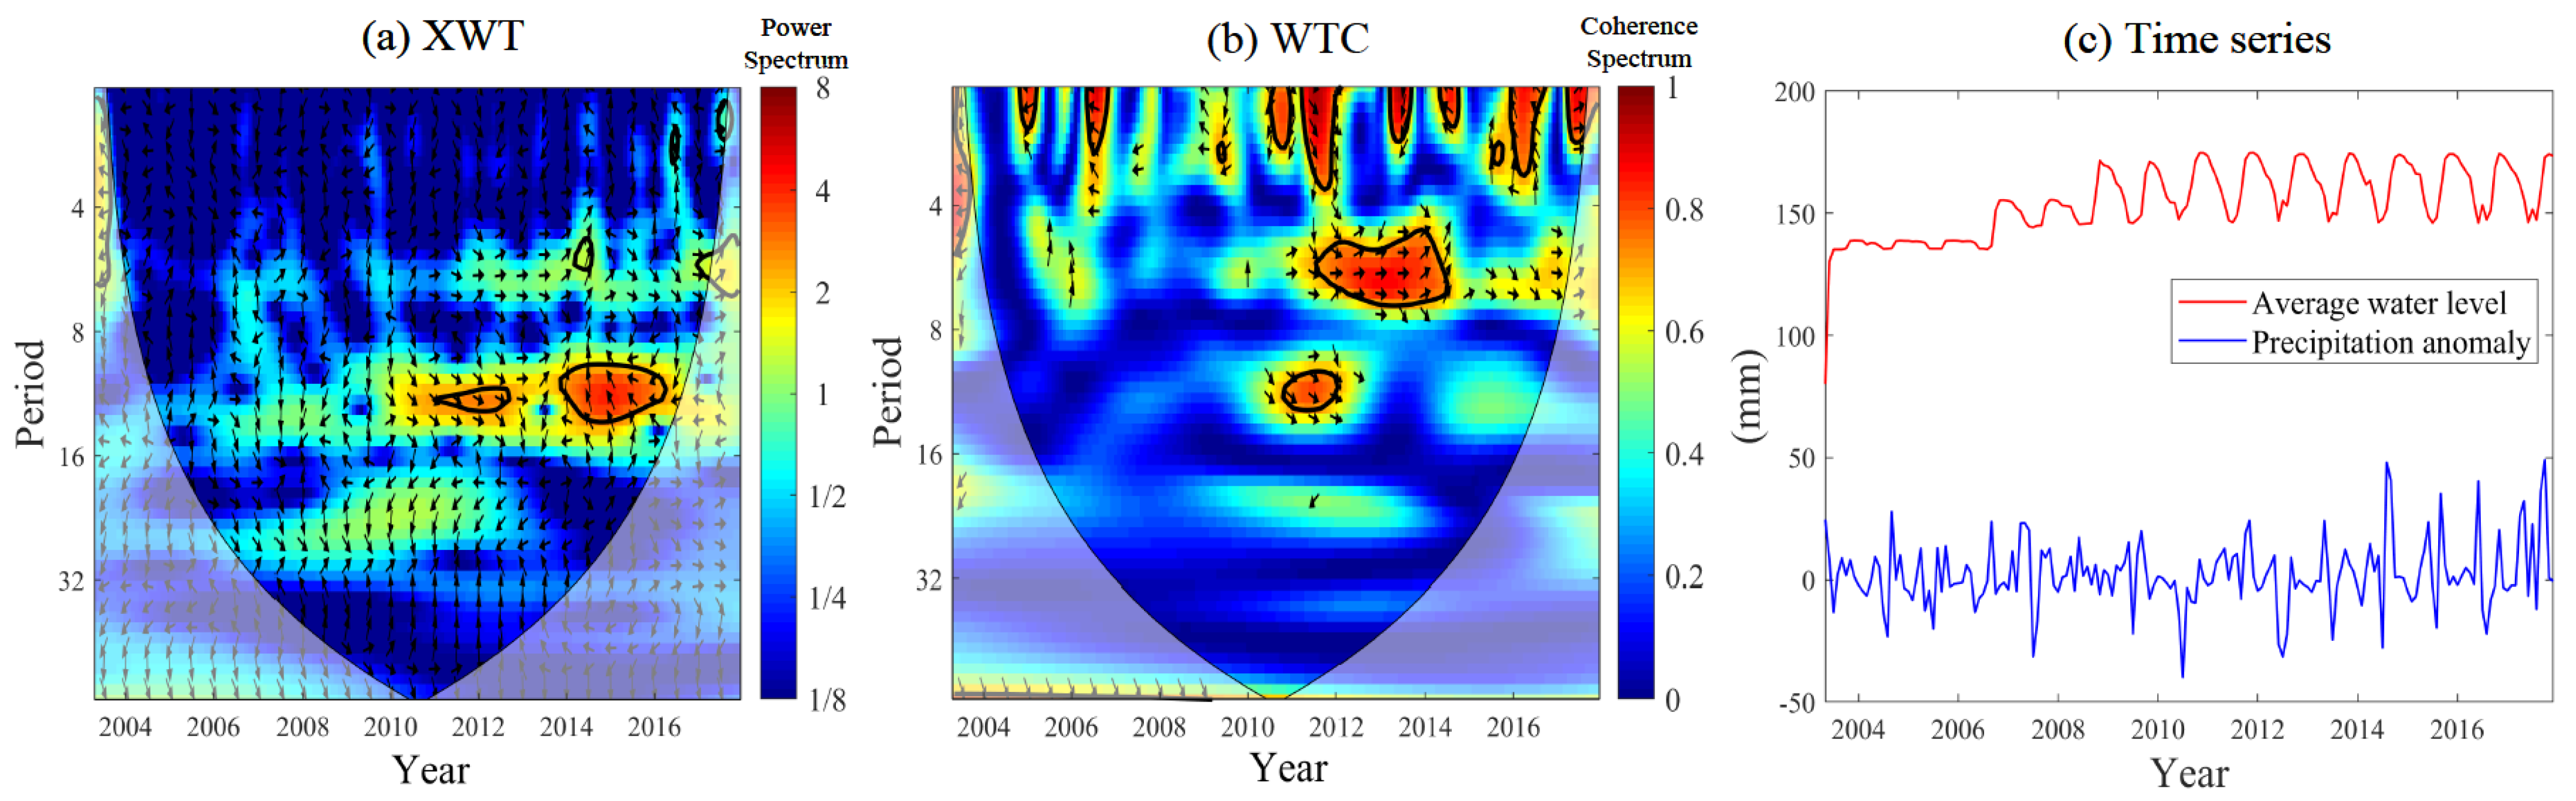
3.4. Cross-Wavelet Transform (CWT) Analysis
4. Results
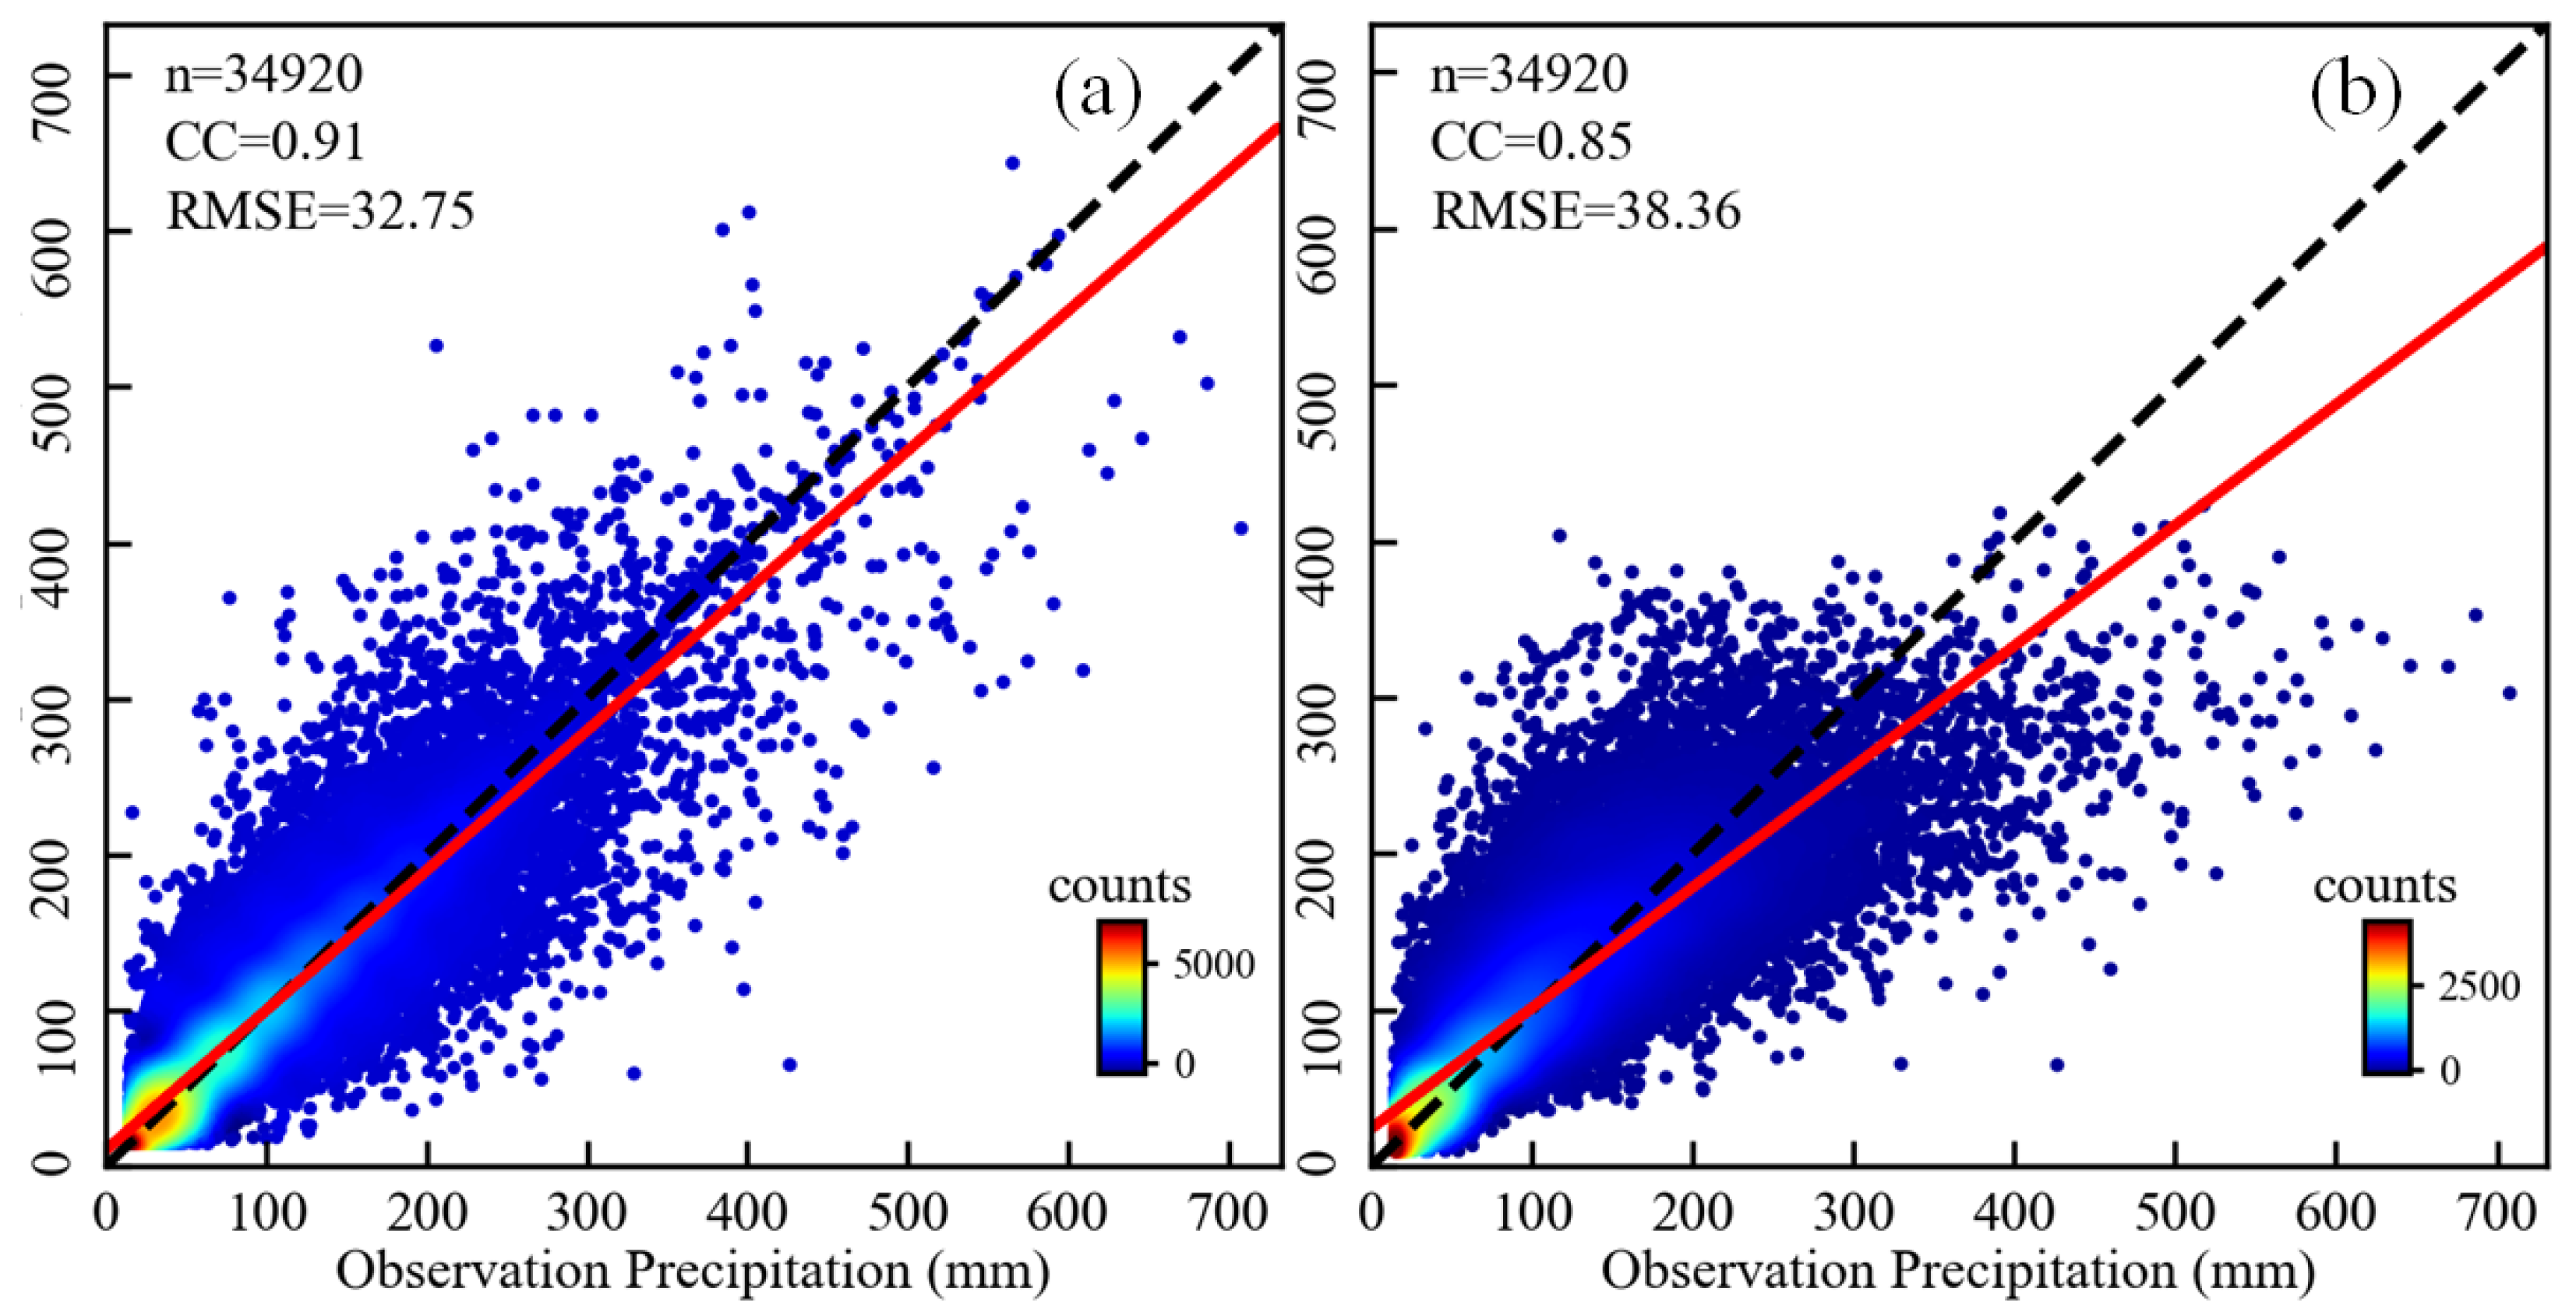
4.1. Accuracy of CN05.1 Dataset in the Three Gorges Reservoir Area (TGRA)
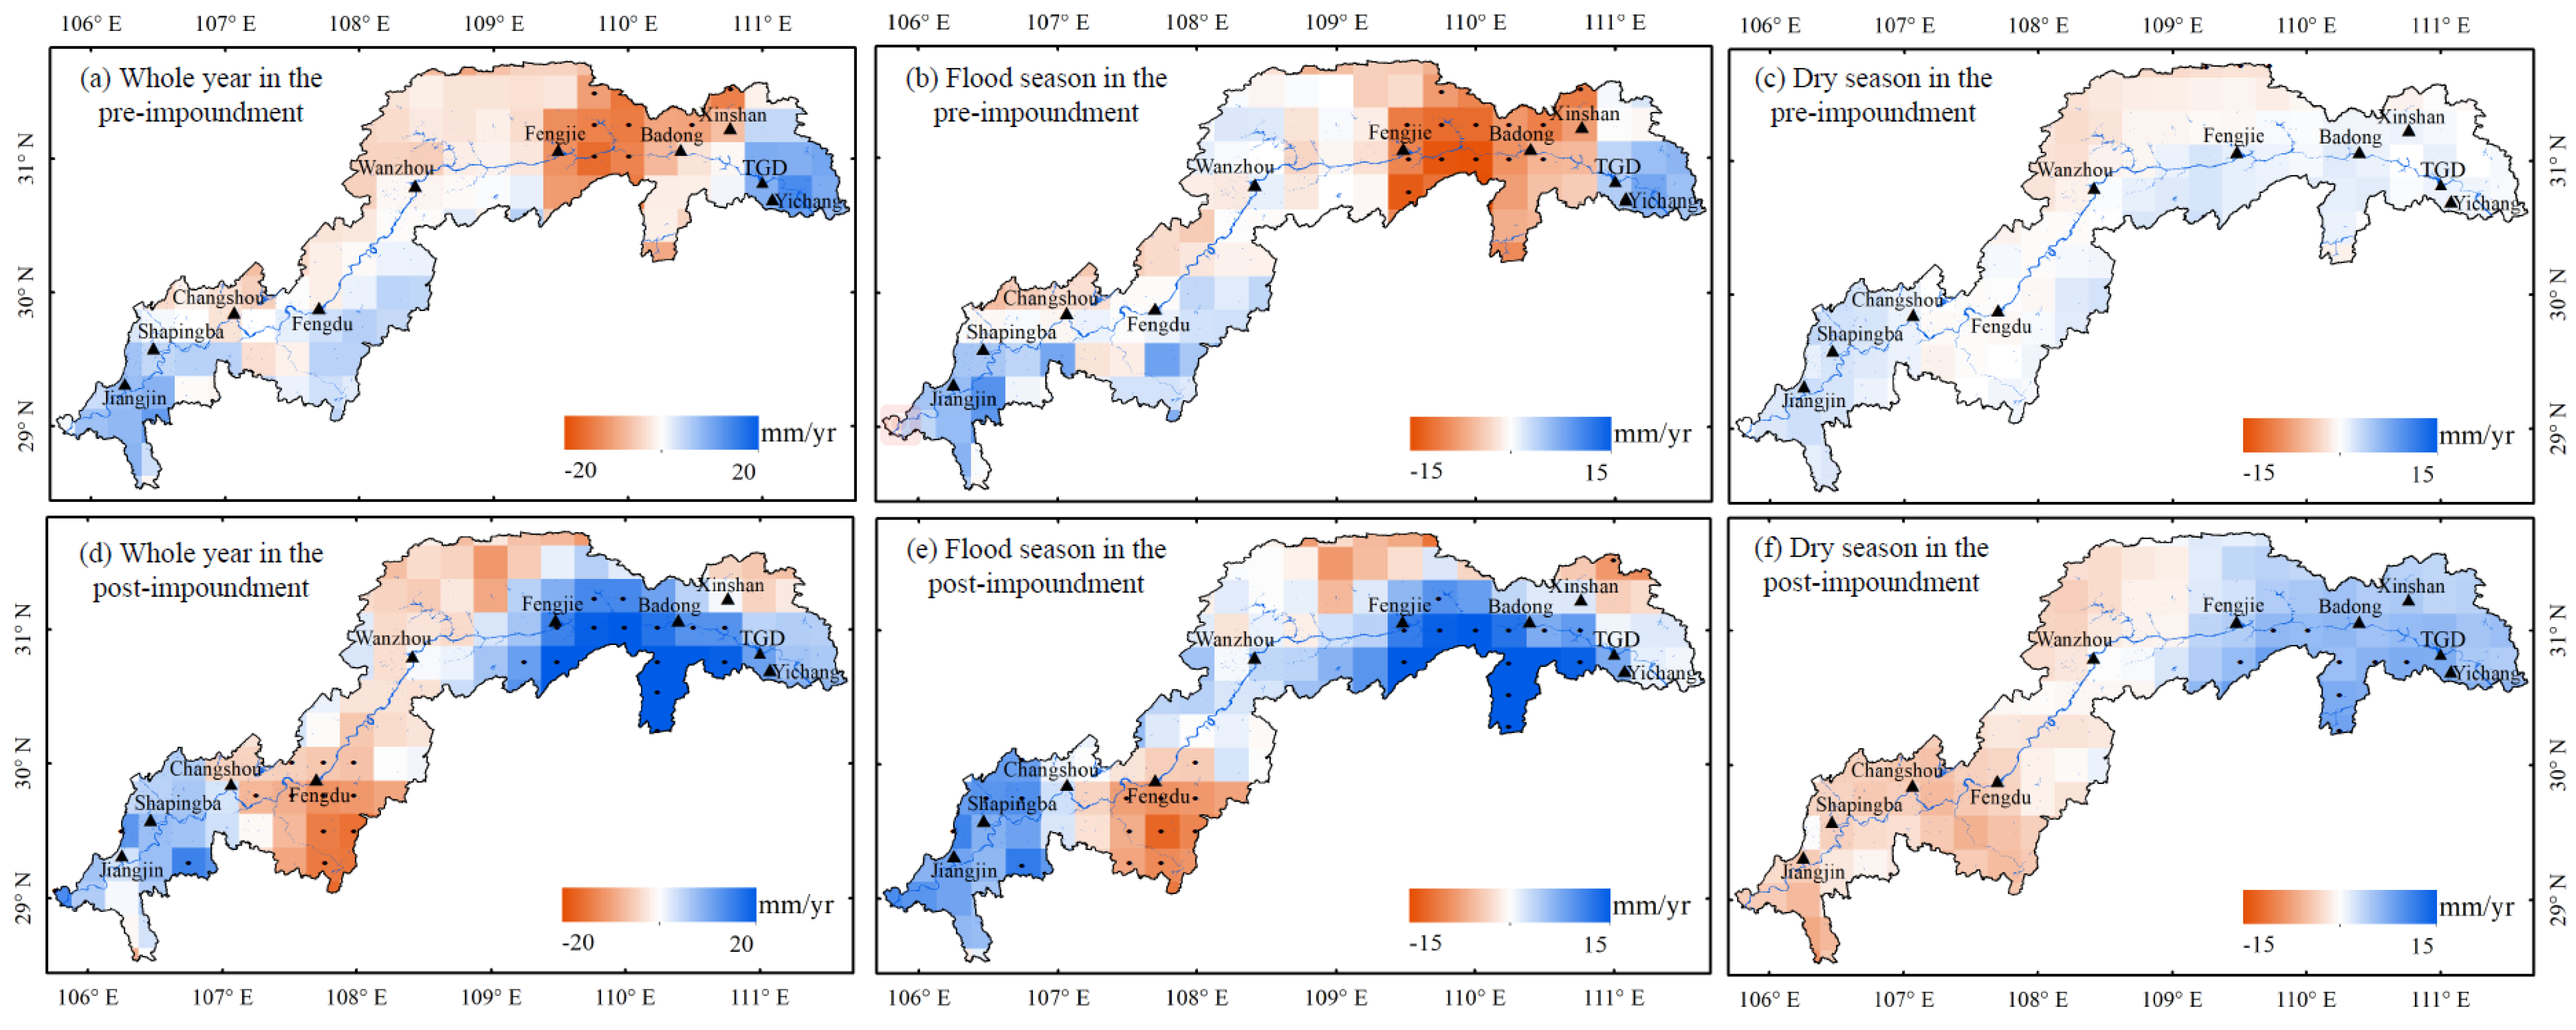
4.2. Analysis on the Variation of Precipitation Anomaly and Its Spatial Trend
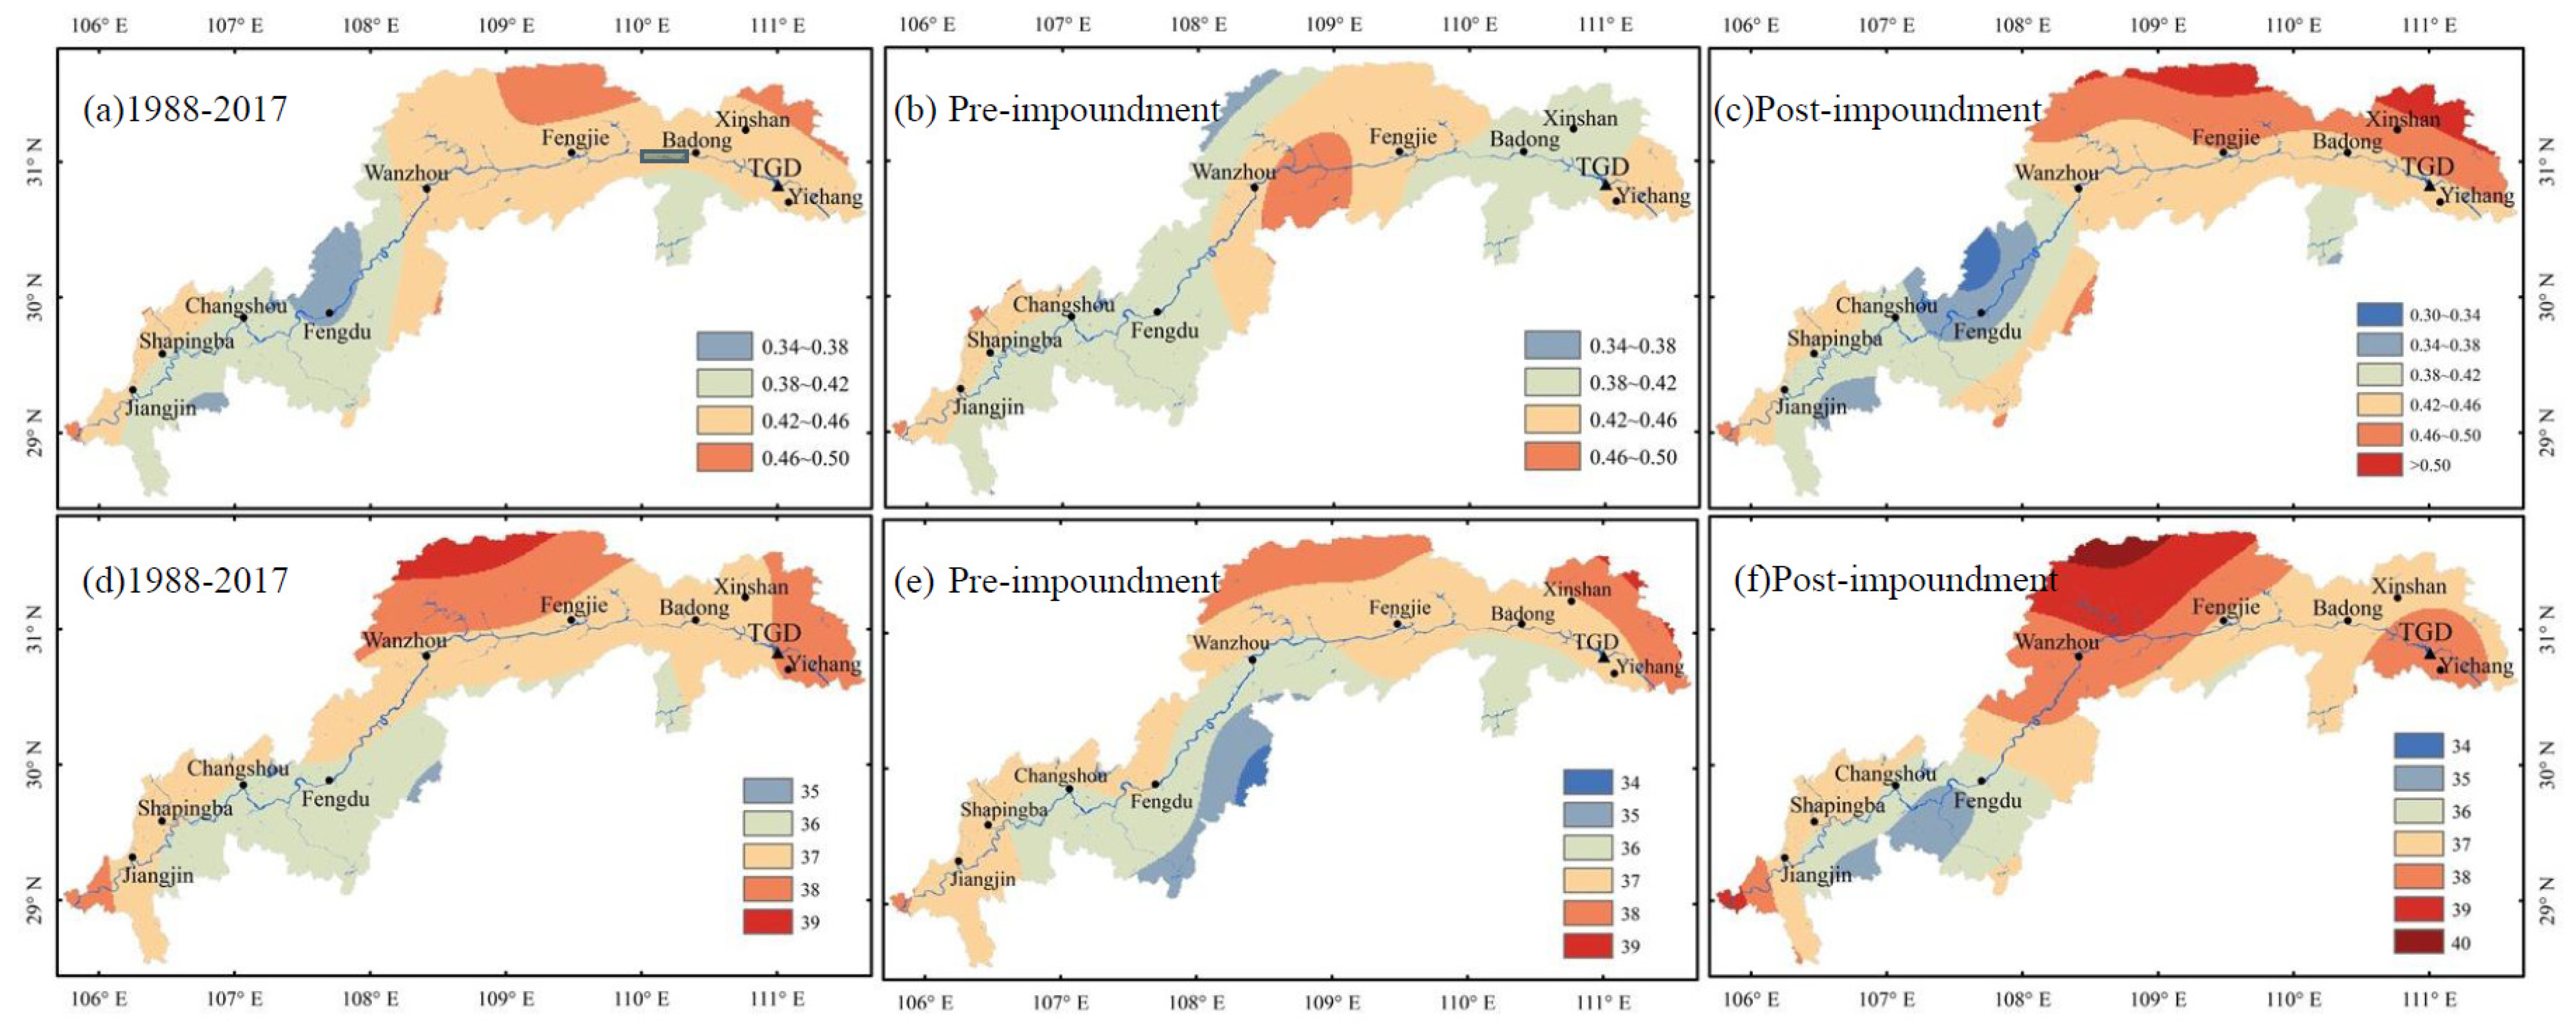
4.3. Variation of Precipitation Concentration Degree (PCD) and Precipitation Concentration Period (PCP) in the TGRA
4.3.1. Time-Series Variation of PCD and PCP
4.3.2. Spatial Pattern of PCD and PCP in the TGRA
4.4. Relationship between Precipitation Anomaly and Water Level
5. Discussion
5.1. Variation Characteristics of Precipitation in the TGRA
5.2. Comparison with Existing Studies
6. Conclusions
Author Contributions
Funding
Institutional Review Board Statement
Informed Consent Statement
Data Availability Statement
Acknowledgments
Conflicts of Interest
Appendix A. Comparison of Precipitation Forcing Data

| CC | RMSE | |||
|---|---|---|---|---|
| Time | Peng et al. (2019) dataset | CMFD | Peng et al. (2019) dataset | CMFD |
| January | 0.77 | 0.66 | 9.29 | 14.15 |
| February | 0.88 | 0.83 | 10.96 | 14.03 |
| March | 0.74 | 0.77 | 17.51 | 19.91 |
| April | 0.75 | 0.87 | 31.84 | 24.08 |
| May | 0.69 | 0.82 | 42.17 | 34.80 |
| June | 0.60 | 0.82 | 64.23 | 47.99 |
| July | 0.63 | 0.82 | 80.90 | 60.54 |
| August | 0.68 | 0.81 | 64.94 | 52.97 |
| September | 0.75 | 0.86 | 51.03 | 36.75 |
| October | 0.77 | 0.84 | 27.22 | 24.15 |
| November | 0.80 | 0.84 | 19.92 | 18.89 |
| December | 0.77 | 0.67 | 8.86 | 12.36 |

References
- Woldemichael, A.T.; Hossain, F.; Pielke, R.S.; Beltran-Przekurat, A. Understanding the impact of dam-triggered land use/land cover change on the modification of extreme precipitation. Water Resour. Res. 2012, 48, W09547. [Google Scholar] [CrossRef] [Green Version]
- Niyogi, D.; Kishtawal, C.; Tripathi, S.; Govindaraju, R.S. Observational evidence that agricultural intensification and land use change may be reducing the Indian summer monsoon rainfall. Water Resour. Res. 2010, 46, W03533. [Google Scholar] [CrossRef] [Green Version]
- Hossain, F. Empirical Relationship between Large Dams and the Alteration in Extreme Precipitation. Nat. Hazards Rev. 2010, 11, 97–101. [Google Scholar] [CrossRef]
- Degu, A.M.; Hossain, F.; Niyogi, D.; Pielke, R.S.; Shepherd, J.M.; Voisin, N.; Chronis, T. The influence of large dams on surrounding climate and precipitation patterns. Geophys. Res. Lett. 2011, 38, L04405. [Google Scholar] [CrossRef]
- Zheng, L.; Xu, J.; Tan, Z.; Xu, G.; Xu, L.; Wang, X. A thirty-year Landsat study reveals changes to a river-lake junction ecosystem after implementation of the three Gorges dam. J. Hydrol. 2020, 589, 125185. [Google Scholar] [CrossRef]
- Beatty, S.; Allen, M.; Lymbery, A.; Jordaan, M.S.; Morgan, D.; Impson, D.; Marr, S.; Ebner, B.; Weyl, O.L.F. Rethinking refuges: Implications of climate change for dam busting. Biol. Conserv. 2017, 209, 188–195. [Google Scholar] [CrossRef] [Green Version]
- Li, B.; Chen, N.; Wang, W.; Wang, C.; Schmitt, R.J.P.; Lin, A.; Daily, G.C. Eco-environmental impacts of dams in the Yangtze River Basin, China. Sci. Total Environ. 2021, 774, 145743. [Google Scholar] [CrossRef]
- Li, Y.; Wu, L.; Chen, X.; Zhou, W. Impacts of Three Gorges Dam on Regional Circulation: A Numerical Simulation. J. Geophys. Res. Atmos. 2019, 124, 7813–7824. [Google Scholar] [CrossRef]
- Li, Y.; Zhou, W.; Chen, X.; Fang, D.; Zhang, Q. Influences of the Three Gorges Dam in China on Precipitation over Surrounding Regions. J. Meteorol. Res. 2017, 31, 767–773. [Google Scholar] [CrossRef]
- Wu, J.; Gao, X.; Giorgi, F.; Chen, Z.; Yu, D. Climate effects of the Three Gorges Reservoir as simulated by a high resolution double nested regional climate model. Quatern Int. 2012, 282, 27–36. [Google Scholar] [CrossRef] [Green Version]
- Xiao, C.; Yu, R.; Fu, Y. Precipitation characteristics in the Three Gorges Dam vicinity. Int. J. Climatol. 2010, 30, 2021–2024. [Google Scholar] [CrossRef]
- Miller, N.L.; Jin, J.M.; Tsang, C.F. Local climate sensitivity of the Three Gorges Dam. Geophys. Res. Lett. 2005, 32, L1670416. [Google Scholar] [CrossRef] [Green Version]
- Lü, M.; Jiang, Y.; Chen, X.; Chen, J.; Wu, S.; Liu, J. Spatiotemporal Variations of Extreme Precipitation under a Changing Climate in the Three Gorges Reservoir Area (TGRA). Atmosphere 2018, 9, 24. [Google Scholar] [CrossRef] [Green Version]
- Wu, L.; Zhang, Q.; Jiang, Z. Three Gorges Dam affects regional precipitation. Geophys. Res. Lett. 2006, 33, 13. [Google Scholar] [CrossRef] [Green Version]
- Fang, Z.; Hang, D.; Xinyi, Z. Rainfall regime in Three Gorges area in China and the control factors. Int. J. Climatol. 2010, 30, 1396–1406. [Google Scholar] [CrossRef]
- Zhang, Y.; Hong, Y.; Wang, X.; Gourley, J.J.; Xue, X.; Saharia, M.; Ni, G.; Wang, G.; Huang, Y.; Chen, S.; et al. Hydrometeorological Analysis and Remote Sensing of Extremes: Was the July 2012 Beijing Flood Event Detectable and Predictable by Global Satellite Observing and Global Weather Modeling Systems? J. HydroMeteorol. 2015, 16, 381–395. [Google Scholar] [CrossRef]
- Manz, B.; Buytaert, W.; Zulkafli, Z.; Lavado, W.; Willems, B.; Alberto Robles, L.; Rodriguez-Sanchez, J. High-resolution satellite-gauge merged precipitation climatologies of the Tropical Andes. J. Geophys. Res. Atmos. 2016, 121, 1190–1207. [Google Scholar] [CrossRef] [Green Version]
- Zhong, Y.; Zhong, M.; Mao, Y.; Ji, B. Evaluation of Evapotranspiration for Exorheic Catchments of China during the GRACE Era: From a Water Balance Perspective. Remote Sens. 2020, 12, 511. [Google Scholar] [CrossRef] [Green Version]
- Wang, Z.; Zhong, R.; Lai, C.; Chen, J. Evaluation of the GPM IMERG satellite-based precipitation products and the hydrological utility. Atmos. Res. 2017, 196, 151–163. [Google Scholar] [CrossRef]
- Wang, J.; Chen, H.; Xu, C.; Zeng, Q.; Wang, Q.; Kim, J.; Chen, J.; Guo, S. Tracking the error sources of spatiotemporal differences in TRMM accuracy using error decomposition method. Hydrol. Res. 2018, 49, 1960–1976. [Google Scholar] [CrossRef]
- Li, J.S.; Wang, A.S.; Chen, J.T. Spatial-temporal variation of precipitation leads to the serious flood and drought in Yangtze River Valley. Disaster Reduct. China 2000, 9, 27–40. (In Chinese) [Google Scholar]
- Zhang, L.; Qian, Y. Annual distribution features of precipitation in China and their interannual variations. Acta Meteorol. Sin. 2003, 17, 146–163. [Google Scholar]
- Li, X.; Jiang, F.; Li, L.; Wang, G. Spatial and temporal variability of precipitation concentration index, concentration degree and concentration period in Xinjiang, China. Int. J. Climatol. 2011, 31, 1679–1693. [Google Scholar] [CrossRef]
- Abolverdi, J.; Ferdosifar, G.; Khalili, D.; Kamgar-Haghighi, A.A. Spatial and temporal changes of precipitation concentration in Fars province, southwestern Iran. Meteorol. Atmos. Phys. 2016, 128, 181–196. [Google Scholar] [CrossRef]
- Yesilirmak, E.; Atatanir, L. Spatiotemporal variability of precipitation concentration in western Turkey. Nat. Hazards 2016, 81, 687–704. [Google Scholar] [CrossRef]
- Zhao, T.B.; Fu, C.B.; Ke, Z.J.; Guo, W. Global Atmosphere Reanalysis Datasets: Current Status and Recent Advances. Adv. Earth Sci. 2010, 25, 242–254. [Google Scholar]
- Sun, B.; Wang, H. A trend towards a stable warm and windless state of the surface weather conditions in northern and northeastern China during 1961-2014. Adv. Atmos. Sci. 2017, 34, 713–726. [Google Scholar] [CrossRef]
- Beck, H.E.; van Dijk, A.I.J.M.; Levizzani, V.; Schellekens, J.; Miralles, D.G.; Martens, B.; de Roo, A. MSWEP: 3-hourly 0.25 degrees global gridded precipitation (1979–2015) by merging gauge, satellite, and reanalysis data. Hydrol. Earth Syst. Sc. 2017, 21, 589–615. [Google Scholar] [CrossRef] [Green Version]
- Singh, V.; Qin, X. Data assimilation for constructing long-term gridded daily rainfall time series over Southeast Asia. Clim. Dynam. 2019, 53, 3289–3313. [Google Scholar] [CrossRef]
- Miao, Y.; Wang, A. A daily 0.25° × 0.25° hydrologically based land surface flux dataset for conterminous China, 1961–2017. J. Hydrol. 2020, 590, 125413. [Google Scholar] [CrossRef]
- Wu, J.; Gao, X. A gridded daily observation dataset over China region and comparison with the other datasets. Chin. J. Geophys. 2013, 56, 1102–1111. [Google Scholar]
- Yang, F.; Lu, H.; Yang, K.; He, J.; Wang, W.; Wright, J.S.; Li, C.; Han, M.; Li, Y. Evaluation of multiple forcing data sets for precipitation and shortwave radiation over major land areas of China. Hydrol. Earth Syst. Sc. 2017, 21, 5805–5821. [Google Scholar] [CrossRef] [Green Version]
- Song, Z.; Liang, S.; Feng, L.; He, T.; Song, X.; Zhang, L. Temperature changes in Three Gorges Reservoir Area and linkage with Three Gorges Project. J. Geophys. Res. Atmos. 2017, 122, 4866–4879. [Google Scholar] [CrossRef]
- Stawowy, M.; Olchowik, W.; Rosiński, A.; Dąbrowski, T. The Analysis and Modelling of the Quality of Information Acquired from Weather Station Sensors. Remote Sens. 2021, 13, 693. [Google Scholar] [CrossRef]
- Kuo, P.; Huang, T.; Putra, I.G.B. Comparing Kriging Estimators Using Weather Station Data and Local Greenhouse Sensors. Sensors 2021, 21, 1853. [Google Scholar] [CrossRef] [PubMed]
- Zhang, X.; Tang, Q.; Pan, M.; Tang, Y. A Long-Term Land Surface Hydrologic Fluxes and States Dataset for China. J. HydroMeteorol. 2014, 15, 2067–2084. [Google Scholar] [CrossRef]
- Zeng, Z.; Mao, F.; Wang, Z.; Guo, J.; Gui, K.; An, J.; Yim, S.H.L.; Yang, Y.; Zhang, B.; Jiang, H. Preliminary Evaluation of the Atmospheric Infrared Sounder Water Vapor Over China Against High-Resolution Radiosonde Measurements. J. Geophys. Res. Atmos. 2019, 124, 3871–3888. [Google Scholar] [CrossRef]
- Trenberth, K.E.; Caron, J.M.; Stepaniak, D.P.; Worley, S. Evolution of El Nino-Southern Oscillation and global atmospheric surface temperatures. J. Geophys. Res. Atmos. 2002, 107, 4065D7–84065D. [Google Scholar] [CrossRef]
- Dai, A.; Fyfe, J.C.; Xie, S.; Dai, X. Decadal modulation of global surface temperature by internal climate variability. Nat. Clim. Chang. 2015, 5, 555. [Google Scholar] [CrossRef]
- Dong, B.; Dai, A. The influence of the Interdecadal Pacific Oscillation on Temperature and Precipitation over the Globe. Clim. Dynam. 2015, 45, 2667–2681. [Google Scholar] [CrossRef]
- Gemmer, M.; Jiang, T.; Su, B.; Kundzewicz, Z.W. Seasonal precipitation changes in the wet season and their influence on flood/drought hazards in the Yangtze River Basin, China. Quatern Int. 2008, 186, 12–21. [Google Scholar] [CrossRef]
- Dourado, C.D.S.; de Medeiros Oliveira, S.R.; Heuminski De Avila, A.M. Analysis of rainfall homogeneous areas in time series of precipitation in the State of Bahia, Brazil. Bragantia 2013, 72, 192–198. [Google Scholar] [CrossRef] [Green Version]
- Silva, B.K.N.; Lucio, P.S. Characterization of risk/exposure to climate extremes for the Brazilian Northeast-case study: Rio Grande do Norte. Theor. Appl. Climatol. 2015, 122, 59–67. [Google Scholar] [CrossRef]
- Chatterjee, S.; Khan, A.; Akbari, H.; Wang, Y. Monotonic trends in spatio-temporal distribution and concentration of monsoon precipitation (1901–2002), West Bengal, India. Atmos. Res. 2016, 182, 54–75. [Google Scholar] [CrossRef]
- Deng, S.; Chen, T.; Yang, N.; Qu, L.; Li, M.; Chen, D. Spatial and temporal distribution of rainfall and drought characteristics across the Pearl River basin. Sci. Total Environ. 2018, 619, 28–41. [Google Scholar] [CrossRef]
- Yang, P.; Zhang, Y.; Xia, J.; Sun, S. Investigation of precipitation concentration and trends and their potential drivers in the major river basins of Central Asia. Atmos. Res. 2020, 245, 105128. [Google Scholar] [CrossRef]
- Sun, L.; Cai, Y.; Yang, W.; Yi, Y.; Yang, Z. Climatic variations within the dry valleys in southwestern China and the influences of artificial reservoirs. Clim. Chang. 2019, 155, 111–125. [Google Scholar] [CrossRef]
- Grinsted, A.; Moore, J.C.; Jevrejeva, S. Application of the cross wavelet transform and wavelet coherence to geophysical time series. Nonlinear Proc. Geoph. 2004, 11, 561–566. [Google Scholar] [CrossRef]
- Gao, D.; Fang, C.Y. The Study on the Relationship of the Poyang Lake Water Level and the Water Area by Using MODIS Data from 2000 to 2012. Adv. Mater. Res. 2013, 726-731, 4636–4640. [Google Scholar] [CrossRef]
- Li, X.; Sha, J.; Wang, Z. Influence of the Three Gorges Reservoir on climate drought in the Yangtze River Basin. Environ. Sci. Pollut. R 2021, 28, 29755–29772. [Google Scholar] [CrossRef]
- Zhang, J.; Liu, Z.; Sun, X. Changing landscape in the Three Gorges Reservoir Area of Yangtze River from 1977 to 2005: Land use/land cover, vegetation cover changes estimated using multi-source satellite data. Int. J. Appl. Earth Obs. 2009, 11, 403–412. [Google Scholar] [CrossRef]
- Zhai, J.; Liu, R.; Liu, J.; Huang, L.; Qin, Y. Human-Induced Landcover Changes Drive a Diminution of Land Surface Albedo in the Loess Plateau (China). Remote Sens. 2015, 7, 2926–2941. [Google Scholar] [CrossRef] [Green Version]
- Peng, S.; Ding, Y.; Liu, W.; Li, Z. 1 km monthly temperature and precipitation dataset for China from 1901 to 2017. Earth Syst. Sci. Data 2019, 11, 1931–1946. [Google Scholar] [CrossRef] [Green Version]
- He, J.; Yang, K.; Tang, W.; Lu, H.; Qin, J.; Chen, Y.; Li, X. The first high-resolution meteorological forcing dataset for land process studies over China. Sci. Data 2020, 7, 1. [Google Scholar] [CrossRef] [Green Version]
- Ferreira, V.G.; Montecino, H.D.C.; Yakubu, C.I.; Heck, B. Uncertainties of the Gravity Recovery and Climate Experiment time-variable gravity-field solutions based on three-cornered hat method. J. Appl. Remote Sens 2016, 10, 015015. [Google Scholar] [CrossRef]
- Long, D.; Longuevergne, L.; Scanlon, B.R. Uncertainty in evapotranspiration from land surface modeling, remote sensing, and GRACE satellites. Water Resour. Res. 2014, 50, 1131–1151. [Google Scholar] [CrossRef] [Green Version]
- Xu, L.; Chen, N.; Moradkhani, H.; Zhang, X.; Hu, C. Improving Global Monthly and Daily Precipitation Estimation by Fusing Gauge Observations, Remote Sensing, and Reanalysis Data Sets. Water Resour. Res. 2020, 56, 3. [Google Scholar] [CrossRef]


| January | February | March | April | May | June | July | August | September | October | November | December | |
|---|---|---|---|---|---|---|---|---|---|---|---|---|
| CC | 0.89 | 0.94 | 0.89 | 0.91 | 0.86 | 0.85 | 0.86 | 0.86 | 0.90 | 0.91 | 0.93 | 0.90 |
| RMSE | 6.43 | 8.07 | 11.88 | 20.48 | 30.27 | 42.63 | 53.74 | 45.75 | 33.42 | 18.85 | 11.97 | 5.84 |
Publisher’s Note: MDPI stays neutral with regard to jurisdictional claims in published maps and institutional affiliations. |
© 2021 by the authors. Licensee MDPI, Basel, Switzerland. This article is an open access article distributed under the terms and conditions of the Creative Commons Attribution (CC BY) license (https://creativecommons.org/licenses/by/4.0/).
Share and Cite
Li, Q.; Liu, X.; Zhong, Y.; Wang, M.; Shi, M. Precipitation Changes in the Three Gorges Reservoir Area and the Relationship with Water Level Change. Sensors 2021, 21, 6110. https://doi.org/10.3390/s21186110
Li Q, Liu X, Zhong Y, Wang M, Shi M. Precipitation Changes in the Three Gorges Reservoir Area and the Relationship with Water Level Change. Sensors. 2021; 21(18):6110. https://doi.org/10.3390/s21186110
Chicago/Turabian StyleLi, Qin, Xiuguo Liu, Yulong Zhong, Mengmeng Wang, and Manxing Shi. 2021. "Precipitation Changes in the Three Gorges Reservoir Area and the Relationship with Water Level Change" Sensors 21, no. 18: 6110. https://doi.org/10.3390/s21186110