
A CSI-Based Indoor Positioning System Using Single UWB Ranging Correction


Abstract
:1. Introduction
- The proposed system is a fully automatic scheme, which means that the system can be used to localize position directly, and can work without any former preparation, e.g., manual measurement of the UWB anchor position and fingerprint location, etc. It only costs a short amount of time to initialize the whole system.
- To the best of our knowledge, this system is the first to use IMU measurements to correct UWB ranging. It highly expands the use of a UWB signal in an NLoS scenario and solves the localization problem in a harsh environment using ranging measurements.
- The proposed system can adapt to a dynamical environment properly, relying on the corrected UWB ranging feedback, and can provide a comparatively stable localization result over the long term.
- Using corrected UWB ranging measures can reduce the amount of CNN training (fingerprint database updating). Moreover, the position of the used UWB anchor can be ignored in this system (only ranging measurements are needed).
2. Related Work
2.1. Machine-Based Localization
2.2. UWB Fusion Localization
3. Proposed Fusion System
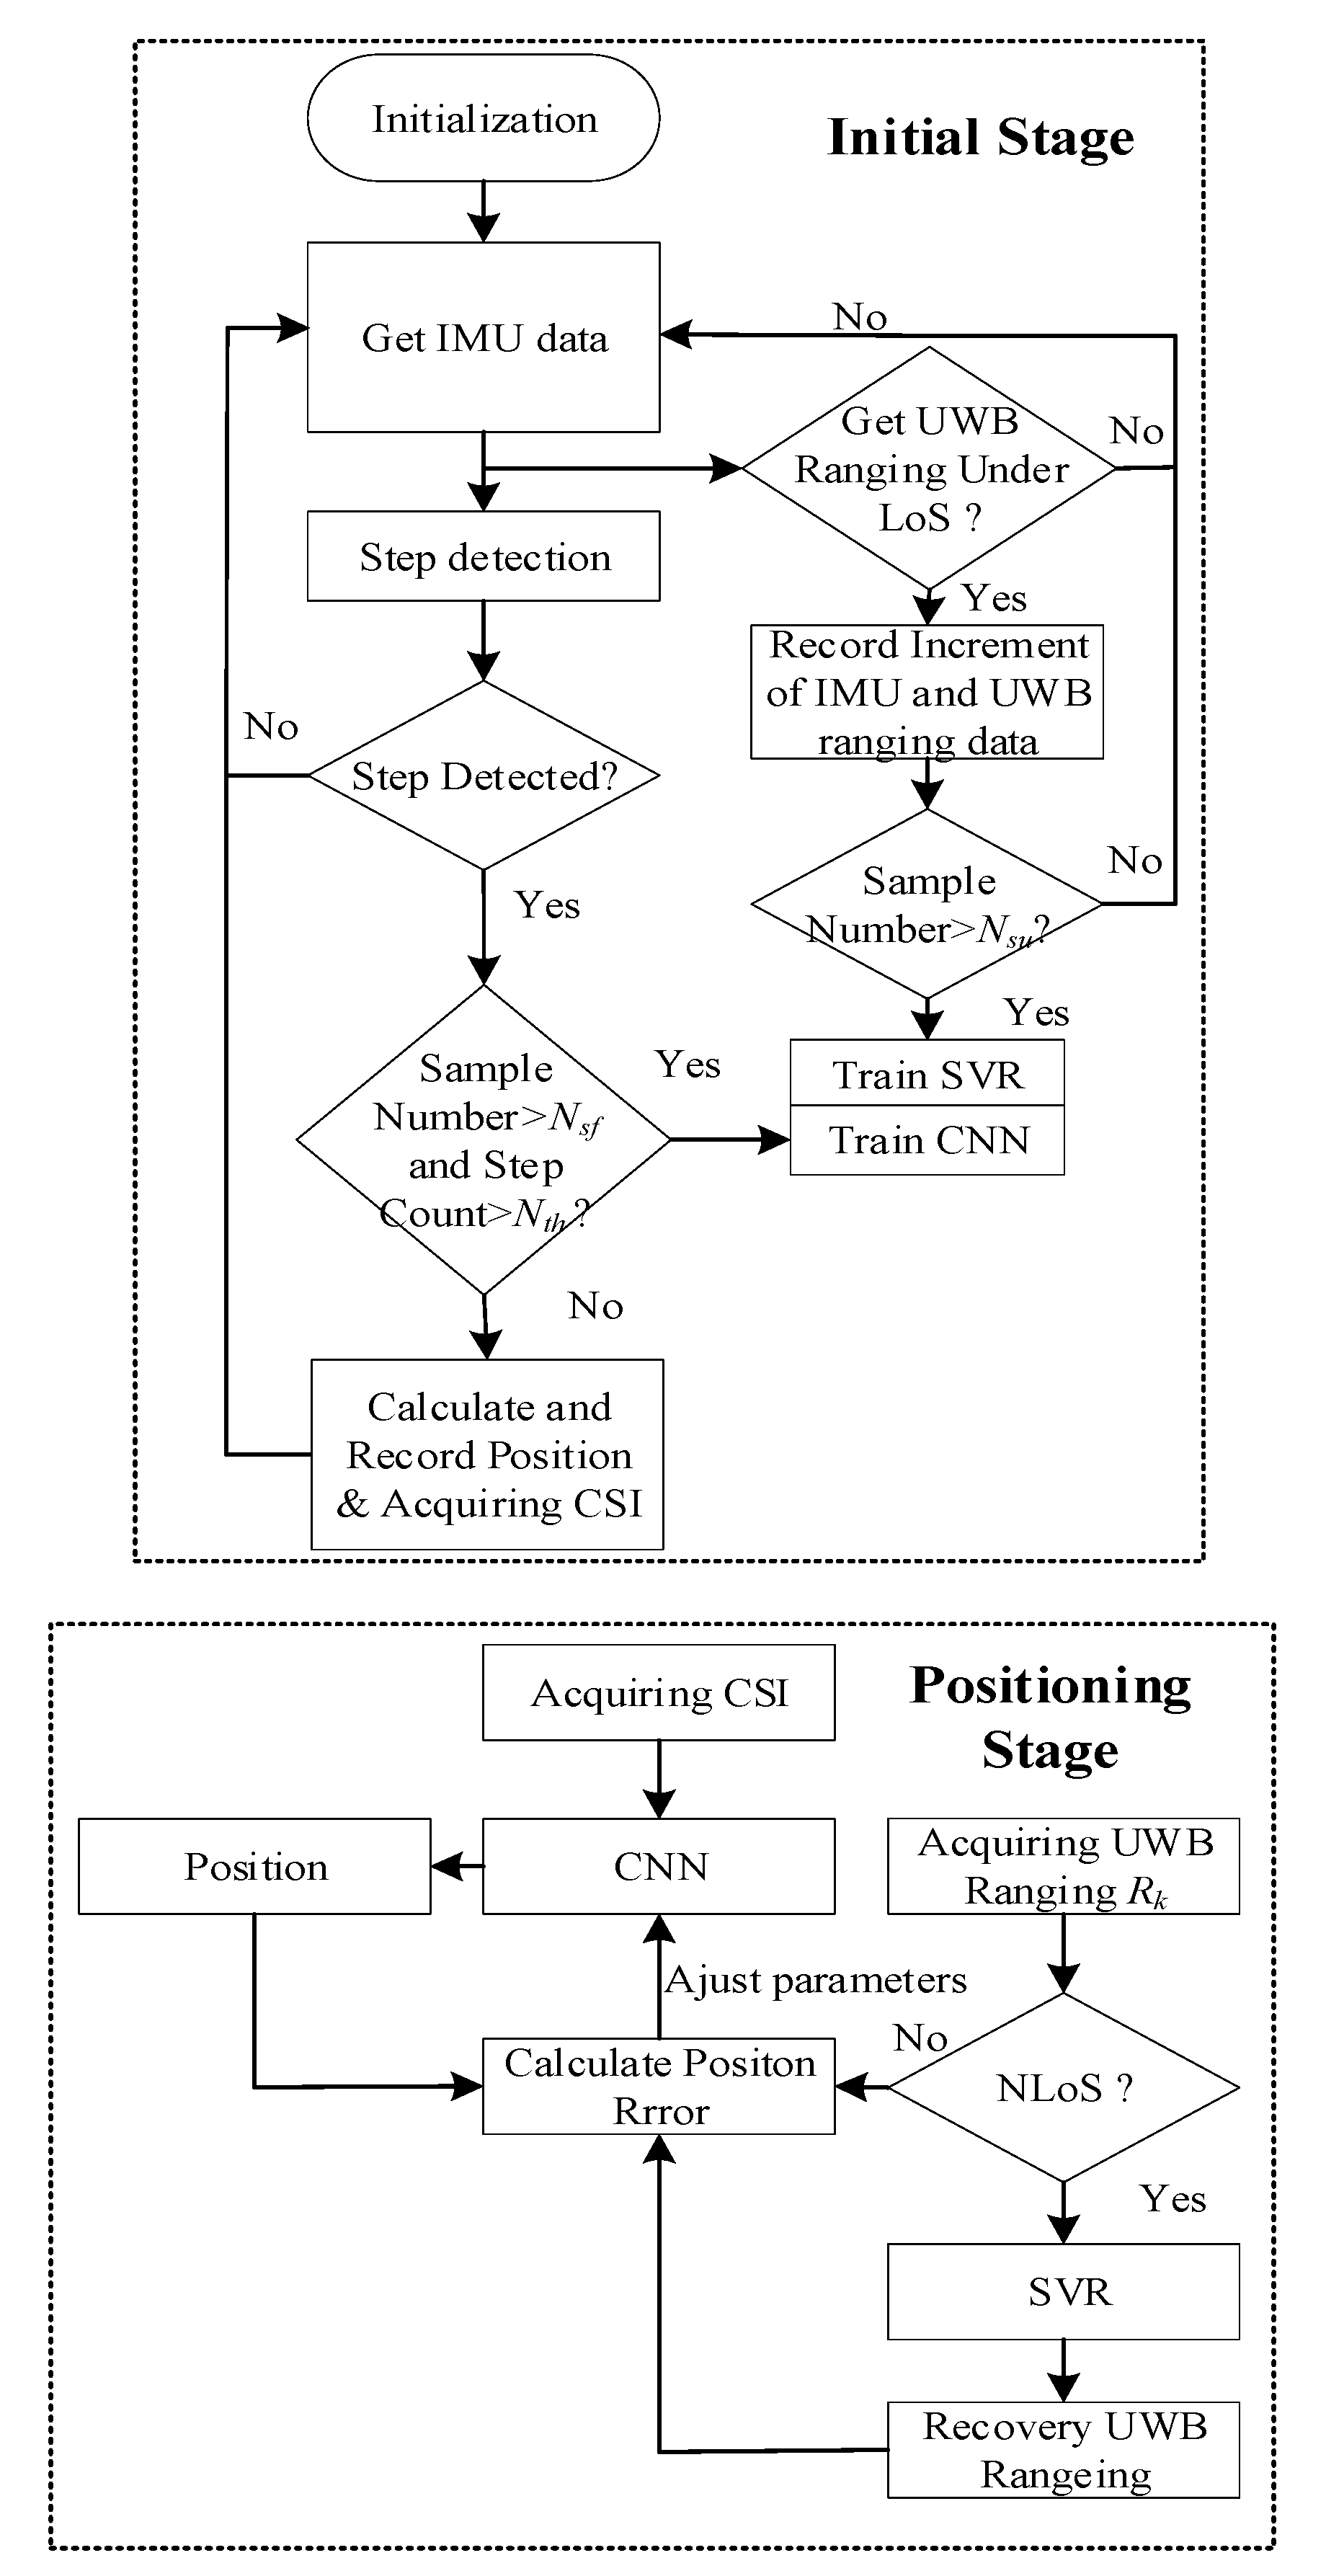
3.1. Overview
3.2. CNN Training
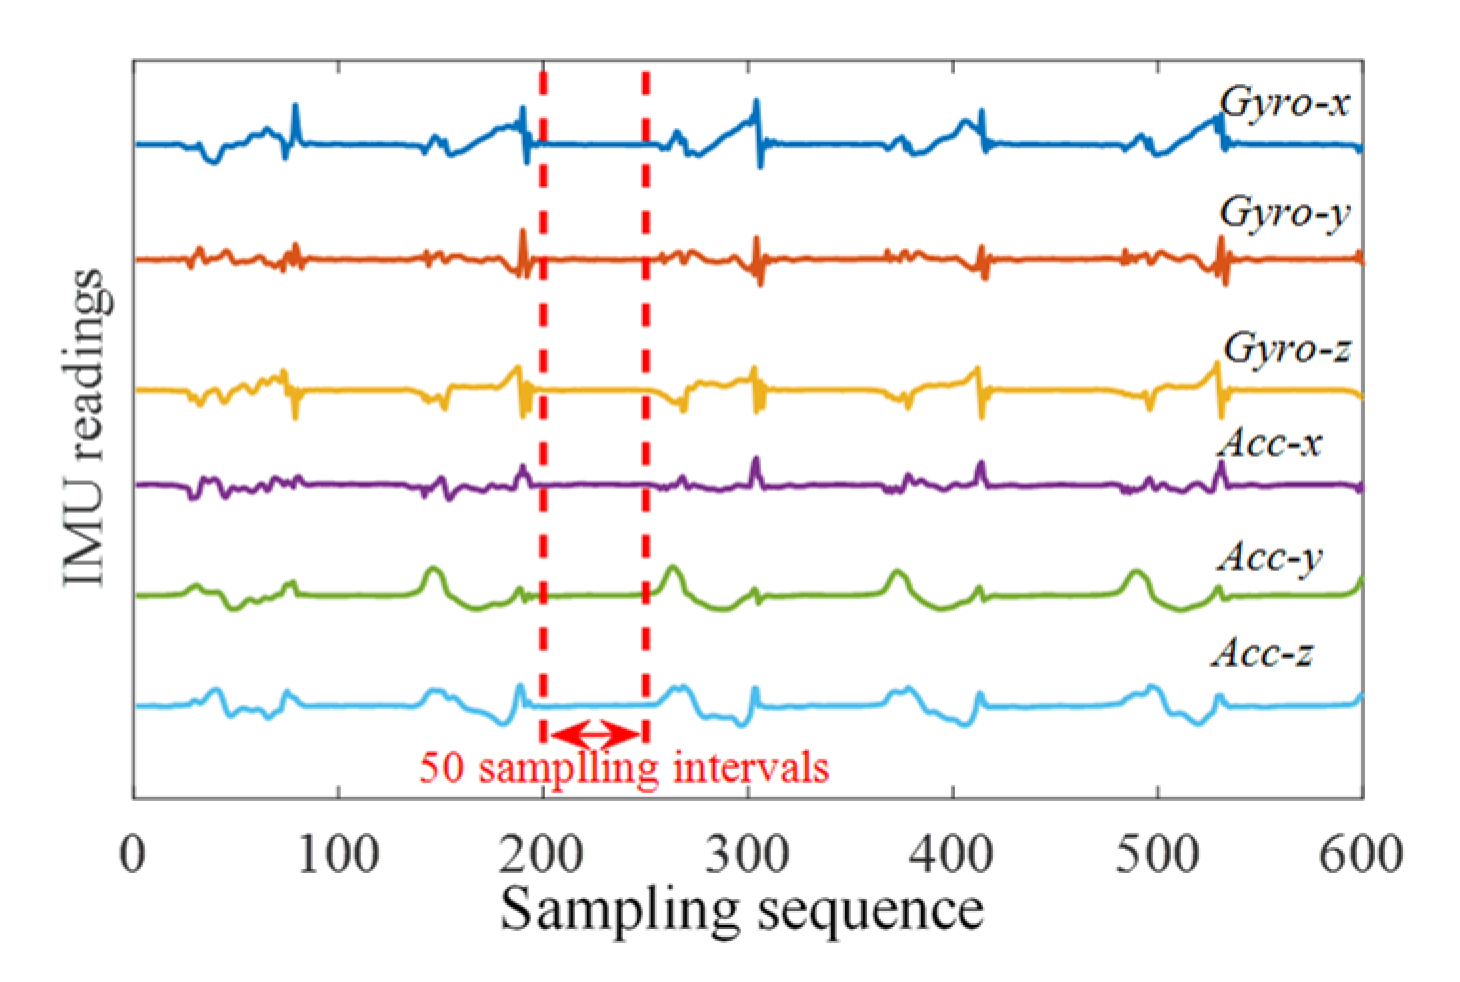
3.2.1. Step Detection
3.2.2. Position Calculation
3.2.3. CNN Regression Model
3.3. SVR Training
4. Positioning Experiment and Analysis
4.1. Preparation
4.1.1. PDR Parameters Setting
4.1.2. CNN Parameters Setting
4.2. Test Evaluation
4.2.1. Basic Performance Test
4.2.2. Daily Localization Performance Test
4.2.3. Long-Term Localization Performance Test
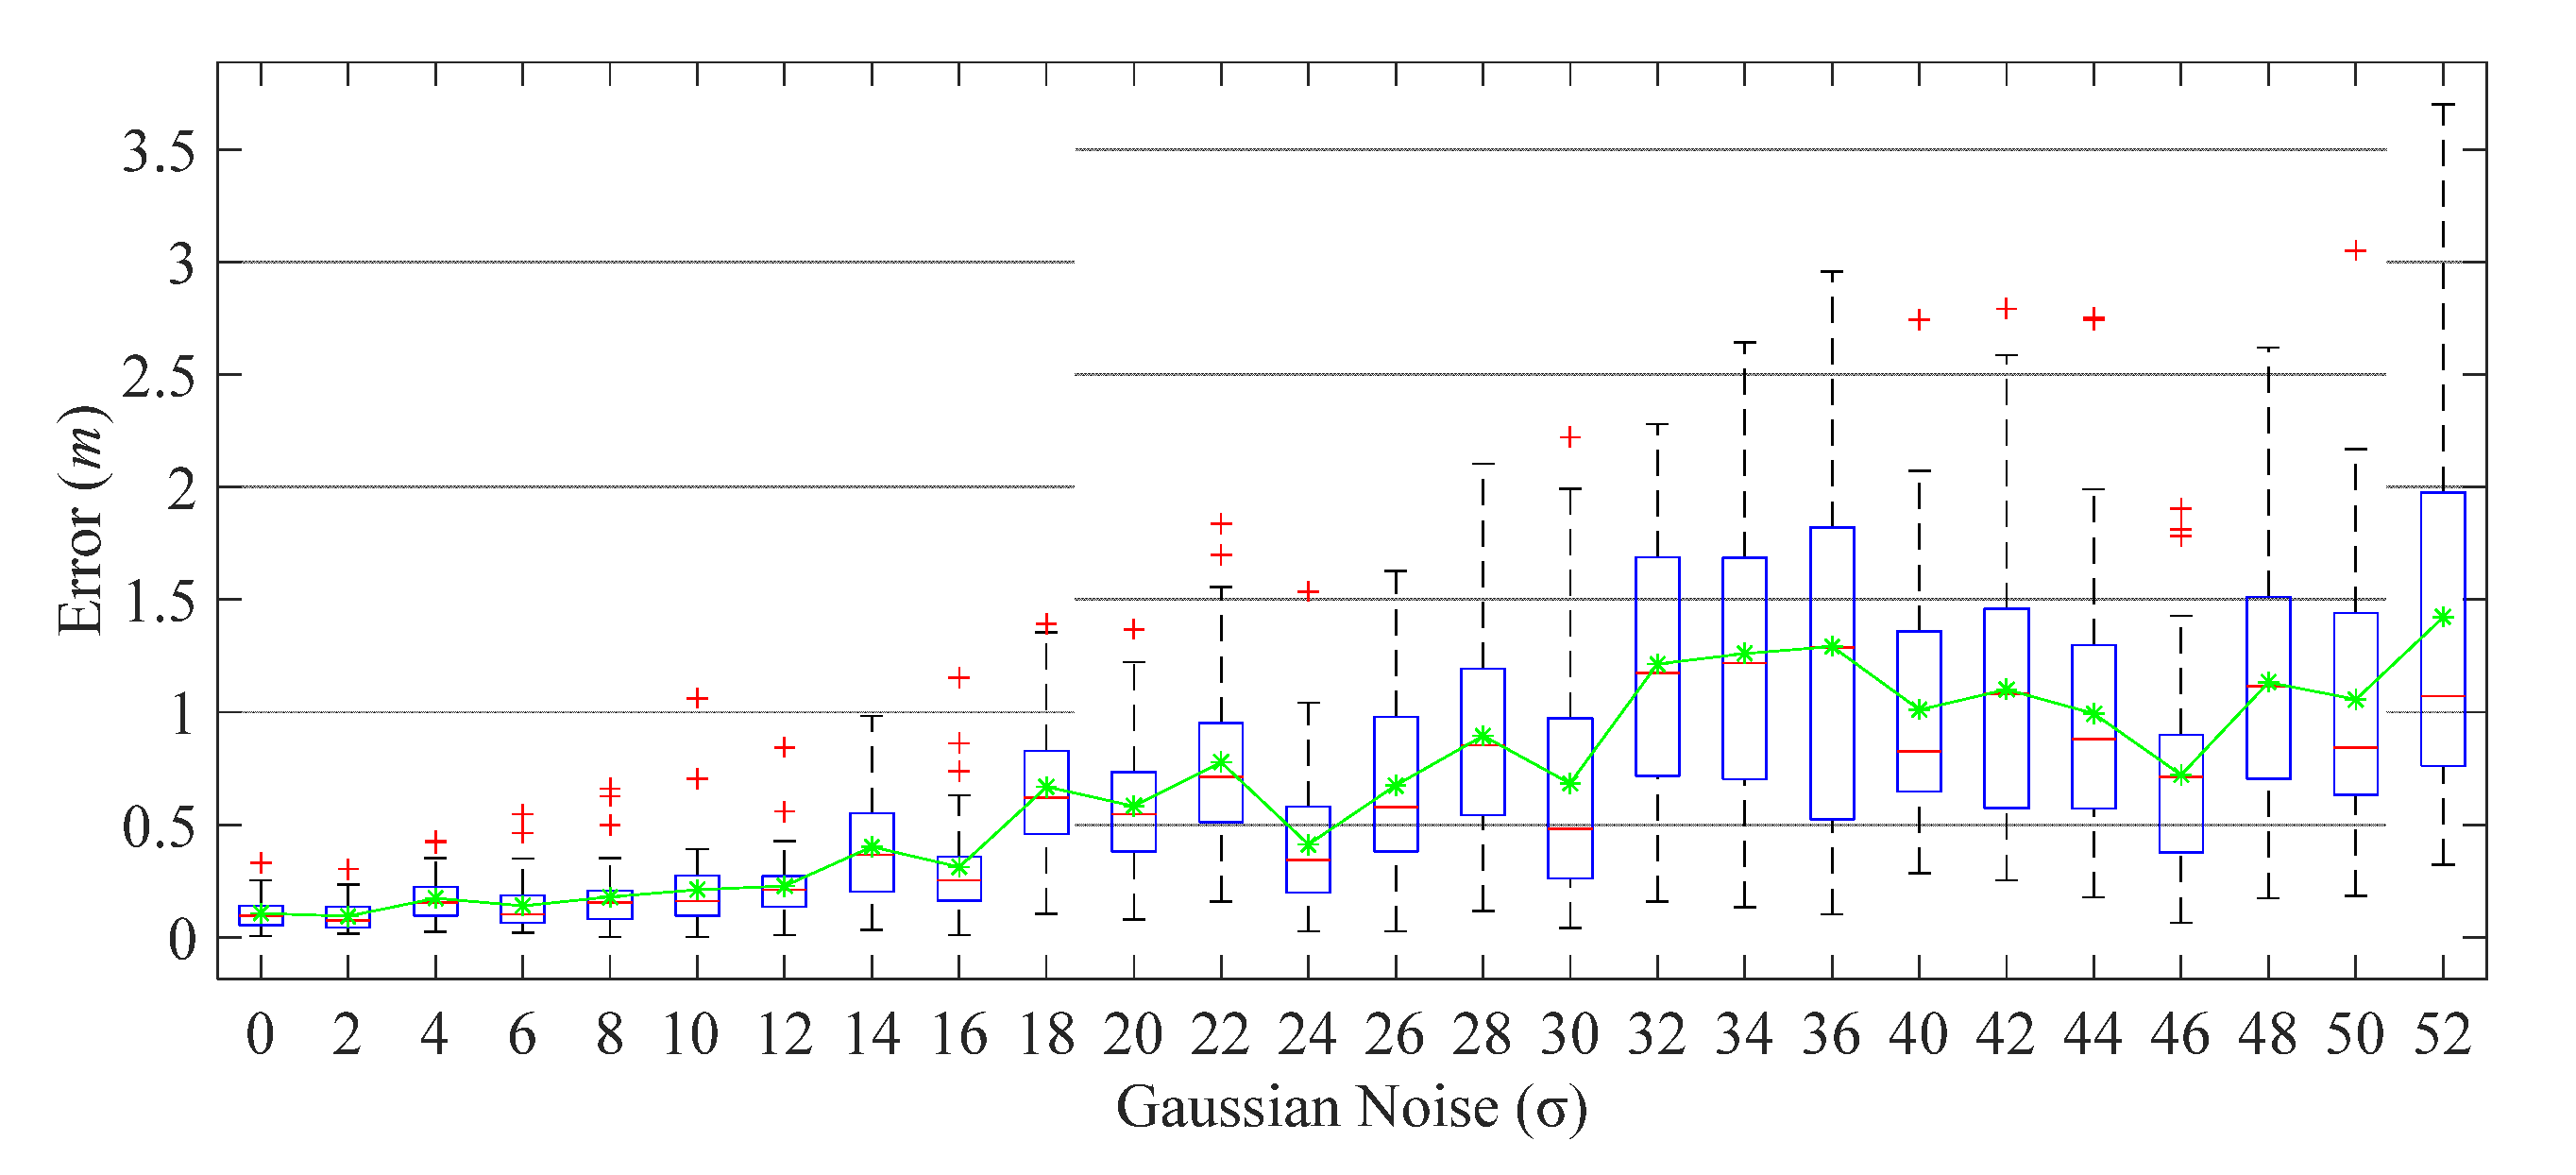
4.2.4. Noise Injection Test
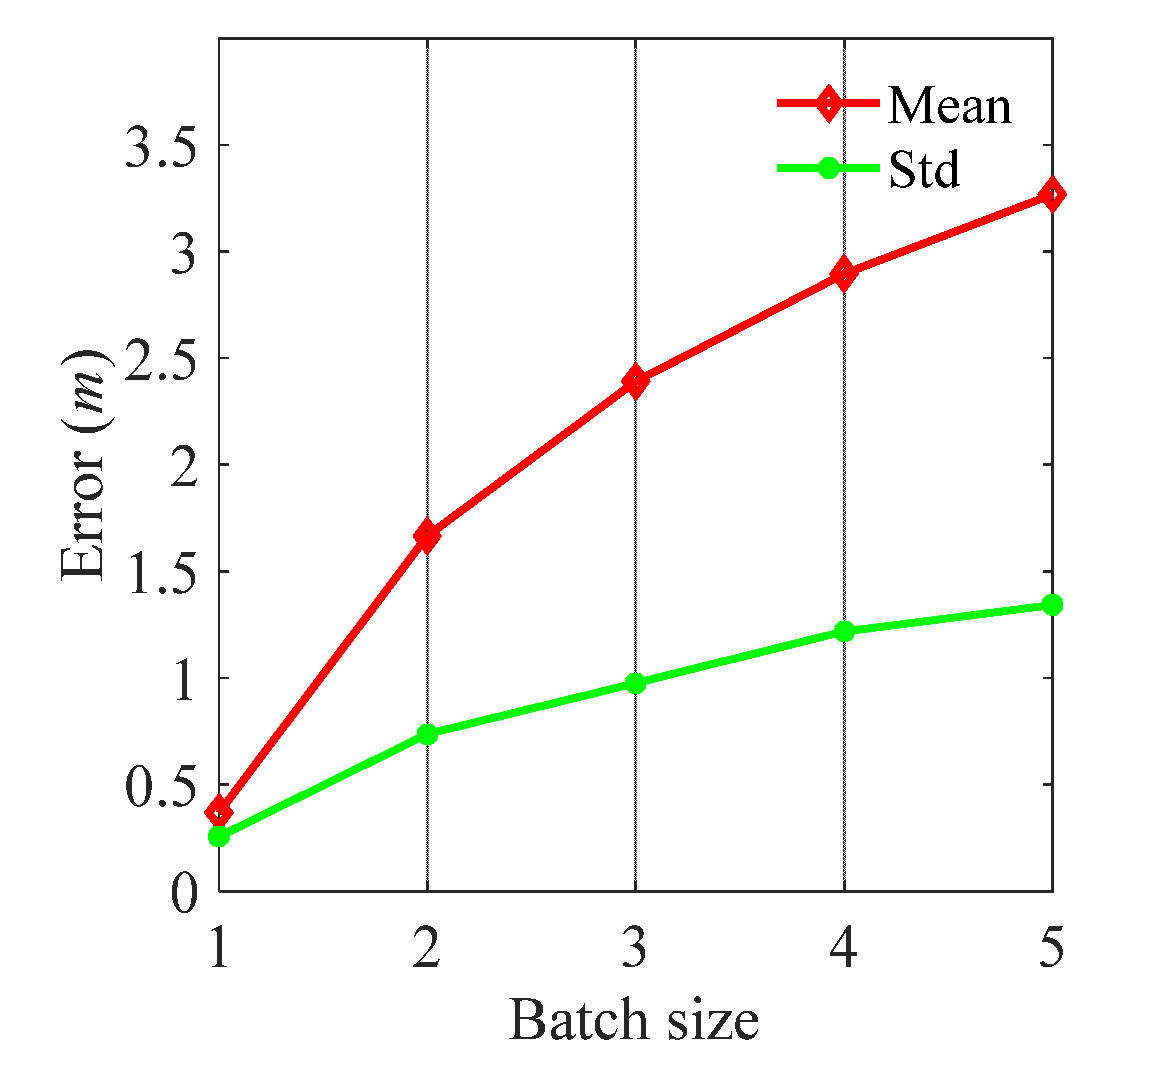
4.2.5. Impact of Parameters on the Positioning Stage
4.2.6. Comparison with Recent Related Works

| Reference | Short-Term Accuracy (m) | Long-Term Accuracy (m) | AP Number | Localization Information | Area | Strategy |
|---|---|---|---|---|---|---|
| [43] | 3.91 | 3.91–4.49 * | ~258 APs | RSSI (ratio) | 12.5 m × 10 m | classification |
| [45] | 0.20, 0.38 | - | 1 | CSI + RSSI | 6 m × 9 m | classification |
| [44] | 2.6 | - | 14 | RSS + INS | 40 m × 100 m | fusion |
| [46] | 0.1–3.5 * | - | At least 3 | RSSI + Loss model | 8 m × 8 m | trilateration |
| [47] | 0.23–2.10 | - | 144 | RSSI + magnetor | 27.6 m × 12.8 m | classification |
| Ours | 0.21 | 0.19–0.32 | 2 (UWB + CSI) | CSI + UWB + INS | 10.1 m × 8 m | regression |
5. Discussion
- The proposal can save the cost of labor and system deployment. However, due to the high drift and noise interference of commercial IMU, the fingerprint collector must return to the fixed coordinate-known point (the entrance or some other given points) when the number of steps reaches the precision threshold of the PDR algorithm. As a result, the area of fingerprint collection is limited to a circle with the fixed point (the entrance or some other given points) as center, and straight PDR distance (within threshold of step number) as radius. This limit can be solved by adopting a more expensive IMU rather than adding an anchor to implement location-related fingerprint collection in a large area, and the equipment of fingerprint collection can still be reused to collect fingerprint in other interesting places.
- In this paper, the UWB ranging measure is the key to following environment change and calibrating localization results, thus, the whole system is also vulnerable to an NLoS environment. In our design, machine learning is utilized to recover UWB ranging measures under an NLoS environment. Although the machine learning method can give a reliable result, it has to be retrained when the positioning environment or the position of the UWB anchor has changed. There are two solutions to avoid NLoS interference: discarding UWB ranging under NLoS or constructing a UWB transmitting channel model. In terms of the discarding method, the UWB calibrated function cannot work in NLoS, which limits the system’s practical application and reduces the stability of the system (the system frequently changes between calibrated and uncalibrated state). As for the latter solution, there are some UWB signal transmitting models under different blocking objects and these models can recover UWB signal well. However, in practical application, it is hard to design a valid transmitting model suitable for various or multiple blocking interferences. Additionally, the threshold of NLoS judgment needs to be devised in a different environment rather than using experiential value.
- Unlike most works, the CNN regression model is used to predict location based on a gray image of CSI amplitude fingerprint. The essence of CNN prediction is the mapping function between position and CSI (similar to a signal transmitting model), which is sensitive to environmental change. For this reason, the UWB ranging measure is utilized to dynamically adjust the CNN predictions and weight parameters in this paper. Although the CNN is vulnerable to environmental change, it has its own superiority, i.e., outputting continuous location, which is the inbuilt advantage of realizing high-accuracy localization compared with the classification method.
- In addition to the discussed and tested parameters, there are a large number of factors affecting positioning results in practical application, e.g., the size of the fingerprint image and the choice of length of Wi-Fi sequences, etc. Based on these dynamical factors, our future work will concentrate on a more comprehensive but efficient localization system.
6. Conclusions
Author Contributions
Funding
Institutional Review Board Statement
Informed Consent Statement
Data Availability Statement
Conflicts of Interest
References
- Tran-Dang, H.; Krommenacker, N.; Charpentier, P.; Kim, D.-S. Toward the Internet of Things for Physical Internet: Perspectives and Challenges. IEEE Internet Things J. 2020, 7, 4711–4736. [Google Scholar] [CrossRef]
- Li, J.; Shi, H.; Li, H.; Zhang, A. Quad-Band Probe-Fed Stacked Annular Patch Antenna for GNSS Applications. IEEE Antennas Wirel. Propag. Lett. 2014, 13, 372–375. [Google Scholar] [CrossRef]
- Li, N.; Guan, L.; Gao, Y.; Du, S.; Wu, M.; Guang, X.; Cong, X. Indoor and Outdoor Low-Cost Seamless Integrated Navigation System Based on the Integration of INS/GNSS/LIDAR System. Remote Sens. 2020, 12, 3271. [Google Scholar] [CrossRef]
- Del Horno, M.M.; García-Varea, I.; Barbosa, L.O. Calibration of Wi-Fi-Based Indoor Tracking Systems for Android-Based Smartphones. Remote Sens. 2019, 11, 1072. [Google Scholar] [CrossRef] [Green Version]
- Zhang, Y.; Tan, X.; Zhao, C. UWB/INS Integrated Pedestrian Positioning for Robust Indoor Environments. IEEE Sens. J. 2020, 20, 14401–14409. [Google Scholar] [CrossRef]
- Luo, R.C.; Hsiao, T.-J. Indoor Localization System Based on Hybrid Wi-Fi/BLE and Hierarchical Topological Fingerprinting Approach. IEEE Trans. Veh. Technol. 2019, 68, 10791–10806. [Google Scholar] [CrossRef]
- Bianchi, V.; Ciampolini, P.; De Munari, I. RSSI-Based Indoor Localization and Identification for ZigBee Wireless Sensor Networks in Smart Homes. IEEE Trans. Instrum. Meas. 2018, 68, 566–575. [Google Scholar] [CrossRef]
- Haigh, S.; Kulon, J.; Partlow, A.; Rogers, P.; Gibson, C. A Robust Algorithm for Classification and Rejection of NLOS Signals in Narrowband Ultrasonic Localization Systems. IEEE Trans. Instrum. Meas. 2018, 68, 646–655. [Google Scholar] [CrossRef]
- Sánchez-Rodríguez, D.; Quintana-Suárez, M.A.; Alonso-González, I.; Ley-Bosch, C.; Sánchez-Medina, J.J. Fusion of Channel State Information and Received Signal Strength for Indoor Localization Using a Single Access Point. Remote Sens. 2020, 12, 1995. [Google Scholar] [CrossRef]
- He, S.; Chan, S.-H.G. Wi-Fi Fingerprint-Based Indoor Positioning: Recent Advances and Comparisons. IEEE Commun. Surv. Tutor. 2015, 18, 466–490. [Google Scholar] [CrossRef]
- Carrasco, U.; Coronado, P.D.U.; Parto, M.; Kurfess, T. Indoor location service in support of a smart manufacturing facility. Comput. Ind. 2018, 103, 132–140. [Google Scholar] [CrossRef]
- Xie, Y.; Wang, Y.; Nallanathan, A.; Wang, L. An Improved K-Nearest-Neighbor Indoor Localization Method Based on Spearman Distance. IEEE Signal Process. Lett. 2016, 23, 351–355. [Google Scholar] [CrossRef] [Green Version]
- Hu, J.; Liu, D.; Yan, Z.; Liu, H. Experimental Analysis on Weight K -Nearest Neighbor Indoor Fingerprint Positioning. IEEE Internet Things J. 2019, 6, 891–897. [Google Scholar] [CrossRef]
- Zheng, L.; Hu, B.-J.; Qiu, J.; Cui, M. A Deep-Learning-Based Self-Calibration Time-Reversal Fingerprinting Localization Approach on Wi-Fi Platform. IEEE Internet Things J. 2020, 7, 7072–7083. [Google Scholar] [CrossRef]
- Huang, B.; Xu, Z.; Jia, B.; Mao, G. An Online Radio Map Update Scheme for WiFi Fingerprint-Based Localization. IEEE Internet Things J. 2019, 6, 6909–6918. [Google Scholar] [CrossRef]
- Sobron, I.; Landa, I.; Eizmendi, I.; Velez, M. Adaptive TOA Estimation with Imperfect LOS and NLOS Knowledge in UWB Positioning Systems. In Proceedings of the 2020 IEEE SENSORS, Rotterdam, The Netherlands, 25–28 October 2020; pp. 1–4. [Google Scholar]
- Yang, X. NLOS Mitigation for UWB Localization Based on Sparse Pseudo-Input Gaussian Process. IEEE Sens. J. 2018, 18, 4311–4316. [Google Scholar] [CrossRef]
- Chen, Y.-Y.; Huang, S.-P.; Wu, T.-W.; Tsai, W.-T.; Liou, C.-Y.; Mao, S.-G. UWB System for Indoor Positioning and Tracking with Arbitrary Target Orientation, Optimal Anchor Location, and Adaptive NLOS Mitigation. IEEE Trans. Veh. Technol. 2020, 69, 1. [Google Scholar] [CrossRef]
- Tian, Q.; Wang, K.I.-K.; Salcic, Z. A Low-Cost INS and UWB Fusion Pedestrian Tracking System. IEEE Sens. J. 2019, 19, 3733–3740. [Google Scholar] [CrossRef]
- Joung, J.; Jung, S.; Chung, S.; Jeong, E. CNN-based Tx–Rx distance estimation for UWB system localisation. Electron. Lett. 2019, 55, 938–940. [Google Scholar] [CrossRef]
- Kristensen, J.B.; Ginard, M.M.; Jensen, O.K.; Shen, M. Non-Line-of-Sight Identification for UWB Indoor Positioning Systems using Support Vector Machines. In Proceedings of the 2019 IEEE MTT-S International Wireless Symposium (IWS), Guangzhou, China, 19–22 May 2019; pp. 1–3. [Google Scholar]
- Yu, K.; Wen, K.; Li, Y.; Zhang, S.; Zhang, K. A Novel NLOS Mitigation Algorithm for UWB Localization in Harsh Indoor Environments. IEEE Trans. Veh. Technol. 2019, 68, 686–699. [Google Scholar] [CrossRef]
- Dou, F.; Lu, J.; Xu, T.; Huang, C.-H.; Bi, J. A Bisection Reinforcement Learning Approach to 3D Indoor Localization. IEEE Internet Things J. 2020, 8, 6519–6535. [Google Scholar] [CrossRef]
- Song, Q.; Guo, S.; Liu, X.; Yang, Y. CSI Amplitude Fingerprinting-Based NB-IoT Indoor Localization. IEEE Internet Things J. 2018, 5, 1494–1504. [Google Scholar] [CrossRef]
- Villacres, J.L.C.; Zhao, Z.; Braun, T.; Li, Z. A Particle Filter-Based Reinforcement Learning Approach for Reliable Wireless Indoor Positioning. IEEE J. Sel. Areas Commun. 2019, 37, 2457–2473. [Google Scholar] [CrossRef]
- Chen, Z.; Alhajri, M.I.; Wu, M.; Ali, N.T.; Shubair, R.M. A Novel Real-Time Deep Learning Approach for Indoor Localization Based on RF Environment Identification. IEEE Sens. Lett. 2020, 4, 1–4. [Google Scholar] [CrossRef]
- Zhou, R.; Hou, H.; Gong, Z.; Chen, Z.; Tang, K.; Zhou, B. Adaptive Device-Free Localization in Dynamic Environments Through Adaptive Neural Networks. IEEE Sens. J. 2021, 21, 548–559. [Google Scholar] [CrossRef]
- Zhao, L.; Huang, H.; Li, X.; Ding, S.; Zhao, H.; Han, Z. An Accurate and Robust Approach of Device-Free Localization With Convolutional Autoencoder. IEEE Internet Things J. 2019, 6, 5825–5840. [Google Scholar] [CrossRef]
- Chen, H.; Wang, B.; Pei, Y.; Zhang, L. A WiFi Indoor Localization Method Based on Dilated CNN and Support Vector Regression. In Proceedings of the 2020 Chinese Automation Congress (CAC), Shanghai, China, 6–8 November 2020; pp. 165–170. [Google Scholar]
- Tian, Q.; Wang, K.I.-K.; Salcic, Z. An INS and UWB Fusion Approach With Adaptive Ranging Error Mitigation for Pedestrian Tracking. IEEE Sens. J. 2020, 20, 4372–4381. [Google Scholar] [CrossRef]
- Cao, Y.; Yang, C.; Li, R.; Knoll, A.; Beltrame, G. Accurate position tracking with a single UWB anchor. In Proceedings of the 2020 IEEE International Conference on Robotics and Automation (ICRA), Paris, France, 31 May–31 August 2020; pp. 2344–2350. [Google Scholar]
- Li, B.; Hao, Z.; Dang, X. An indoor location algorithm based on Kalman filter fusion of ultra-wide band and inertial measurement unit. AIP Adv. 2019, 9, 085210. [Google Scholar] [CrossRef] [Green Version]
- Shi, Q.; Zhao, S.; Cui, X.; Lu, M.; Jia, M. Anchor self-localization algorithm based on UWB ranging and inertial measurements. Tsinghua Sci. Technol. 2019, 24, 728–737. [Google Scholar] [CrossRef]
- Xu, Y.; Shmaliy, Y.S.; Ahn, C.K.; Shen, T.; Zhuang, Y. Tightly Coupled Integration of INS and UWB Using Fixed-Lag Extended UFIR Smoothing for Quadrotor Localization. IEEE Internet Things J. 2021, 8, 1716–1727. [Google Scholar] [CrossRef]
- Wu, K.; Xiao, J.; Yi, Y.; Chen, D.; Luo, X.; Ni, L.M.-S. CSI-Based Indoor Localization. IEEE Trans. Parallel Distrib. Syst. 2013, 24, 1300–1309. [Google Scholar] [CrossRef] [Green Version]
- Jiménez, A.R.; Seco, F.; Prieto, J.C.; Guevara, J. Indoor pedestrian navigation using an INS/EKF framework for yaw drift reduction and a foot-mounted IMU. In Proceedings of the 2010 7th Workshop on Positioning, Navigation and Communication, Dresden, Germany, 11–12 March 2010; pp. 135–143. [Google Scholar]
- Liu, X.; Li, N.; Xu, G.; Zhang, Y. A Novel Robust Step Detection Algorithm for Foot-Mounted IMU. IEEE Sens. J. 2021, 21, 5331–5339. [Google Scholar] [CrossRef]
- Miao, S.; Wang, Z.J.; Liao, R. A CNN Regression Approach for Real-Time 2D/3D Registration. IEEE Trans. Med Imaging 2016, 35, 1352–1363. [Google Scholar] [CrossRef]
- Krizhevsky, A.; Sutskever, I.; Hinton, G.E. ImageNet classification with deep convolutional neural networks. Adv. Neural Inf. Process. 2012, 2, 1097–1105. [Google Scholar] [CrossRef]
- DW1000 User Manual, DecaWave. Available online: https://www.decawave.com/sites/default/files/resources/dw1000_user_manual_2.11.pdf (accessed on 21 February 2021).
- Zhao, H.; Wang, Z.; Qiu, S.; Shen, Y.; Zhang, L.; Tang, K.; Fortino, G. Heading Drift Reduction for Foot-Mounted Inertial Navigation System via Multi-Sensor Fusion and Dual-Gait Analysis. IEEE Sens. J. 2019, 19, 8514–8521. [Google Scholar] [CrossRef]
- Moreno-Barea, F.J.; Strazzera, F.; Jerez, J.M.; Urda, D.; Franco, L. Forward Noise Adjustment Scheme for Data Augmentation. In Proceedings of the 2018 IEEE Symposium Series on Computational Intelligence (SSCI), Bengaluru, India, 18–21 November 2018; pp. 728–734. [Google Scholar]
- Liu, Z.; Dai, B.; Wan, X.; Li, X. Hybrid Wireless Fingerprint Indoor Localization Method Based on a Convolutional Neural Network. Sensors 2019, 19, 4597. [Google Scholar] [CrossRef] [Green Version]
- Wen, K.; Seow, C.K.; Tan, S.Y. An Indoor Localization and Tracking System Using Successive Weighted RSS Projection. IEEE Antennas Wirel. Propag. Lett. 2020, 19, 1620–1624. [Google Scholar] [CrossRef]
- Yan, J.; Ma, C.; Kang, B.; Wu, X.; Liu, H. Extreme Learning Machine and AdaBoost-Based Localization Using CSI and RSSI. IEEE Commun. Lett. 2021, 25, 1906–1910. [Google Scholar] [CrossRef]
- Yang, B.; Guo, L.; Guo, R.; Zhao, M.; Zhao, T. A Novel Trilateration Algorithm for RSSI-Based Indoor Localization. IEEE Sens. J. 2020, 20, 8164–8172. [Google Scholar] [CrossRef]
- Sun, D.; Wei, E.; Yang, L.; Xu, S. Improving Fingerprint Indoor Localization Using Convolutional Neural Networks. IEEE Access 2020, 8, 1. [Google Scholar] [CrossRef]


| Ratio of NLoS | Item | Mean (m) | Std (m) |
|---|---|---|---|
| 20% NLoS | Raw UWB ranging | 0.32 | 0.22 |
| Correction UWB ranging | 0.18 | 0.04 | |
| Correction ratio | 43.75% | 81.81% | |
| 50% NLoS | Raw UWB ranging | 0.41 | 0.19 |
| Correction UWB ranging | 0.24 | 0.11 | |
| Correction ratio | 41.46% | 42.11% | |
| 80% NLoS | Raw UWB ranging | 0.54 | 0.21 |
| Correction UWB ranging | 0.37 | 0.20 | |
| Correction ratio | 31.48% | 4.76% |
| Parameter | Value |
|---|---|
| Size | 39 mm × 39 mm × 8 mm |
| Accelerator | 3-axis, ±16 g |
| Gyroscope | 3-axis, ±2000 dps |
| Sampling frequency | 100 Hz |
| Resolution | <0.05° |
| Parameter | Value/Setting |
|---|---|
| Number of samples in CNN Nsf | 4000 |
| Number of samples in SVR Nsu | 4000 |
| Step threshold Nth | 20 |
| The kernel function of SVR | Radial Basis Function |
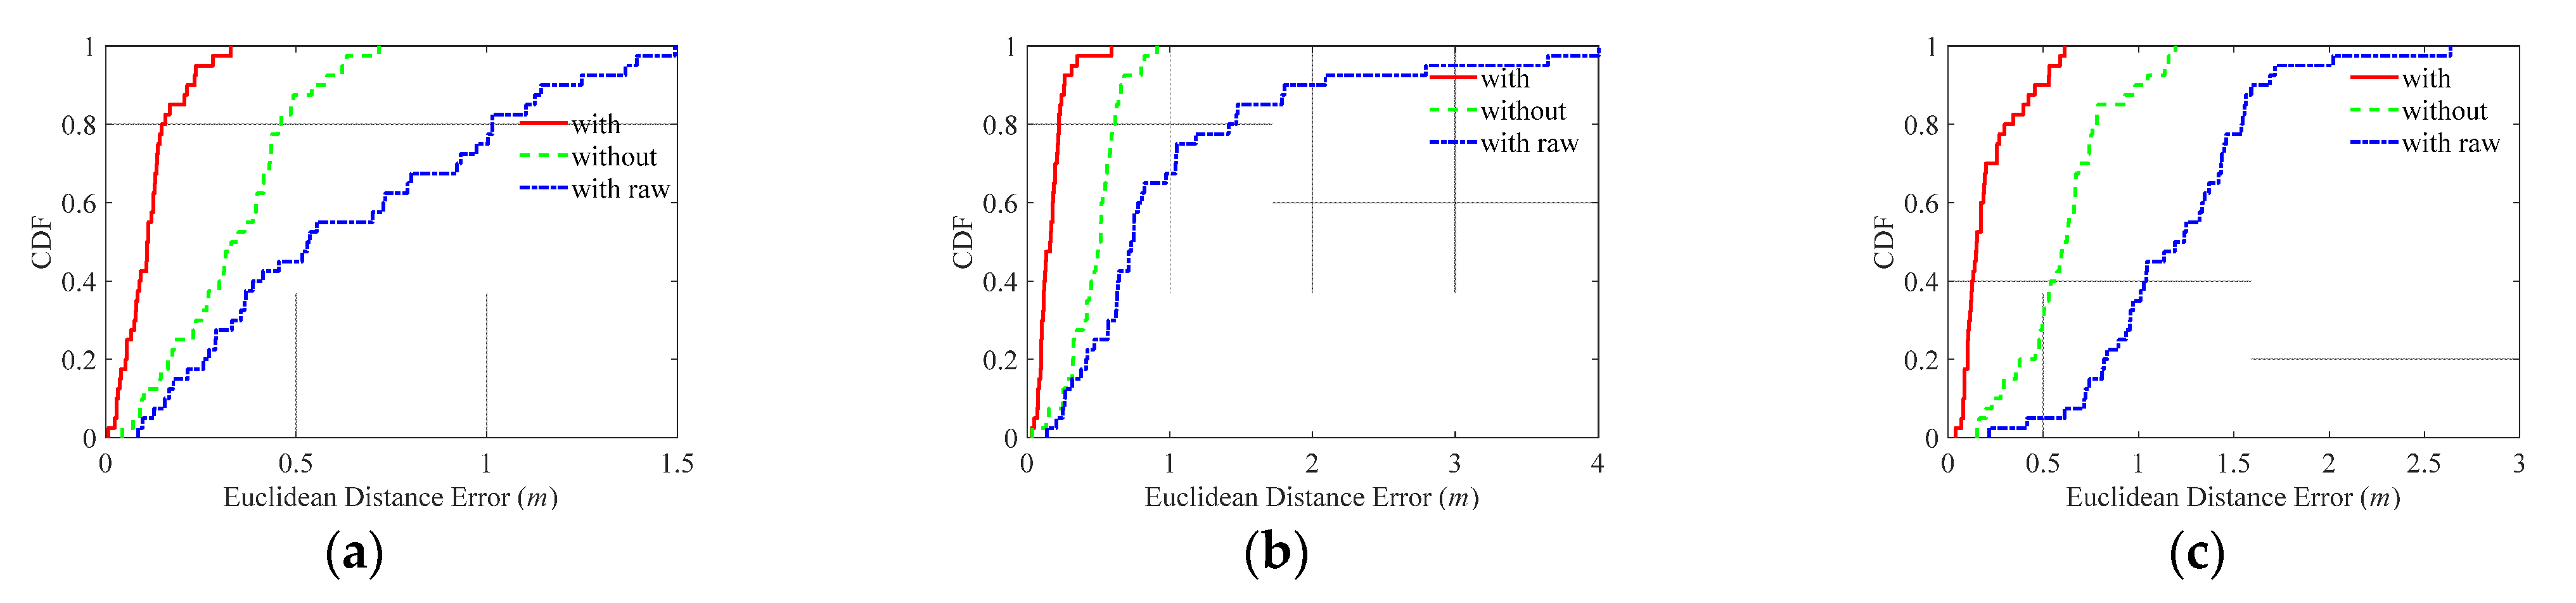
| Calibration | Percentile | Euclidean Distance Error (m) | ||||||
|---|---|---|---|---|---|---|---|---|
| 50% | 70% | 90% | <0.2 | <0.3 | <0.5 | <1 | ||
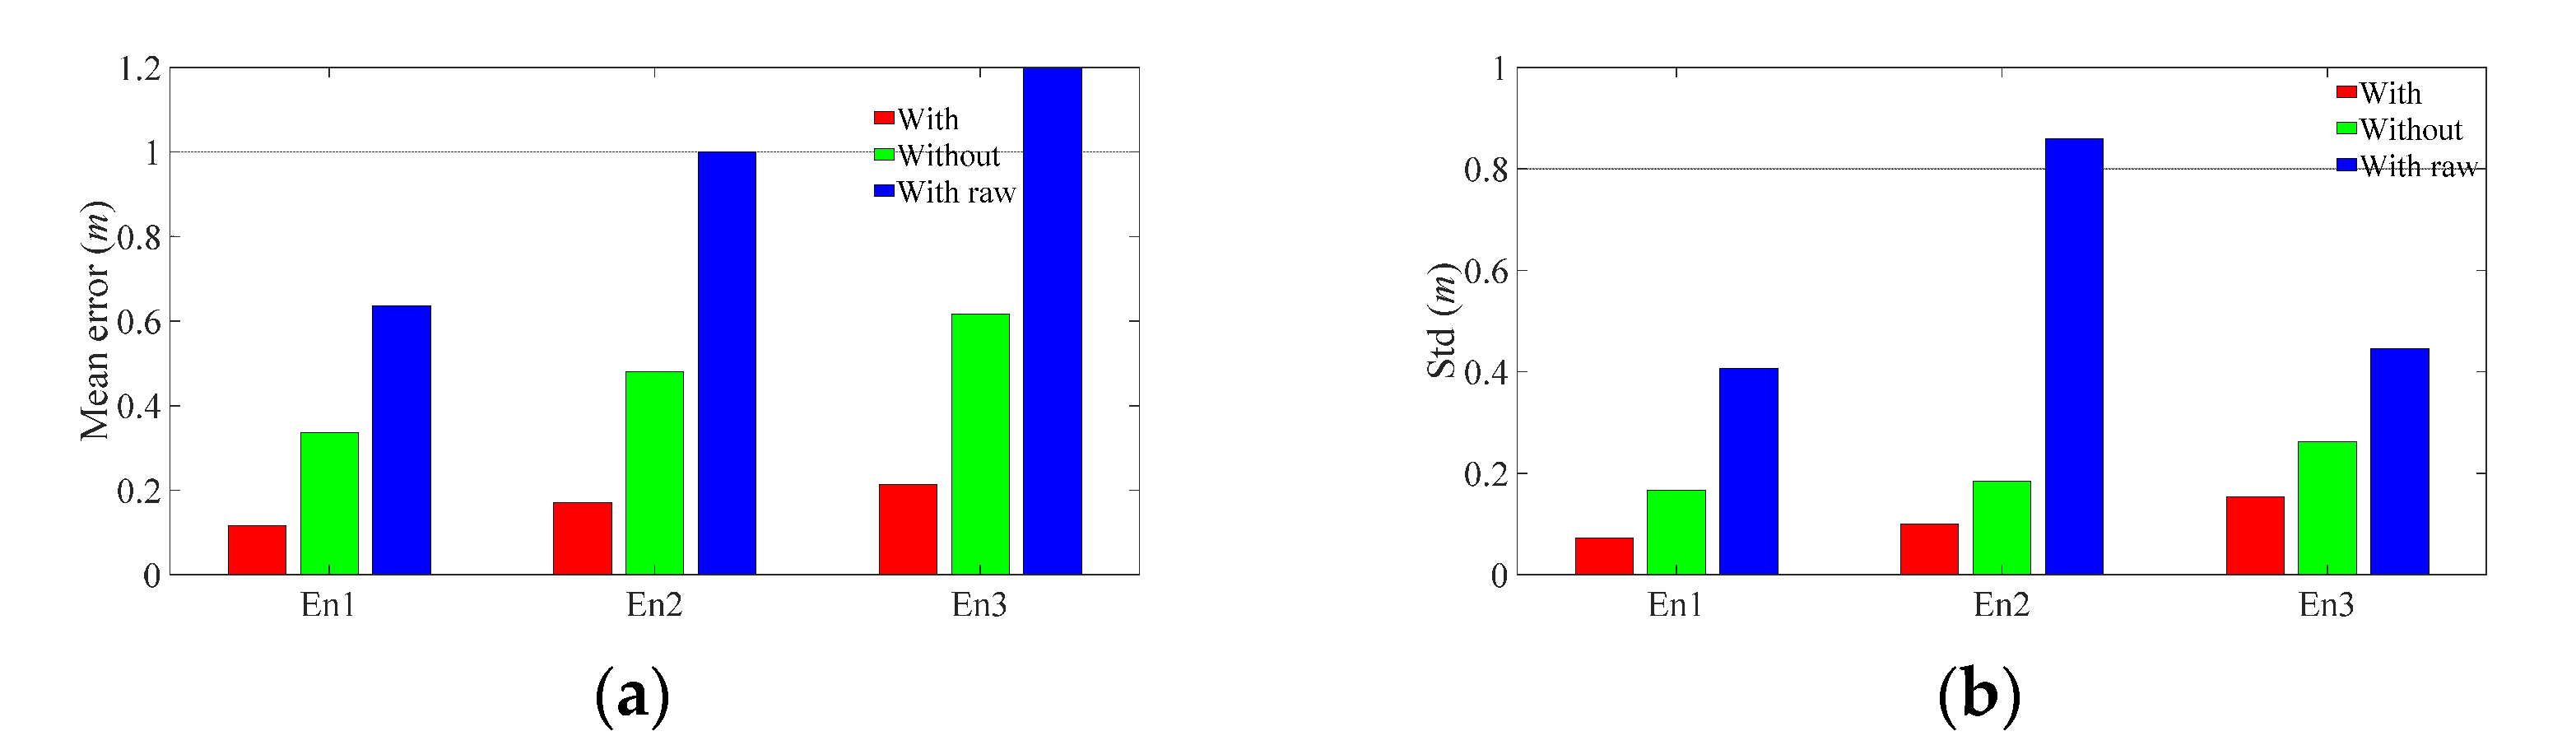
| En1 | With | 0.11 | 0.13 | 0.21 | 84.76% | 97.51% | 100% | 100% |
| Without | 0.33 | 0.43 | 0.54 | 25.42% | 39.83% | 87.58% | 100% | |
| With raw | 0.52 | 0.92 | 1.14 | 15.81% | 27.90% | 45.12% | 75.34% | |
| En2 | With | 0.16 | 0.20 | 0.26 | 69.63% | 91.75% | 97.27% | 100% |
| Without | 0.50 | 0.56 | 0.66 | 7.69% | 15.49% | 47.15% | 100% | |
| With raw | 0.73 | 1.04 | 1.81 | 2.54% | 12.06% | 25.03% | 67.19% | |
| En3 | With | 0.15 | 0.22 | 0.45 | 70.42% | 79.91% | 90.22% | 100% |
| Without | 0.60 | 0.68 | 0.98 | 7.95% | 15.57% | 30.40% | 80.67% | |
| With raw | 1.19 | 1.43 | 1.59 | 2.51% | 2.51% | 5.22% | 70.12% | |
| En1 | En2 | En3 | |||
|---|---|---|---|---|---|
| Mean | Sth | Mean | Sth | Mean | Sth |
| 65.65% | 56.67% | 64.50% | 46.13% | 65.54% | 41.09% |
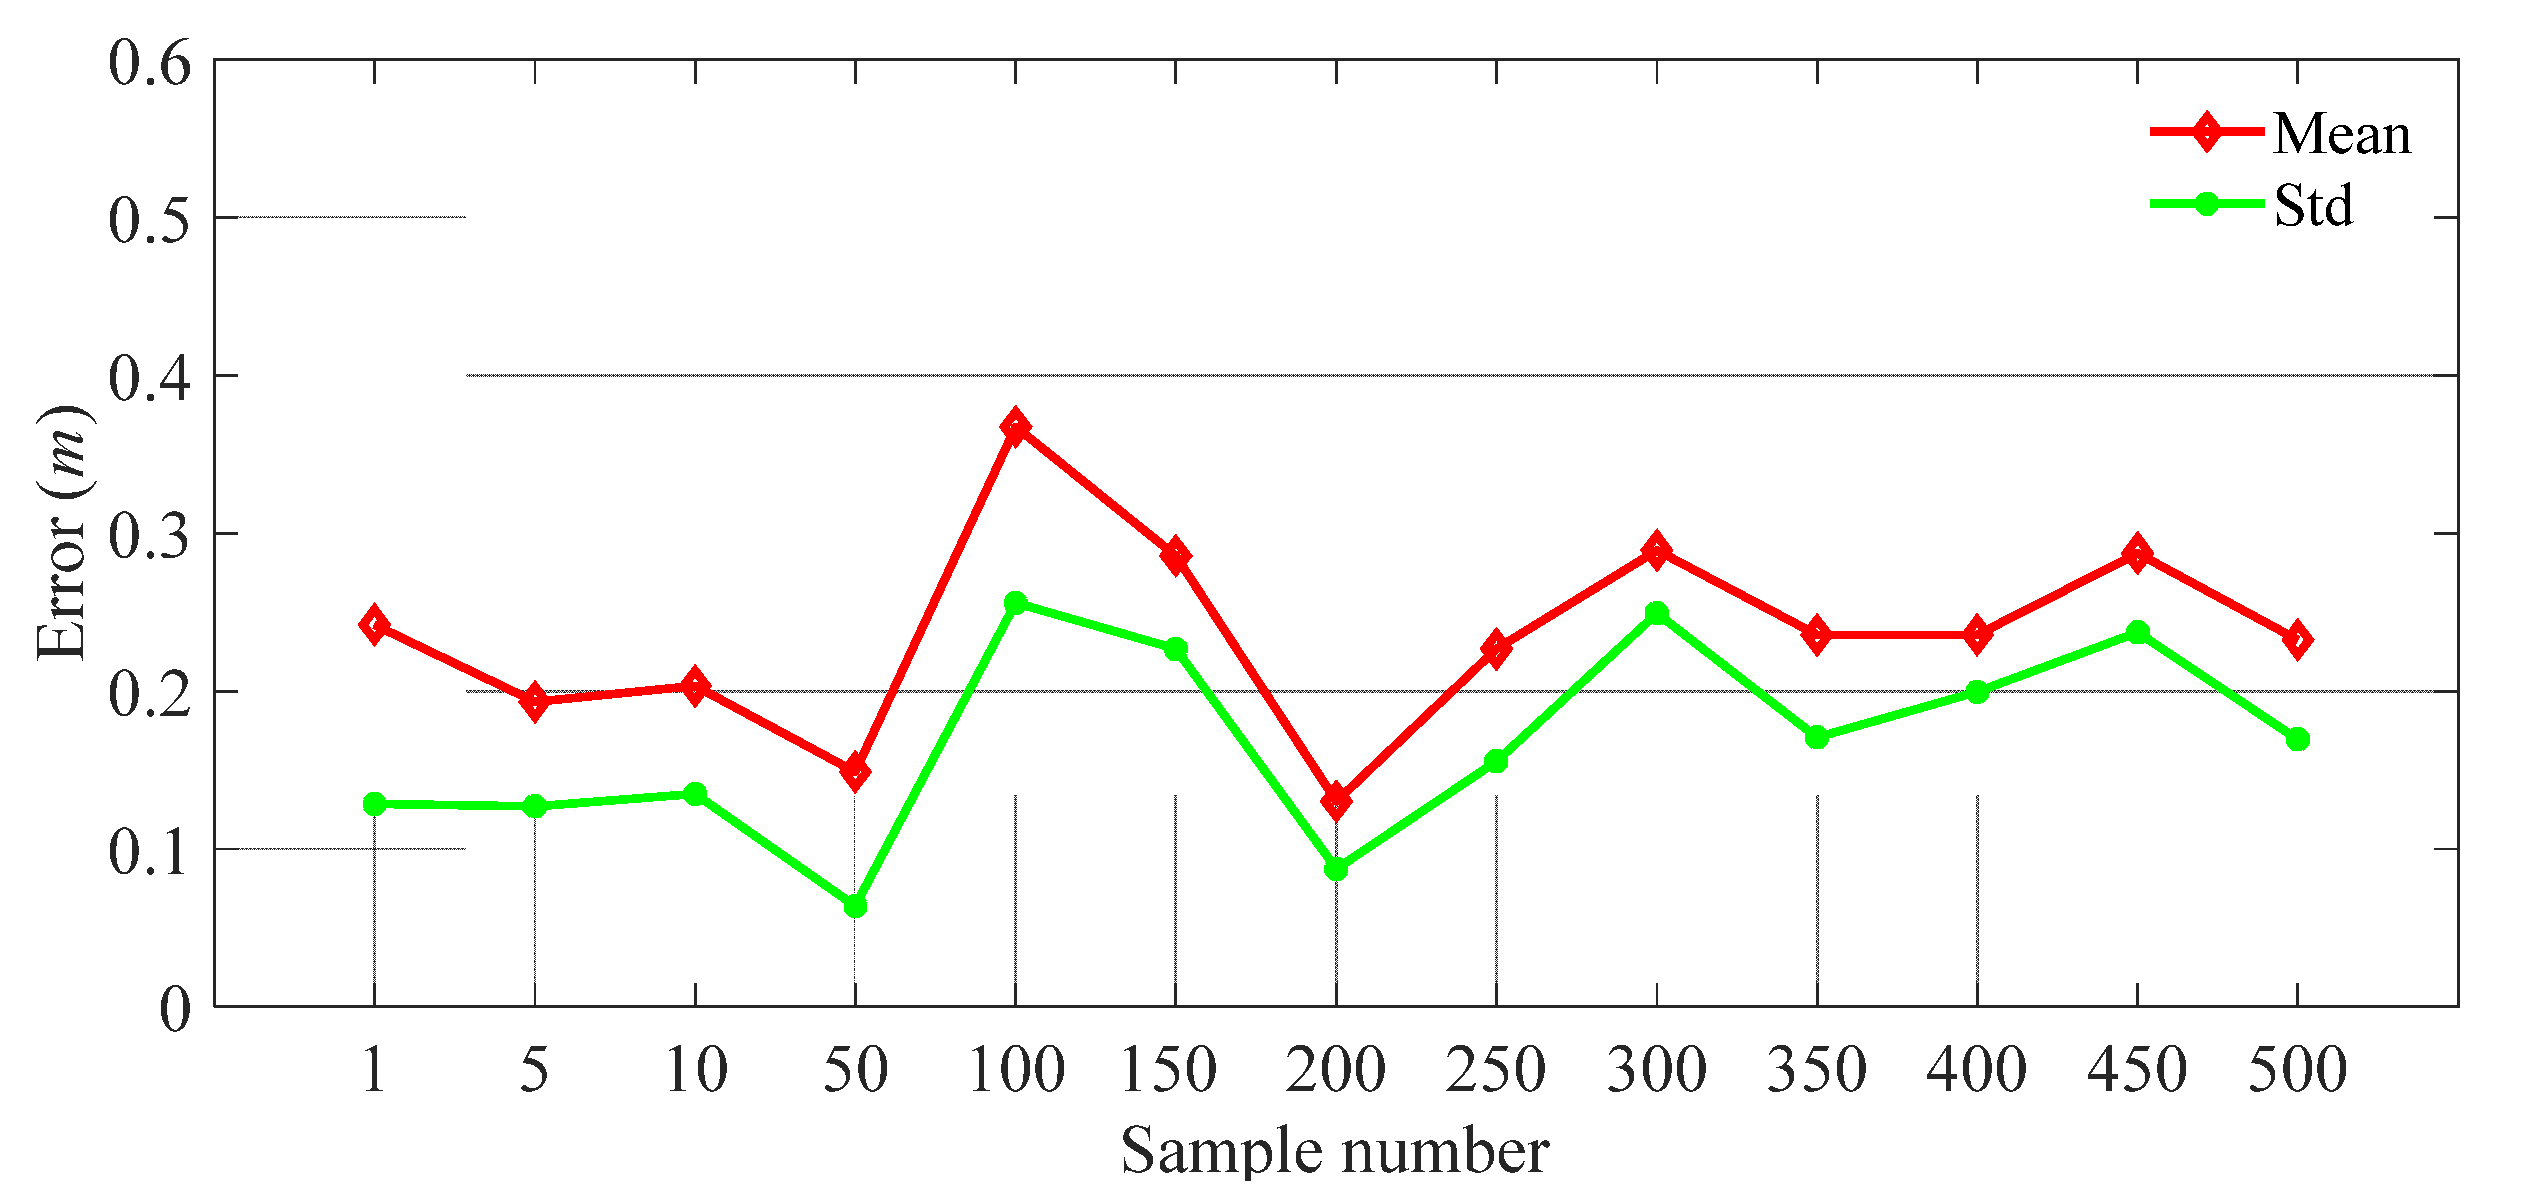
| Sample Number | 1 | 10 | 50 | 100 | 150 | 200 |
|---|---|---|---|---|---|---|
| Update time (ms) | <1 | 1.90 | 10.5 | 20.3 | 29.6 | 41.8 |
Publisher’s Note: MDPI stays neutral with regard to jurisdictional claims in published maps and institutional affiliations. |
© 2021 by the authors. Licensee MDPI, Basel, Switzerland. This article is an open access article distributed under the terms and conditions of the Creative Commons Attribution (CC BY) license (https://creativecommons.org/licenses/by/4.0/).
Share and Cite
Long, K.; Nsalo Kong, D.F.; Zhang, K.; Tian, C.; Shen, C. A CSI-Based Indoor Positioning System Using Single UWB Ranging Correction. Sensors 2021, 21, 6447. https://doi.org/10.3390/s21196447
Long K, Nsalo Kong DF, Zhang K, Tian C, Shen C. A CSI-Based Indoor Positioning System Using Single UWB Ranging Correction. Sensors. 2021; 21(19):6447. https://doi.org/10.3390/s21196447
Chicago/Turabian StyleLong, Keliu, Darryl Franck Nsalo Kong, Kun Zhang, Chuan Tian, and Chong Shen. 2021. "A CSI-Based Indoor Positioning System Using Single UWB Ranging Correction" Sensors 21, no. 19: 6447. https://doi.org/10.3390/s21196447
APA StyleLong, K., Nsalo Kong, D. F., Zhang, K., Tian, C., & Shen, C. (2021). A CSI-Based Indoor Positioning System Using Single UWB Ranging Correction. Sensors, 21(19), 6447. https://doi.org/10.3390/s21196447