
System Performance Analysis for Trimmable Horizontal Stabilizer Actuator Focusing on Nonlinear Effects: Based on Incremental Modelling and Parameter Identification Methodology


Abstract
:
1. Introduction
2. Materials and Methods
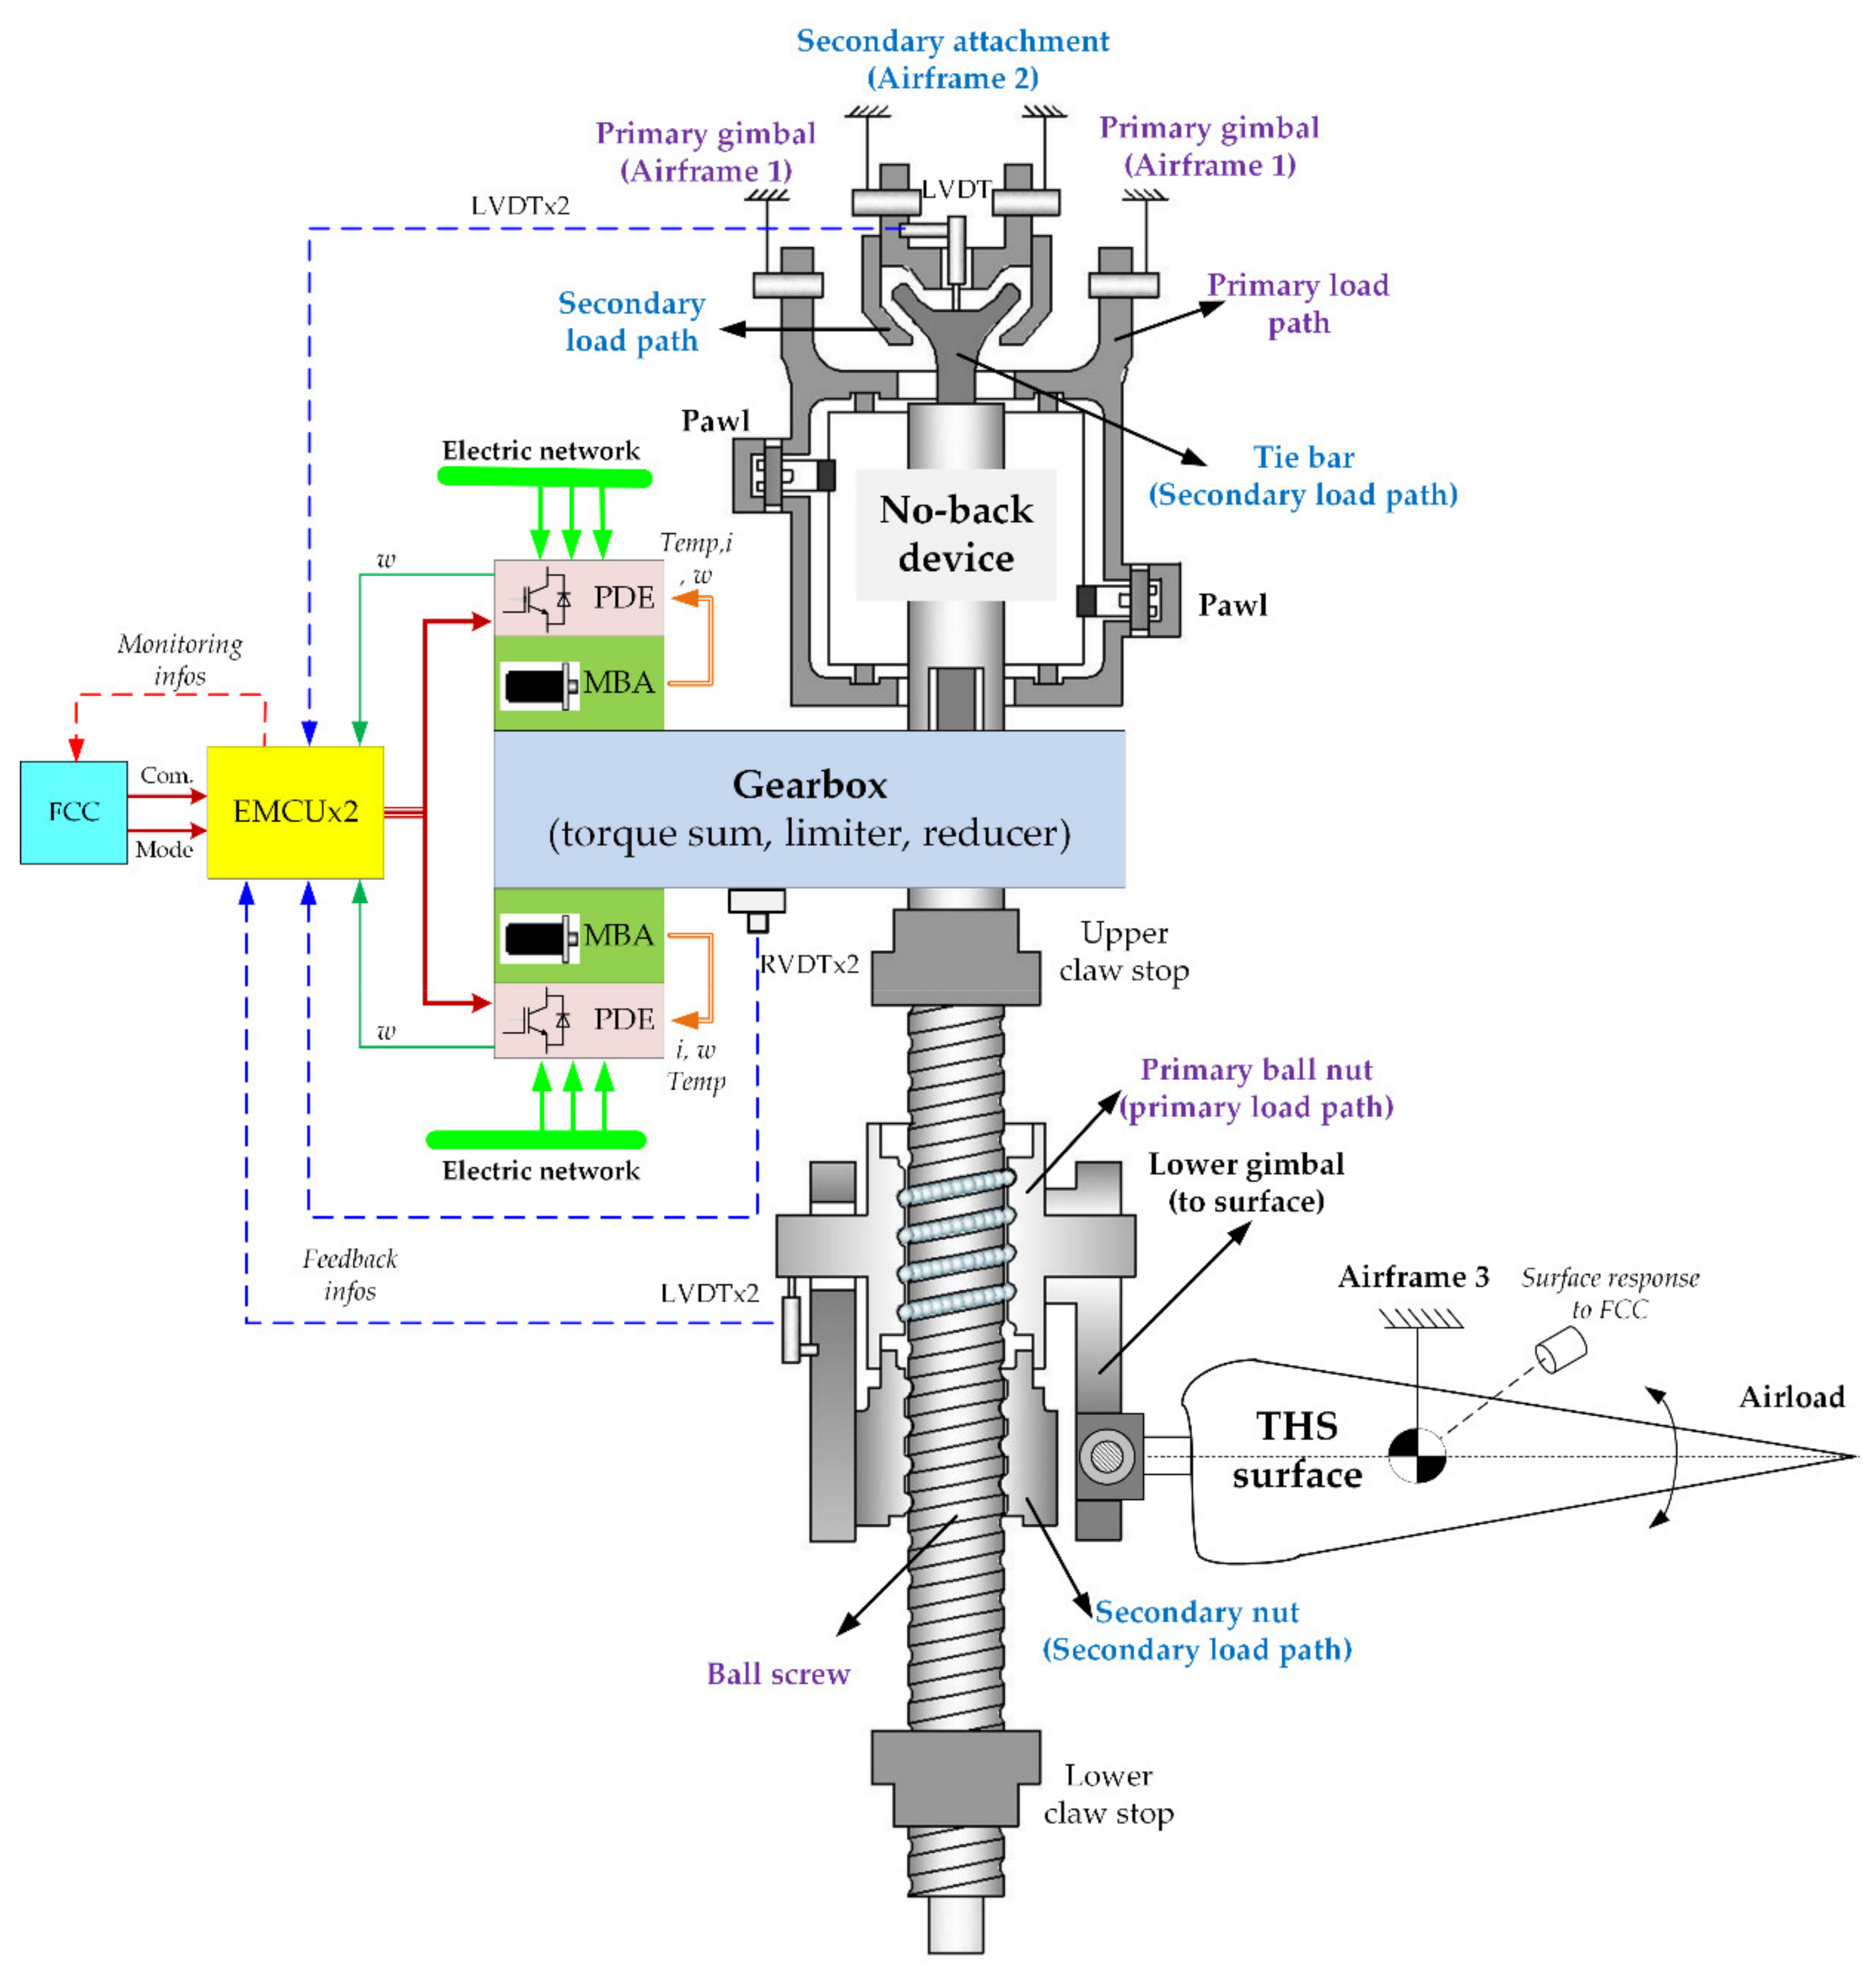
2.1. System Description
2.2. Incremental Modelling
2.2.1. Modelling Procedure
2.2.2. Modelling Hypothesis
2.2.3. Ball Screw–Nut Mechanism
- Basic model
- 2.
- Advanced model
2.2.4. Mechanical Load Path
- Overall analysis
- 2.
- Basic model
- 3.
- Advanced model
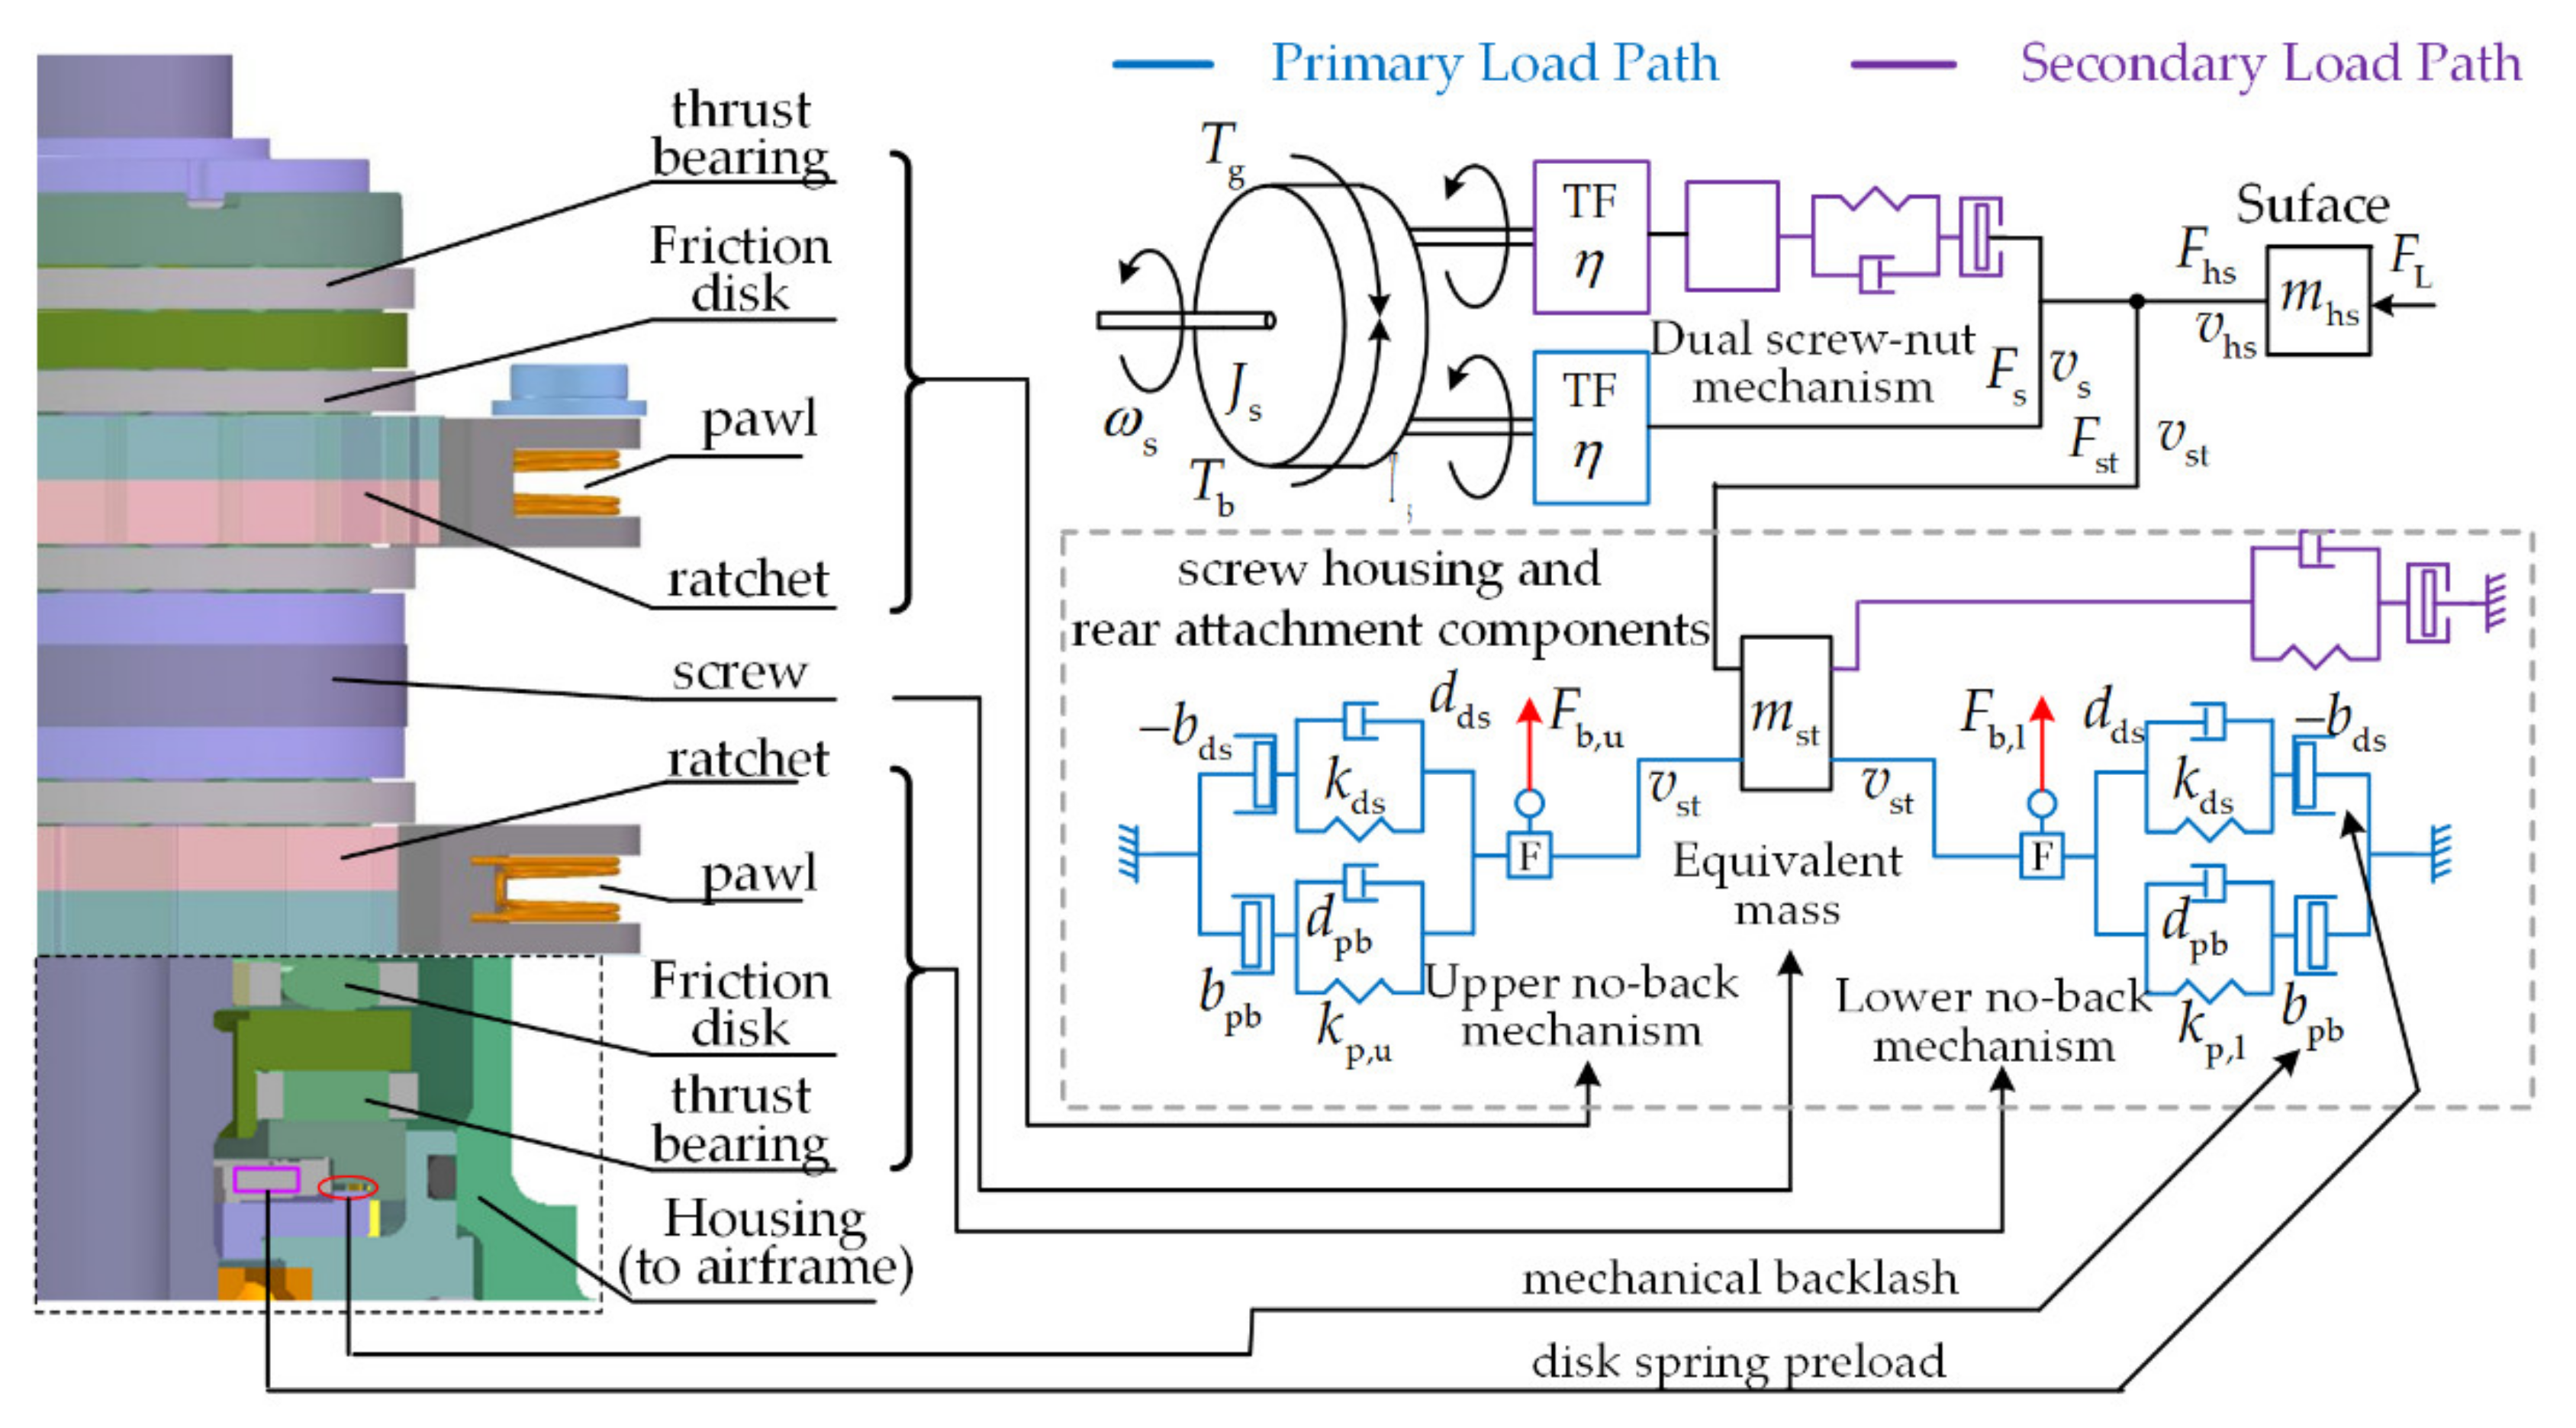
2.2.5. No-Back Mechanism
- Overall Analysis of Modelling Principle
- -
- the upper brake mechanism is axially tightly engaged and essentially no friction torque Tfr,l is developed from the lower brake mechanism in either direction, which is because the minor impact force Fb,l remains between its components;
- -
- the upper ratchet wheel is blocked by its pawl to avoid the screw revolving due to the axial force exerted by the load on the nut;
- -
- the load torque TL generated on the screw by the external load is balanced by the stick friction torque Tfr,u produced by the upper friction disks.
- 2.
- Basic model
- 3.
- Advanced model
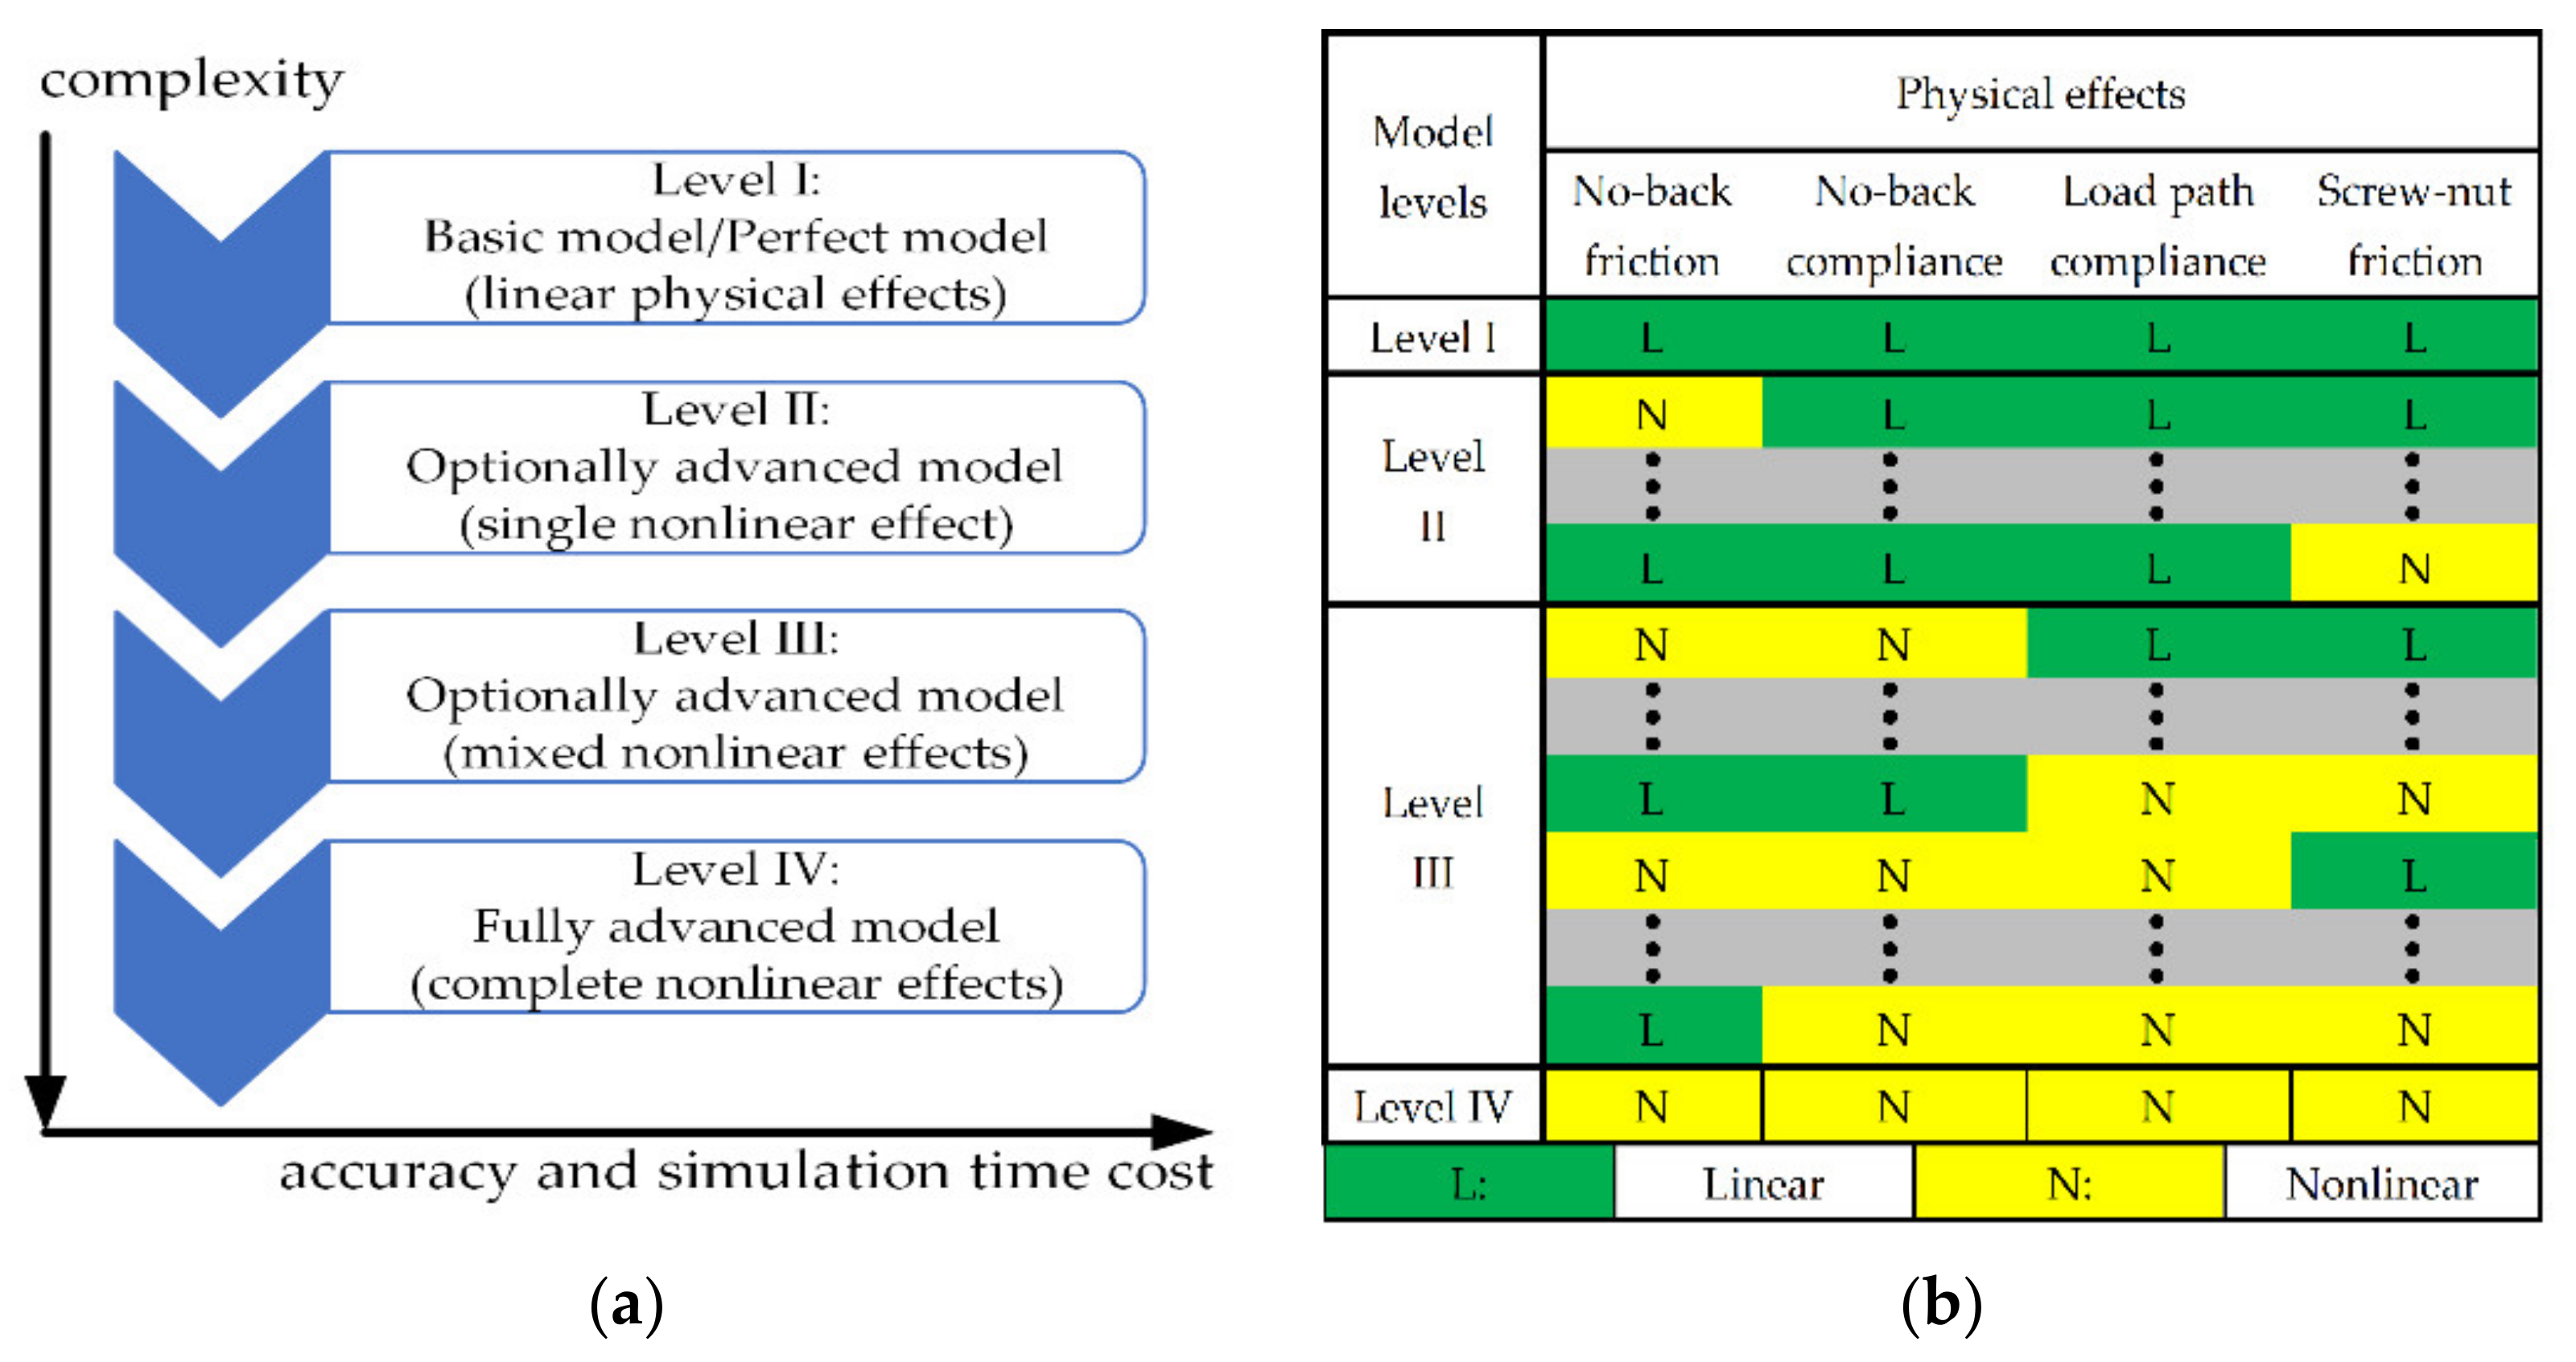
2.3. Model Selection and Test Rig Structure
2.3.1. Model Selection
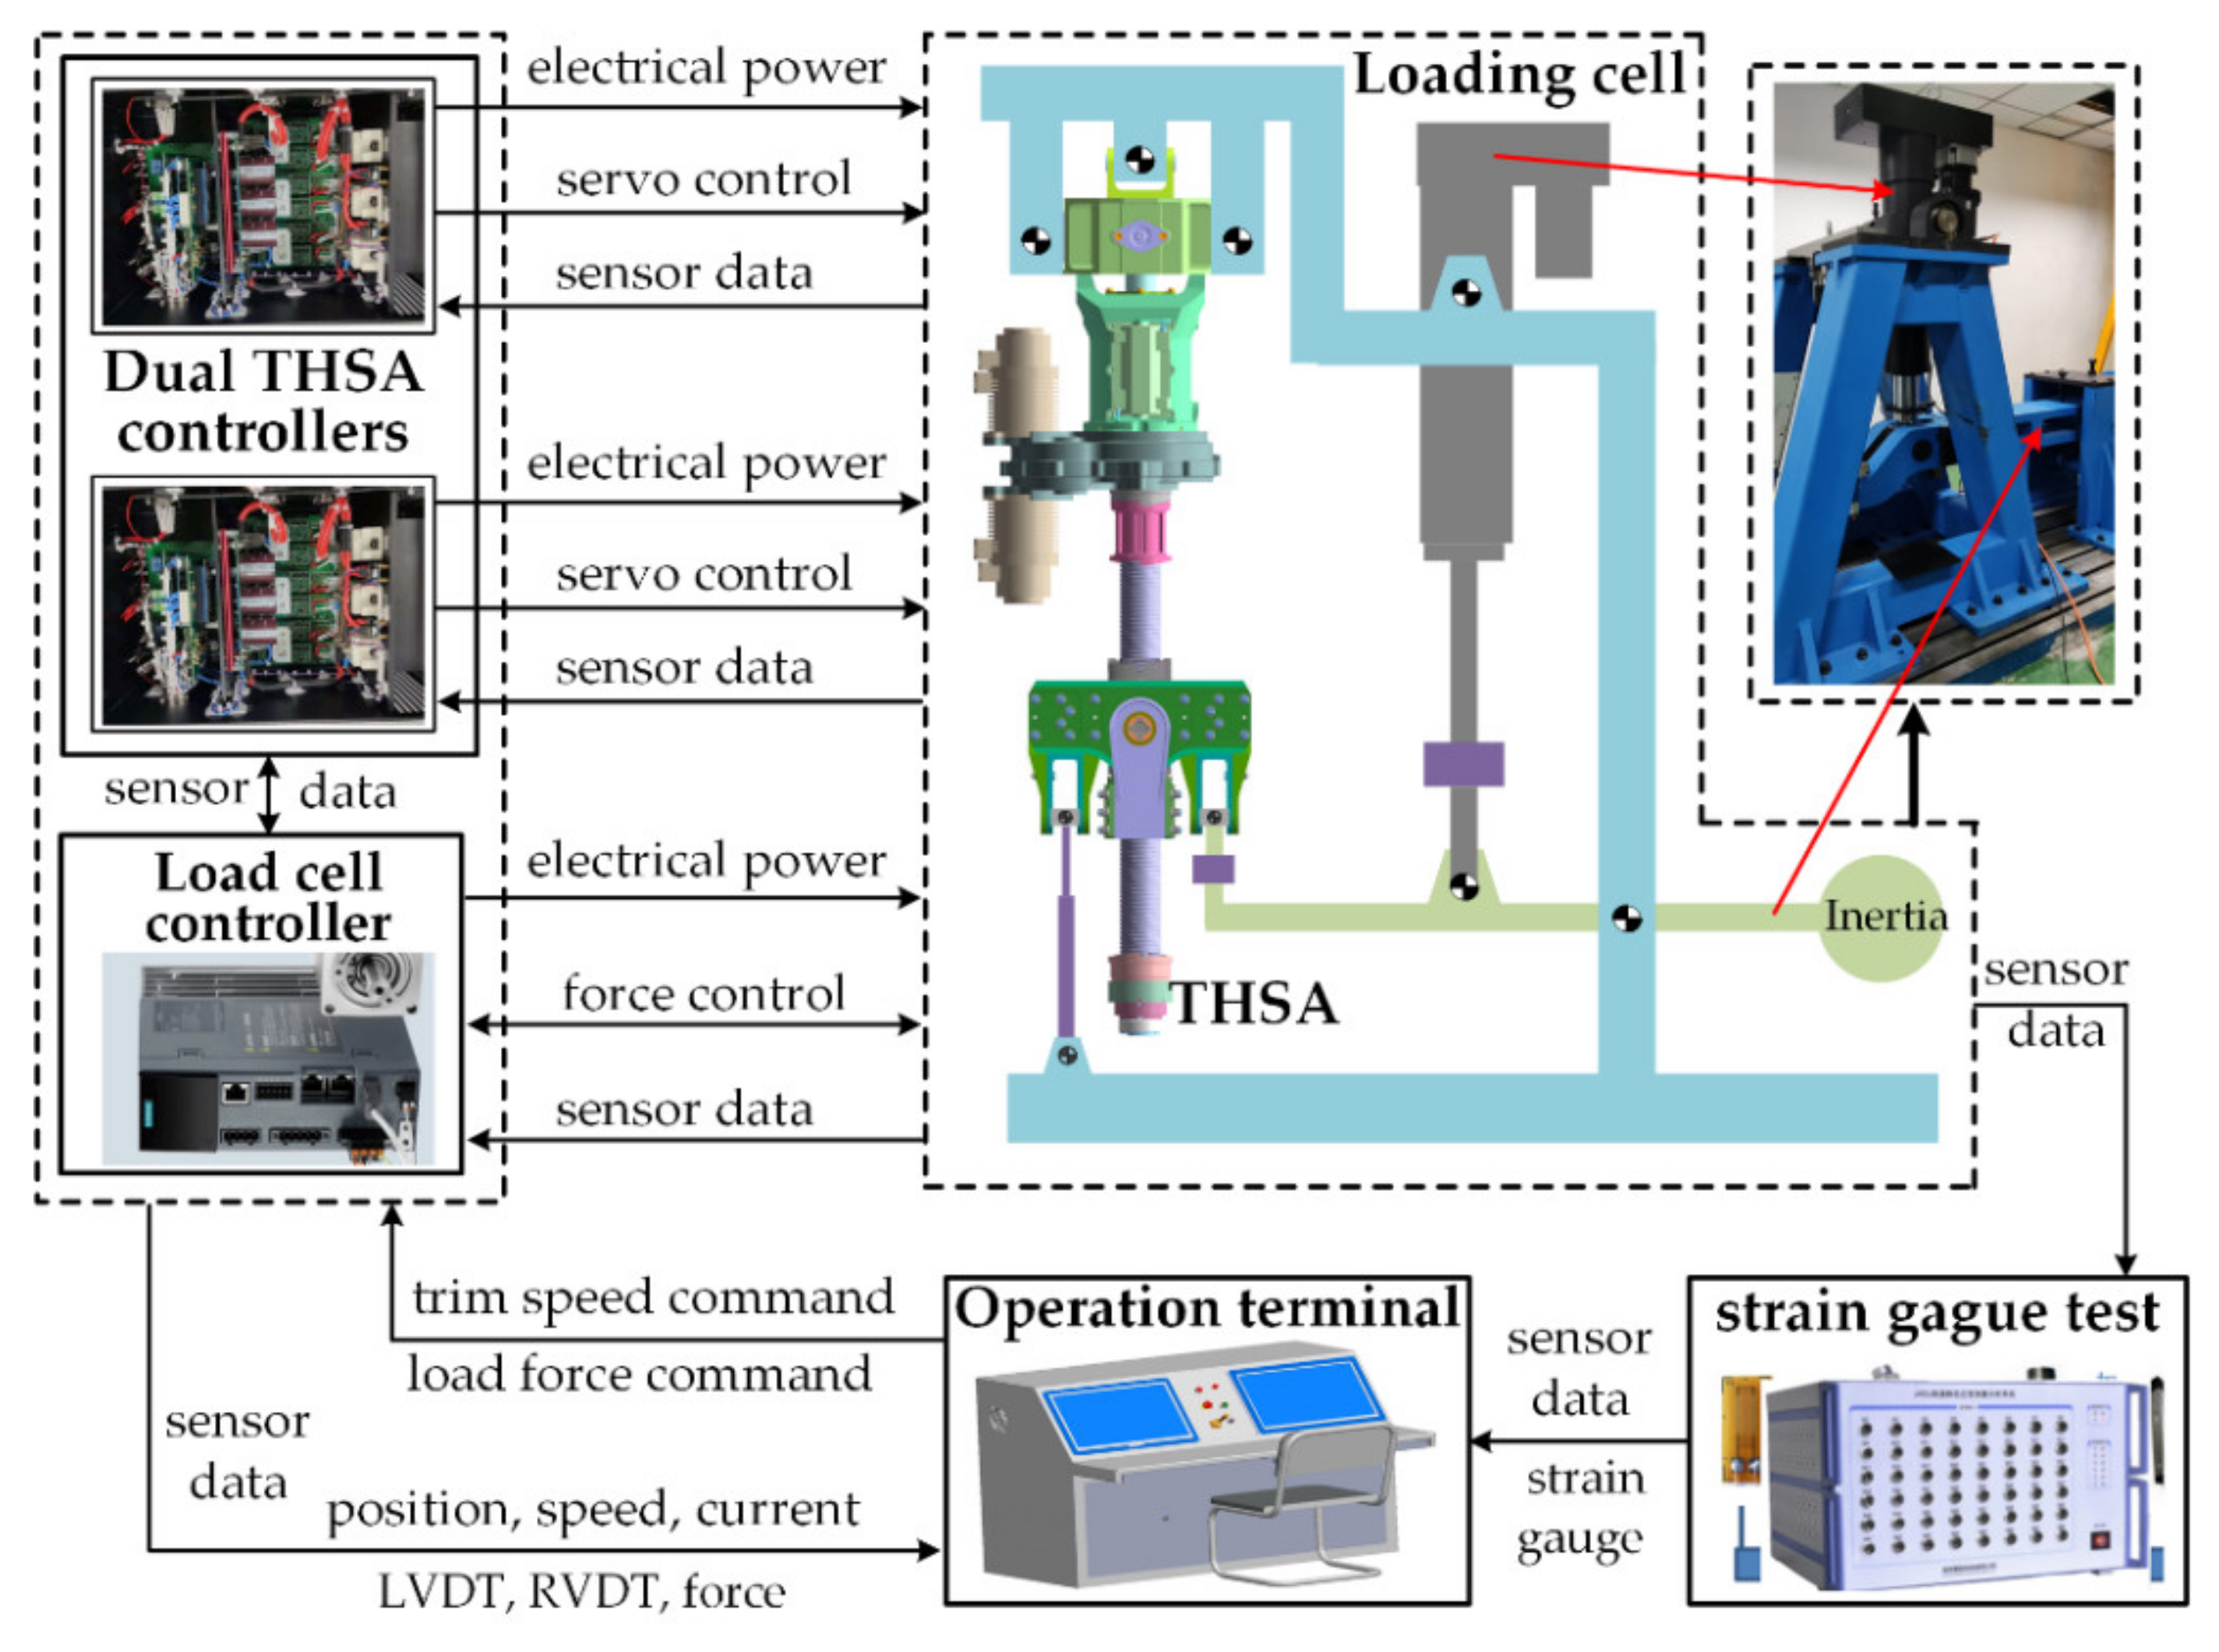
2.3.2. Test Rig Structure
3. Simulation and Experimental Results Analysis
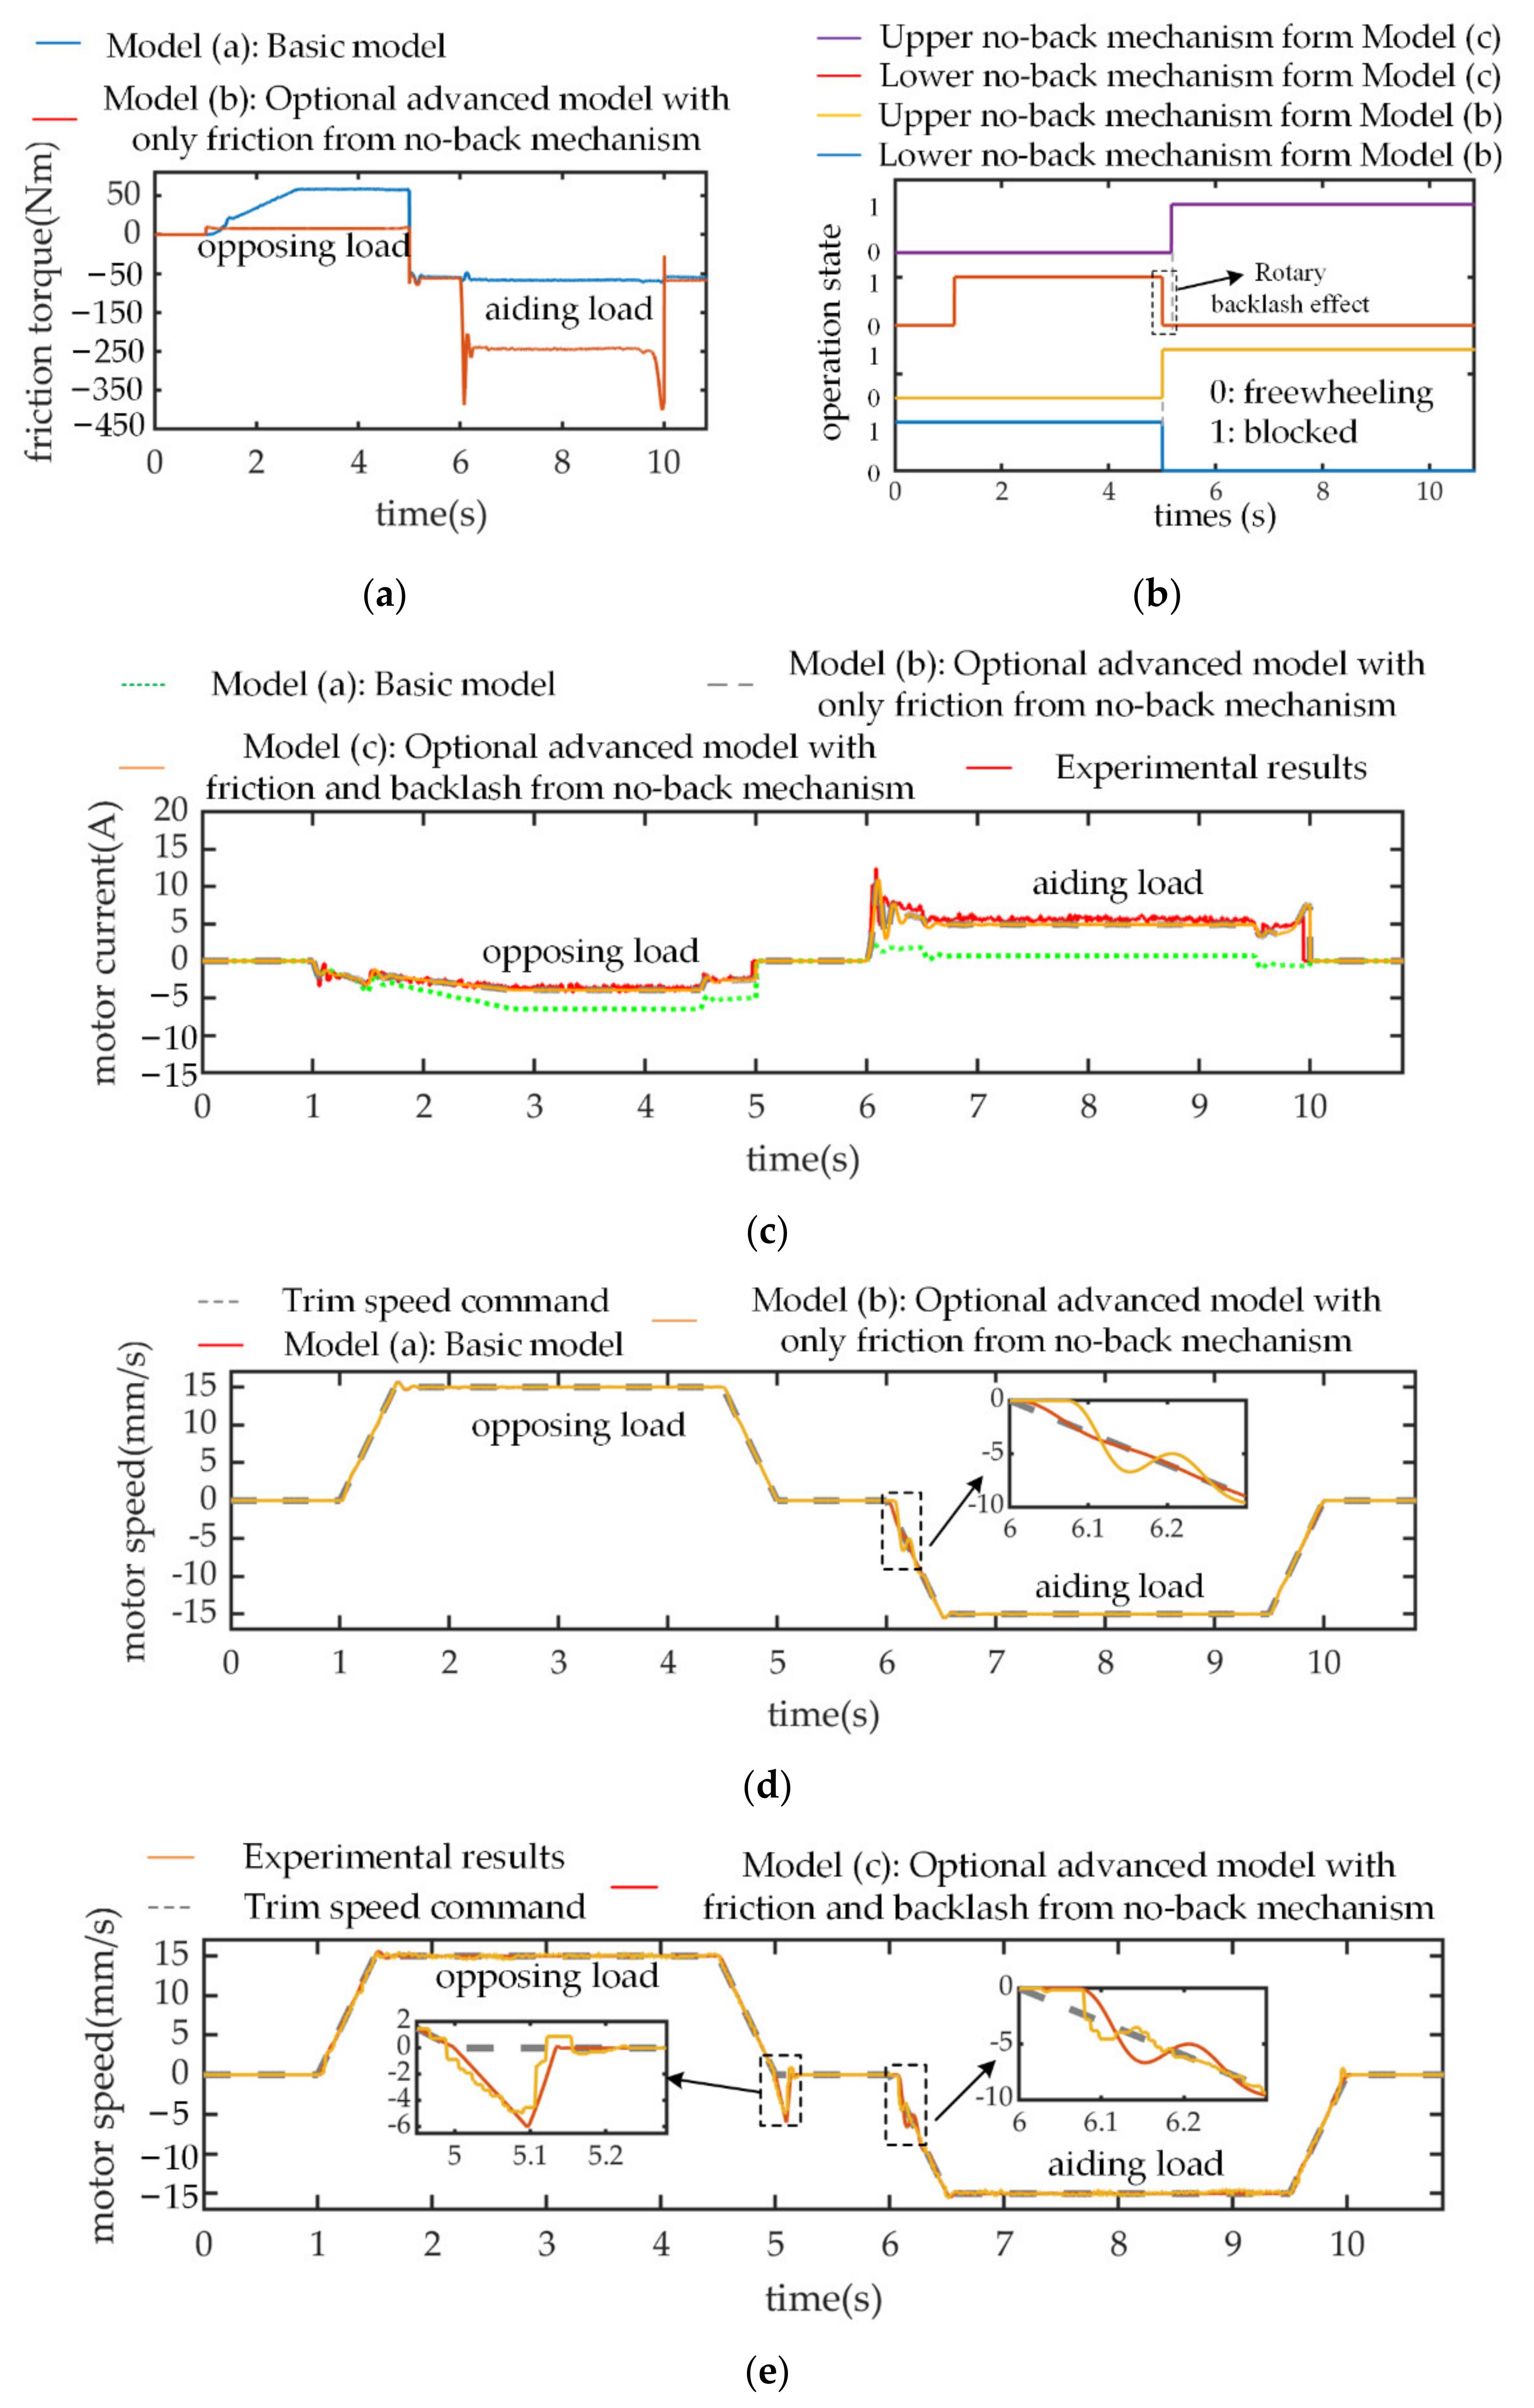
3.1. Hybrid Nonlinear Effects of No-Back Mechanism
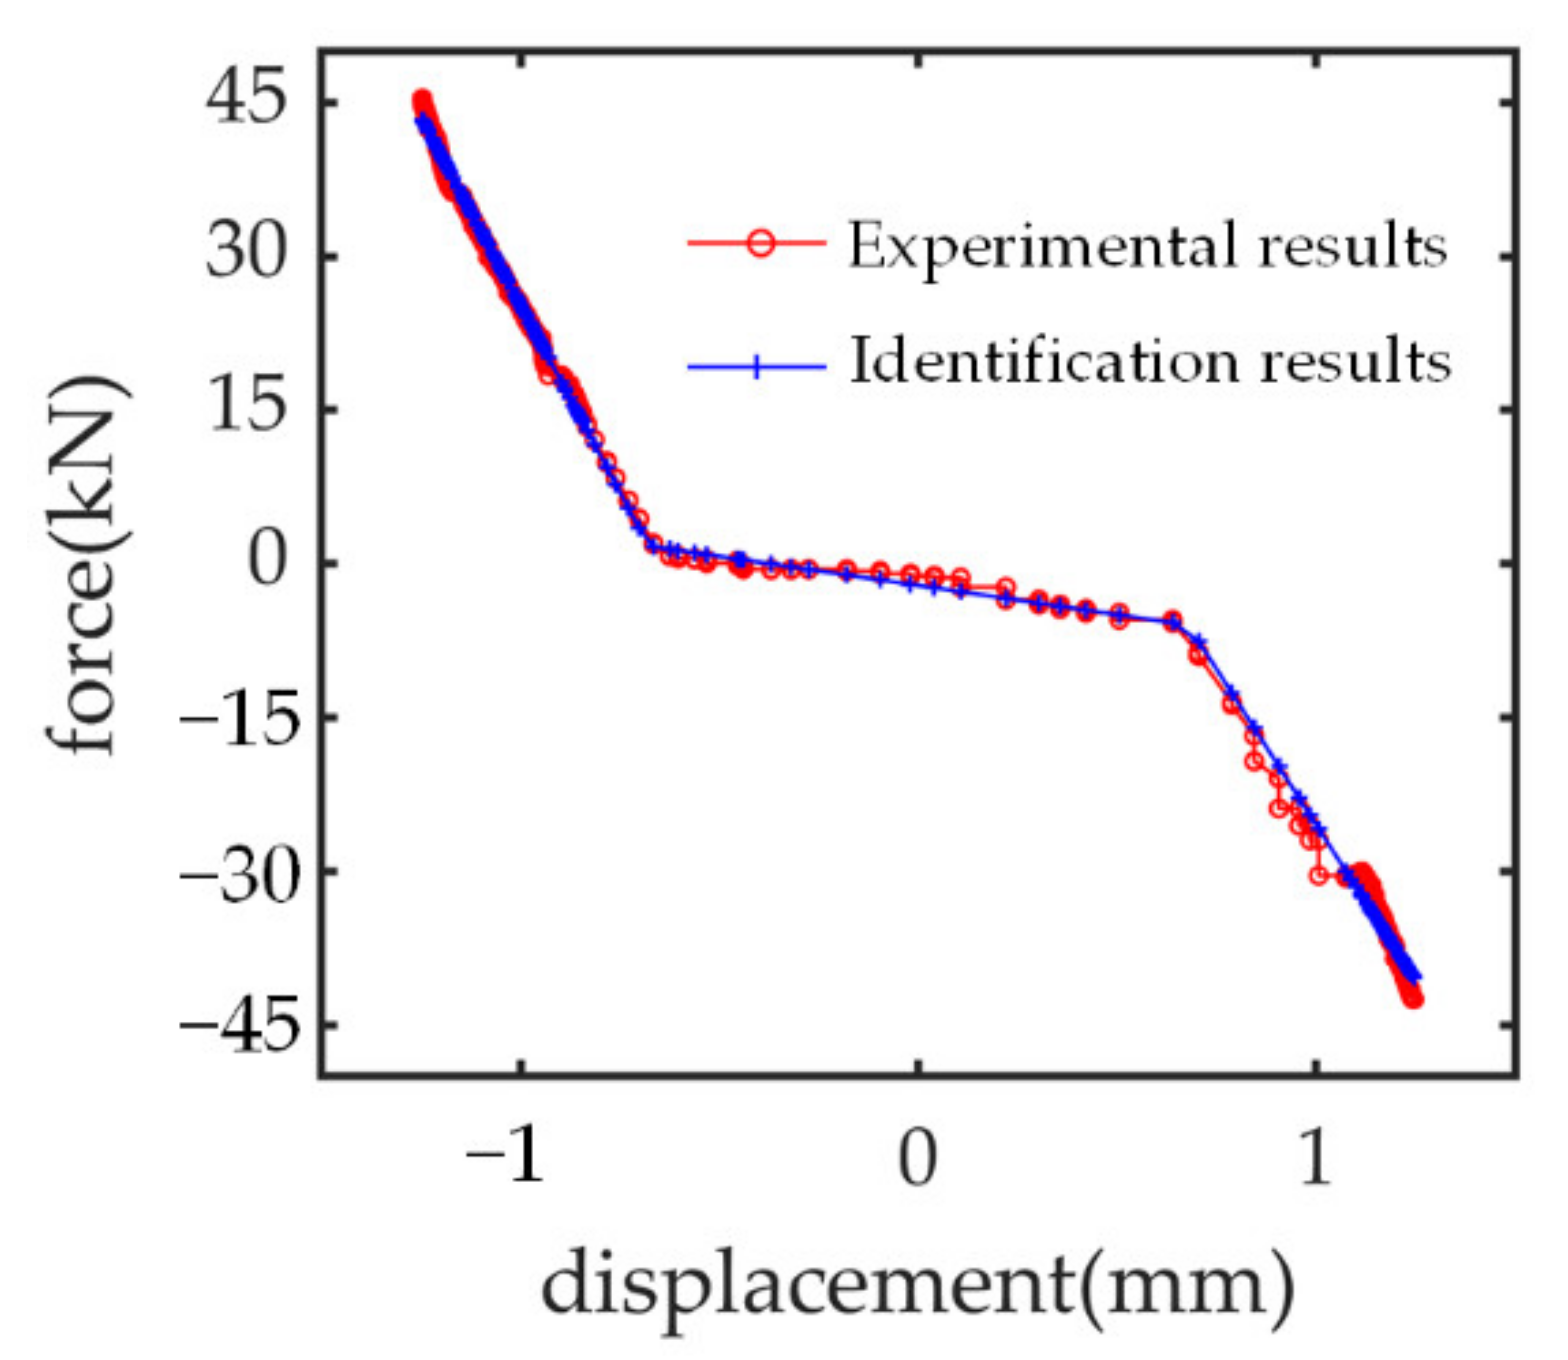
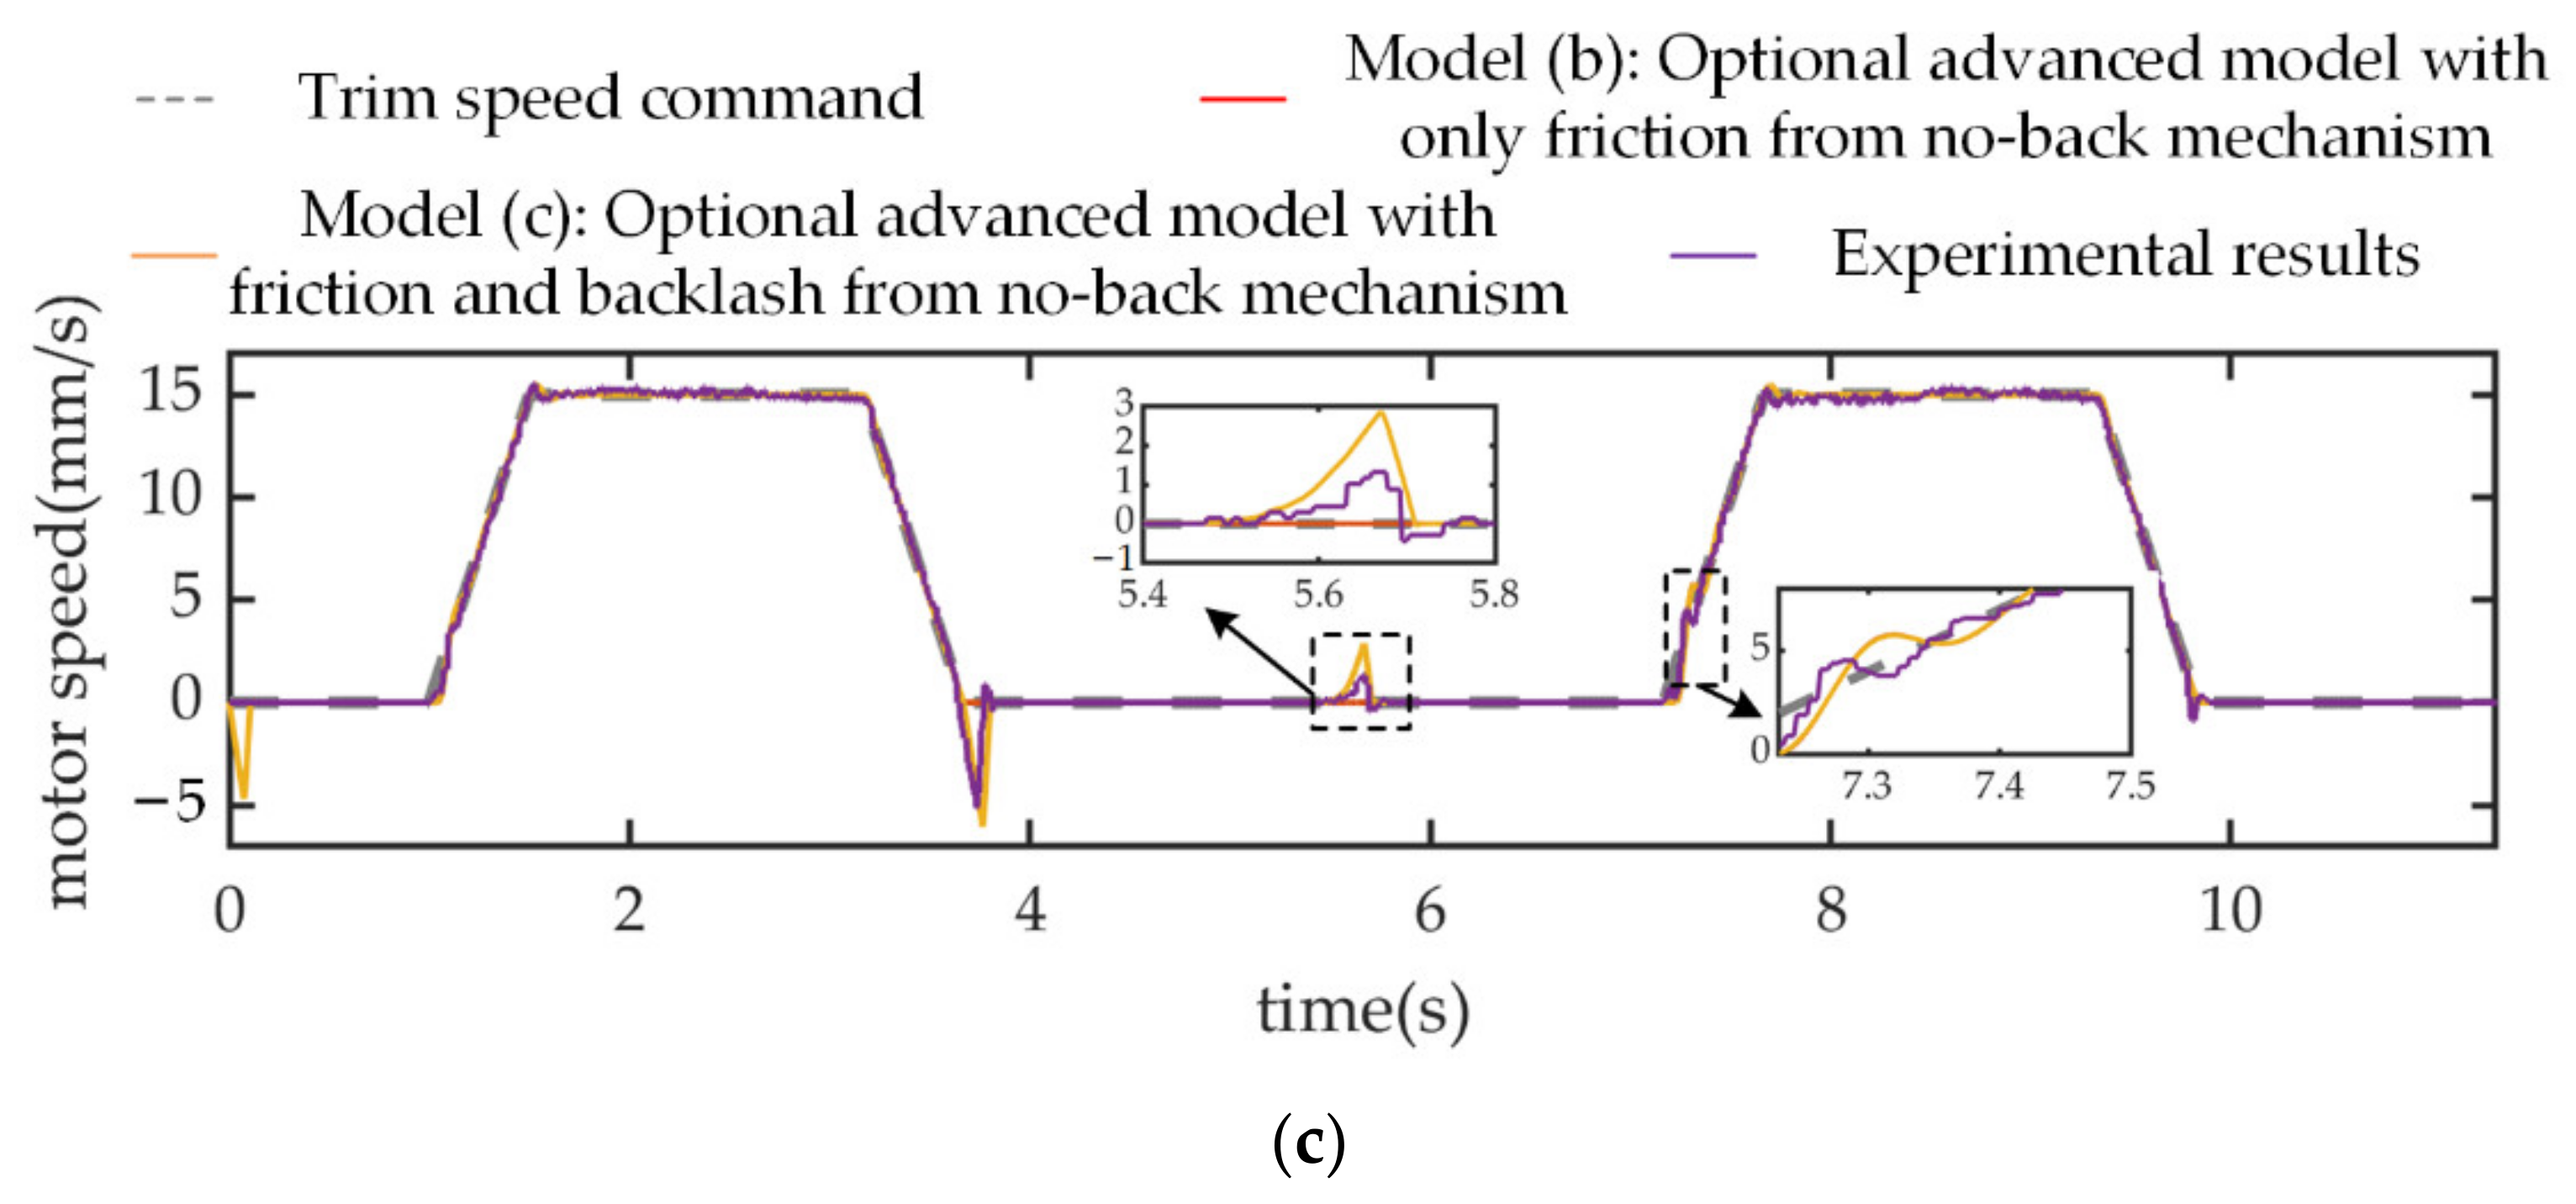
3.2. Nonlinear Compliance Effect of Mechanical Load Path
4. Conclusions
Author Contributions
Funding
Institutional Review Board Statement
Informed Consent Statement
Data Availability Statement
Conflicts of Interest
References
- Rosero, J.A.; Ortega, J.A. Moving Towards a More Electric Aircraft. IEEE Aerosp. Electron. Syst. Mag. 2007, 22, 3–9. [Google Scholar] [CrossRef] [Green Version]
- Ni, K.; Liu, Y.; Mei, Z.; Wu, T.; Hu, Y.; Wen, H.; Wang, Y. Electrical and Electronic Technologies in More-Electric Aircraft: A Review. IEEE Access 2019, 7, 76145–76166. [Google Scholar] [CrossRef]
- Botten, S.L.; Whitley, C.R.; King, A.D. Flight Control Actuation Technology for Next-Generation All-Electric Aircraft. Technol. Rev. 2000, 8, 55–68. [Google Scholar]
- Fu, J.; Mare´, J.C. Review on signal-by-wire and power-by-wire actuation for more electric aircraft. Chin. J. Aeronaut. 2017, 30, 857–870. [Google Scholar]
- Li, Y.; Jiao, Z.; Wang, Z. Design, Analysis, and Verification of an Electro-Hydrostatic Actuator for Distributed Actuation System. Sensors 2020, 20, 634. [Google Scholar] [CrossRef] [PubMed] [Green Version]
- Garcia, A.; Cusido, I.; Rosero, J.A.; Romeral, L. Reliable Electro-Mechanical Actuators in Aircraft. IEEE Aerosp. Electron. Syst. Mag. 2008, 23, 19–25. [Google Scholar] [CrossRef]
- Qiao, G.; Liu, G.; Shi, Z.; Wang, Y.; Ma, S.; Lim, T.C. A Review of Electromechanical Actuators for More/All Electric Aircraft Systems. Proc. Inst. Mech. Eng. Part C J. Eng. Mech. Eng. Sci. 2017, 232, 4128–4151. [Google Scholar] [CrossRef] [Green Version]
- Jensen, S.C.; Jenney, G.D.; Dawson, D. Flight test experience with an electromechanical actuator on the F-18 Systems Research Aircraft. In Proceedings of the 19th Digital Avionics Systems Conference (DASC), Philadelphia, PA, USA, 7–13 October 2000; pp. 1–10. [Google Scholar]
- Giangrande, P.; Galassini, A.; Papadopoulos, S.; Al-Timimy, A.; Calzo, G.L.; Degano, M.; Galea, M.; Gerada, C. Considerations on the Development of an Electric Drive for a Secondary Flight Control Electromechanical Actuator. IEEE Trans. Ind. Appl. 2019, 55, 3544–3554. [Google Scholar] [CrossRef]
- Mhenni, F.; Nguyen, N.; Choley, J.Y. SafeSysE: A Safety Analysis Integration in Systems Engineering Approach. IEEE Syst. J. 2018, 12, 161–172. [Google Scholar] [CrossRef]
- Martínez Rojas, J.A.; Fernández, J.L.; Sánchez Montero, R.; Espí, P.L.; Diez-Jimenez, E. Model-Based Systems Engineering Applied to Trade-Off Analysis of Wireless Power Transfer Technologies for Implanted Biomedical Microdevices. Sensors 2021, 21, 3201. [Google Scholar] [CrossRef] [PubMed]
- Fu, J.; Mare´, J.C.; Fu, Y. Modelling and Simulation of Flight Control Electromechanical Actuators with Special Focus on Model Architecting, Multidisciplinary Effects and Power Flows. Chin. J. Aeronaut. 2017, 30, 47–65. [Google Scholar] [CrossRef] [Green Version]
- Djeziri, M.A.; Benmoussa, S.; Sanchez, R. Hybrid Method for Remaining Useful Life Prediction in Wind Turbine Systems. Renew. Energy 2018, 116, 173–187. [Google Scholar] [CrossRef]
- SAE Aerospace. Trimmable Horizontal Stabilizer Actuator Descriptions: SAE AIR6052; SAE International: Warrendale, PA, USA, 2011; pp. 1–38. [Google Scholar]
- Johnsen, S.; Thielecke, F. Integration analysis of Trimmable Horizontal Stabilizer Actuators and Technology Evaluation. CEAS Aeronaut. J. 2011, 2, 11–19. [Google Scholar] [CrossRef]
- Balaban, E.; Bansal, P.; Stoelting, P.; Saxena, A.; Goebel, K.F.; Curran, S. A Diagnostic Approach for Electro-Mechanical Actuators in aerospace Systems. In Proceedings of the IEEE Aerospace Conference, Big Sky, MT, USA, 7–14 March 2009; pp. 1–13. [Google Scholar]
- Mare´, J.C. Electrically Signaled Actuators (Signal-by-Wire). In Aerospace Actuators Volume 2: Signal and Power by Wire, 1st ed.; ISTE Ltd.: London, UK; John Wiley & Sons, Inc.: Hoboken, NJ, USA, 2017; pp. 32–35. [Google Scholar]
- Bennett, J.W.; Mecrow, B.C.; Atkinson, D.J. Safety-Critical Design of Electromechanical Actuation Systems in Commercial Aircraft. IET Electr. Power Appl. 2009, 5, 37–47. [Google Scholar] [CrossRef]
- Luo, G.; Zhang, R.; Chen, Z.; Tu, W.; Zhang, S.; Kennel, R. A Novel Nonlinear Modeling Method for Permanent-Magnet Synchronous Motors. IEEE Trans. Ind. Electron. 2016, 63, 6490–6498. [Google Scholar] [CrossRef]
- Wang, X.; Liao, R.; Shi, C.; Wang, S. Linear Extended State Observer-Based Motion Synchronization Control for Hybrid Actuation System of More Electric Aircraft. Sensors 2017, 17, 2444. [Google Scholar] [CrossRef] [PubMed] [Green Version]
- Gomez, J.L.; Khelf, I.; Bourdon, A.; André, H.; Rémond, D. Angular Modeling of a Rotating Machine in Non-Stationary Conditions: Application to Monitoring Bearing Defects of Wind Turbines with Instantaneous Angular Speed. Mech. Mach. Theory 2019, 136, 27–51. [Google Scholar] [CrossRef]
- Karam, W.; Mare, J.C. Modelling and Simulation of Mechanical Transmission in Roller-Screw Electro-Mechanical Actuators. Aircr. Eng. Aerosp. Technol. 2009, 81, 288–298. [Google Scholar] [CrossRef]
- Lin, C.; Yau, H.; Tian, Y. Identification and Compensation of Nonlinear Friction Characteristics and Precision Control for a Linear Motor Stage. IEEE/ASME Trans. Mech. 2013, 18, 1385–1396. [Google Scholar] [CrossRef]
- Zhang, W. Parameter Identification of LuGre Friction Model in Servo System Based on Improved Particle Swarm Optimization Algorithm. In Proceedings of the Chinese Control Conference, Zhangjiajie, China, 26–31 July 2007; pp. 135–139. [Google Scholar]
- Fu, J.; Zhou, J.; Pan, J. A Firciton Property Test Rig for Firction Disk and Experimental Procedure. China Patent CN111855184A, 30 October 2020. (In Chinese). [Google Scholar]
- Richard, O.H. Friction Characteristics of Skewed Roller Brake. Ph.D. Thesis, Cranfield University, Cranfield, UK, October 1998. [Google Scholar]


| Parameter | kp,l (N/m) | kp,u (N/m) | kds (N/m) | bpb (mm) |
|---|---|---|---|---|
| values | 6.65 × 10⁷ | 5.32× 10⁷ | 1.48 × 10⁶ | 0.67 |
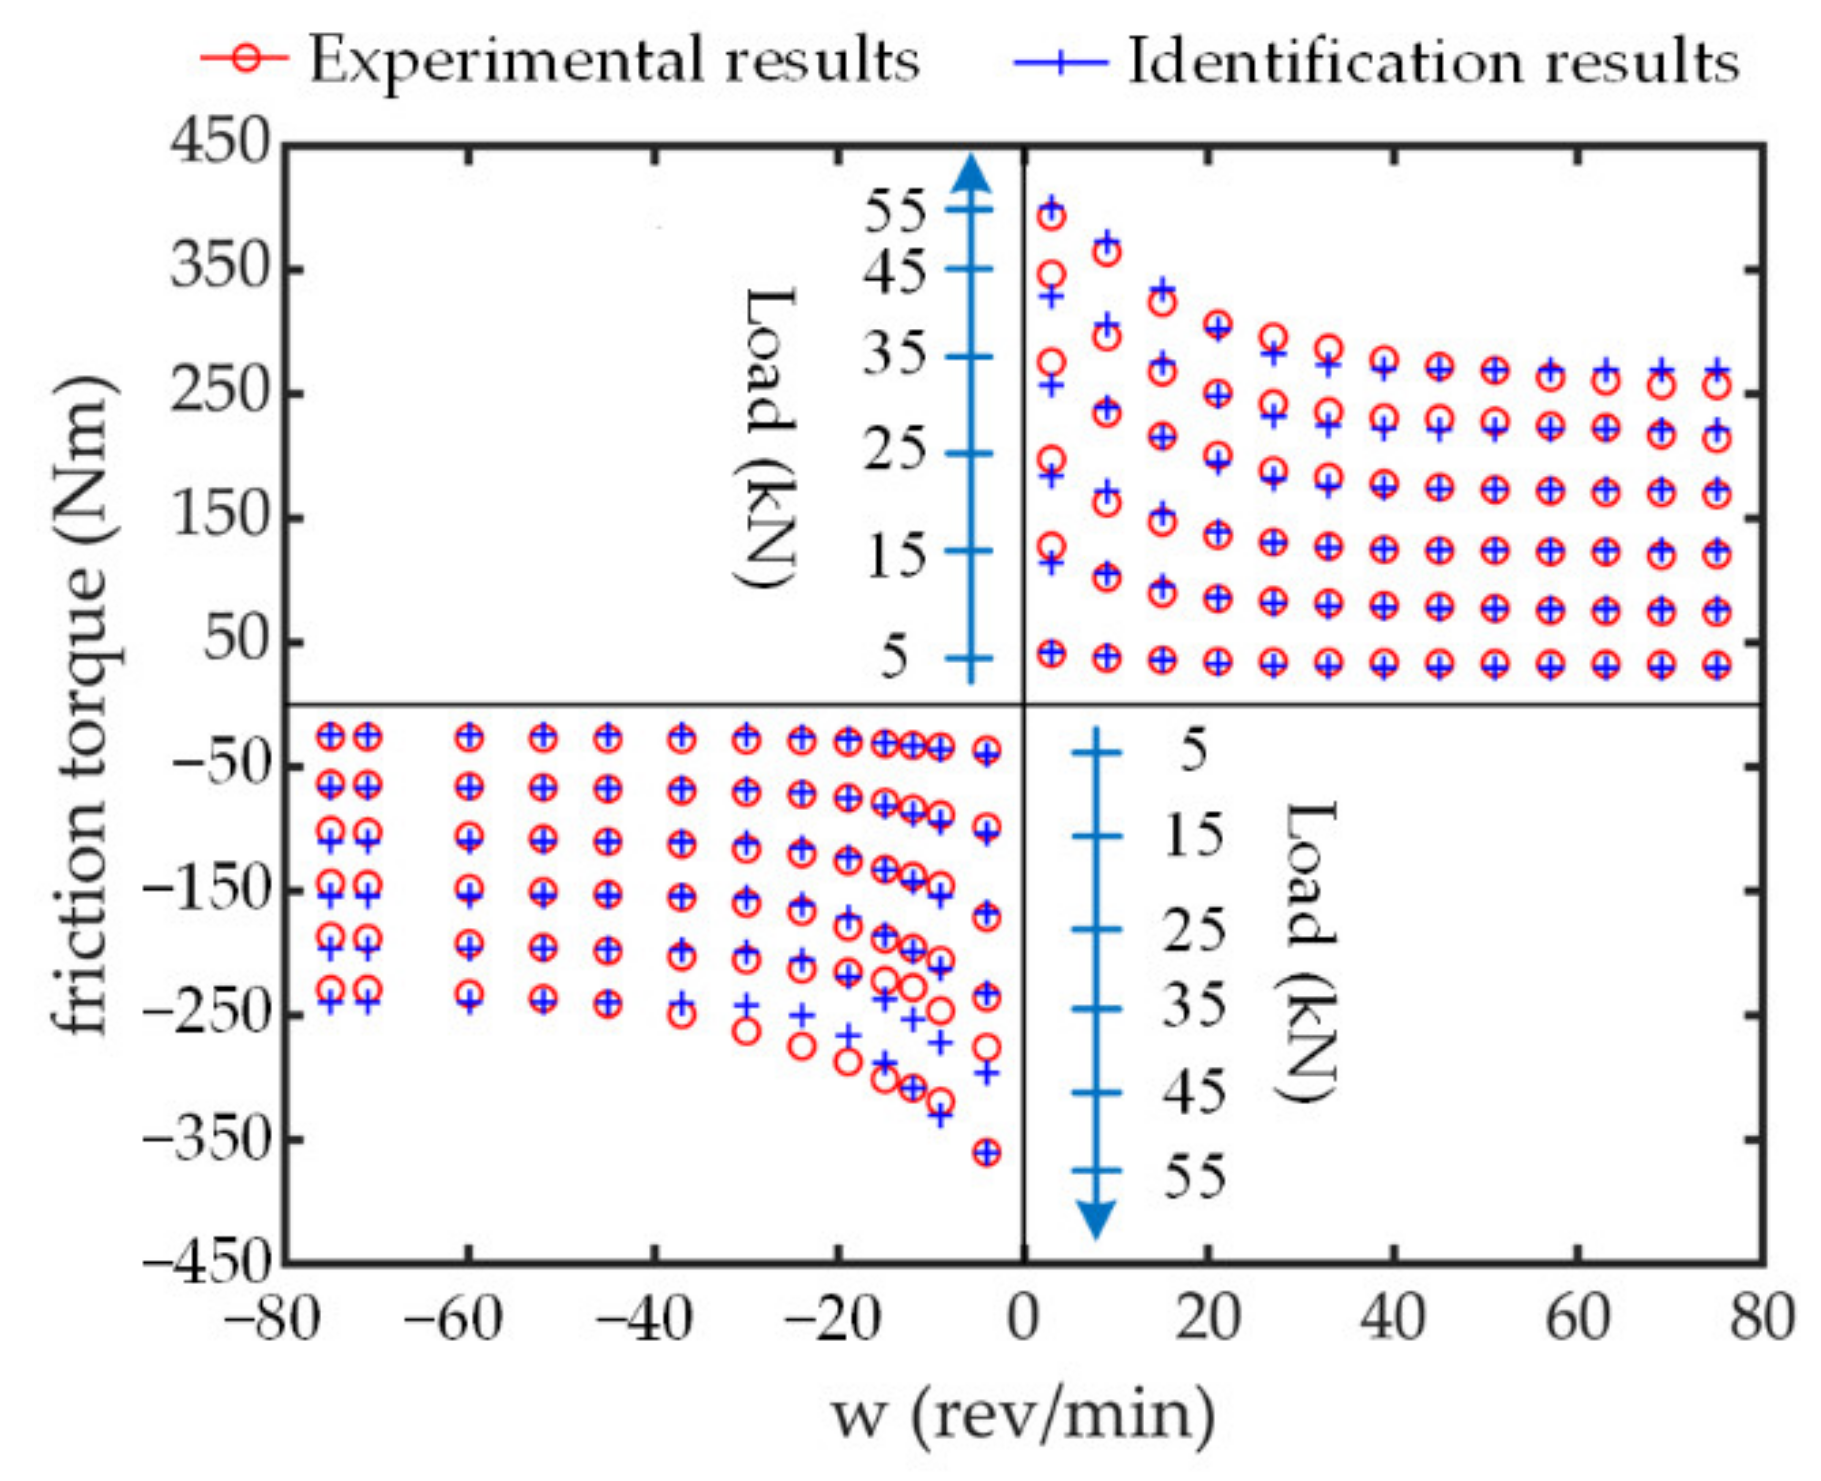
| Parameter | μs+ (Nm/N) | μc+ (Nm/N) | fs+ (Nm/(rev/min)) | ωst+ (rev/min) | μs- (Nm/N) | μc- (Nm/N) | fs- (Nm/(rev/min)) | ωst (rev/min) |
|---|---|---|---|---|---|---|---|---|
| values | 0.0072 | 0.0048 | 0 | 17.62 | 0.0066 | 0.0043 | 0 | 15.15 |
| Symbol | Item | Value | Symbol | Item | Value |
|---|---|---|---|---|---|
| Jm | Inertia of rotor | 1.8 × 10⁻⁴ kg × m2 | i | Total gear ratio | 65.61 |
| Rs | Stator resistance | 1.23 | p | Lead of screw | 12 mm |
| Ls | Stator inductance | 2.25 mH | Js | Screw shaft inertia | 0.09 kg × m2 |
| Ps | Pole pairs | 3 | mst | Load path equivalent mass | 80 kg |
| Ψf | Permanent flux linkage | 0.072 wb | mhs | Equivalent mass of surface | 350 kg |
| Imax | Maximum phase current | 15 A | Fp | No-back preload force | 3000 N |
| Tn | Motor rated torque | 1.9 Nm | θbmax | No-back maximum backlash | 8.57 degree |
| Udc | DC bus voltage of PDE | 270 V | Jrw | Ratchet wheel inertia | 3 × 10⁻³ kg × m2 |
Publisher’s Note: MDPI stays neutral with regard to jurisdictional claims in published maps and institutional affiliations. |
© 2021 by the authors. Licensee MDPI, Basel, Switzerland. This article is an open access article distributed under the terms and conditions of the Creative Commons Attribution (CC BY) license (https://creativecommons.org/licenses/by/4.0/).
Share and Cite
Zhang, W.; Fu, J.; Fu, Y.; Zhou, J.; Han, X. System Performance Analysis for Trimmable Horizontal Stabilizer Actuator Focusing on Nonlinear Effects: Based on Incremental Modelling and Parameter Identification Methodology. Sensors 2021, 21, 6464. https://doi.org/10.3390/s21196464
Zhang W, Fu J, Fu Y, Zhou J, Han X. System Performance Analysis for Trimmable Horizontal Stabilizer Actuator Focusing on Nonlinear Effects: Based on Incremental Modelling and Parameter Identification Methodology. Sensors. 2021; 21(19):6464. https://doi.org/10.3390/s21196464
Chicago/Turabian StyleZhang, Wensen, Jian Fu, Yongling Fu, Jinlin Zhou, and Xudong Han. 2021. "System Performance Analysis for Trimmable Horizontal Stabilizer Actuator Focusing on Nonlinear Effects: Based on Incremental Modelling and Parameter Identification Methodology" Sensors 21, no. 19: 6464. https://doi.org/10.3390/s21196464
APA StyleZhang, W., Fu, J., Fu, Y., Zhou, J., & Han, X. (2021). System Performance Analysis for Trimmable Horizontal Stabilizer Actuator Focusing on Nonlinear Effects: Based on Incremental Modelling and Parameter Identification Methodology. Sensors, 21(19), 6464. https://doi.org/10.3390/s21196464