Article

Highly Sensitive Amperometric Detection of Hydrogen Peroxide in Saliva Based on N-Doped Graphene Nanoribbons and MnO2 Modified Carbon Paste Electrodes

1
Department of Chemistry and Biochemistry, Faculty of Chemistry and Chemical Technology, University of Ljubljana, Večna pot 113, 1000 Ljubljana, Slovenia
2
Department of Analytical Chemistry, Insistute of Chemistry, University of Graz, Universitätsplatz 1, 8020 Graz, Austria
3
Department of Chemical Engineering and Technical Safety, Faculty of Chemistry and Chemical Technology, University of Ljubljana, Večna pot 113, 1000 Ljubljana, Slovenia
*
Authors to whom correspondence should be addressed.
Sensors 2021, 21(24), 8301; https://doi.org/10.3390/s21248301
Submission received: 23 November 2021 / Revised: 6 December 2021 / Accepted: 10 December 2021 / Published: 11 December 2021
(This article belongs to the Special Issue Graphene-Based Sensors: Design, Development and Application)

Abstract

:
Four different graphene-based nanomaterials (htGO, N-htGO, htGONR, and N-htGONR) were synthesized, characterized, and used as a modifier of carbon paste electrode (CPE) in order to produce a reliable, precise, and highly sensitive non-enzymatic amperometric hydrogen peroxide sensor for complex matrices. CPE, with their robustness, reliability, and ease of modification, present a convenient starting point for the development of new sensors. Modification of CPE was optimized by systematically changing the type and concentration of materials in the modifier and studying the prepared electrode surface by cyclic voltammetry. N-htGONR in combination with manganese dioxide (1:1 ratio) proved to be the most appropriate material for detection of hydrogen peroxide in pharmaceutical and saliva matrices. The developed sensor exhibited a wide linear range (1.0–300 µM) and an excellent limit of detection (0.08 µM) and reproducibility, as well as high sensitivity and stability. The sensor was successfully applied to real sample analysis, where the recovery values for a commercially obtained pharmaceutical product were between 94.3% and 98.0%. Saliva samples of a user of the pharmaceutical product were also successfully analyzed.

1. Introduction

Hydrogen peroxide (H2O2) is a byproduct in numerous enzymatic processes and in energy conversion devices (fuel cells and Li-air batteries) that utilize the oxygen reduction reaction (ORR). It is widely used as an antimicrobial agent in hygiene and disinfection products, as well as a preservative in food, making it an important analyte in analytical chemistry. Therefore, accurate and precise determination of H2O2 using rapid, reliable, and cost-effective approaches is of great importance. Many techniques have been developed for H2O2 determination, such as chromatography [1,2,3], chemiluminescence [4], colorimetry [5,6], and titrimetric analysis [7]. However, the above methods are low-throughput and are often considered complex, expensive, and time consuming. In recent years, many electrochemical approaches have been developed to determine low concentrations of H2O2 in a high-throughput fashion–in fast, simple, reliable, and inexpensive ways [8,9]. Electrochemical sensors are generally suitable for various matrices, do not require many sample preparation steps, and exhibit high sensitivity and wide concentration range, as well as a low limit of detection (LOD). Both enzymatic [10,11] and non-enzymatic [12,13] sensors have been developed in order to detect H2O2. While enzymatic approaches do exhibit excellent selectivity and sensitivity, they usually lack stability. Further, the enzyme immobilization process is usually complex and expensive, and the enzyme activity is highly dependent on experimental conditions, such as temperature and pH. Therefore, the development of non-enzymatic electrochemical H2O2 sensors is of great interest.
Carbon paste electrodes (CPE) are often used as electrode materials in the development of new sensing platforms because they are robust and can be easily and reproducibly fabricated, have low residual currents in a wide potential window, and offer many possibilities for modification [14]. Various nanomaterials have been used to modify CPE for electrocatalytic H2O2 detection. Prussian blue, for example, shows high catalytic activity towards H2O2 [15,16]. However, these electrodes exhibit poor stability and their performance is highly pH dependent [17]. Metallic catalysts, Pt, Cu or Ag, have also been used to determine H2O2 either by oxidation or reduction. They show high activity towards H2O2, as well as improved stability compared to Prussian blue electrodes, but their application is limited due to their relatively high prices [18,19,20]. Metal oxides, such as FeO, CuO, Fe3O4, and MnO2 proved to be sufficient alternatives since they are thermally and chemically stable, abundant in nature, and environmentally friendly. In particular, manganese oxides have been found to be the most appropriate materials to apply for H2O2 sensing because of their outstanding catalytic activity towards the decomposition of H2O2 [19,20,21,22]. Recently, non-metallic nanomaterials, especially graphene-based, have attracted interest in sensing applications due to their superior properties. H2O2 is often used in substantial concentrations in oral hygiene (up to approximately 3%) and teeth whitening (up to 10%) products [23]. Since H2O2 is known to cause toxicity at the site of contact as well as to form hydroxyl radicals, whose activity can lead to DNA damage and cell death [24], it is important to assess whether the use of oral hygiene and teeth whitening products is a cause for concern. In this work, an over-the-counter oral hygiene product was analyzed. Additionally, residual content of H2O2 in saliva after the use of the hygiene product was determined.
Graphene, a two-dimensional monoatomic layer of carbon atoms, has been widely used in electrochemistry due to its large surface area, mechanical stiffness, high thermal conductivity, biocompatibility, ease of functionalization, wide potential window, and fast electron transport [25]. Various combinations of graphene (and other carbon nanomaterials) with metal oxides have been reported to positively influence sensing of different analytes. Graphene nanoribbons (GNR), essentially narrow strips of graphene, are quasi-1D carbon allotrope, which are believed to have numerous advantages over graphene due to their peculiar electronic structure and morphology (high aspect ratio compared to 2D materials), such as band gap opening and higher chemical and electrochemical reactivity [26]. Doping of graphene materials with nitrogen is reported to further enhance the electrochemical activity, adsorption and activation of analytes, promote charge transfer, and facilitate further modifications when used in electrochemical sensors [25,27].
The number of works that report the use of quasi-1D graphene-based nanomaterials in electrochemical sensors is increasing, however, GNR are still poorly researched in the H2O2 sensor development. This work is one of the few reported [12,28,29] that use this type of material for sensor development. According to the extensive literature review, it is the first work that uses N-doped GNR in combination with MnO2 to develop a sensor for trace concentrations of H2O2. The authors claim that the sensor described below has such a low LOD and high sensitivity precisely because of the use of N-doped GNR. The main objective of this work was to develop a highly sensitive, simple, and reliable non-enzymatic H2O2 sensor using the optimal combination of synthesized graphene-based nanomaterials and MnO2. Modified CPE were tested and optimized to obtain a sensor with desirable properties, and the first steps towards real sample analysis were taken.

2. Materials and Methods

2.1. Chemicals and Solutions

Buffer solutions were prepared by weighing Na2HPO4 and NaH2PO4 (both Sigma-Aldrich, Darmstadt, Germany) in the appropriate ratio and dissolving them in ultrapure water with resistivity of >18.2 MΩ/cm (Millipore/MilliQ system; MQ) to obtain a 0.1 M buffer solution with a pH of 7.41. Thus prepared, phosphate buffer (PB) was used as a medium for all other solutions. All chemicals used for solutions were obtained commercially and were of analytical reagent grade. H2O2 solutions used for measurements were prepared daily by diluting the commercially obtained 30 wt % H2O2 (Sigma-Aldrich, Darmstadt, Germany), which was also standardized with KMnO4 titration prior to use.

2.2. Synthesis of Graphene-Based Nanomaterials

Heat-treated graphene oxide (htGO) and nitrogen-doped heat-treated graphene oxide (N-htGO) were prepared from graphite powder (Timrex KS6L, Tuscon, AZ, USA), while heat-treated graphene oxide nanoribbons (htGONR) and nitrogen-doped heat-treated graphene oxide (N-htGONR) were prepared from multi-walled carbon nanotubes (MWCNTs) (M-grade MWCNTs, NanoTechLabs, Yadkinville, NC, USA). H2SO4 (ACS reagent, 95.0–98.0%, Sigma-Aldrich, Darmstadt, Germany), H3PO4 (ACS reagent, ≥85 wt % in H2O, Sigma-Aldrich, Darmstadt, Germany), KMnO4 (ACS reagent ≥ 99%, Sigma-Aldrich, Darmstadt, Germany), HCl (ACS reagent, 37%, Sigma-Aldrich, Darmstadt, Germany) and H2O2 (ACS reagent, 30 wt %, Sigma-Aldrich, Darmstadt, Germany) were all used as reagents in the synthesis of graphene-based nanomaterials. Firstly, graphene oxide (GO) and graphene oxide nanoribbons (GONR) were prepared according to an improved Hummer’s method [30] using graphite or MWCNTs (20 g), concentrated H2SO4 and H3PO4 in 9:1 volume ratio and six aliquots of 20 g KMnO4 to oxidize the starting materials. After 10 days of continuous stirring, the reaction was quenched with 800 mL ice and 15 mL 30 vol % H2O2. The reaction mixture was centrifuged and thoroughly washed with 10 % HCl and MQ, then freeze-dried. Secondly, GO and GONR were heat-treated in (a) N2 atmosphere (30 mL/min flow) to obtain htGO and htGONR, (b) in NH3 atmosphere (30 mL/min flow) to obtain N-htGO and N-htGONR. The synthesized materials were characterized by scanning electron microscopy (SEM) using a field emission electron microscope Zeiss ULTRA plus SEM (Cazl Zeiss NTS Ltd., Oberkochen, Germany), Brunauer–Emmett–Teller (BET) analysis using an ASAP 2020 Micrometrics instrument (Micrometrics, Norcross, GA, USA), X-ray photoelectron spectroscopy (XPS) using a PHI Quantera SXM photoelectron spectrometer analyzer (PHI, Chanhassen, MN, USA), C, H, N analysis using PerkinElmer CHN Analyzer 2400 II (PerkinElmer, Rodgau, Germany), Raman spectroscopy using Raman/AFM WITec Alpha 300RAS instrument (WITec, Ulm, Germany), and ICP–MS using an ICP–MS Agilent Technologies 7900 instrument (Agilent Technologies Ltd., Santa Clara, CA, USA). For more details regarding XPS and Raman analyses please see Supporting Information pg. S1–S2. The syntheses and characterization procedures are described in more detail in our previous work [31].

2.3. Preparation of the Electrode Surface

Carbon pastes were prepared from graphite powder (synthetic; <20 µm; Sigma-Aldrich, Germany) and silicone oil AP 100 (Sigma-Aldrich, Darmstadt, Germany): 1.0 g of graphite powder was thoroughly mixed with 950 µL silicone oil in the agate mortar until a homogeneous paste was obtained and stored in a sealed refrigerated container until use. CPE were prepared by packing the prepared paste into a circular Teflon holder with 8 mm diameter and polishing the surface.
Synthesized nanomaterials were ultrasonically dispersed in 50% ethanol for 90 min. One milligram/milliliter dispersions of each graphene-based nanomaterial and MnO2 (<1 µm; Sigma-Aldrich, Darmstadt, Germany), respectively, were prepared. Appropriate volumes of a chosen graphene-based nanomaterial and MnO2 dispersions were mixed together with neutralized Nafion (Perfluorinated resin solution containing Nafion® 1100W; Sigma-Aldrich, Darmstadt, USA) and 5 mg/mL solution of glycerol (Sigma-Aldrich, Darmstadt, Germany). Obtained mixture was again sonicated for 30 min before drop-casting two 10 µL layers of the mixture onto the CPE surface. Different dispersions were prepared by systematically changing the concentrations of each of the four components, one by one, and testing the electrochemical characteristics of the prepared modified CPE. All synthesized graphene-based nanomaterials were investigated for their properties in sensor application.

2.4. Electrochemical Measurements

Electrochemical measurements were performed on a Metrohm Autolab potentiostat PGSTAT302N (Metrohm, Herisau, Switzerland) using the three-electrode system, where the working electrode was CPE, the auxiliary electrode was a Pt wire, and the reference electrode was Ag/AgCl electrode (LL ISE 6.0750.100 Ag,AgCl/3 M KCl Metrohm, Herisau, Switzerland). CPE were first characterized by cyclic voltammetry (CV) and electrochemical impedance spectroscopy (EIS). Characterization of the electrode surface was performed in a 5 mM solution of K3[Fe(CN)6]/K4[Fe(CN)6] (both Sigma-Aldrich, Darmstadt, Germany). Depending on the observed parameters, the best CPE were further used for amperometric detection of H2O2. Before amperometric measurements, the CPE was immersed into the phosphate buffer solution and was conditioned by performing 10 CV cycles in the potential window from –0.2 V to +0.8 V (vs. Ag/AgCl), with 100 mV/s scan rate. Then the amperometric measurements took place, where H2O2 was added directly into the electrochemical cell and the electric current was recorded at the constant operating potential.
To evaluate the selectivity of the presented sensor, its response to seven potential biological interferences was investigated. Uric acid (Sigma-Aldrich, Darmstadt, Germany), ascorbic acid (Sigma-Aldrich, Darmstadt, Germany), dopamine (Sigma-Aldrich, Darmstadt, Germany), xanthine (MilliporeSigma, Burlington, MA USA), paracetamol (Sigma-Aldrich, Darmstadt, Germany), BSA (Sigma-Aldrich, Darmstadt, Germany), and glucose (Sigma-Aldrich, Darmstadt, Germany) were all obtained commercially. The procedure was quite similar to the amperometric detection of H2O2–standard solution of H2O2 was added to the continuously stirred buffer solution followed by a specified amount of the potential interference. The current change was calculated and compared to the current change caused by H2O2.
Pharmaceutical sample Oroxid (obtained commercially at Lekarna Ljubljana, Slovenia) was sequentially diluted before the addition into the electrochemical cell with no other sample preparation steps. Saliva samples collected before, immediately after the use of Oroxid, and after rinsing of the mouth with water were filtered and added to the electrochemical cell without any additional sample preparation steps, respectively. In order to analyze the saliva samples, the user strictly followed the instructions on the bottle of the product: spraying the solution into the mouth with 4 pressures of the spray, gargling for 30 s and spitting it out.

3. Results and Discussion

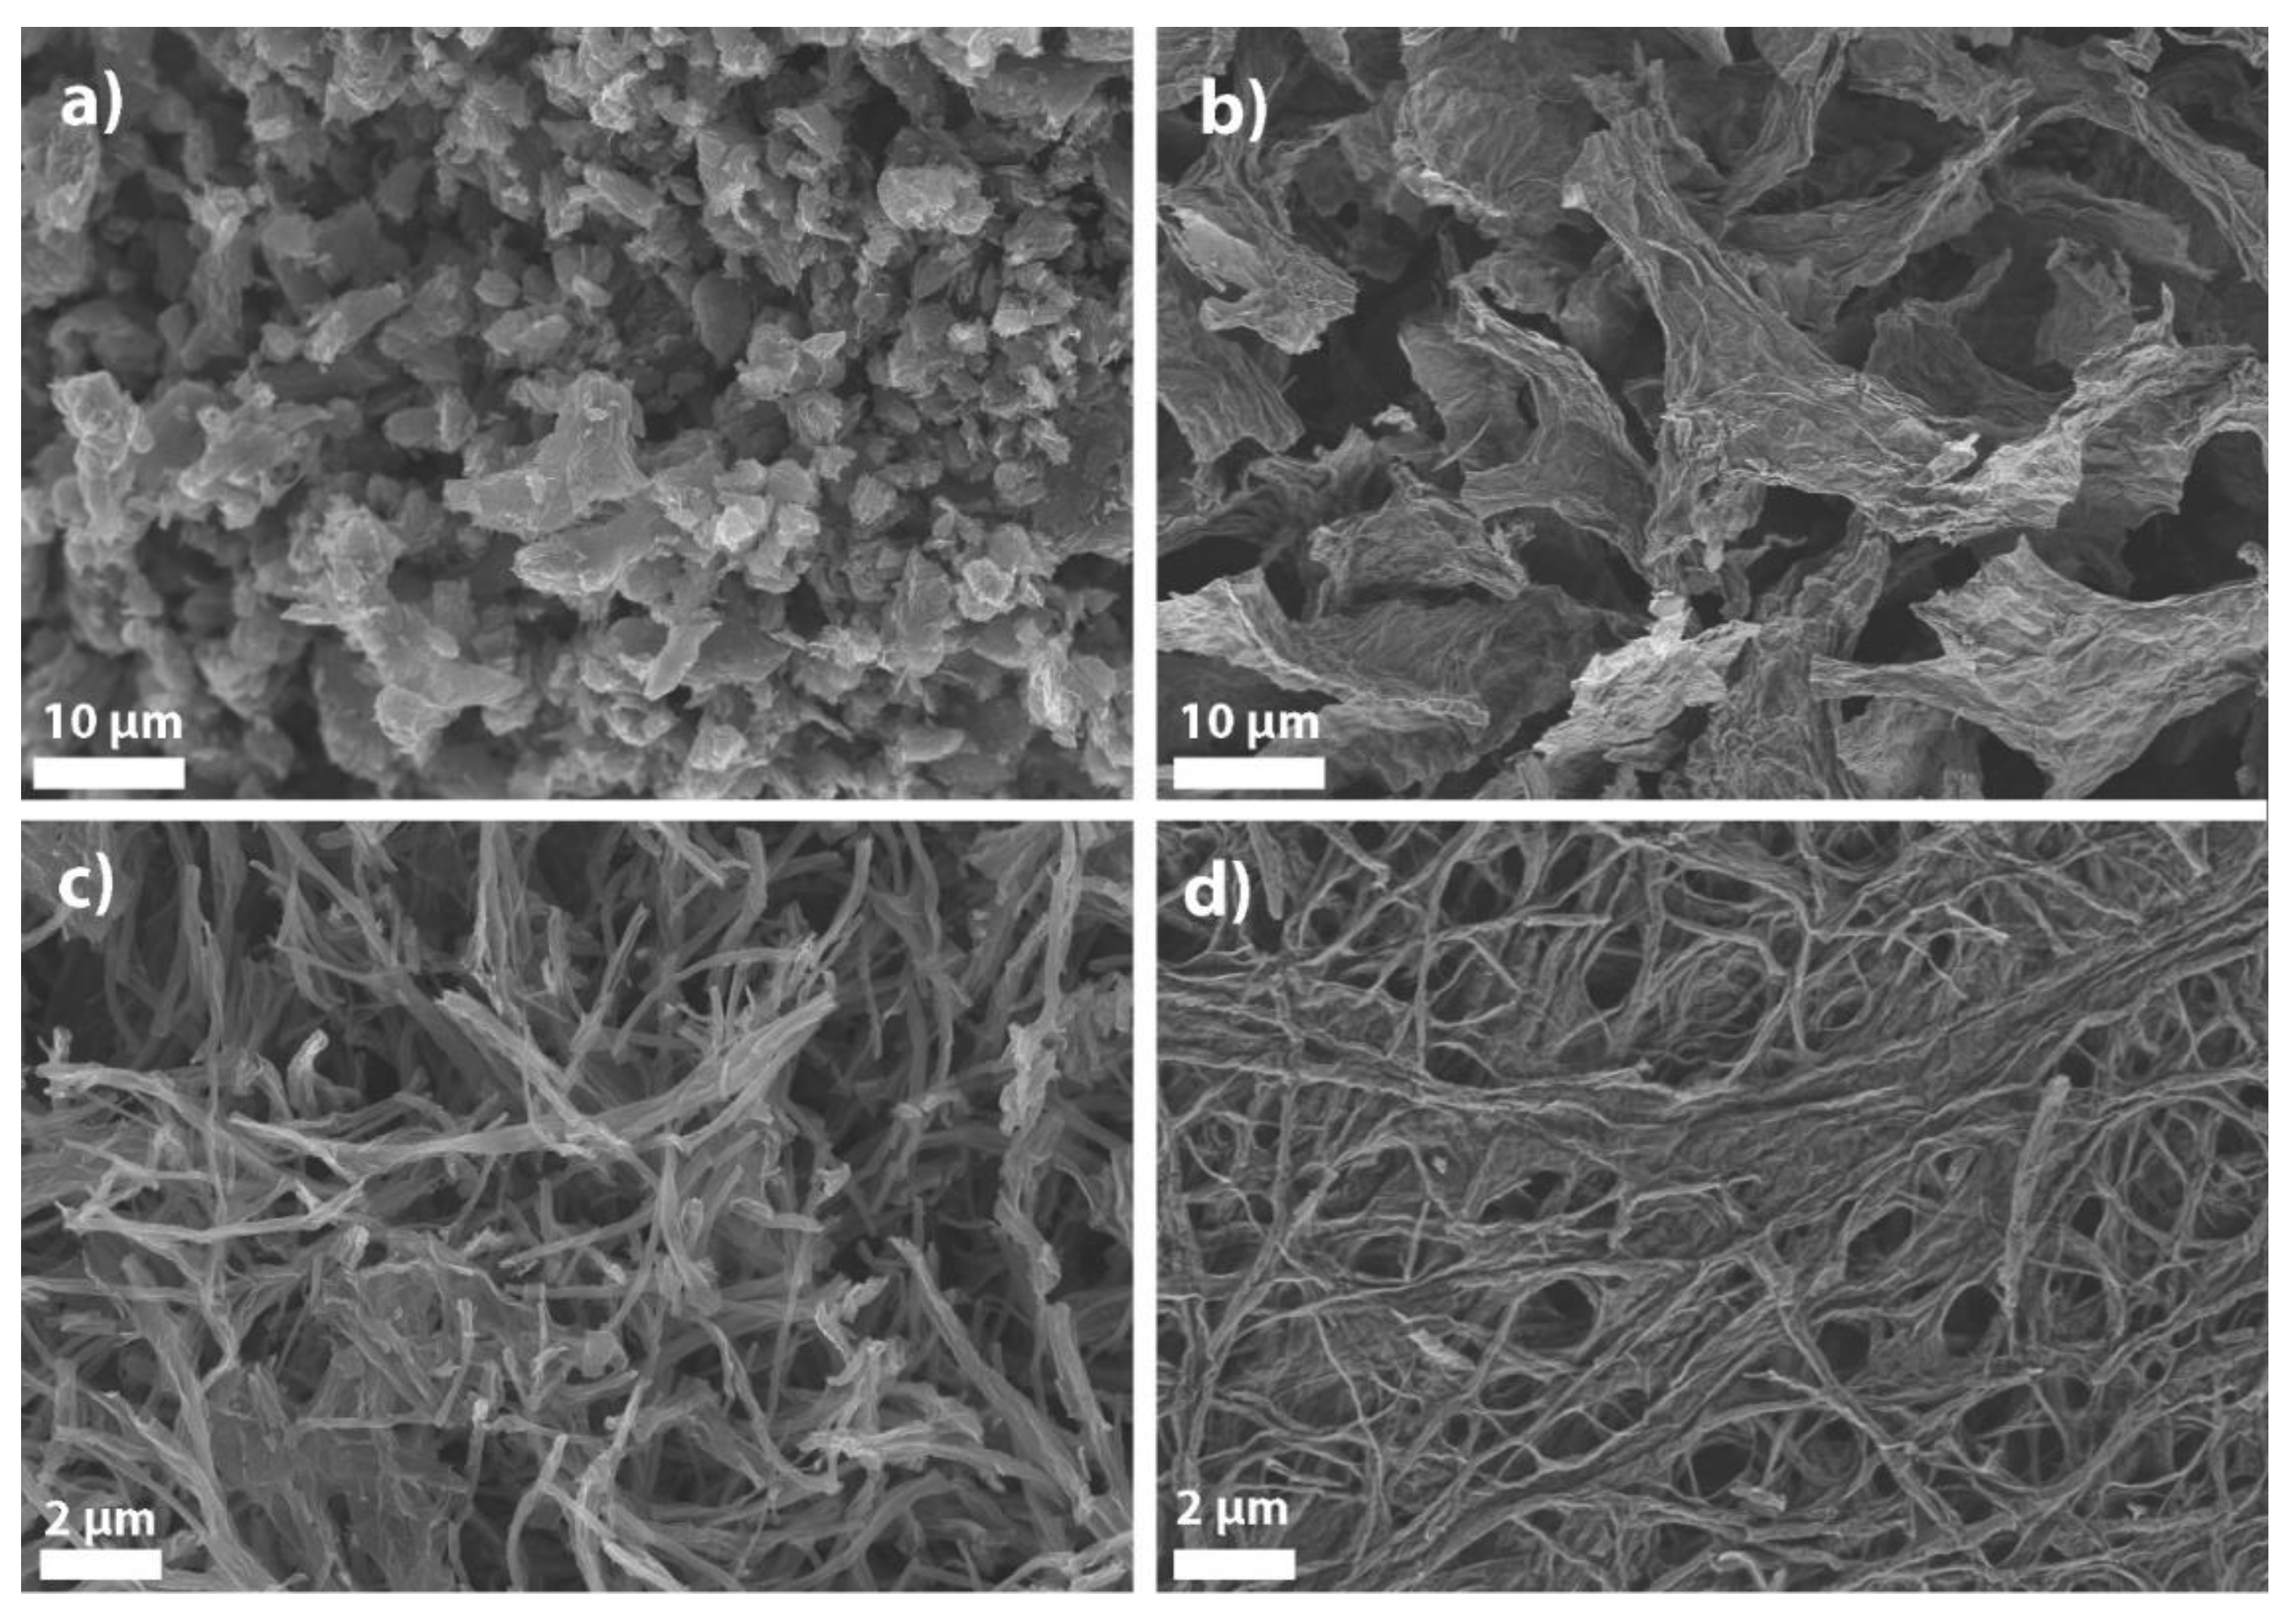
3.1. Synthesis and Characterization of Graphene-Based Nanomaterials

Graphene-based nanomaterials were synthesized according to a two-step top-down approach. Quasi-1D materials were synthesized by oxidative longitudinal unzipping of MWCNTs, while 2D materials were prepared by oxidative chemical exfoliation of graphite flakes. The formation of sheets (GO) and ribbons (GONR) after this synthesis step were confirmed morphologically using SEM imaging (see Figure S1). The second synthesis step was pyrolysis under reducing NH3 or inert N2 atmospheres. All pyrolyzed materials were also morphologically analyzed by SEM (Figure 1). The images clearly show exfoliated materials with relatively high specific surface area. htGO and N-doped htGO (Figure 1a,b) show crumpled flake-like materials, while htGONR and N-doped htGONR (Figure 1c,d) show quasi 1D ribbon-like materials. During the pyrolysis under N2 atmosphere, oxygen functional groups are reduced or decomposed, additional defects are introduced into the structure, and the material is furtherly exfoliated [32]. During the pyrolysis under NH3 atmosphere, N-functional groups are introduced into the structure in addition to the above-described processes. All processes significantly influence the properties of graphene-based nanomaterials. The detailed characterization of all the materials was published in our previous work [31] and is summarized below for the purpose of understanding the improved sensing properties.
Surface area is an important property of materials used in sensor development. The BET analysis was employed to examine the specific surface area of the synthesized materials. The results (Table 1) show a significant increase in surface area for all materials compared to natural graphite (0.6 m2/g [33]), which was used to prepare CPE. Metal impurities were also investigated by ICP-MS as they can strongly affect the electrochemical properties of the material. In this case, Mn-impurities were of particular interest since MnO2 was used to catalyze H2O2 reaction on the electrode. The results of the ICP-MS analysis show a content between 1.2 and 4.1 mg/g of Mn-impurities in all materials. The Mn-impurities are residues of the reagent that was used in the first step of the synthesis of GO. The degree of reduction and N-doping during pyrolysis was investigated by C, H, N analysis. The concentration of nitrogen is 1 at % higher in the case of 2D material than in the case of quasi-1D material. An important parameter is also the incidence of pyridinic N-groups in the doped materials, since they are considered to be highly reactive and the main cause of enhancement of electrocatalytic activity [34]. XPS analysis was carried out to investigate the distribution of N-configuration. Pyridinic-N, pyrrolic-N, graphitic-N, and oxidized-N configurations were of interest. Deconvolution of N1s XPS core-level spectra shows 41.5 and 44.2 at % pyridinic-N and 23.4 and 19.7 at % pyrrolic-N content in N-htGONR and N-htGO. This indicates higher electrocatalytic activity of N-doped materials in comparison to non-doped materials due to the higher concentration of pyridinic-N. Furthermore, pyridinic and pyrrolic functional groups are known to strongly bind metals and by that improve the overall stability of the material [35]. Since the reactivity of the material is also dependent on the concentration of defects in the structure, Raman spectra were examined. Observing D and G peaks, it was estimated that all materials exhibit high defect density.
Taking into account all the data obtained from material characterization, one can assume that all four graphene-based nanomaterials will improve the electrochemical characteristics of the CPE surface due to the increase in specific surface area, higher conductivity and activity towards H2O2 due to metal impurities, higher reactivity due to high concentration of defects and in case of N-doped materials, pyridinic and pyrrolic functional groups. N-doped materials also offer enhanced charge transfer characteristics [25], while quasi-1D materials exhibit a higher ratio of edge to basal carbons than 2D materials, which increases their reactivity. It is expected that N-doped and quasi-1D materials will exhibit higher reactivity towards H2O2 decomposition, similarly to the reported higher activity towards oxygen reduction reaction, described by Nosan et al. [31].

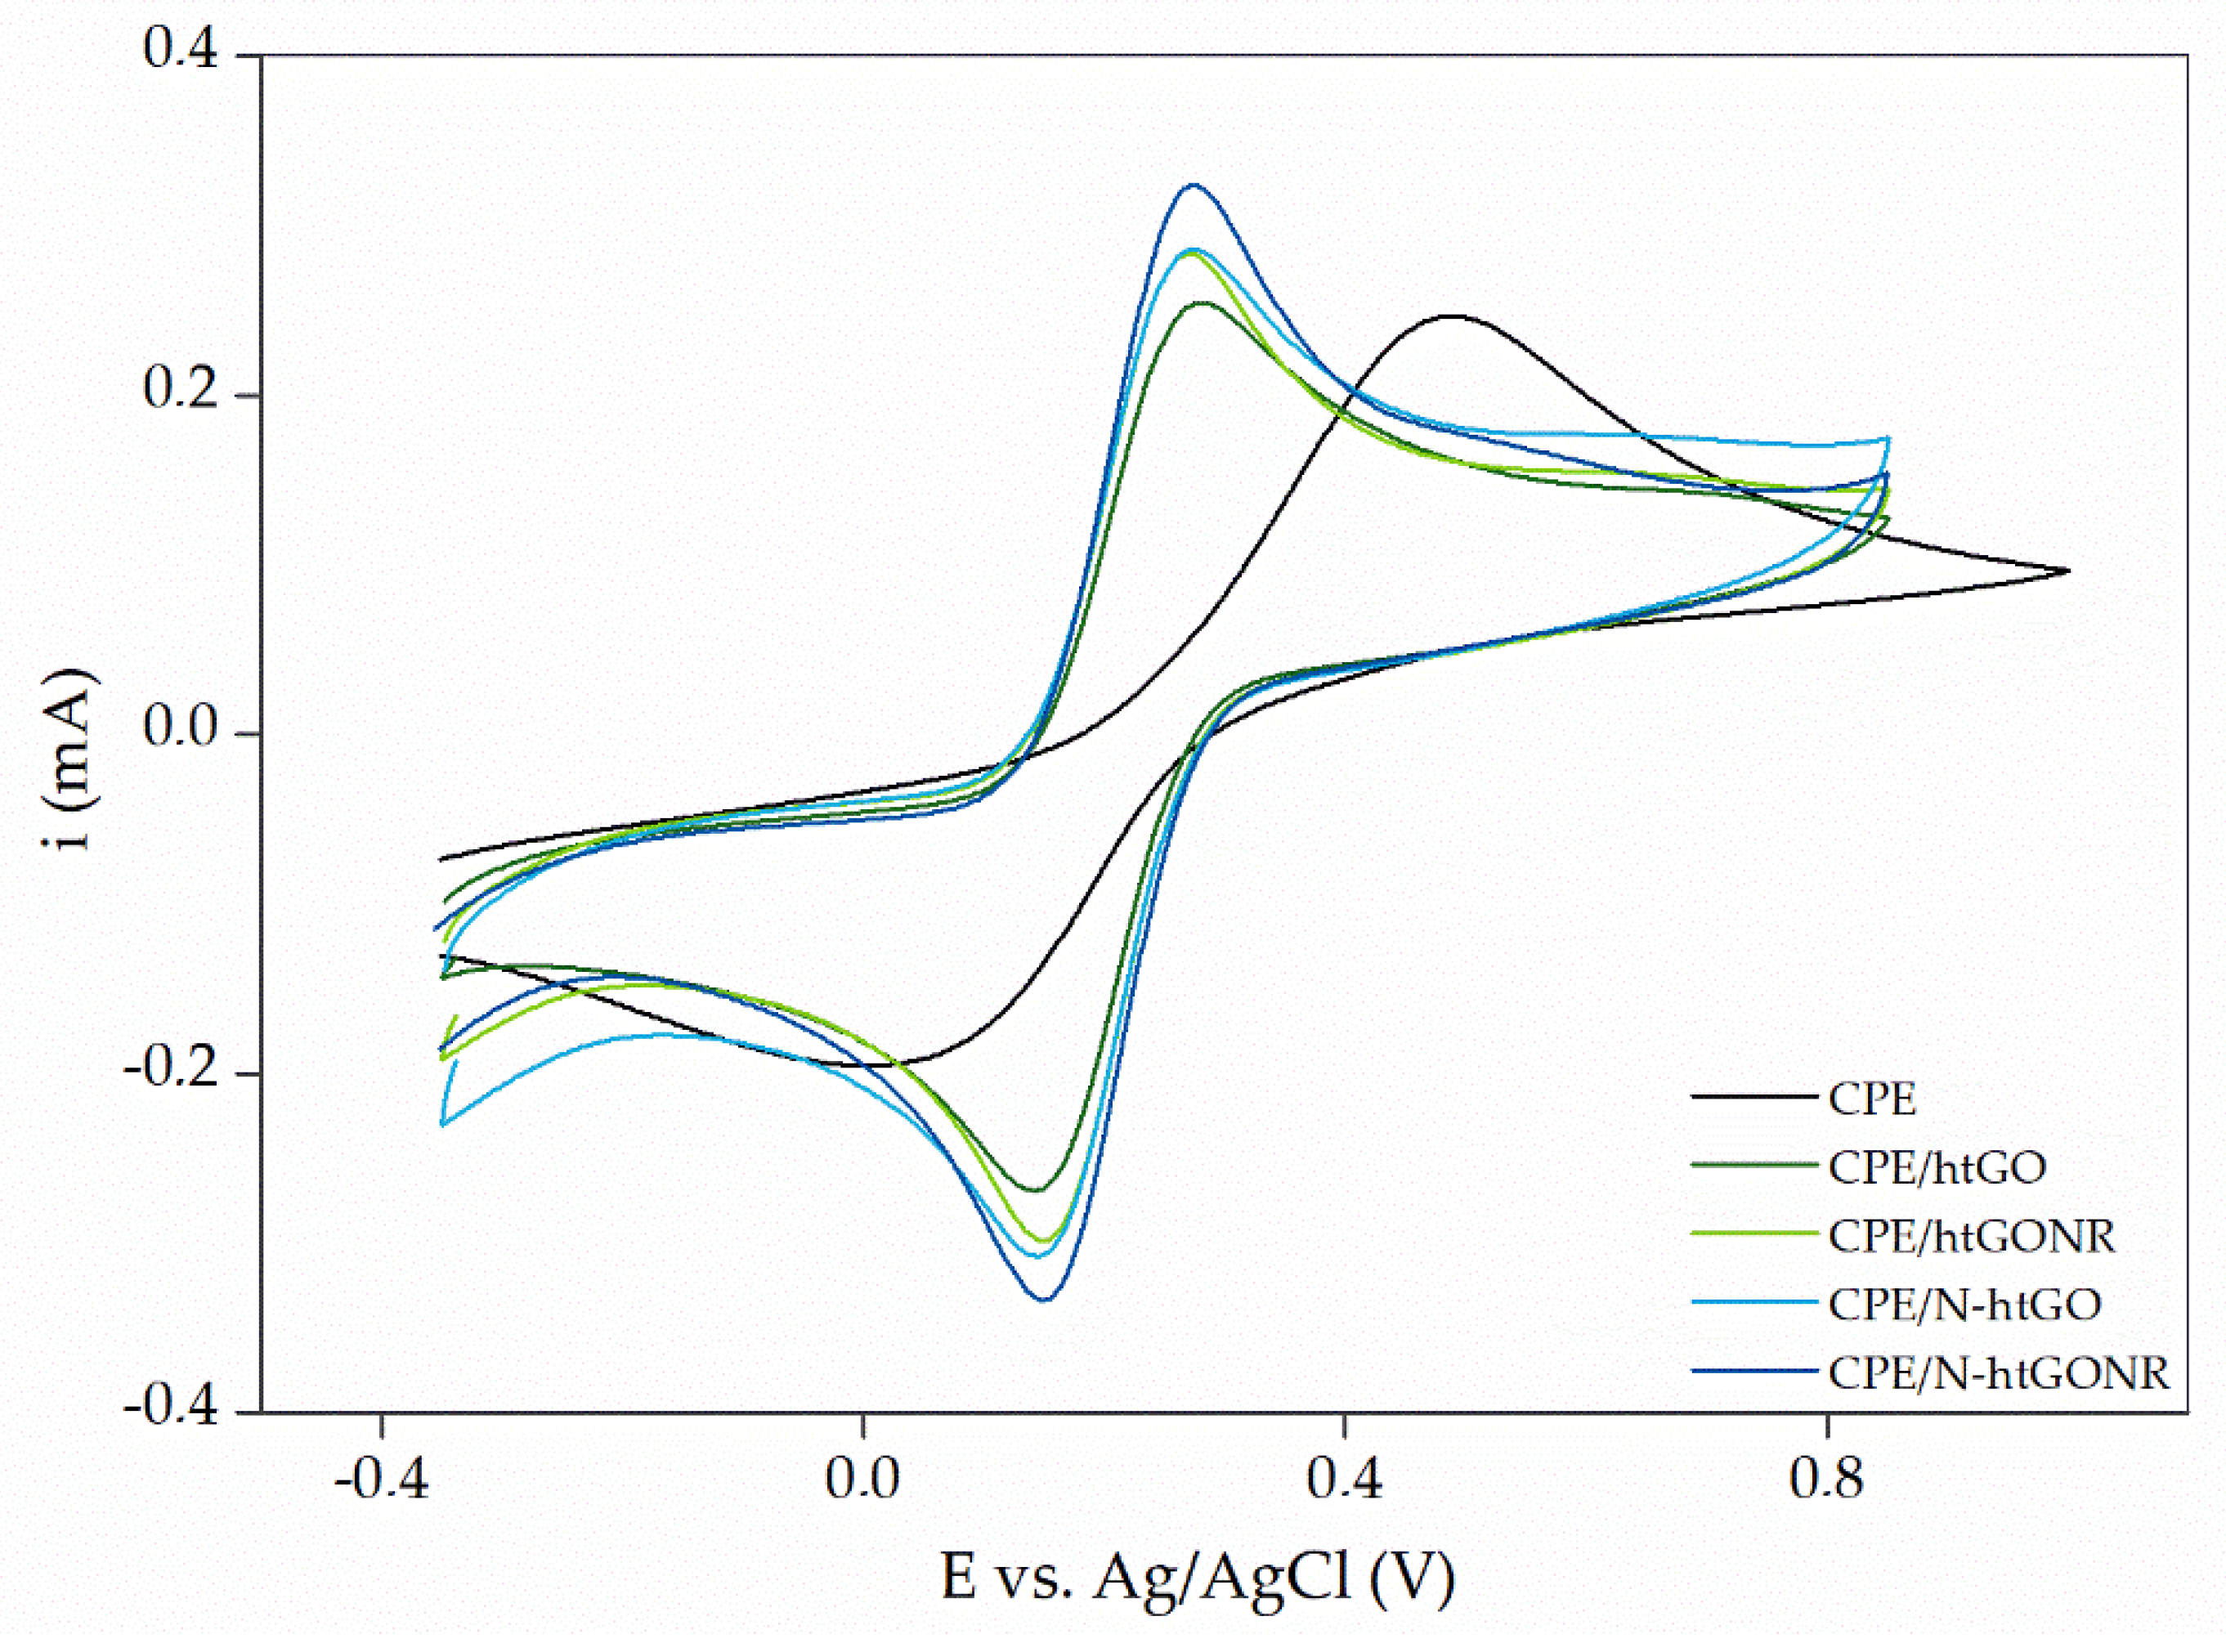
3.2. Electrode Preparation, Characterization, and Optimization

As reported in previous studies [19,36,37,38], the modified CPE exhibit many desirable analytical parameters, such as low LOD, adequate sensitivity, durability, and reproducibility. Moreover, the simplicity and many possible modification mechanisms (e.g., drop casting [19] and bulk modification [39,40,41]) make CPE a convenient starting point for the development of electrochemical sensors. In this work, CPE were modified by drop casting a dispersion of a graphene-based nanomaterial (either htGO, N-htGO, htGONR, or N-htGONR), MnO2, and Nafion onto the electrode surface. Each component of the dispersion was expected to serve its purpose–MnO2 is known to have an outstanding activity towards H2O2; graphene materials exhibit a large surface area which influences the sensitivity of the sensor, enables good particle distribution of the MnO2, promotes charge transfer, and improves the electronic conductivity of the electrode; Nafion serves as a binder that stabilizes the layer of MnO2 and graphene while maintaining high ionic conductivity of the electrode surface. The composition of the dispersion was systematically changed to obtain a CPE with optimal parameters.
Starting concentrations of both graphene-based nanomaterials and MnO2 in the dispersion were 0.4 mg/mL, respectively, obtained by mixing the initial separate 1.0 mg/mL dispersions. When the ratio was changed to be in favor of MnO2, the conductivity of the electrode surface significantly decreased, while no significant change was observed when the ratio was changed to be in favor of graphene-based nanomaterial. The ratio remained at 1:1 for the rest of the study. When higher concentrations (0.8, 1.0 mg/mL) of both materials were used, the dispersion was not homogeneous even upon visual inspection and the layers cast on the electrode were unstable when immersed in a solution–the particles started to crumble off the surface during the measurements. To increase the number of nanoparticles while maintaining a stable and repeatable electrode surface, two layers of the optimal dispersion were used.
After drop casting and drying, the modified CPE were immersed in 0.1 M PB (pH 7.4), and their electrochemical properties were examined using CV and EIS. Both analyses were performed in the 0.1 M PB solution (pH 7.4) containing 5 mM [Fe(CN)6]3–/4–. First, it was determined which of the four tested graphene-based nanomaterials exhibited the optimal electrochemical properties in combination with other components of the electrode. Figure 2 shows cyclic voltammograms for bare CPE, CPE/htGO/MnO2/Nafion, CPE/N-htGO/MnO2/Nafion, CPE/htGONR/MnO2/Nafion, and CPE/N-htGONR/MnO2/Nafion. It is clearly seen that the combination of materials used for electrode modification, regardless of the choice of the graphene-based nanomaterial, improves the properties of the CPE. The redox peaks for bare CPE are significantly lower and wider than those of the modified electrodes. The peak-to-peak separation value (ΔEpp) is also an important parameter that provides information about the electron transfer rate at the electrode. The ideal ΔEpp value is 59.2 mV, as shown by the Nernst equation [42]. The ΔEpp values are 492, 128, 141, 125, and 116 mV for bare CPE, CPE/htGO/MnO2/Nafion, CPE/N-htGO/MnO2/Nafion, CPE/htGONR/MnO2/Nafion, and CPE/N-htGONR/MnO2/Nafion, respectively. These results indicate that the electron transfer rate is highest in the case of using N-htGONR, and therefore N-htGONR is the optimal material of choice. This hypothesis is supported by the peak heights in Figure 2 and is also consistent with the above discussed edge effects of the quasi-one-dimensional materials and the incorporated nitrogen functional groups.
To furtherly confirm the choice of materials, a similar study was performed with the bare CPE, CPE/Nafion, CPE/MnO2, CPE/N-htGONR, and CPE/N-htGONR/MnO2/Nafion. The cyclic voltammograms in Figure 3a show significantly lower ΔEpp (about 100 mV compared to 320 mV for the bare CPE) and higher redox peaks whenever N-htGONR were used to modify the CPE, indicating that N-htGONR do in fact promote the charge transfer process. Slightly higher peaks were observed when N-htGONR and MnO2 were used, suggesting a synergistic effect of joint dispersion on the electrochemical properties. Wu et al. [28] described a similar phenomenon for a composite material of reduced graphene oxide nanoribbons and MnO2. The conductivity of the electrode surface is important for the analytical performance of the sensor, since it influences the sensitivity, as well as the reliability of the response. Therefore, Nyquist plots were recorded (Figure 3b) and charge transfer resistance (Rct) was determined. Obviously, the desired Rct value was as low as possible. The Rct values for CPE, CPE/Nafion, CPE/N-htGONR, CPE/MnO2, and CPE/N-htGONR/MnO2/Nafion were 725 Ω, 422 Ω, 1584 Ω, 19 Ω, and 6 Ω, respectively. As expected, the results were in agreement to those of CV measurements. The superior electrochemical properties of CPE/N-htGONR/MnO2/Nafion could be assigned to the high surface area and high conductivity provided by N-htGONR particles, as well as the above suggested synergistic effect between MnO2 and graphene nanomaterials.
Amperometry was chosen for the detection of H2O2, because it is a very simple, rapid and efficient method for the detection of target analyte and is also the method of choice in many previously published works on H2O2 detection [13,28]. The operating potential was chosen by recording a CV in a 1 mM solution of H2O2 in 0.1 M PB (pH 7.4) and observing the oxidation peak. Potentials between 0.50 and 0.75 V were tested by recording amperograms, where four consecutive additions of 50 µM H2O2 were added, and the current change was observed. Finally, 0.65 V was chosen as the optimal operating potential as it exhibited the highest current response.

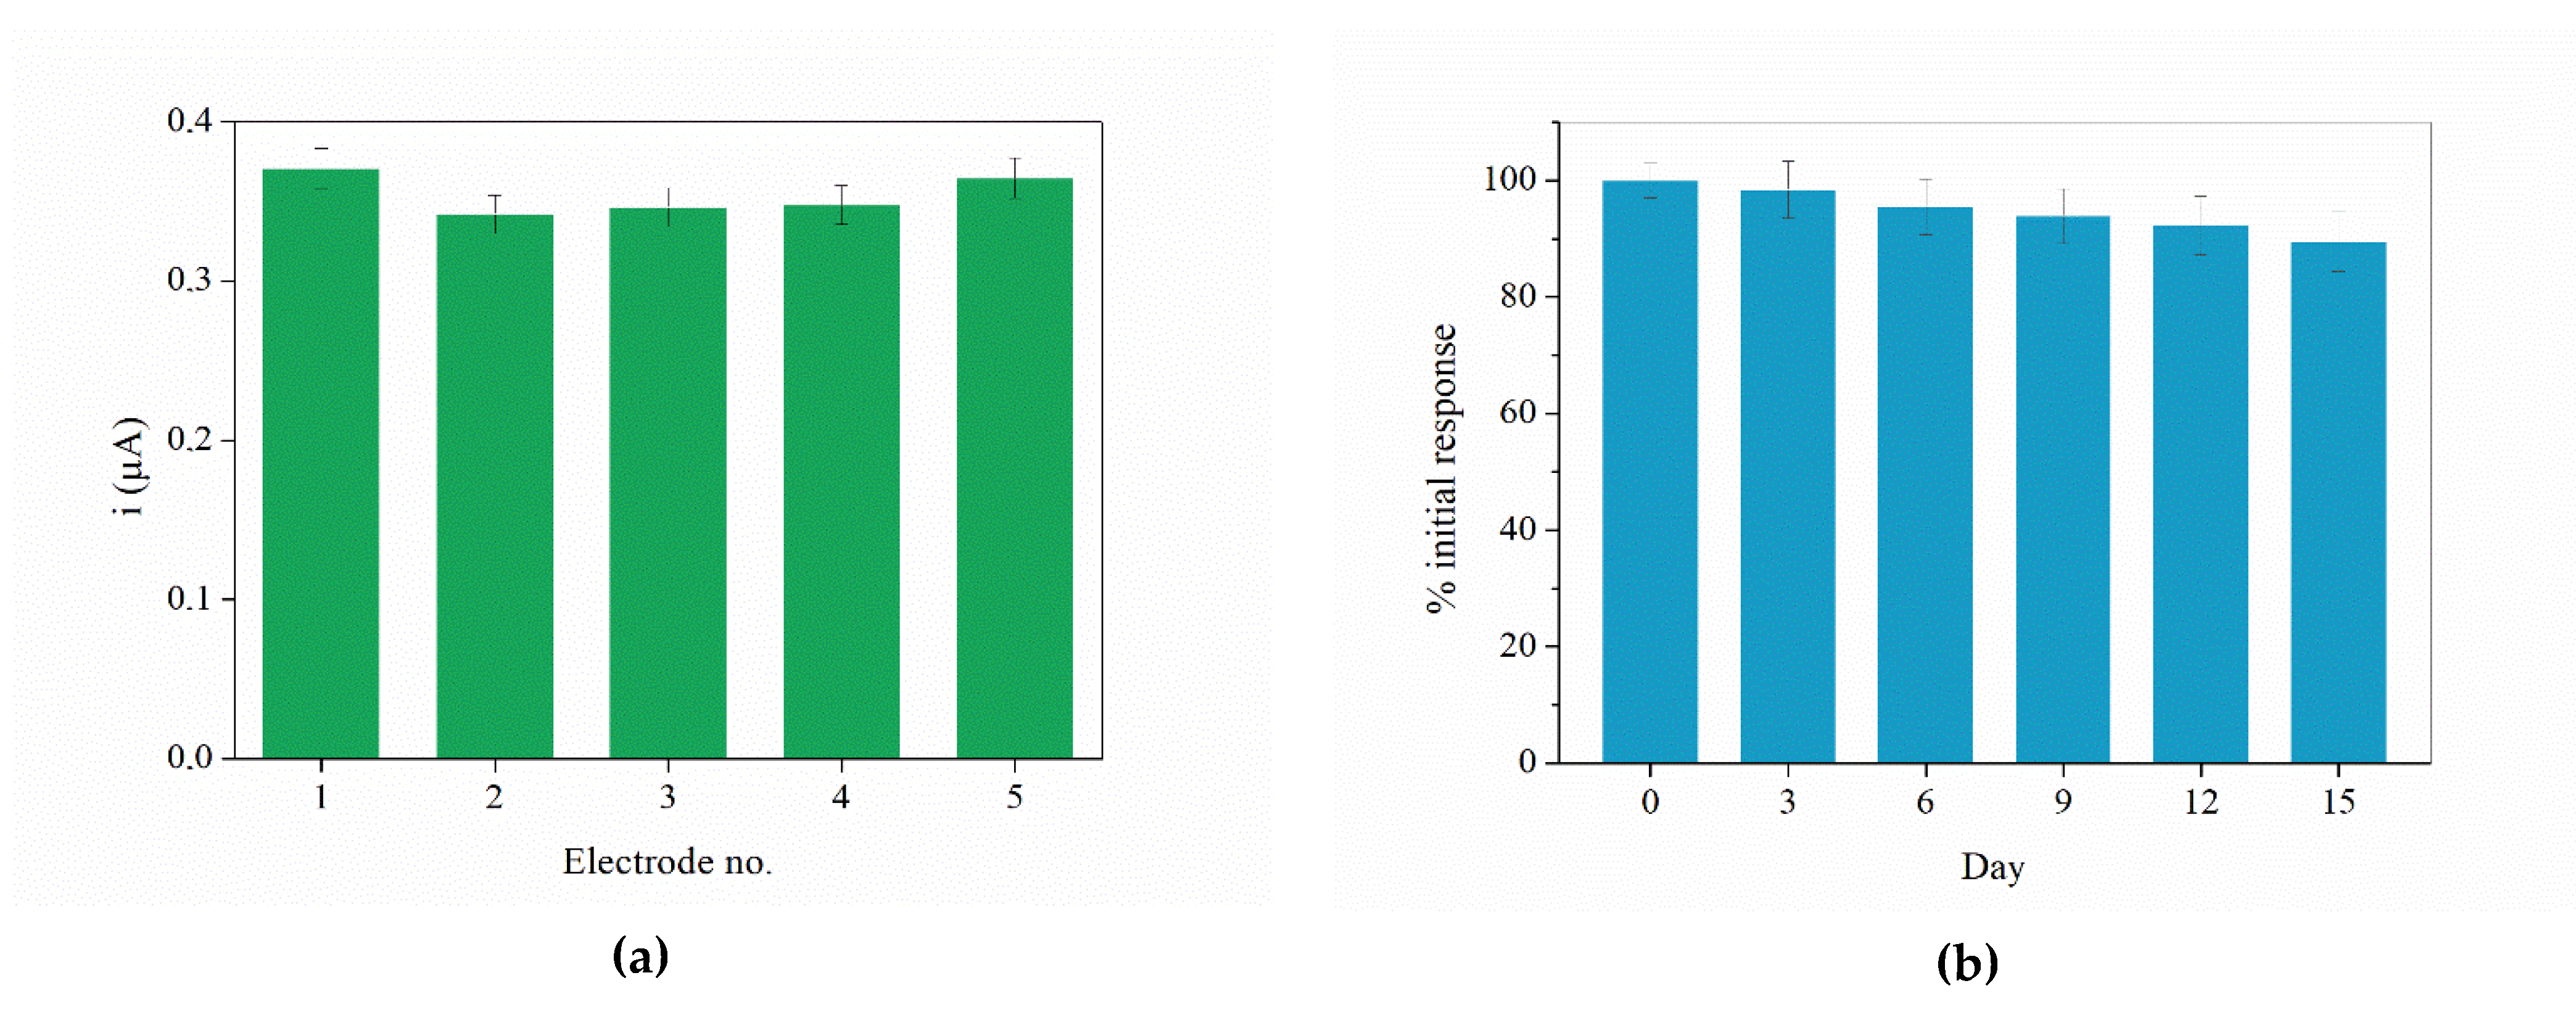
3.3. Linear Range, Sensitivity, Durability, Reproducibility, and Selectivity Studies

The analytical performance of the CPE/N-htGONR/MnO2/Nafion sensor was investigated in the next step. The amperometric response for a known amount of H2O2 in a stirred 0.1 M PB (pH 7.4) was measured at 0.65 V. Successive additions of a standard H2O2 solution were added to the solution. The calibration curve obtained by this method showed a wide linear range from 1.0 to 300 µM. Examples of measured amperograms and their corresponding calibration curves are shown in Figure 4a,b, respectively. The sensitivity of the proposed sensor is satisfactory at 0.135 µAµM–1cm−2. LOD was calculated according to the 3S/k method [43] and it was found to be 0.08 µM, which is one of the lowest LOD values found in the literature for similar sensing systems (Table 2).
The lifetime of the proposed sensor was evaluated at an interval of 21 days. Measurements were performed every three days. The electrode was stored at room temperature in a dark place between measurements. As shown in Figure 5b, the sensor retained 89.6% of its initial response after 15 days, confirming its durability. The response after 18 and 21 days drops to 88.5% and 84.8% of the initial response, respectively, indicating that the electrode should not be used for more than two weeks in order to obtain optimal results. The reproducibility was studied by performing amperometric measurements in 0.1 M PB (pH 7.4) with five 5 µM H2O2 additions. Five individual electrodes, prepared on different days using the same procedure, were used for reproducibility study. The average current change for each prepared electrode is shown in Figure 5a. The calculated RSD value was 3.5%. According to these results it can be concluded that the sensor exhibits good sensitivity and durability, as well as LOD.
The selectivity of the sensor was investigated by analyzing the response of the sensor in the presence of seven interfering species commonly found in biological samples: uric acid, ascorbic acid, paracetamol, dopamine, xanthine, bovine serum albumin, and glucose. The response was measured by consecutively adding 10 µM H2O2 standard solution three times and an aliquot of an interfering species of the same concentration. This procedure was repeated three times for each studied interference. It was concluded that uric acid, xanthine, bovine serum albumin, and glucose did not interfere with the response of the sensor as no current response occurred after their additions, while paracetamol, ascorbic acid, and dopamine interfered significantly. While this study suggests that the sensor might not be suitable for all biological samples, it can be applied to certain studies in food and pharmaceutical analysis. Under certain conditions it can be used for the analysis of less complex biological samples, e.g., saliva, when it can be asserted with certainty that the subject did not ingest any ascorbic acid or paracetamol in the last few hours.

3.4. Real Sample Analysis

Teeth whitening products usually contain about 3.5% of H2O2 [45]. Since H2O2 is known to form free radicals, including hydroxyl radicals, which have been implicated in various stages of carcinogenesis [46], the concern for potential systemic toxicity of tooth whitening and other oral hygiene products containing H2O2 is logical. The user of home teeth whitening systems is also in danger of potentially ingesting H2O2, which leads to gastrointestinal irritation and possible gas embolisms [24]. In a recent study the concentration of H2O2 was measured in saliva during and after tooth whitening by a colorimetric method and it confirmed that the tooth whitening process is safe [23]. The sensor proposed in this work was also used to test the H2O2 content in an oral hygiene product, as well as in saliva immediately after the application of the hygiene product under controlled conditions.
The main objectives of this study with real samples were first to confirm that the proposed sensor has a good recovery value and second that it can be used to some extent for the analysis of biological samples, taking into account the results of interference studies. Oroxid, an over-the-counter oral hygiene product, contains nominally 3% H2O2, as well as flavors, stabilizers, and Actipone® PX3. The pharmaceutical was diluted and analyzed using the proposed sensor. The recovery values ranged from 94.3% to 98.0% as shown in Table 3. A representative amperogram for the analysis of the pharmaceutical sample is shown in Figure S2. For the saliva sample analysis, the subject applied the product according to the instructions on the bottle. To increase reliability of the results, the subject did not eat or drink anything for 2 h prior to the collection of the samples. Saliva samples were collected and analyzed right before and after use of the product. Two representative amperograms of saliva analyses are shown in Figures S3 and S4. Observing the average current after each addition of the saliva sample, it is clear that no reaction takes place at the electrode surface in case of saliva sampled before use and that there is residual H2O2 still present in the saliva sample after use of the product. The results suggest that the residual content of H2O2 in the saliva samples after use was between 30 and 40 ppm, while there was no H2O2 detected in the saliva collected prior to the use of the product, as well as in the saliva collected after thorough rinsing of the mouth. After an extensive literature review it was concluded that this is the first study to report the contents of residual H2O2 after the use of oral hygiene products in salivary samples using electrochemical sensing. An investigation by Pournaghi-Azar et al. [16], however, revealed the content of H2O2 during at-home teeth whitening. Considering the nominal H2O2 contents in teeth whitening product versus oral hygiene products, our results are in very good agreement with those obtained by the referenced study.

4. Conclusions

For the development of the proposed H2O2 sensor, four graphene-based nanomaterials were tested. N-htGONR was found to be the best for this application, firstly due to its quasi-one-dimensional structure and high aspect ratio (edge effect) compared to N-htGO and htGO, and secondly due to the effect of nitrogen functional groups (especially pyridine) compared to non-doped htGONR. N-htGONR was impregnated with MnO2 and Nafion and cast onto the CPE surface. CPE were chosen as the fundamental starting point of this research since they are easy to prepare, offer many possibilities for modification, and are robust. The developed sensor was successfully used to determine H2O2 concentrations by an amperometric method. The linear range of the proposed sensor was between 1.0 and 300 µM, while the LOD was 0.08 µM, which is one of the lowest LOD values found in the literature for a comparable sensor. Sensitivity, durability, reproducibility, and selectivity were also studied and yielded excellent results. The practical application of the sensor was then tested for two real samples. The developed sensing platform offers an excellent starting point for further research and applications, especially since graphene-based nanoribbons are not commonly used for sensing applications. Finally, this work could have a great impact in development of online sensors for various applications including health, food, and energy fields.

Supplementary Materials

The following are available online at www.mdpi.com/article/10.3390/s21248301/s1: Figure S1: (a) SEM image confirming the exfoliation of graphite flakes and formation of 2D sheet structures. (b) SEM image confirming the unzipping of MWCNT and formation of quasi-1D ribbon structures. Figure S2: Amperogram for the measurement of pharmaceutical sample. Electrochemical cell contained 20 mL 0.1 M PB (pH 7.4); the measurement was carried out at 0.65 V. Five additions of 5 µM standard solution were added, followed by three additions of 100,000-fold diluted pharmaceutical sample. Figure S3: Amperogram for the measurement of saliva sample before the use of oral hygiene product. Electrochemical cell contained 20 mL 0.1 M PB (pH 7.4); the measurement was carried out at 0.65 V. Five additions of 5 µM standard solution were added, followed by three additions of 50 µL of saliva. Figure S4: Amperogram for the measurement of saliva sample after the use of oral hygiene product. Electrochemical cell contained 20 mL 0.1 M PB (pH 7.4); the measurement was carried out at 0.65 V. Five additions of 5 µM standard solution were added, followed by three additions of 50 µL of saliva.

Author Contributions

Conceptualization, K.K., M.K. and B.G.; methodology, E.G. and K.K.; validation, E.G.; formal analysis, E.G., B.G.; investigation, E.G., B.G.; resources, M.K.; data curation, E.G.; writing—original draft preparation, E.G.; writing—review and editing, K.K., B.G. and M.K.; visualization, E.G. and K.K.; supervision, K.K. and M.K.; project administration, M.K.; funding acquisition, M.K. and B.G. All authors have read and agreed to the published version of the manuscript.

Funding

This research was funded by programs P1-0153 and P1-0175 and bilateral research funding Project N2-0087 from the Slovenian Research Agency (ARRS).

Institutional Review Board Statement

Not applicable.

Informed Consent Statement

Informed consent was obtained from all subjects involved in the study.

Data Availability Statement

Data sharing not applicable.

Acknowledgments

Author E.G. is grateful to the GoStyria! scholarship program for post-graduate students that enabled her to work at the University of Graz, where a significant amount of research was carried out under the supervision of K.K.

Conflicts of Interest

The authors declare no conflict of interest.

References

  1. Liu, J.; Steinberg, S.M.; Johnson, B.J. A high performance liquid chromatography method for determination of gas-phase hydrogen peroxide in ambient air using Fenton’s chemistry. Chemosphere 2003, 52, 815–823. [Google Scholar] [CrossRef]
  2. Song, M.; Wang, J.; Chen, B.; Wang, L. A Facile, Nonreactive Hydrogen Peroxide (H2O2) Detection Method Enabled by Ion Chromatography with UV Detector. Anal. Chem. 2017, 89, 11537–11544. [Google Scholar] [CrossRef] [PubMed]
  3. Steinberg, S.M. High-performance liquid chromatography method for determination of hydrogen peroxide in aqueous solution and application to simulated Martian soil and related materials. Environ. Monit. Assess. 2013, 185, 3749–3757. [Google Scholar] [CrossRef] [PubMed]
  4. Lee, D.; Khaja, S.; Velasquez-Castano, J.C.; Dasari, M.; Sun, C.; Petros, J.; Taylor, W.R.; Murthy, N. In vivo imaging of hydrogen peroxide with chemiluminescent nanoparticles. Nat. Mater. 2007, 6, 765–769. [Google Scholar] [CrossRef]
  5. Rivero, P.J.; Ibañez, E.; Goicoechea, J.; Urrutia, A.; Matias, I.R.; Arregui, F.J. A self-referenced optical colorimetric sensor based on silver and gold nanoparticles for quantitative determination of hydrogen peroxide. Sens. Actuators B Chem. 2017, 251, 624–631. [Google Scholar] [CrossRef]
  6. Domínguez-Henao, L.; Turolla, A.; Monticelli, D.; Antonelli, M. Assessment of a colorimetric method for the measurement of low concentrations of peracetic acid and hydrogen peroxide in water. Talanta 2018, 183, 209–215. [Google Scholar] [CrossRef] [PubMed]
  7. Klassen, N.V.; Marchington, D.; McGowan, H.C.E. H2O2 Determination by the I3– Method and by KMnO4 Titration. Anal. Chem. 1994, 66, 2921–2925. [Google Scholar] [CrossRef]
  8. Shamkhalichenar, H.; Choi, J.-W. Non-Enzymatic Hydrogen Peroxide Electrochemical Sensors Based on Reduced Graphene Oxide. J. Electrochem. Soc. 2020, 167, 037531. [Google Scholar] [CrossRef]
  9. Dhara, K.; Mahapatra, D.R. Recent advances in electrochemical nonenzymatic hydrogen peroxide sensors based on nanomaterials: A review. J. Mater. Sci. 2019, 54, 12319–12357. [Google Scholar] [CrossRef]
  10. Wang, Y.; Gao, C.; Ge, S.; Yu, J.; Yan, M. Platelike WO3 sensitized with CdS quantum dots heterostructures for photoelectrochemical dynamic sensing of H2O2 based on enzymatic etching. Biosens. Bioelectron. 2016, 85, 205–211. [Google Scholar] [CrossRef]
  11. Mercante, L.A.; Facure, M.H.M.; Sanfelice, R.C.; Migliorini, F.L.; Mattoso, L.H.C.; Correa, D.S. One-pot preparation of PEDOT:PSS-reduced graphene decorated with Au nanoparticles for enzymatic electrochemical sensing of H2O2. Appl. Surf. Sci. 2017, 407, 162–170. [Google Scholar] [CrossRef]
  12. Stanković, V.; Đurđić, S.; Ognjanović, M.; Mutić, J.; Kalcher, K.; Stanković, D.M. A novel nonenzymatic hydrogen peroxide amperometric sensor based on AgNp@GNR nanocomposites modified screen-printed carbon electrode. J. Electroanal. Chem. 2020, 876, 114487. [Google Scholar] [CrossRef]
  13. Prasertying, P.; Yamkesorn, M.; Chimsaard, K.; Thepsuparungsikul, N.; Chaneam, S.; Kalcher, K.; Chaisuksant, R. Modified pencil graphite electrode as a low-cost glucose sensor. J. Sci. Adv. Mater. Devices 2020, 5, 330–336. [Google Scholar] [CrossRef]
  14. Svancara, I.; Kalcher, K.; Walcarius, A.; Vytras, K. Electroanal. Carbon Paste Electrodes; CRC Press Taylor & Francis Group: Boca Raton, FL, USA, 2012; ISBN 9781439830208. [Google Scholar]
  15. Sheng, Q.; Zhang, D.; Wu, Q.; Zheng, J.; Tang, H. Electrodeposition of Prussian blue nanoparticles on polyaniline coated halloysite nanotubes for nonenzymatic hydrogen peroxide sensing. Anal. Methods 2015, 7, 6896–6903. [Google Scholar] [CrossRef]
  16. Pournaghi-Azar, M.H.; Ahour, F.; Pournaghi-Azar, F. Simple and rapid amperometric monitoring of hydrogen peroxide in salivary samples of dentistry patients exploiting its electro-reduction on the modified/palladized aluminum electrode as an improved electrocatalyst. Sens. Actuators B Chem. 2010, 145, 334–339. [Google Scholar] [CrossRef]
  17. Haghighi, B.; Varma, S.; Alizadeh Sh., F. M.; Yigzaw, Y.; Gorton, L. Prussian blue modified glassy carbon electrodes–Study on operational stability and its application as a sucrose biosensor. Talanta 2004, 64, 3–12. [Google Scholar] [CrossRef] [PubMed]
  18. Liu, J.; Bo, X.; Zhao, Z.; Guo, L. Highly exposed Pt nanoparticles supported on porous graphene for electrochemical detection of hydrogen peroxide in living cells. Biosens. Bioelectron. 2015, 74, 71–77. [Google Scholar] [CrossRef]
  19. Anojčić, J.; Guzsvány, V.; Vajdle, O.; Madarász, D.; Rónavári, A.; Kónya, Z.; Kalcher, K. Hydrodynamic chronoamperometric determination of hydrogen peroxide using carbon paste electrodes coated by multiwalled carbon nanotubes decorated with MnO2 or Pt particles. Sens. Actuators B Chem. 2016, 233, 83–92. [Google Scholar] [CrossRef]
  20. Trujillo, R.M.; Barraza, D.E.; Zamora, M.L.; Cattani-Scholz, A.; Madrid, R.E. Nanostructures in hydrogen peroxide sensing. Sensors 2021, 21, 2204. [Google Scholar] [CrossRef] [PubMed]
  21. Schachl, K.; Alemu, H.; Kalcher, K.; Moderegger, H.; Svancara, I.; Vytras, K. Amperometric determination of hydrogen peroxide with a manganese dioxide film-modified screen printed carbon electrode. Fresenius. J. Anal. Chem. 1998, 362, 194–200. [Google Scholar] [CrossRef]
  22. He, S.; Zhang, B.; Liu, M.; Chen, W. Non-enzymatic hydrogen peroxide electrochemical sensor based on a three-dimensional MnO2 nanosheets/carbon foam composite. RSC Adv. 2014, 4, 49315–49323. [Google Scholar] [CrossRef]
  23. Mailart, M.C.; Sakassegawa, P.A.; Torres, C.R.G.; Palo, R.M.; Borges, A.B. Assessment of peroxide in saliva during and after at-home bleaching with 10% carbamide and hydrogen peroxide gels: A clinical crossover trial. Oper. Dent. 2020, 45, 368–376. [Google Scholar] [CrossRef] [PubMed]
  24. Watt, B.E.; Proudfoot, A.T.; Vale, J.A. Hydrogen Peroxide Poisoning. Toxicol. Rev. 2004, 23, 51–57. [Google Scholar] [CrossRef] [PubMed]
  25. Moretto, L.M.; Metelka, R.; Scopece, P. Carbon Nanomaterials in Electrochemical Detection. In Carbon-Based Nanomaterials in Analytical Chemistry; Royal Society of Chemistry: London, UK, 2019; pp. 150–199. [Google Scholar]
  26. Genorio, B.; Znidarsic, A. Functionalization of graphene nanoribbons. J. Phys. D Appl. Phys. 2014, 47, 094012. [Google Scholar] [CrossRef]
  27. Kim, H.; Lee, K.; Woo, I.; Jung, Y. On the mechanism of enhanced oxygen reduction reaction in nitrogen-doped graphene nanoribbons. Phys. Chem. Chem. Phys. 2011, 13, 17505–17510. [Google Scholar] [CrossRef] [PubMed]
  28. Wu, Z.L.; Li, C.K.; Yu, J.G.; Chen, X.Q. MnO2/reduced graphene oxide nanoribbons: Facile hydrothermal preparation and their application in amperometric detection of hydrogen peroxide. Sens. Actuators B Chem. 2017, 239, 544–552. [Google Scholar] [CrossRef]
  29. Shi, L.; Niu, X.; Liu, T.; Zhao, H.; Lan, M. Electrocatalytic sensing of hydrogen peroxide using a screen printed carbon electrode modified with nitrogen-doped graphene nanoribbons. Microchim. Acta 2015, 182, 2485–2493. [Google Scholar] [CrossRef]
  30. Marcano, D.C.; Kosynkin, D.V.; Berlin, J.M.; Sinitskii, A.; Sun, Z.; Slesarev, A.S.; Alemany, L.B.; Lu, W.; Tour, J.M. Correction to Improved Synthesis of Graphene. ACS Nano 2018, 12, 2078. [Google Scholar] [CrossRef] [PubMed] [Green Version]
  31. Nosan, M.; Mario, L.; Jerman, I.; Kolar, M.; Katsounaros, I.; Genorio, B. Understanding the Oxygen Reduction Reaction Activity of Quasi-1D and 2D N-Doped Heat-Treated Graphene Oxide Catalysts with Inherent Metal Impurities. ACS Appl. Energy Mater. 2021, 4, 3593–3603. [Google Scholar] [CrossRef]
  32. Acik, M.; Lee, G.; Mattevi, C.; Pirkle, A.; Wallace, R.M.; Chhowalla, M.; Cho, K.; Chabal, Y. The Role of Oxygen during Thermal Reduction of Graphene Oxide Studied by Infrared Absorption Spectroscopy. J. Phys. Chem. C 2011, 115, 19761–19781. [Google Scholar] [CrossRef]
  33. Shornikova, O.N.; Kogan, E.V.; Sorokina, N.E.; Avdeev, V. V The Specific Surface Area and Porous Structure of Graphite Materials. Russ. J. Phys. Chem. A 2009, 83, 1022–1025. [Google Scholar] [CrossRef]
  34. Singh, S.K.; Takeyasu, K.; Nakamura, J. Active Sites and Mechanism of Oxygen Reduction Reaction Electrocatalysis on Nitrogen-Doped Carbon Materials. Adv. Mater. 2019, 31, 1804297. [Google Scholar] [CrossRef] [PubMed]
  35. Zhang, S.; Wang, H.; Zhang, N.; Kong, F.; Liu, H.; Yin, G. Role of Pt-pyridinic nitrogen sites in methanol oxidation on Pt/polypyrrole-carbon black Catalyst. J. Power Sources 2012, 197, 44–49. [Google Scholar] [CrossRef]
  36. Brycht, M.; Leniart, A.; Zavašnik, J.; Nosal-Wiercińska, A.; Wasiński, K.; Półrolniczak, P.; Skrzypek, S.; Kalcher, K. Paste electrode based on the thermally reduced graphene oxide in ambient air–Its characterization and analytical application for analysis of 4–chloro–3,5–dimethylphenol. Electrochim. Acta 2018, 282, 233–241. [Google Scholar] [CrossRef]
  37. Moreira, F.; de Andrade Maranhão, T.; Spinelli, A. Carbon paste electrode modified with Fe3O4 nanoparticles and BMI.PF6 ionic liquid for determination of estrone by square-wave voltammetry. J. Solid State Electrochem. 2018, 22, 1303–1313. [Google Scholar] [CrossRef]
  38. Benvidi, A.; Nafar, M.T.; Jahanbani, S.; Tezerjani, M.D.; Rezaeinasab, M.; Dalirnasab, S. Developing an electrochemical sensor based on a carbon paste electrode modified with nano-composite of reduced graphene oxide and CuFe2O4 nanoparticles for determination of hydrogen peroxide. Mater. Sci. Eng. C 2017, 75, 1435–1447. [Google Scholar] [CrossRef] [PubMed]
  39. Radić, J.; Buljac, M.; Genorio, B.; Gričar, E.; Kolar, M. A novel reduced graphene oxide modified carbon paste electrode for potentiometric determination of trihexyphenidyl hydrochloride in pharmaceutical and biological matrices. Sensors 2021, 21, 2955. [Google Scholar] [CrossRef]
  40. El-Kosasy, A.M.; Abdel Rahman, M.H.; Abdelaal, S.H. Graphene nanoplatelets in potentiometry: A nanocomposite carbon paste and PVC based membrane sensors for analysis of Vilazodone HCl in plasma and milk samples. Talanta 2019, 193, 9–14. [Google Scholar] [CrossRef] [PubMed]
  41. AlAqad, K.M.; Suleiman, R.; Al Hamouz, O.C.S.; Saleh, T.A. Novel graphene modified carbon-paste electrode for promazine detection by square wave voltammetry. J. Mol. Liq. 2018, 252, 75–82. [Google Scholar] [CrossRef]
  42. Elgrishi, N.; Rountree, K.J.; McCarthy, B.D.; Rountree, E.S.; Eisenhart, T.T.; Dempsey, J.L. A Practical Beginner’s Guide to Cyclic Voltammetry. J. Chem. Educ. 2018, 95, 197–206. [Google Scholar] [CrossRef]
  43. Swartz, M.; Krull, I.S. Analytical Method Development and Validation for the Academic Researcher; Taylor & Francis: Abingdon, UK, 1999. [Google Scholar]
  44. Bohlooli, F.; Yamatogi, A.; Mori, S. Manganese oxides/carbon nanowall nanocomposite electrode as an efficient non-enzymatic electrochemical sensor for hydrogen peroxide. Sens. Bio-Sensing Res. 2021, 31, 100392. [Google Scholar] [CrossRef]
  45. Li, Y. Safety and Toxicologic Consideratios for Tooth Bleaching. In Tooth Whitening Techniques; Greenwall, L., Ed.; CRC Press Taylor & Francis Group: London, UK, 2017; pp. 307–316. [Google Scholar]
  46. Kawanishi, S.; Inoue, S.; Yamamoto, K. Hydroxyl radical and singlet oxygen production and DNA damage induced by carcinogenic metal compounds and hydrogen peroxide. Biol. Trace Elem. Res. 1989, 21, 367–372. [Google Scholar] [CrossRef] [PubMed]
Figure 1. SEM images of (a) htGO (KS6L), (b) N-doped htGO (KS6L), (c) htGONR (M-grade), and (d) N-doped htGONR (M-grade) materials.
Sensors 21 08301 g001
Figure 2. Cyclic voltammograms for measurements with bare CPE, CPE/htGO/MnO2/Nafion, CPE/N-htGO/MnO2/Nafion, CPE/htGONR/MnO2/Nafion, and CPE/N-htGONR/MnO2/Nafion in 0.1 M PB solution (pH 7.4) containing 5 mM [Fe(CN)6]3–/4–.
Sensors 21 08301 g002
Figure 3. Cyclic voltammograms (a) and Nyquist plots (b) for measurements with bare CPE, CPE/Nafion, CPE/N-htGONR, CPE/MnO2, and CPE/N-htGONR/MnO2/Nafion in 0.1 M PB solution (pH 7.4) containing 5 mM [Fe(CN)6]3–/4–.
Sensors 21 08301 g003
Figure 4. (a) Amperogram and (b) calibration curve obtained by adding five times 1 µM, five times 5 µM, seven times 10 µM and ten times 20 µM aliquots of H2O2 standard solution (in 0.1 M PB with pH 7.4). Operating potential was 0.65 V. The insert of Figure 4 (b) shows five additions of 1 µM aliquots, used to calculate LOD.
Sensors 21 08301 g004
Figure 5. (a) Average current change for 5 µM H2O2 additions for each of the prepared electrodes in reproducibility study. (b) Percentage of the sensor’s retained initial response after 0–15 days in durability study.
Sensors 21 08301 g005
Table 1. Results of BET analysis, C, H, N analysis, and Mn concentration, obtained by ICP-MS analysis [31].
MaterialC (at %)H (at %)N (at %)Pyridinic N (at %)SBET (m2/g)w (Mn) (mg/g)
htGO76.912.70.00.0602.14.1
htGONR72.320.10.00.0296.51.6
N-htGO75.29.18.23.62129.72.9
N-htGONR73.19.27.22.9985.41.2
Table 2. Comparison of previously reported non-enzymatic electrochemical H2O2 sensors using similar approaches with the proposed CPE/N-htGONR/MnO2/Nafion sensor.
Electrode CompositionLinear Range (µM)Slope (µA/µM)LOD (µM)Ref.
CPE/N-htGONR/MnO2/Nafion1.0–3000.06770.08This work
MnO2-MWCNT/CPE0.001870.6[19]
MnOx/CNW40–102300.4390.55[44]
MnO2/rGONR0.25–24550.01420.071[28]
PB/Pd-Al5–340.05084[16]
Table 3. Comparison of previously reported non-enzymatic electrochemical H2O2 sensors using similar approaches with the proposed CPE/N-htGONR/MnO2/Nafion sensor.
Measurement No.Analyte Found (%)Recovery (%)
12.8394.3
22.9498.0
32.8896.0
Publisher’s Note: MDPI stays neutral with regard to jurisdictional claims in published maps and institutional affiliations.

