
Bio-Impedance Sensor for Real-Time Artery Diameter Waveform Assessment


Abstract
:1. Introduction
2. Materials and Methods
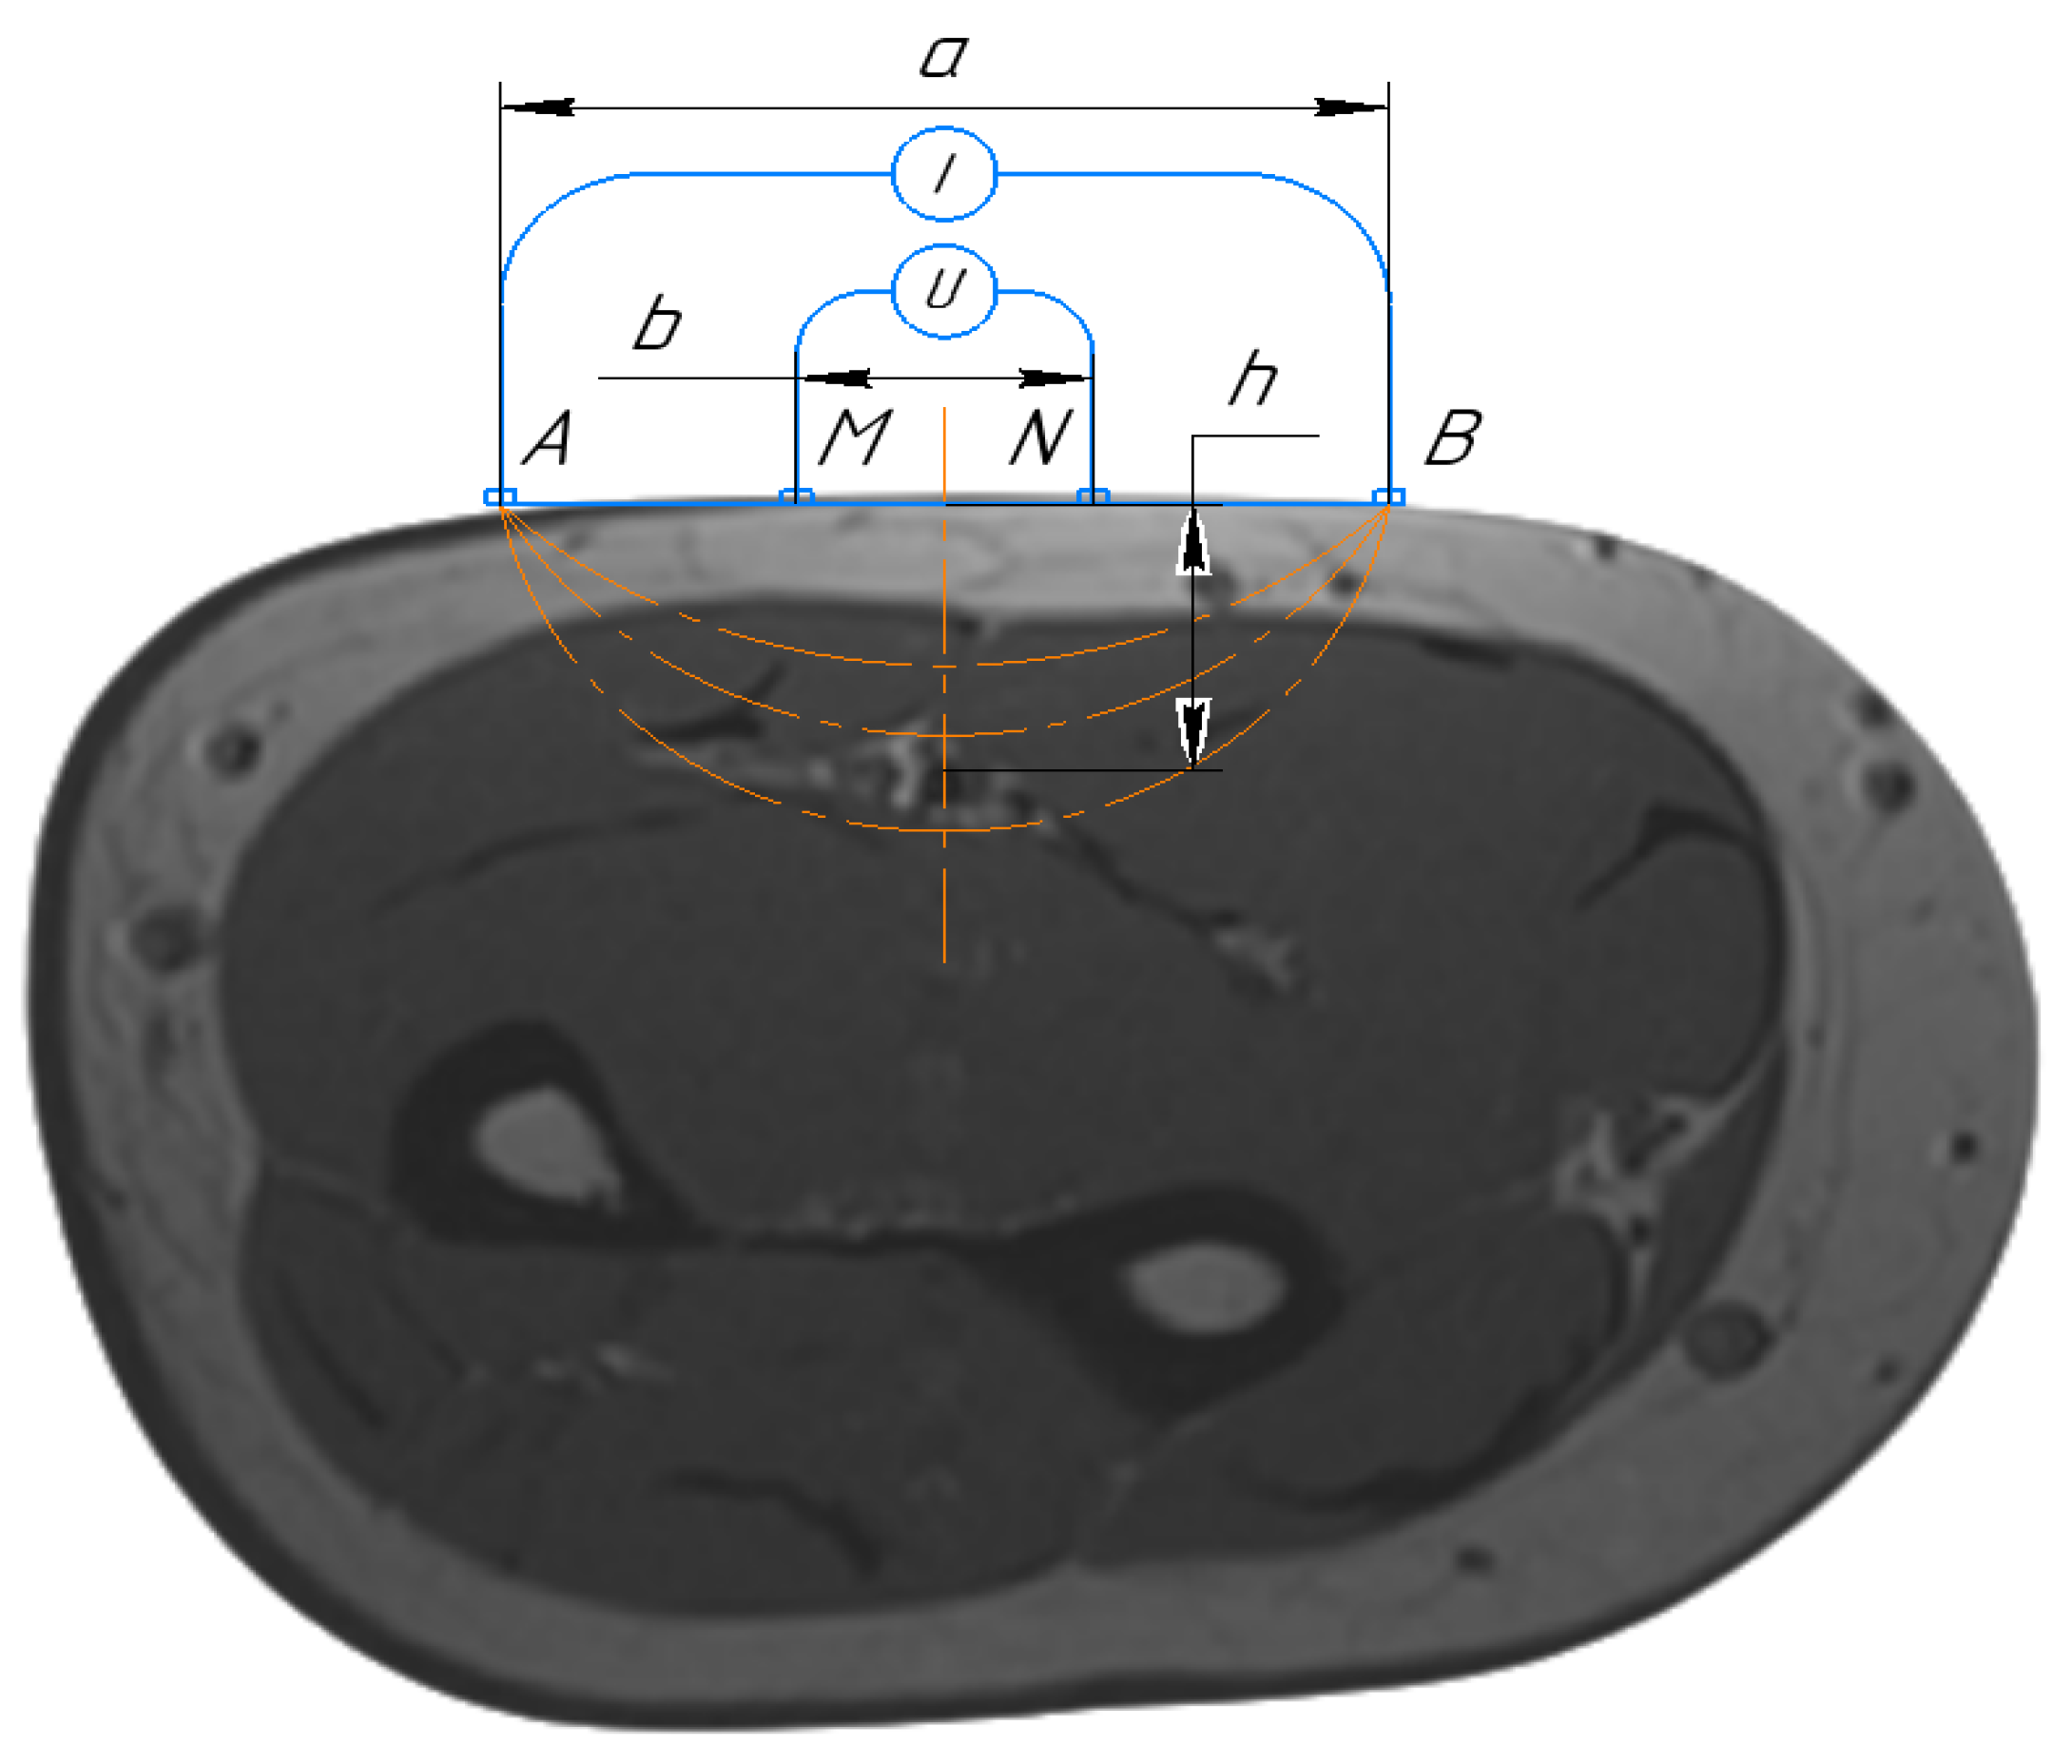
2.1. Mathematical Model
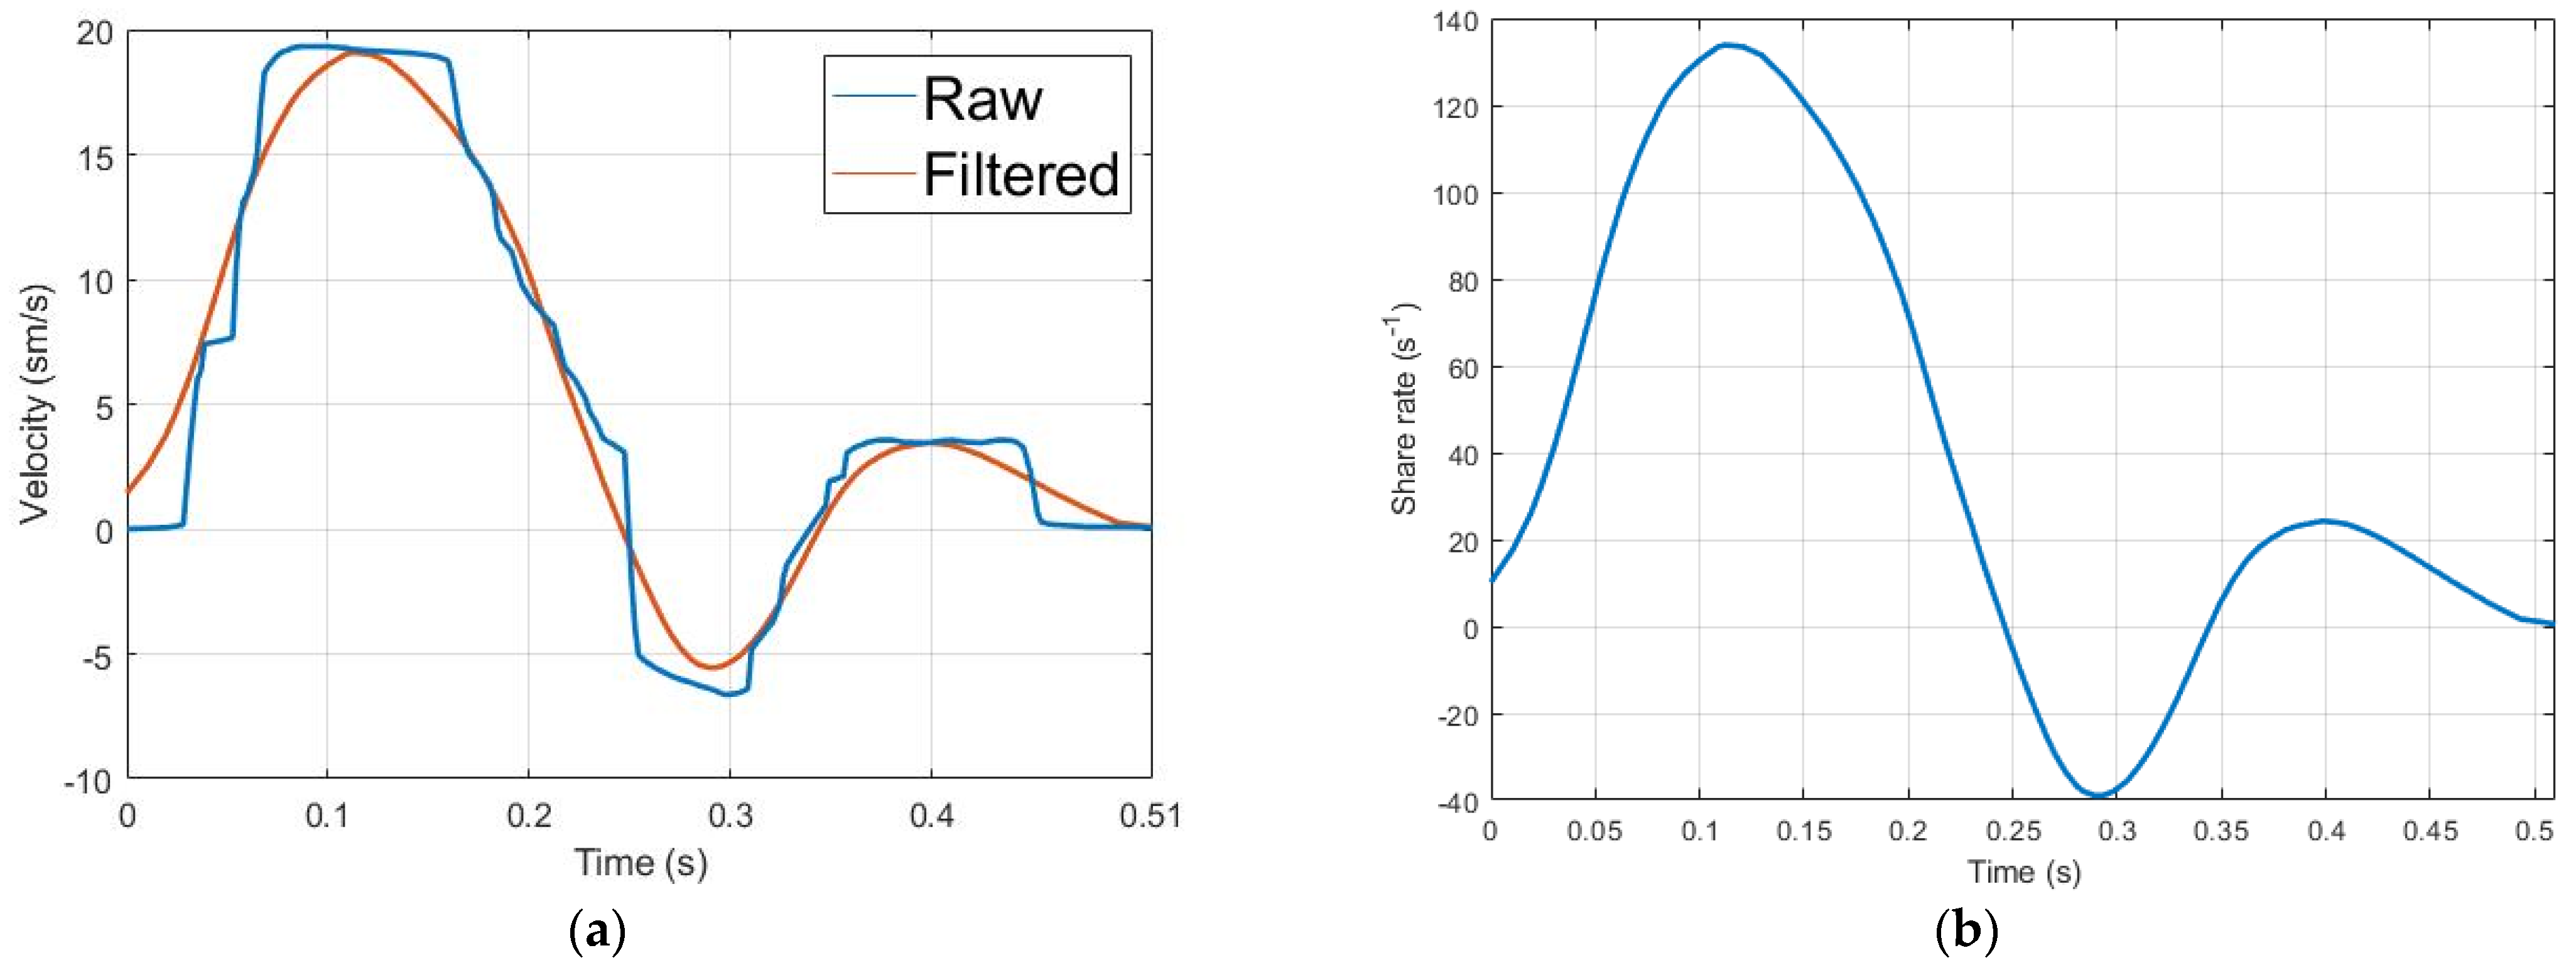
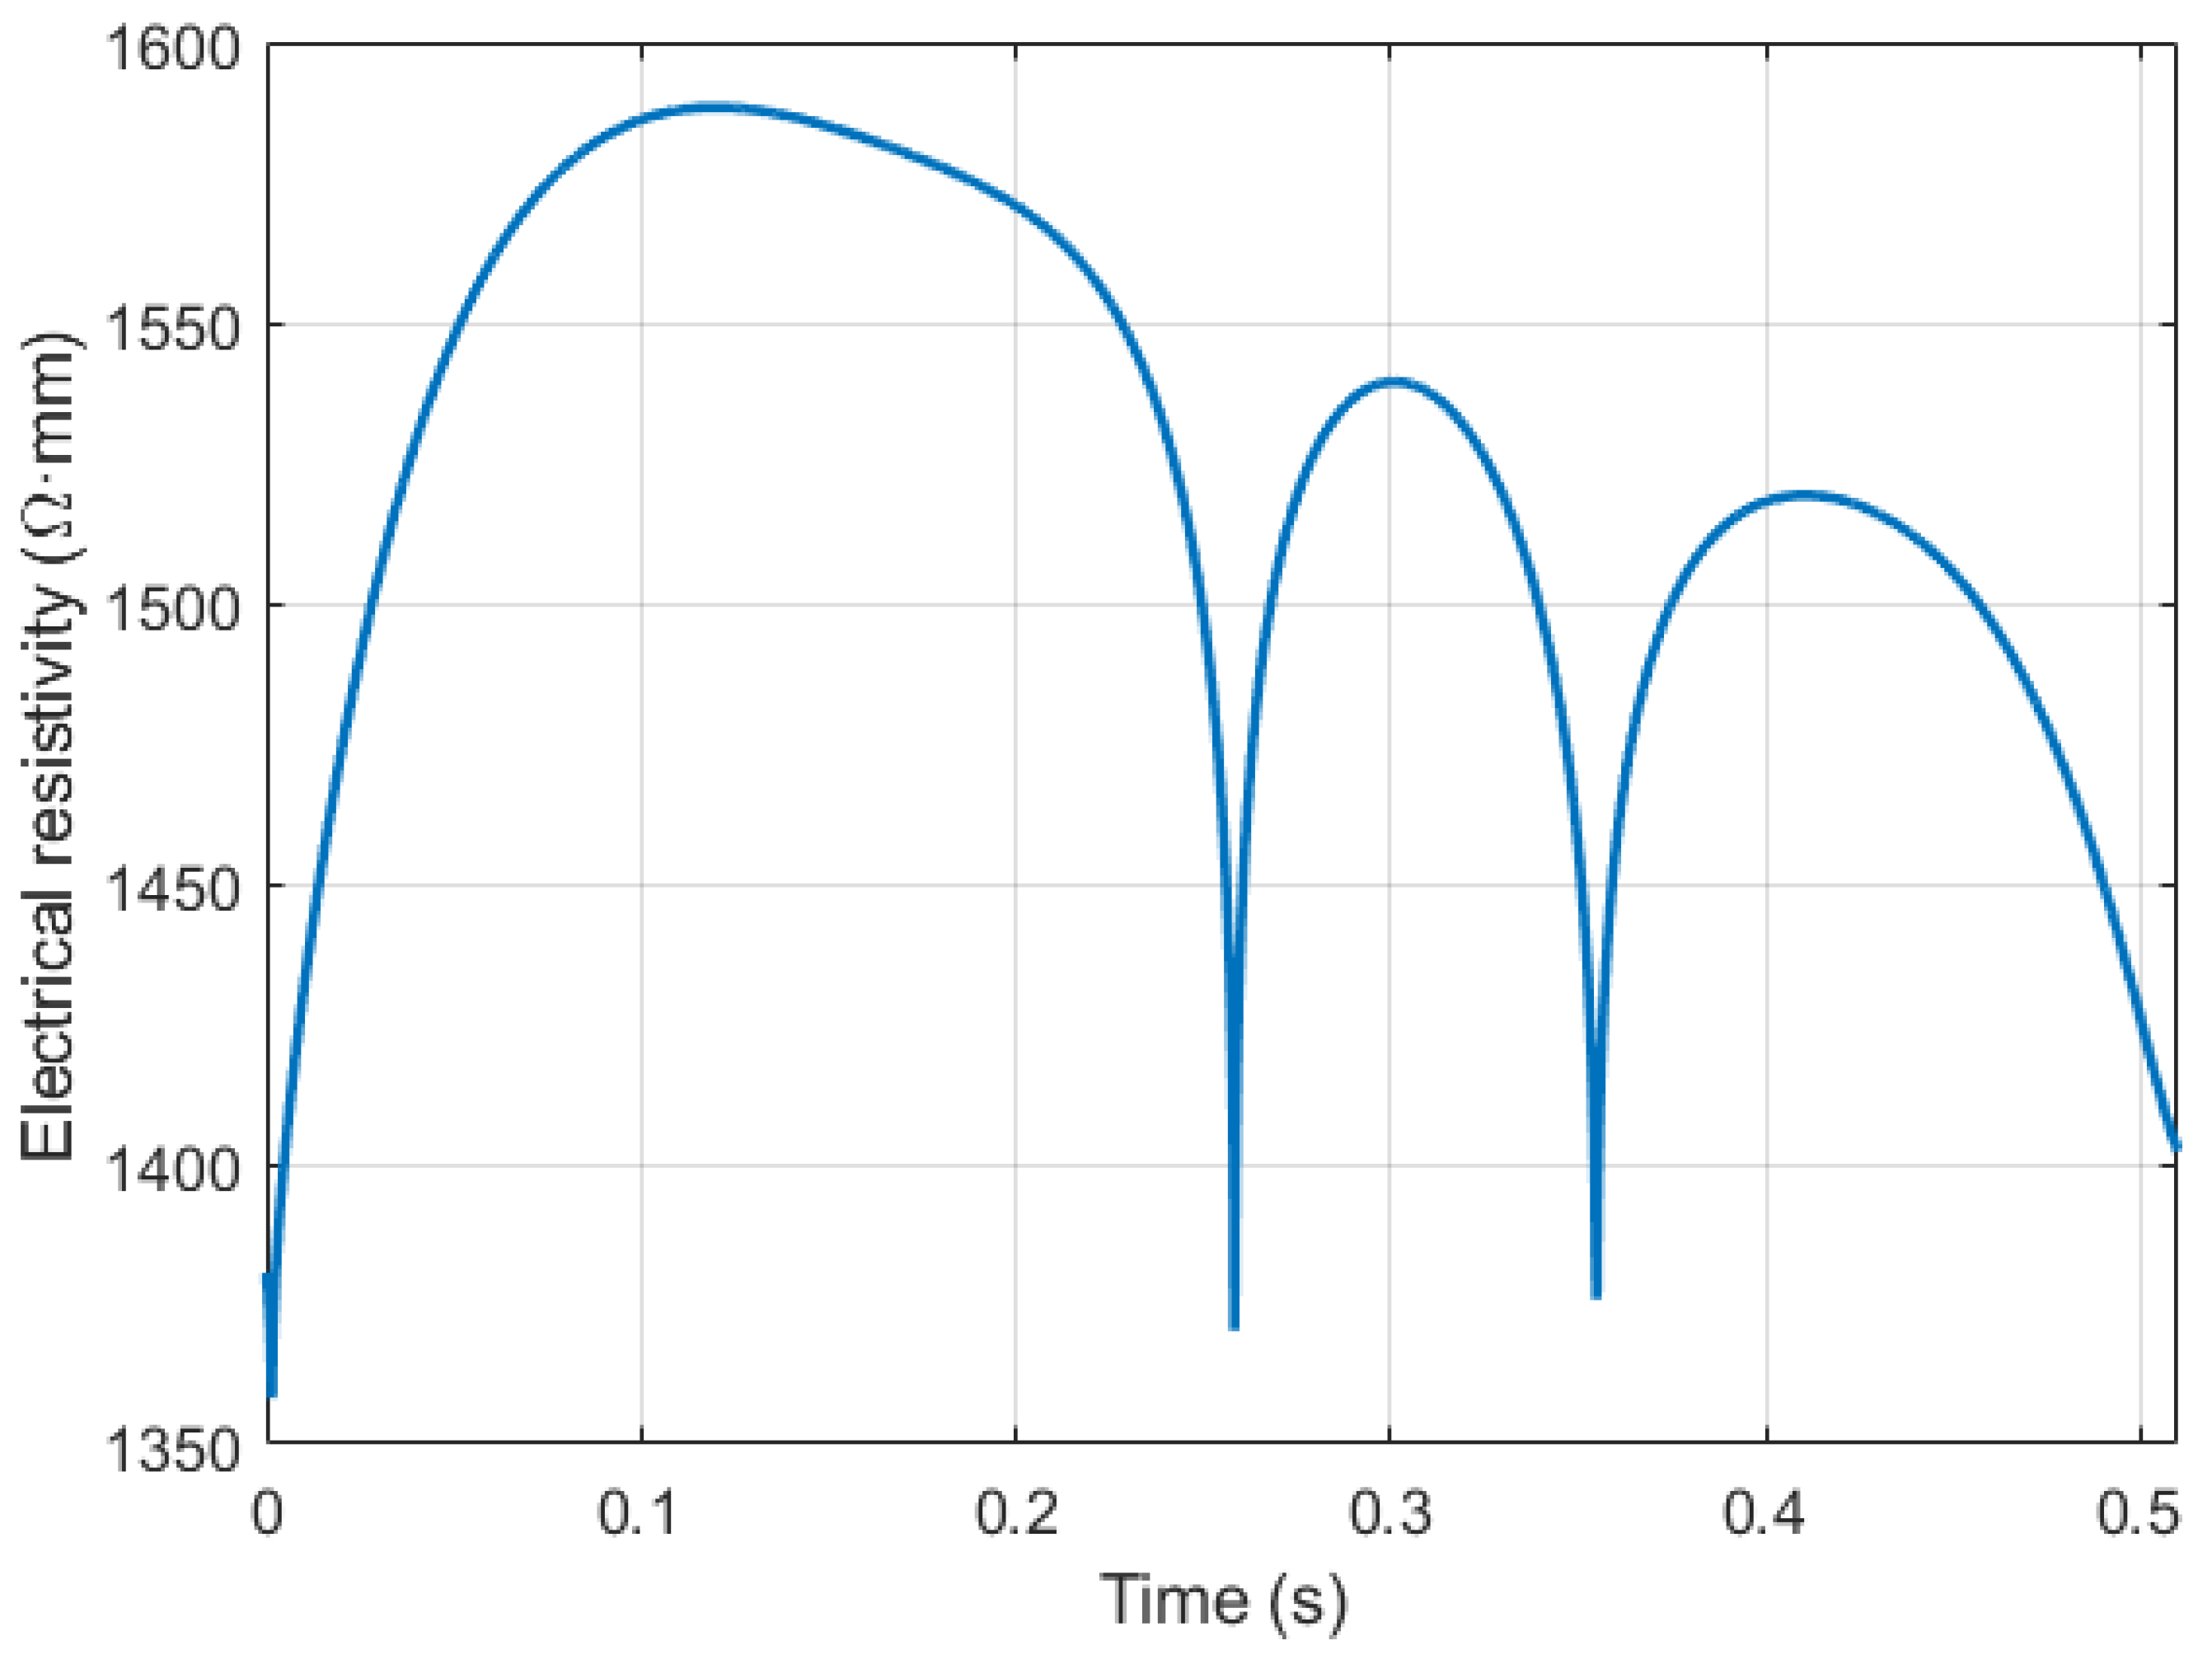
2.2. Red Blood Cell Orientation Effect Estimation
2.3. Elastic Modulus Estimation
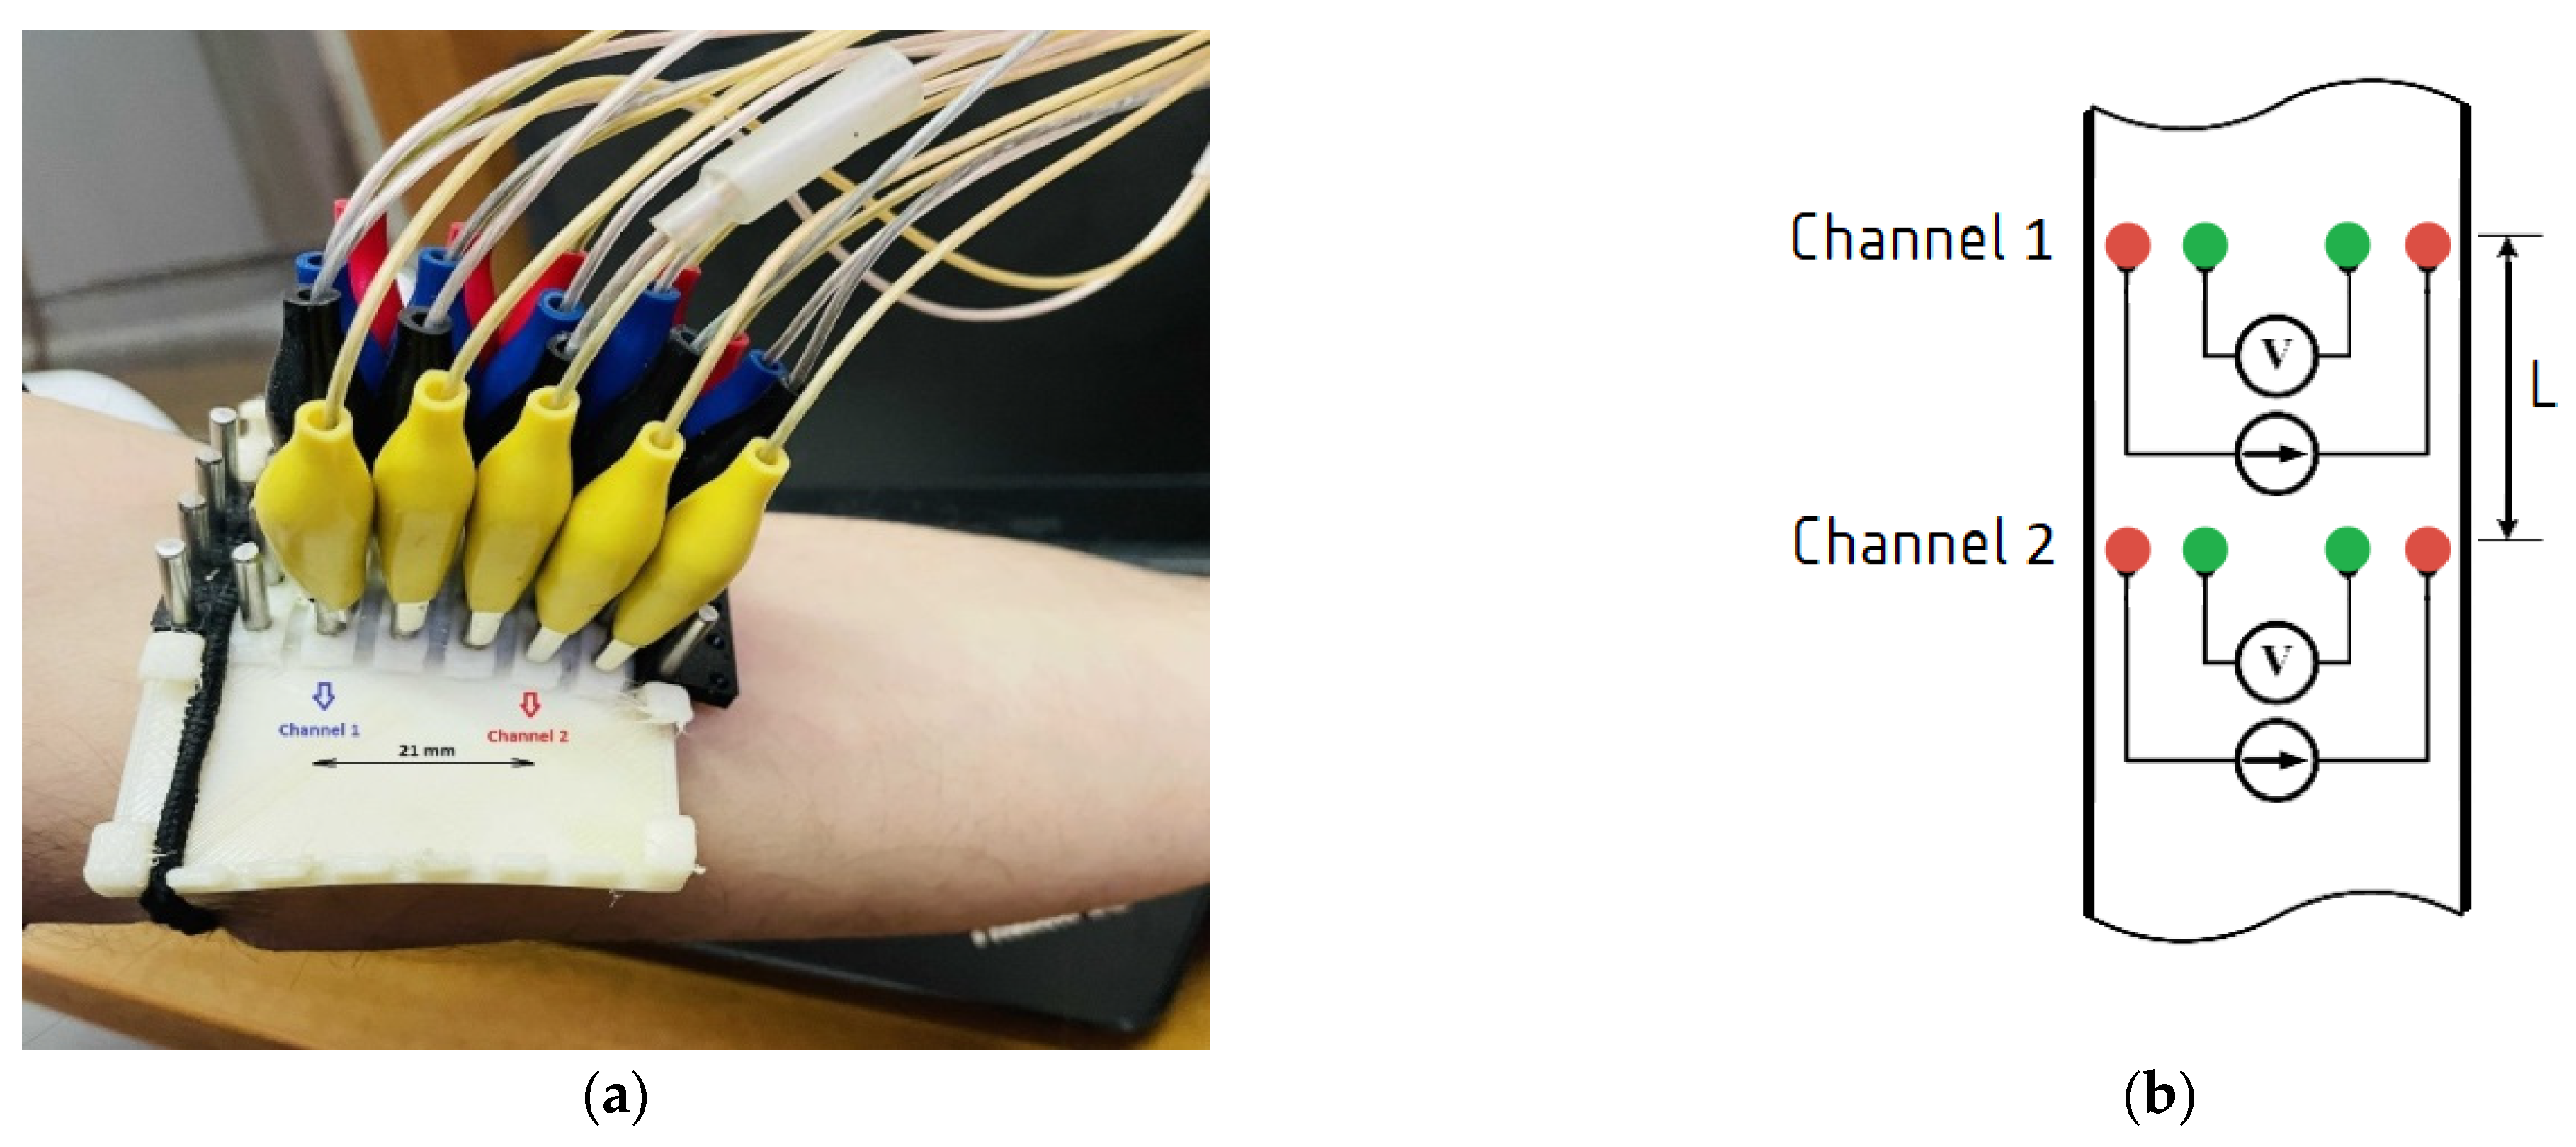
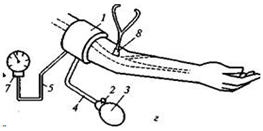
2.4. Experimental Setup
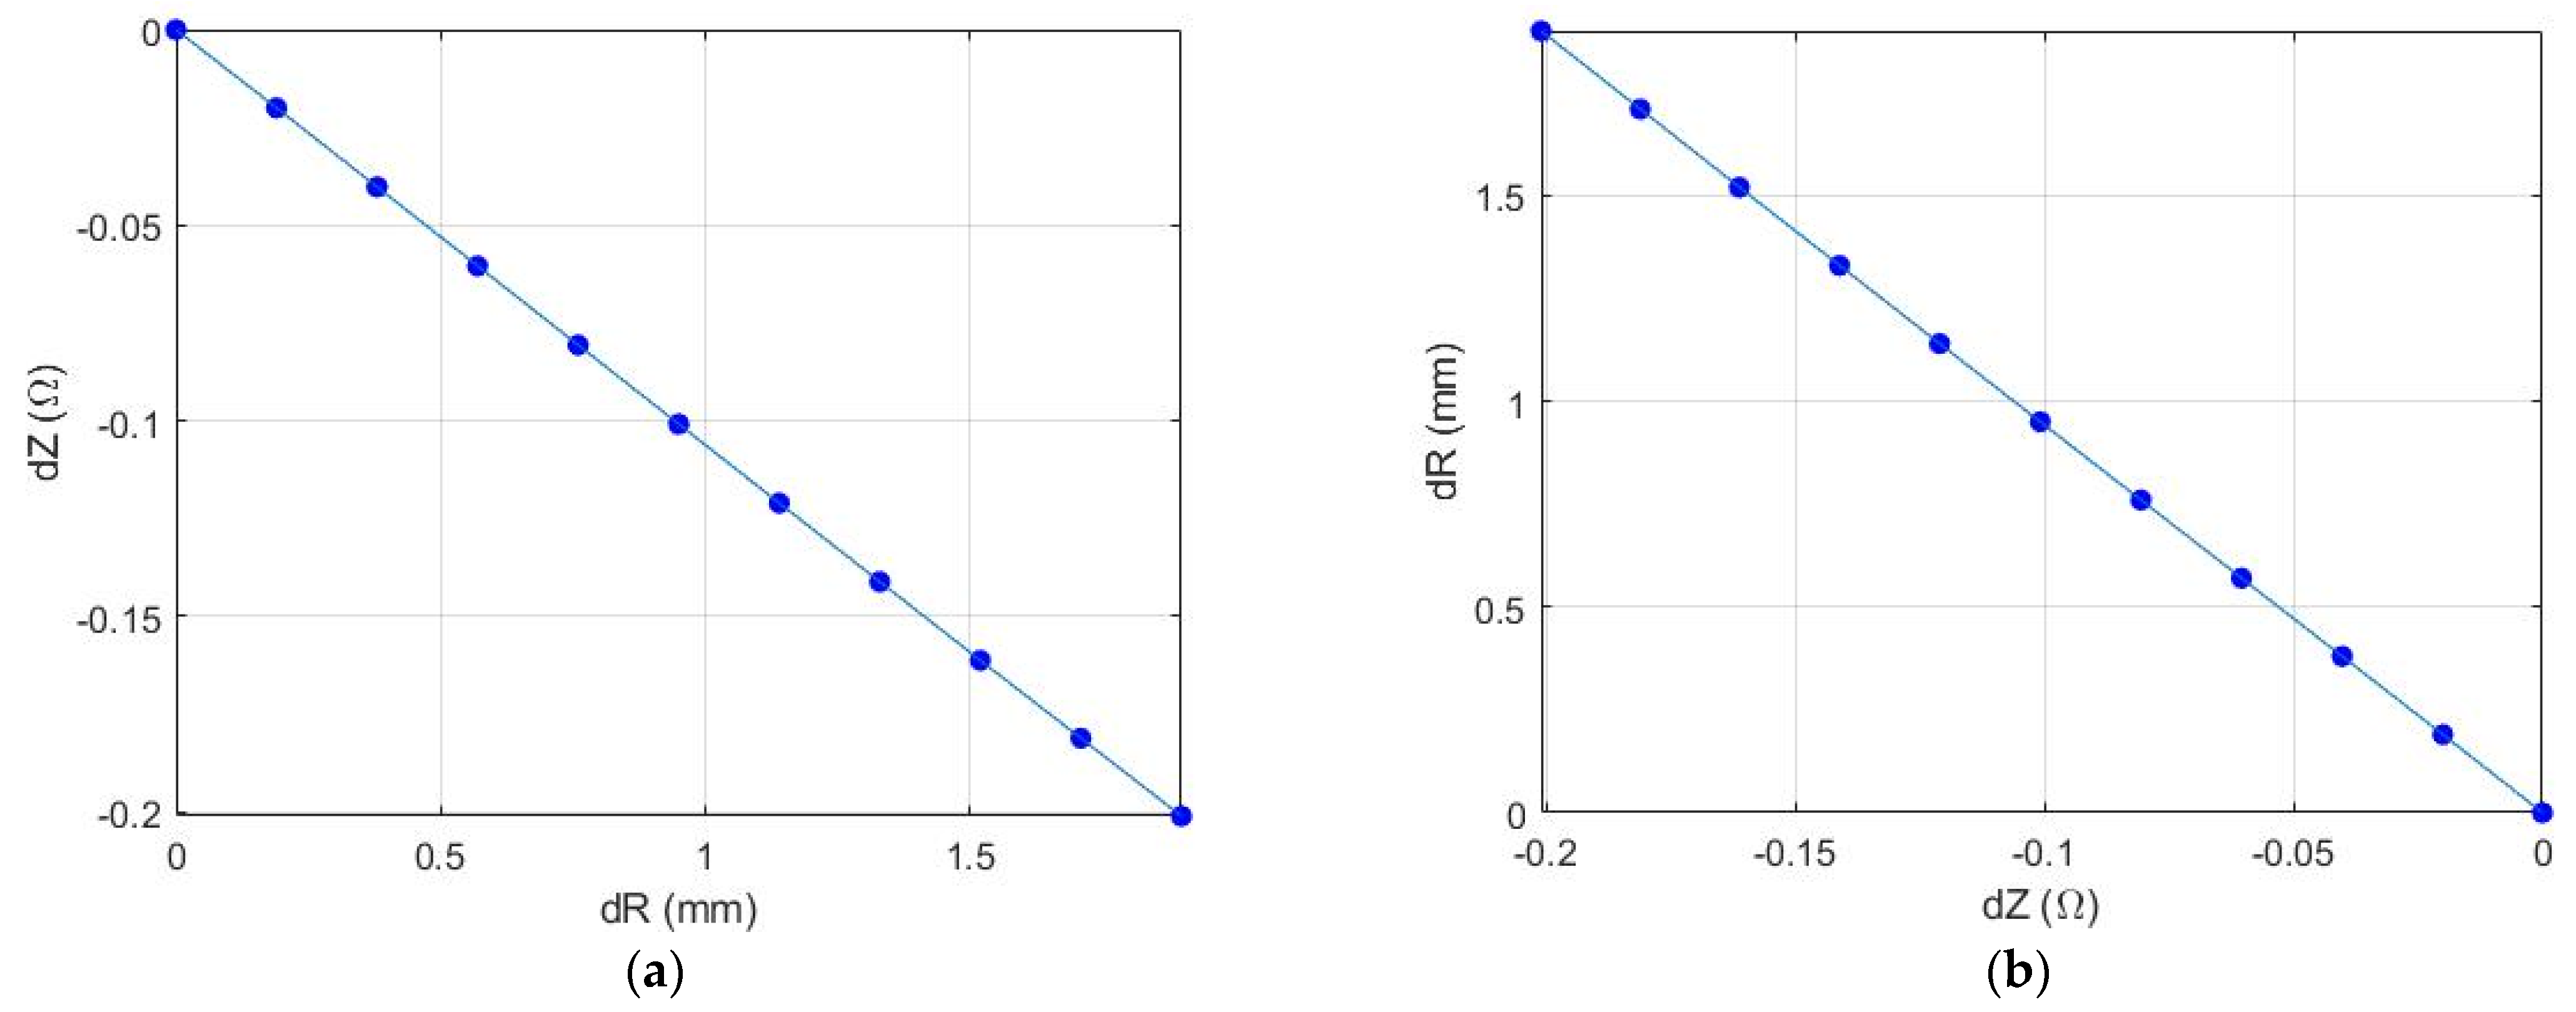
3. Results
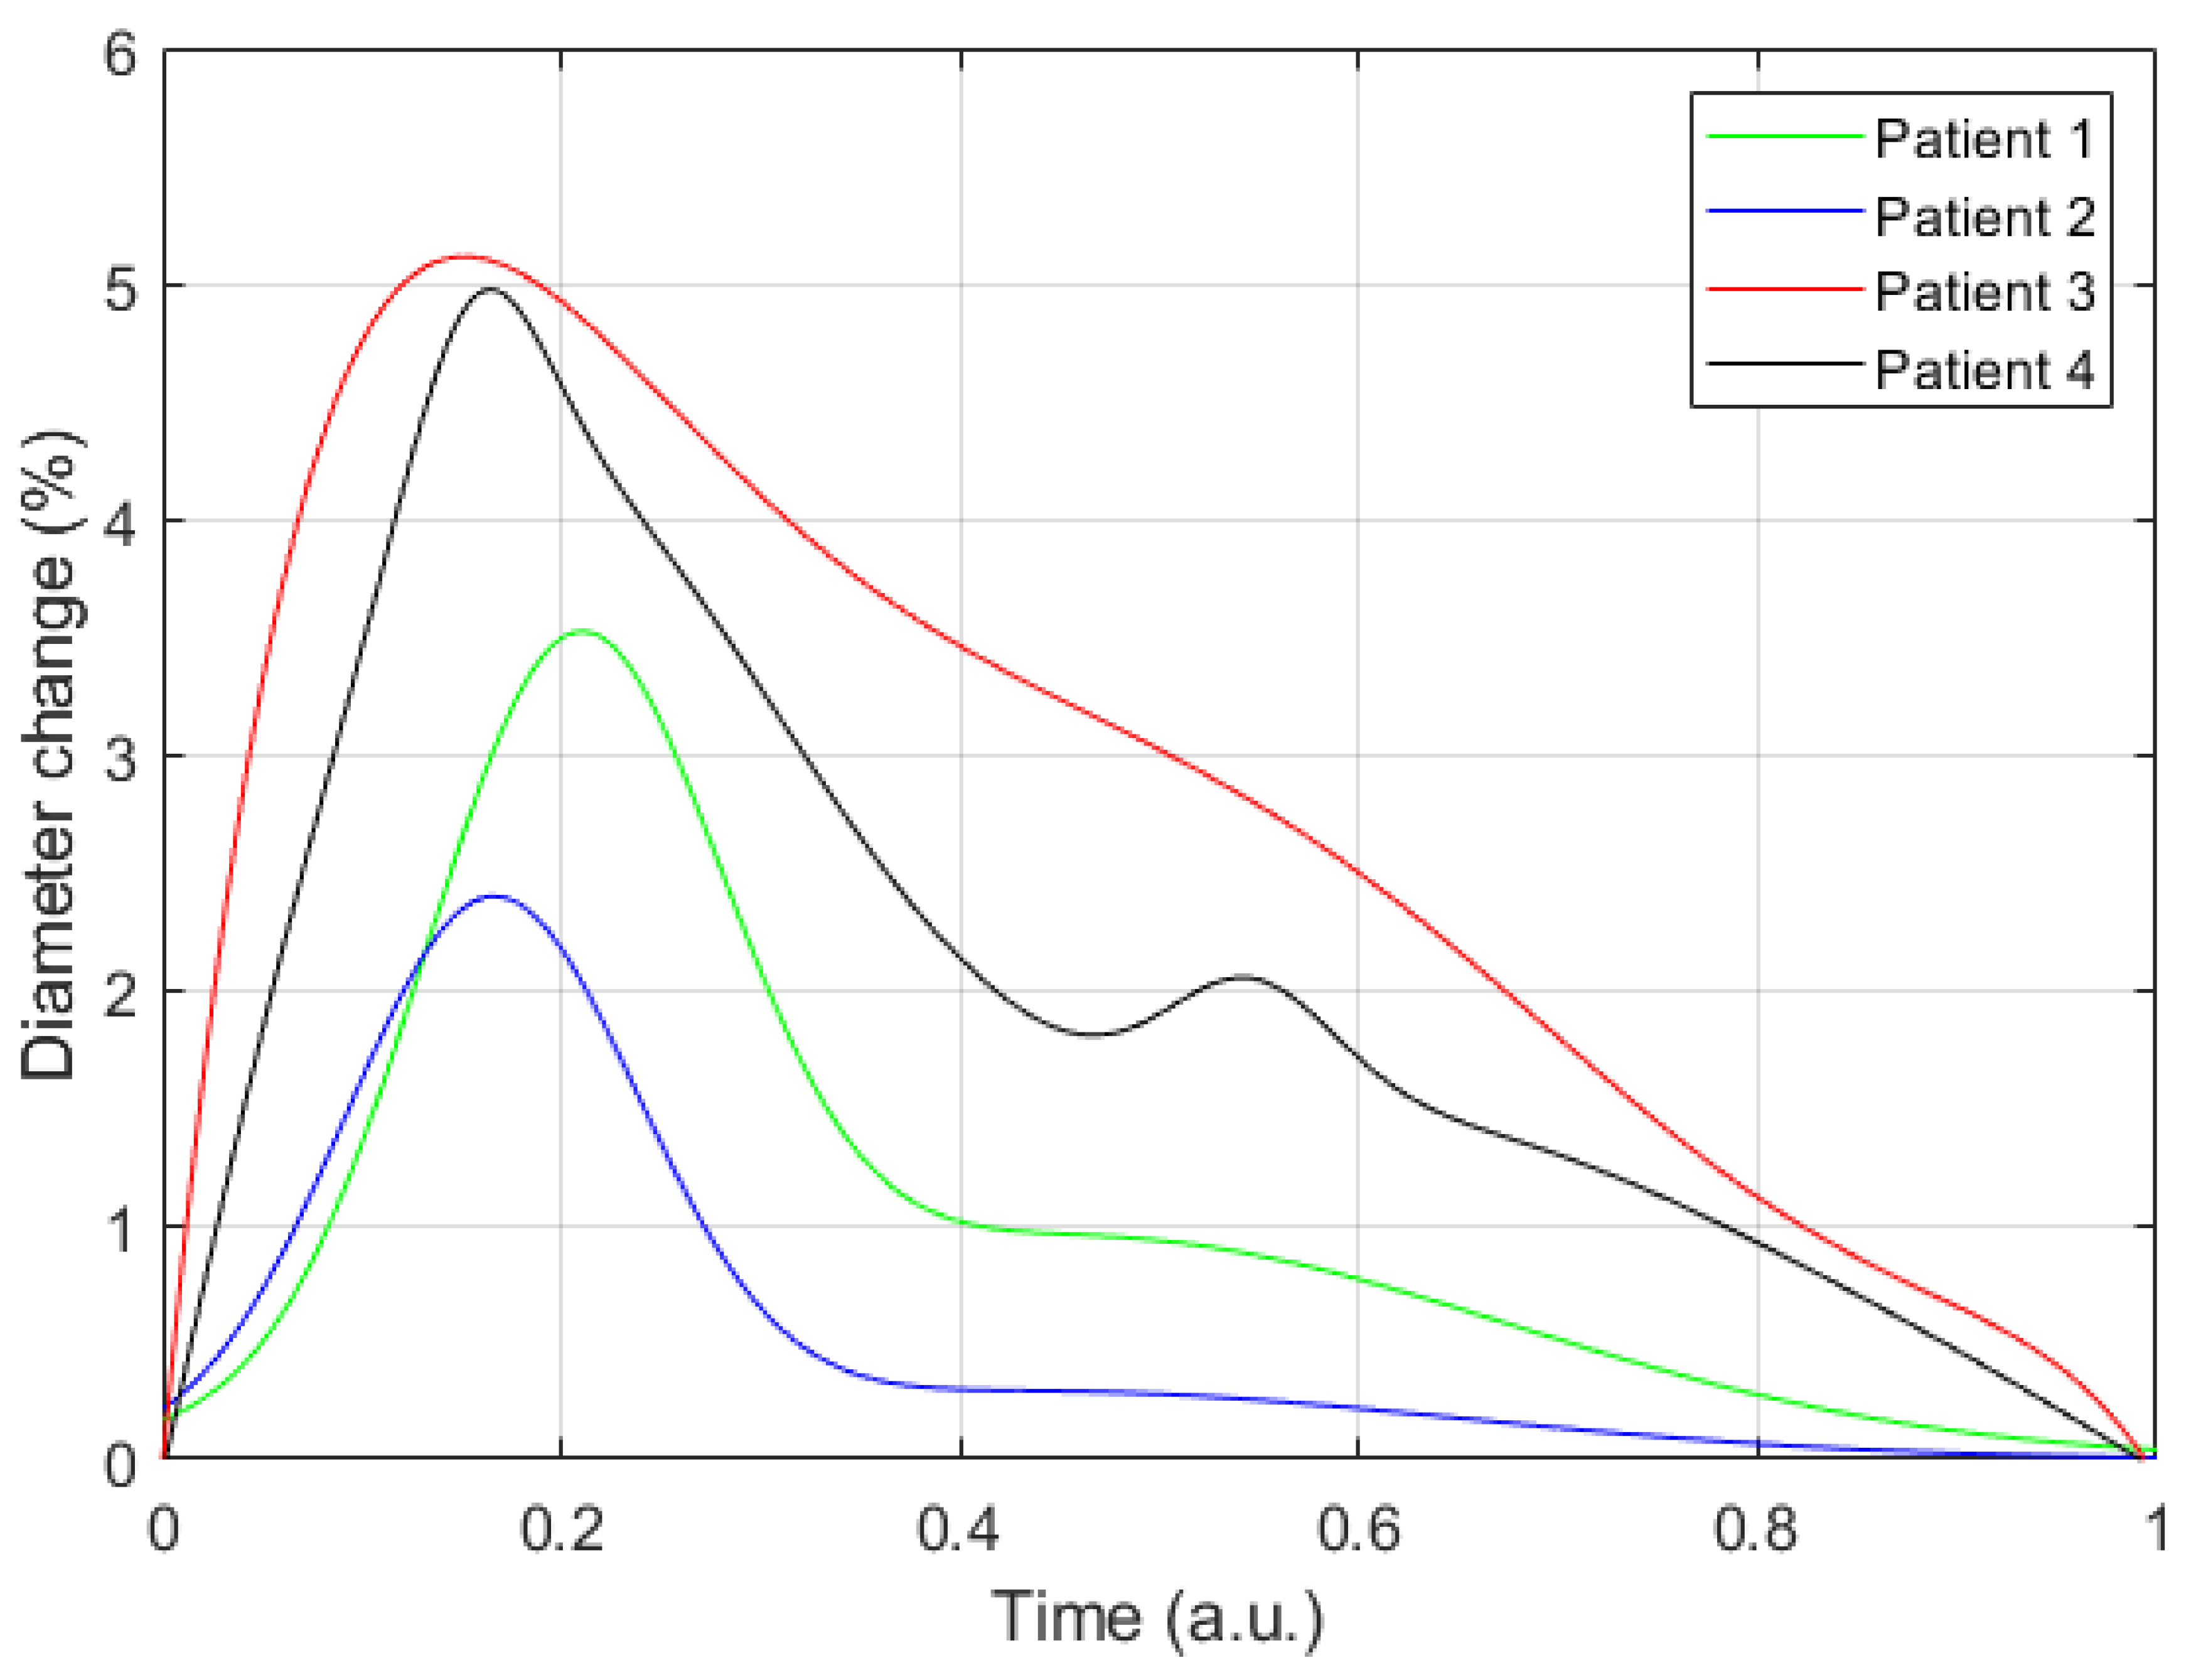
4. Discussion
Author Contributions
Funding
Institutional Review Board Statement
Informed Consent Statement
Data Availability Statement
Conflicts of Interest
References
- Zakrzewski, A.M.; Anthony, B.W. Noninvasive Blood Pressure Estimation Using Ultrasound and Simple Finite Element Models. IEEE Trans. Biomed. Eng. 2018, 65, 2011–2022. [Google Scholar] [CrossRef]
- Seo, J.; Pietrangelo, S.J.; Lee, H.-S.; Sodini, C.G. Noninvasive arterial blood pressure waveform monitoring using two- element ultrasound system. IEEE Trans. Ultrason. Ferroelectr. Freq. Control 2015, 62, 776–784. [Google Scholar] [CrossRef]
- Oliver, J.J.; Webb, D.J. Noninvasive assessment of arterial stiffness and risk of atherosclerotic events. Arterioscler. Thromb. Vasc. Biol. 2003, 23, 554–566. [Google Scholar] [CrossRef] [Green Version]
- Hirai, T.; Sasayama, S.; Kawasaki, T.; Yagi, S. Stiffness of systemic arteries in patients with myocardial infarction. A noninvasive method to predict severity of coronary atherosclerosis. Circulation 1989, 80, 78–86. [Google Scholar] [CrossRef] [PubMed] [Green Version]
- Seo, J.; Lee, H.-S.; Sodini, C. Non-Invasive Evaluation of a Carotid Arterial Pressure Waveform Using Motion-Tolerant Ultrasound Measurements During the Valsalva Maneuver. IEEE J. Biomed. Health Inform. 2021, 25, 163–174. [Google Scholar] [CrossRef]
- Nabeel, P.M.; Joseph, J.; Karthik, S.; Sivaprakasam, M.; Chenniappan, M. Bi-Modal Arterial Compliance Probe for Calibration-Free Cuffless Blood Pressure Estimation. IEEE Trans. Biomed. Eng. 2018, 65, 2392–2404. [Google Scholar] [CrossRef]
- Mukherjee, R.; Ghosh, S.; Gupta, B.; Chakravarty, T. A Literature Review on Current and Proposed Technologies of Noninvasive Blood Pressure Measurement. Telemed. J. E-Health Off. J. Am. Telemed. Assoc. 2018, 24, 185–193. [Google Scholar] [CrossRef]
- Nitzan, M.; Adar, Y.; Hoffman, E.; Shalom, E.; Engelberg, S.; Ben-Dov, I.Z.; Bursztyn, M. Comparison of systolic blood pressure values obtained by photoplethysmography and by Korotkoff sounds. Sensors 2013, 13, 14797–14812. [Google Scholar] [CrossRef] [PubMed] [Green Version]
- Pickering, T.; Appel, L.; Falkner, B.; Jones, D.; Kurtz, T.; Sheps, S.; Roccella, E. Recommendations for Blood Pressure Measurement in Humans and Experimental Animals. Hypertension 2005, 45, 142–161. [Google Scholar] [CrossRef] [PubMed]
- Chung, E.; Chen, G.; Alexander, B.; Cannesson, M. Non-invasive continuous blood pressure monitoring: A review of current applications. Front. Med. 2013, 7, 91–101. [Google Scholar] [CrossRef]
- Forouzanfar, M.; Dajani, H.R.; Groza, V.Z.; Bolic, M.; Rajan, S.; Batkin, I. Oscillometric blood pressure estimation: Past, present, and future. IEEE Rev. Biomed. Eng. 2015, 8, 44–63. [Google Scholar] [CrossRef]
- Gemignani, V.; Faita, F.; Ghiadoni, L.; Poggianti, E.; Demi, M. A system for real-time measurement of the brachial artery diameter in B-mode ultrasound images. IEEE Trans. Med. Imaging 2007, 26, 393–404. [Google Scholar] [CrossRef] [PubMed]
- Cary, T.W.; Reamer, C.B.; Sultan, L.R.; Mohler III, E.R.; Sehgal, C.M. Brachial artery vasomotion and transducer pressure effect on measurements by active contour segmentation on ultrasound. Med. Phys. 2014, 41, 022901. [Google Scholar] [CrossRef] [Green Version]
- Wang, C.; Li, X.; Hu, H.; Zhang, L.; Huang, Z.; Lin, M.; Zhang, Z.; Yin, Z.; Huang, B.; Gong, H. Monitoring of the central blood pressure waveform via a conformal ultrasonic device. Nat. Biomed. Eng. 2018, 2, 687–695. [Google Scholar] [CrossRef]
- Xing, X.; Sun, M. Optical blood pressure estimation with photoplethysmography and FFT-based neural networks. Biomed. Opt. Express 2016, 7, 3007–3020. [Google Scholar] [CrossRef] [Green Version]
- Terry, S.; Eckerle, J.; Kornbluh, R.; Low, T.; Ablow, C. Silicon pressure transducer arrays for blood-pressure measurement. Sens. Actuators Phys. 1990, 23, 1070–1079. [Google Scholar] [CrossRef]
- Mukkamala, R.; Hahn, J.-O.; Inan, O.T.; Mestha, L.K.; Kim, C.-S.; Töreyin, H.; Kyal, S. Toward Ubiquitous Blood Pressure Monitoring via Pulse Transit Time: Theory and Practice. IEEE Trans. Biomed. Eng. 2015, 62, 1879–1901. [Google Scholar] [CrossRef] [Green Version]
- Chio, S.-S.; Urbina, E.M.; Lapointe, J.; Tsai, J.; Berenson, G.S. Korotkoff sound versus oscillometric cuff sphygmomanometers: Comparison between auscultatory and DynaPulse blood pressure measurements. J. Am. Soc. Hypertens. JASH 2011, 5, 12–20. [Google Scholar] [CrossRef] [PubMed]
- Babbs, C.F. The origin of Korotkoff sounds and the accuracy of auscultatory blood pressure measurements. J. Am. Soc. Hypertens. JASH 2015, 9, 935–950.e3. [Google Scholar] [CrossRef] [Green Version]
- John, O.; Campbell, N.R.C.; Brady, T.M.; Farrell, M.; Varghese, C.; Velazquez Berumen, A.; Velez Ruiz Gaitan, L.A.; Toffelmire, N.; Ameel, M.; Mideksa, M.; et al. The 2020 “WHO Technical Specifications for Automated Non-Invasive Blood Pressure Measuring Devices With Cuff”. Hypertens. Dallas Tex 1979 2021, 77, 806–812. [Google Scholar] [CrossRef] [PubMed]
- Daochai, S.; Sroykham, W.; Kajornpredanon, Y.; Apaiwongse, C. Non-invasive blood pressure measurement: Auscultatory method versus oscillometric method. In Proceedings of the 4th 2011 Biomedical Engineering International Conference, Chiang Mai, Thailand, 29–31 January 2012. [Google Scholar] [CrossRef]
- Kapse, C.D.; Patil, B.R. Auscultatory and Oscillometric methods of Blood pressure measurement: A Survey. Int. J. Eng. Res. Appl. 2013, 3, 528–533. [Google Scholar]
- Bonnafoux, P. Auscultatory and oscillometric methods of ambulatory blood pressure monitoring, advantages and limits: A technical point of view. Blood Press. Monit. 1996, 1, 181–185. [Google Scholar] [PubMed]
- Lamb, T.S.; Thakrar, A.; Ghosh, M.; Wilson, M.P.; Wilson, T.W. Comparison of two oscillometric blood pressure monitors in subjects with atrial fibrillation. Clin. Investig. Med. Med. Clin. Exp. 2010, 33, E54–E62. [Google Scholar] [CrossRef] [PubMed] [Green Version]
- Benmira, A.; Perez-Martin, A.; Schuster, I.; Aichoun, I.; Coudray, S.; Bereksi-Reguig, F.; Dauzat, M. From Korotkoff and Marey to automatic non-invasive oscillometric blood pressure measurement: Does easiness come with reliability? Expert Rev. Med. Devices 2016, 13, 179–189. [Google Scholar] [CrossRef] [PubMed]
- Babbs, C.F. Oscillometric measurement of systolic and diastolic blood pressures validated in a physiologic mathematical model. Biomed. Eng. Online 2012, 11, 56. [Google Scholar] [CrossRef] [PubMed] [Green Version]
- Sahu, D.; Bhaskaran, M. Palpatory method of measuring diastolic blood pressure. J. Anaesthesiol. Clin. Pharmacol. 2010, 26, 528–530. [Google Scholar]
- Penaz, J. Photoelectric measurement of blood pressure, volume and flow in the finger. In Proceedings of the Digest of the 10th International Conference on Medical and Biological Engineering, Dresden, Germany; 1973. [Google Scholar]
- Antsiperov, V.; Mansurov, G.; Danilychev, M.; Churikov, D. Non-Invasive Blood Pressure Monitoring with Positionable Three-chamber Pneumatic Sensor. In Proceedings of the 12th International Joint Conference on Biomedical Engineering Systems and Technologies (HEALTHINF), Prague, Czech Republic, 22–24 February 2019; pp. 462–465. [Google Scholar]
- Sensor Technology to Realize Continuous Blood Pressure Monitoring|OMRON TECHNICS|Technology|OMRON Global. Available online: https://www.omron.com/global/en/technology/omrontechnics/vol50/004.html (accessed on 28 November 2021).
- Hansen, S.; Staber, M. Oscillometric blood pressure measurement used for calibration of the arterial tonometry method contributes significantly to error. Eur. J. Anaesthesiol. 2006, 23, 781–787. [Google Scholar] [CrossRef]
- Beulen, B.W.A.M.M.; Bijnens, N.; Koutsouridis, G.G.; Brands, P.J.; Rutten, M.C.M.; van de Vosse, F.N. Toward noninvasive blood pressure assessment in arteries by using ultrasound. Ultrasound Med. Biol. 2011, 37, 788–797. [Google Scholar] [CrossRef]
- Reddy, A.K.; Taffet, G.E.; Madala, S.; Michael, L.H.; Entman, M.L.; Hartley, C.J. Noninvasive blood pressure measurement in mice using pulsed Doppler ultrasound. Ultrasound Med. Biol. 2003, 29, 379–385. [Google Scholar] [CrossRef]
- Ma, Y.; Choi, J.; Hourlier-Fargette, A.; Xue, Y.; Chung, H.U.; Lee, J.Y.; Wang, X.; Xie, Z.; Kang, D.; Wang, H.; et al. Relation between blood pressure and pulse wave velocity for human arteries. Proc. Natl. Acad. Sci. USA 2018, 115, 11144–11149. [Google Scholar] [CrossRef] [Green Version]
- Vappou, J.; Luo, J.; Okajima, K.; Di Tullio, M.; Konofagou, E.E. Non-invasive measurement of local pulse pressure by pulse wave-based ultrasound manometry (PWUM). Physiol. Meas. 2011, 32, 1653–1662. [Google Scholar] [CrossRef]
- Laurent, S.; Cockcroft, J.; Van Bortel, L.; Boutouyrie, P.; Giannattasio, C.; Hayoz, D.; Pannier, B.; Vlachopoulos, C.; Wilkinson, I.; Struijker-Boudier, H.; et al. Expert consensus document on arterial stiffness: Methodological issues and clinical applications. Eur. Heart J. 2006, 27, 2588–2605. [Google Scholar] [CrossRef] [Green Version]
- Khamdaeng, T.; Luo, J.; Vappou, J.; Terdtoon, P.; Konofagou, E. Arterial stiffness identification of the human carotid artery using the stress–strain relationship in vivo. Ultrasonics 2012, 52, 402–411. [Google Scholar] [CrossRef] [PubMed] [Green Version]
- Visser, K. Electric conductivity of stationary and flowing human blood at low frequencies. Med. Biol. Eng. Comput. 2006. [Google Scholar] [CrossRef]
- Gaw, R.L. The Effect of Red Blood Cell Orientation on the Electrical Impedance of Pulsatile Blood with Implications for Impedance Cardiography. Ph.D. Thesis, Queensland University of Technology, Brisbane, QLD, Australia, 2010. [Google Scholar]
- Al-Harosh, M.; Shchukin, S. Numerical Modeling of the Electrical Impedance Method of Peripheral Veins Localization; Springer: Berlin/Heidelberg, Germany, 2015; pp. 1683–1686. [Google Scholar]
- Ogedegbe, G.; Pickering, T. Principles and techniques of blood pressure measurement. Cardiol. Clin. 2010, 28, 571–586. [Google Scholar] [CrossRef] [PubMed] [Green Version]
- Teschner, E.; Imhoff, M.; Leonhardt, S. Electrical Impedance Tomography: The Realization of Regional Ventilation Monitoring; Dräger Medical GmbH: Lübeck, Germany, 2011. [Google Scholar]
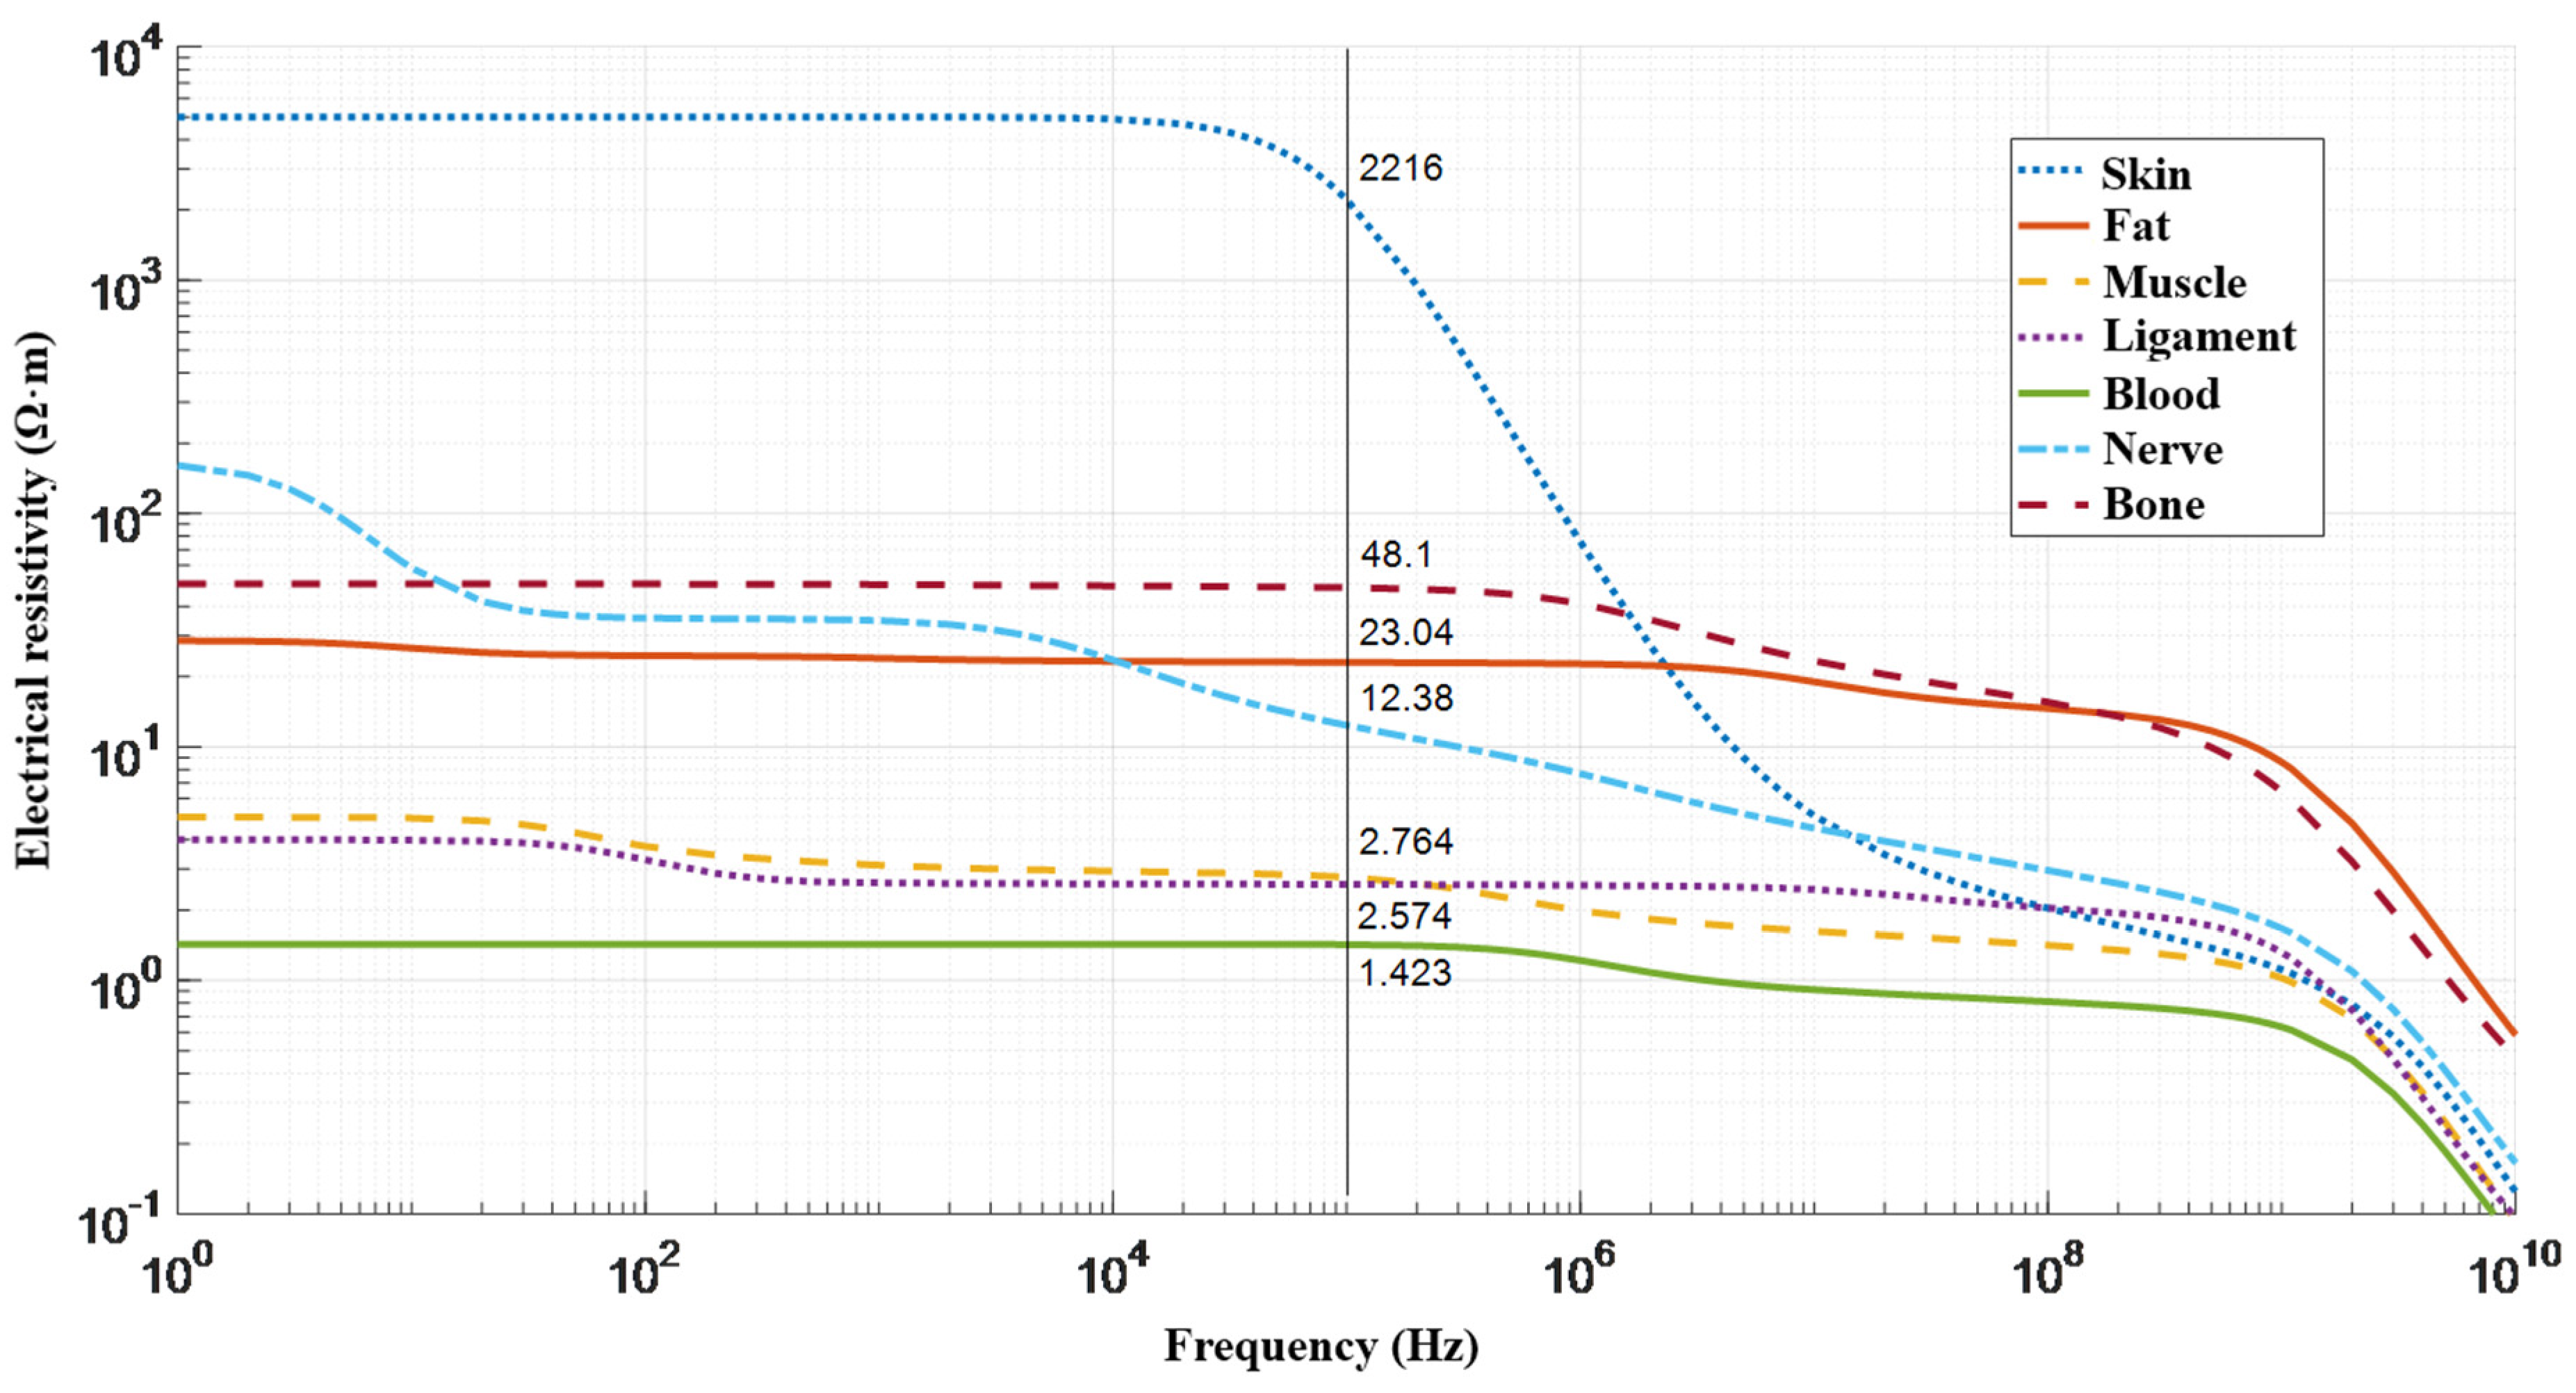
- Tissue Frequency Chart » IT’IS Foundation. Available online: https://itis.swiss/virtual-population/tissue-properties/database/tissue-frequency-chart/ (accessed on 7 December 2021).
- Laplace’s Equation in Cylindrical Coordinates. Available online: https://farside.ph.utexas.edu/teaching/jk1/Electromagnetism/node36.html (accessed on 31 October 2021).
- 20.2 Blood Flow, Blood Pressure, and Resistance–Anatomy & Physiology. Available online: https://open.oregonstate.education/aandp/chapter/20-2-blood-flow-blood-pressure-and-resistance/ (accessed on 31 October 2021).
- Visser, K. Electric properties of flowing blood and impedance cardiography. Ann. Biomed. Eng. 2006, 17, 463–473. [Google Scholar] [CrossRef] [PubMed]
- Fujii, M.; Nakajima, K.; Sakamoto, K.; Kanai, H. Orientation and Deformation of Erythrocytes in Flowing Blood. Ann. N. Y. Acad. Sci. 1999. [Google Scholar] [CrossRef] [PubMed]
- Hill, D.W.; Thompson, F.D. The effect of haematocrit on the resistivity of human blood at 37 degrees C and 100 kHz. Med. Biol. Eng. 1975, 13, 182–186. [Google Scholar] [CrossRef]
- Nagaoka, R.; Ishikawa, K.; Mozumi, M.; Cinthio, M.; Hasegawa, H. Basic study on estimation method of wall shear stress in common carotid artery using blood flow imaging. Jpn. J. Appl. Phys. 2020, 59, SKKE16. [Google Scholar] [CrossRef]
- Cloutier, G.; Qin, Z.; Durand, L.G.; Teh, B.G. Power Doppler ultrasound evaluation of the shear rate and shear stress dependences of red blood cell aggregation. IEEE Trans. Biomed. Eng. 1996, 43, 441–450. [Google Scholar] [CrossRef]
- Hoskins, P. Estimation of blood velocity, volumetric flow and wall shear rate using Doppler ultrasound. Ultrasound 2011, 19, 120–129. [Google Scholar] [CrossRef]
- Caro, C.G.; Schroter, R.C.; Pedley, T.J.; Seed, W.A. (Eds.) Solid mechanics and the properties of blood vessel walls. In The Mechanics of the Circulation; Cambridge University Press: Cambridge, UK, 2011; pp. 86–104. ISBN 978-0-521-15177-1. [Google Scholar]
- Elastic Properties of Blood Vessels-Arteries and Veins-The Cardiovascular System-Medical Physiology, 3rd Edition. Available online: https://doctorlib.info/physiology/medical/104.html (accessed on 31 October 2021).
- Callaghan, F.J.; Geddes, L.A.; Babbs, C.F.; Bourland, J.D. Relationship between pulse-wave velocity and arterial elasticity. Med. Biol. Eng. Comput. 1986, 24, 248–254. [Google Scholar] [CrossRef] [PubMed] [Green Version]
- Al Talalwah, W.; Regassa, D.; Soames, R. Morphological feature of brachial artery and its clinical significance. J. Morphol. Sci. 2015, 32, 129–134. [Google Scholar] [CrossRef]
- Mugeb, A.; Ivan, K.; Volkov, A. The brachial artery localization for blood pressure monitoring using electrical impedance measurement. In Proceedings of the IEEE 2018 Ural Symposium on Biomedical Engineering, Radioelectronics and Information Technology (USBEREIT), Yekaterinburg, Russia, 7–8 May 2018; pp. 79–82. [Google Scholar]
- Hammoud, A.; Tikhomirov, A.; Shaheen, Z. Automatic Bio-impedance Signal Analysis: Smoothing Processes Efficacy Evaluation in Determining the Vascular Tone Type. In Proceedings of the 2021 Ural Symposium on Biomedical Engineering, Radioelectronics and Information Technology (USBEREIT), Yekaterinburg, Russia, 13–14 May 2021; pp. 0113–0116. [Google Scholar]
- Huynh, T.H.; Jafari, R.; Chung, W.-Y. An Accurate Bioimpedance Measurement System for Blood Pressure Monitoring. Sensors 2018, 18, 2095. [Google Scholar] [CrossRef] [Green Version]
- Sorace, A.G.; Robbin, M.L.; Umphrey, H.; Abts, C.A.; Berry, J.L.; Lockhart, M.E.; Allon, M.; Hoyt, K. Ultrasound Measurement of Brachial Artery Elasticity Before Hemodialysis Access Placement. J. Ultrasound Med. Off. J. Am. Inst. Ultrasound Med. 2012, 31, 1581–1588. [Google Scholar]


| Method | Features | Limitation |
|---|---|---|
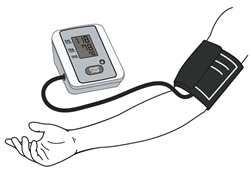
| Auscultation | -It is possible to take into account individual physiological characteristics of the body [18]. -Low measurement errors during patient movements [19]. -Devices often do not require a power supply [20]. -Confirmed correlation with invasive method [21]. | -Sensitive to indoor noise, to the friction of the cuff on clothes, to the location of a microphone [22]. -Require high qualifications [20]. -The unacceptability of the method for 5–10% of patients with deaf tones [19]. -Inaccuracy of measurements with low stiffness of artery walls [23]. -Not suitable for long-term monitoring. -Difficult to automate [22]. -Time consuming [10]. -Correct results depend on cuff size [21]. |
 | ||
| Oscillometric | -Is recommended for clinical use by WHO [20]. -It is possible to take measurements under a small layer of clothing and measure pressure for patients with weak and infinite tones [19]. -Placement is not critical [9]. -External noise does not affect results [9]. -Automatic pressure estimation [22]. | -Sensitive to mechanical vibrations, hand movements, to patient specificity [9,24]. -Large errors if patient has cardiac rhyme disease [24,25]. -Various results with different devices [9]. -Accuracy depends on algorithm [26]. -Importance of training personnel [20] |
 | ||
| Palpatory | -Devices often do not require a power supply [20]. -Suitable for noisy environment measurements [27]. | -Sensitive to tremors, severe obesity, shivering [27]. -Not suitable for long-term monitoring. -Issues with diastolic arterial pressure assessment [27]. -Frequent measurements can harm the vessels. -Not suitable for diastolic pressure estimation [27]. |
 | ||
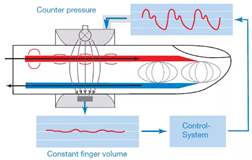
| Compensatory | -Non-invasive [28]. -Suitable for long-term monitoring [9]. -Small size of device and cuff. -Accurate measurements [9]. -Attaching to a finger. | -High cost [9]. -Sensitive to limb temperature. -Calibration is required [28]. -Artefacts are possible during measurement. -Not suitable for deep-seated arteries measurements [29]. |
 | ||
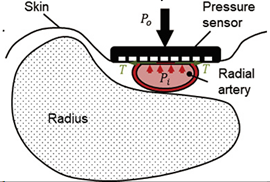
| Tonometry | -The pressure sensors are pressed directly against the skin [30]. -Non-invasive [30]. -Does not stop blood flow [31]. -Less sensitive than finger cuffs to vasoconstriction and vascular disease [10]. | -High cost [30]. -Sensitive to device position, outdoor noise [30]. -Calibration required [9]. -Limited area of measurement due to instrument size [30]. -Not suitable for long-term and deep-seated arteries measurements [9]. -Not suitable for arteries without supportive bony structures [14]. |
 | ||
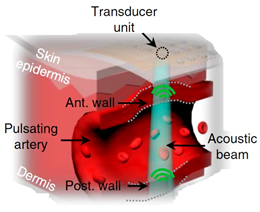
| Ultrasound | -Non-invasive [32]. -Possibility of deep tissue observation [14]. -The possibility of creating portable devices [14]. -The ability to determine the speed of blood flow [33]. -A high degree of research of the method [32]. | -Requires ultrasound [32]. -Issues with diastolic arterial pressure assessment. -Sensitive to transducer location [33]. -The bulkiness and rigidity of ultrasound probes [14]. -Korotkov’s tones must be determined. -The occurrence of interference with minor movements [9]. -The difficulty of positioning [32]. |
 | ||
| Pulse wave velocity | -The simplicity of carrying out measurements. -Cuffless method [34]. -Non-invasive [34]. -Suitable for long-term monitoring [34]. | -Confirmation of correlation between pressure and pulse wave velocity depends on model [34]. |
 |
| Parameter | Value |
|---|---|
| Number of impedance measurement channels | 31 |
| Number of ECG channels | 1 |
| Sample frequency | 500 Hz |
| Measuring scheme | Tetrapolar |
| Current amplitude | 3 mA |
| Current frequency | 100 kHz |
| The pulse measured range | 2 Ohm |
| The base measured range | 1–250 Ohm |
| The pulse impedance measuring accuracy | 1 mOhm |
| The base impedance measuring accuracy | 50 mOhm |
| The ECG measuring accuracy | 3 uV |
| DD, mm | Depth, mm | E, kPa | dZ, Ohm | ΔD, % | DS, mm | ||
|---|---|---|---|---|---|---|---|
| 3.8 | 8.0 | 3.8 | 14.9 | 78.6 | 0.13 | 4.9 | 4.0 |
| 3.9 | 5.5 | 5.6 | 15.8 | 94.0 | 0.45 | 3.4 | 4.1 |
| 3.3 | 6.5 | 4.5 | 17.1 | 122.2 | 0.12 | 2.4 | 3.4 |
| 3.1 | 3.1 | 2.9 | 16.8 | 84.9 | 0.29 | 5.1 | 3.3 |
Publisher’s Note: MDPI stays neutral with regard to jurisdictional claims in published maps and institutional affiliations. |
© 2021 by the authors. Licensee MDPI, Basel, Switzerland. This article is an open access article distributed under the terms and conditions of the Creative Commons Attribution (CC BY) license (https://creativecommons.org/licenses/by/4.0/).
Share and Cite
Al-harosh, M.; Yangirov, M.; Kolesnikov, D.; Shchukin, S. Bio-Impedance Sensor for Real-Time Artery Diameter Waveform Assessment. Sensors 2021, 21, 8438. https://doi.org/10.3390/s21248438
Al-harosh M, Yangirov M, Kolesnikov D, Shchukin S. Bio-Impedance Sensor for Real-Time Artery Diameter Waveform Assessment. Sensors. 2021; 21(24):8438. https://doi.org/10.3390/s21248438
Chicago/Turabian StyleAl-harosh, Mugeb, Marat Yangirov, Dmitry Kolesnikov, and Sergey Shchukin. 2021. "Bio-Impedance Sensor for Real-Time Artery Diameter Waveform Assessment" Sensors 21, no. 24: 8438. https://doi.org/10.3390/s21248438
APA StyleAl-harosh, M., Yangirov, M., Kolesnikov, D., & Shchukin, S. (2021). Bio-Impedance Sensor for Real-Time Artery Diameter Waveform Assessment. Sensors, 21(24), 8438. https://doi.org/10.3390/s21248438