Article

Dissolved Organic Carbon Source Attribution in the Changjiang Outflow Region of the East China Sea

1
School of Earth Sciences, Zhejiang University, Hangzhou 310027, China
2
Ocean Academy, Zhejiang University, Zhoushan 316000, China
3
Hainan Institute, Zhejiang University, Sanya 572000, China
4
Jiyang College, Zhejiang A&F University, Zhuji 311800, China
5
State Key Laboratory of Satellite Ocean Environment Dynamics, Second Institute of Oceanography, Ministry of National Resources, Hangzhou 310012, China
6
Laboratory of Marine Ecosystem and Biogeochemistry, The Second Institute of Oceanography, Ministry of National Resources, Hangzhou 310012, China
*
Author to whom correspondence should be addressed.
Sensors 2021, 21(24), 8450; https://doi.org/10.3390/s21248450
Submission received: 5 October 2021 / Revised: 6 December 2021 / Accepted: 9 December 2021 / Published: 17 December 2021
(This article belongs to the Special Issue Sensors and Data Analysis Applied in Environmental Monitoring)

Abstract

:
The variable optical properties of chromophoric dissolved organic matter (CDOM) under the complicated dynamic marine environment make it difficult to establish a robust inversion algorithm for quantifying the dissolved organic carbon (DOC). To better understand the main factors affecting the relationship between the DOC and the CDOM when the Changjiang diluted water (CDW) interacts with the marine currents on the wide continental shelf, we measured the DOC concentration, the absorption, and the fluorescence spectra of the CDOM along the main axis and the northern boundary of the CDW. The sources of DOC and their impacts on the relationship between the optical properties of the DOC and CDOM are discussed. We reached the following conclusions: There are strong positive correlations between the absorptive and fluorescent properties of the DOC and the CDOM as a whole. The dilution of the terrestrial DOC carried by the CDW through mixing with saline sea water is the dominant mechanism controlling the characteristics of the optical properties of the CDOM. CDOM optical properties can be adopted to establish inversion models in retrieving DOC in Changjiang River Estuary. It is concluded that the introduction of extra DOC from different sources is the main factor causing the regional optical complexity leading to the bias of DOC estimation rather than removal mechanism. As whole, the input of polluted water from Huangpujiang River with abnormally high a ( 355 ) and Fs(355) will induce the overestimation of DOC. In the main axis of CDW, the impact from autochthonous DOC input to the correlation between DOC and CDOM can be neglected in comparison with conservative dilution procedure. The relationship between the DOC and the CDOM on the northern boundary of the CDW is more complicated, which can be attributed to the continuous input of terrestrial material from the Old Huanghe Delta by the Subei Coastal Current, the input of materials from the Yellow sea by the Yellow Sea Warm Western Coastal Current, and the input of materials from the Changjiang Basin by the CDW. The results of this study suggest that long-term observations of the regional variations in the DOM inputs from multiple sources in the interior of the CDW are essential, which is conducive to assess the degree of impact to the DOC estimation through the CDOM in the East China Sea.

1. Introduction

As the third longest river in the world, the Changjiang River delivers 0.5–0.8% of the riverine dissolved organic carbon (DOC) to the global oceans [1], exerting a significant influence on the carbon budget and the marine eco-environment of the East China Sea (ECS) and the western Pacific Ocean. The accurate estimation of the DOC flux into the ECS and its temporal variations is critical to determining whether the Changjiang Estuary is a carbon sink or a carbon source, and to clarifying its significance to the global carbon balance. In the past few decades, in order to obtain the DOC content using satellite remote sensing with large-scale coverage and real-time monitoring capabilities, significant efforts have been devoted to establishing inversion algorithms for the DOC based on the optical properties of the chromophoric dissolved organic matter (CDOM). However, to date, no feasible algorithm has been developed that is universally valid and applicable to the Changjiang Estuary. The correlation between the CDOM and the DOC in the Changjiang Estuary has been reported to vary significantly depending on the location, spatial scale, season, and tides [2,3,4,5]. The variable DOC composition has been concluded to be one of the main factors impairing the stability of the relationship between the DOC and the CDOM [6,7]. For example, the mutual linear correlation between the DOC and the CDOM could easily collapse in places with significant phytoplankton production [6,8]. Furthermore, the nonconservative behavior of the DOC is related to the abnormal introduction of DOC into or removal of DOC from the estuary and the adjoining sea area. The release of DOC from the pore water during the disturbance or resuspension of the bottom sediments has been demonstrated to be one of the extra DOC inputs, i.e., in addition to the riverine-sourced DOC [8,9]. Recently, sporadic precipitation was reported to be one of the main DOC material sources in coastal sea water [10]. Conversely, microbial degradation [11] and photo bleaching [12,13] are two of the main DOC removal mechanisms. The extra input or removal of DOC not only changes the DOC content, but it also introduces different DOC species and/or selectively removes DOC species, which leads to the variable relationship between the DOC and the CDOM. However, in most studies that have focused on the estuary, more effort was devoted to understanding the impact of the estuarine effects on the conservative behavior of the DOC and to determining the feasibility of an inversion algorithm for determining the DOC from the CDOM [14]. Concerning the amount of terrestrial DOC and its geochemical behaviors on the wide continental shelf when encountering saline oceanic currents and the impacts on the marine ecological system, studies of the changes in the DOC content and species after the Changjiang diluted water (CDW) enters the ECS need to be performed. In addition, due to the continuous decrease in the suspended sediment flux transported by the CDW, the potential sediment compensation via erosion of the submarine delta and from the Old Yellow River Delta [15] may change the composition of the material flowing into the ECS. Therefore, it is valuable to observe the land-source DOC behavior and to identify the main factors affecting its distribution, species, and optical properties over the entire continental shelf during land–sea interactions.
In this study, we collected samples from two sections: the main axis and the northern boundary of the CDW, combining with a section in the southern branch of the Changjiang River as reference. The DOC content, CDOM optical properties, and salinity of each sample were measured. A combination of excitation–emission matrix fluorescence spectroscopy (EEMS) and parallel factor analysis (PARAFAC) was used to determine the compositions and sources of the fluorescent materials in these samples. The relationships between the optical properties of the DOC and the CDOM and the salinity were analyzed using linear regression. Based on the optical properties of the CDOM and their ability to reflect the DOC content and species, we attempted to answer the following three questions. (1) What is the main mechanism determining the relationship between the optical properties of the DOC and the CDOM in the CDW after it travels beyond the mouth of the estuary? (2) What are the main differences in the relationships between the DOC and the CDOM along the main axis and within the northern boundary of the CDW? (3) What type of input or removal procedures cause the differences in the relationships between the DOC and the CDOM along the main axis and within the northern boundary of the CDW?
The results of this study deepen our understanding of the different mechanisms affecting the DOC content, species, and distribution and the intrinsic factors determining the optical properties of the CDOM in the Changjiang outflow region under the conditions of this complicated marine environment, which is essential to establishing a feasible algorithm for regionally inverting the optical properties of the DOC from the CDOM. These results will also help to identify the material sources of the dissolved organic matter (DOM) in this sea area.

2. Materials and Methods

2.1. Hydrodynamic Environment and Sampling

The ECS is one of the world’s largest marginal seas and contains a wide continental shelf. The spatial and temporal distributions of the substances in the ECS are caused by the comprehensive effects of multiple sources of terrestrial material and complex hydrodynamic oceanic processes. The migration route and magnitude of the CDW determines the transportation, diffusion, and mixing of the materials in the ECS. Usually, the main axis of the CDW migrates southeastward in winter and is variable in summer due to the flood discharge, topographic effects, wind stress, and other factors experienced when encountering the saline Taiwan warm current (TWC). When the TWC intrudes into the inner shelf of the ECS along the 50 m isobaths at the mouth of the Changjiang River, the CDW changes its migration route from southeastward to eastward, or even toward the northeast (around 122.5° E) [16,17]. The large amount of terrestrial sediment transported by the CDW in the bottom layer has developed a huge modern tongue-shaped underwater delta, which extends southeastward. This delta can be disturbed and resuspended, and can have a significant impact on the formation of the maximum turbidity zone (MTZ).
In this study, nine water samples were collected along the main axis of the CDW and seven water samples along the northern boundary of the East China Sea (referred to as sections PN and F, respectively, in this study) during the “973” Spring Voyage in 2011 (the stations are marked in blue in Figure 1). Seven water samples from the southern branch of the Changjiang River were collected in August 2011 (referred to as section XM, marked in red in Figure 1).
The fan-like area between the PN and F sections is influenced by the estuarine mixed water (caused by the transition between the fresh CDW and the saline sea water) from either the Subei Coastal Current (SCC), the Yellow Sea Warm Western Coastal Current (YSWCC), and the Yellow Sea Warm Current (YSWC) from the north [14,19] or from the coastal upwelling off the Zhejiang coast [21]. The convergence of these different currents results in a complicated hydrodynamic environment in the area of 123–123°30′ E. A large number of smaller organic particles agglomerate, form larger aggregates, and sink at a faster rate in this area, producing sea snow [20], which inhibits most of the materials transported by the CDW from traveling beyond 123° E. The rich nutrient supply in this area fosters the most important fishing area (i.e., the Zhoushan fishing area) in China (122–130° E, 29–33° N) [22,23]. Due to the scientific significance of the effects of the interaction between the continental shelf and the open ocean water masses on the biogeochemistry and ecology, from the last century onward, continuous long-term observations have been performed in the two sections and in the neighboring sea area by Chinese, Japanese, and Korean researchers to investigate the decadal, interannual, and seasonal variations in the hydrodynamics [24], sedimentation [25], marine ecology, sea water chemistry [26,27], land–sea interactions [28], and particularly, the carbon flux and cycle [29]. These previous studies have provided fruitful and precious information that has deepened our understanding of global climate change [30,31], episodic climate events (e.g., typhoons), and the impact of climate on the development of estuarine hypoxia events [32,33].
The sampling in the PN and F sections was performed during the same period. The first sample in the PN section (22 March 2011) was collected only 2 days after the first sample was collected in the F section (20 March 2011). The longest storage time was 10 days, which is much shorter than the decay half-lives of the different fluorescence components [34], so distinct changes in the absorption intensity due to storage time were minimized [35]. All of the surface seawater samples collected for the DOC and CDOM optical measurements were collected at a water depth of 2 m. At each sampling station, 250 mL aliquot subsamples were filtered using a GF/F filter (47 mmϕ) (combusted at 450 °C for 24 h in a muffle furnace, then prepackaged in clean aluminum foil) and were stored in the dark at −20 °C in precleaned polypropylene narrow-mouth buckets. The frozen samples were thawed and allowed to reach room temperature after the samples were transported to the laboratory. A 60 mL subsample was filtered through a 0.2-μm Nuclepore polycarbonate membrane (soaked in 10% HCl for 15 min and then rinsed with distilled water three times before the filtration) before the CDOM optical measurements. Another 30 mL subsample was used for the DOC concentration measurements. The filtered samples were preserved in 60-mL brown glass bottles, which were precombusted at 450 °C for 6 h in a muffle furnace before use [8,29,36].

2.2. Methods

2.2.1. Absorption Spectroscopy Analysis

The CDOM absorption spectra were measured over the 200–800 nm range with a 1 nm increment using a UV–visible spectrophotometer (Shimadzu UV-2550) and a 10 cm quartz cuvette. Ultrapure Milli-Q water was used as the reference. Each sample was scanned three times [37]. The data were corrected to remove the scattering effects and baseline fluctuations by subtracting the value at 700 nm from each spectrum. The CDOM absorption coefficients were obtained using Equation (1) [38]:
a ( λ ) = 2.303 × D ( λ ) / L
where λ is the wavelength, L is the cuvette path length, a ( λ ) is the absorption coefficient at wavelength λ , and D ( λ ) is the optical density at wavelength λ .
S g is the exponential slope of the CDOM absorption spectra, which can be determined using Equation (2):
a ( λ ) = a ( λ 0 ) e S g ( λ 0 λ ) + k
where λ 0 is a reference wavelength (nm) (440 nm in this study); and the data were fitted over the range of 300–500 nm. k is an additional background parameter that allows for any baseline shift or attenuation unrelated to the CDOM [39].

2.2.2. Fluorescence Spectroscopy Analysis and PARAFAC Analysis

The fluorescence spectra of the CDOM were measured using a Hitachi F-7000 fluorescence spectrophotometer (Hitachi High-Technologies, Tokyo, Japan). The excitation wavelength was 200–450 nm, with a 5 nm interval. The emission wavelength was 250–600 nm. A 1 nm interval was used to obtain the fluorescence spectra. The three-dimensional fluorescence spectrum of Milli-Q ultrapure water was subtracted to remove the Raman scattering of the pure water. Quinine sulfate (0.01 mg L−1) was used for the fluorescence calibration [40,41].
Parallel factor analysis (PARAFAC) was conducted using the DOMFlour toolbox in Matlab2008a. PARAFAC was employed to analyze the fluorescence and compositional properties of the CDOM [42,43].

2.2.3. DOC Measurements

The DOC concentration was measured using a Shimadzu TOC-VCPH total organic carbon analyzer (Shimadzu Co., Japan, temperature: 680 °C) [44]. The high-temperature catalytic oxidation (HTCO) method was used to convert the DOC into CO2, which was then quantitatively measured using a nondispersive infrared detector. Each sample was analyzed twice, with a typical deviation of <2%. Then, the DOC concentration was determined from the average value. KHC8H4O4 was used as the carbon standard. Standard ocean water with a known DOC was used as a reference. Instrumental and procedural Milli-Q water blanks were analyzed each day.

2.2.4. Measurements of Chlorophyll-a, Suspended Sediments, and Salinity

The chlorophyll-a (Chl-a) concentration was measured following the standard fluorometric protocol [45]. Each frozen Whatman GF/F filter was extracted using 90% acetone, and the resulting fluorescence was measured using a Turner Designs Fluorometer (Model 10). This instrument was calibrated annually using a commercially available Chl-a standard (Sigma).
The suspended sediments (SS) were measured gravimetrically using preweighed cellulose acetate membrane filters (47 mm diameter, 0.45 μm pore size).
The salinity was measured using a precalibrated conductivity, temperature, depth (CTD) sensor unit (Sea-Bird Electronics, SBE-917 plus).

3. Results and Discussion

3.1. DOC Distribution

The DOC concentrations ranged from 0.771 to 2.644 mg L−1, with an average of 1.172 ± 0.52 mg L−1. This is in the same range as those of domestic estuaries, such as the Pearl Estuary [46,47,48], but this range is much lower than those of overseas coastal regions, e.g., the Orinoco River Estuary, the coastal areas of the Southern Baltic Sea, and the Gulf of Mexico estuaries [49,50,51], as shown in Table 1.
Overall, the DOC decreased from the inner estuary to the offshore area (Figure 2). In particular, the DOC values were 0.773–0.952 mg L−1 and 0.771–1.022 mg L−1 and the salinity values were 30.725–34.48‰ and 30.725–33.891‰ in sections PN and F, respectively. DOC decreased gradually with increasing salinity in both sections, and section F had a slightly higher average DOC (0.887 mg L−1) than section PN (0.821 mg L−1). As a comparison, the riverine section XM had a very low salinity (average of 0.185‰) and a much higher DOC (average of 1.909 mg L−1). Abnormally high DOC was observed at stations XM04 and XM05. Negative correlation between the DOC and salinity was observed in section XM if stations XM04 and XM05 are not considered.

3.2. CDOM Absorption Properties

3.2.1. Absorption Spectrum

The absorption spectra of all of the samples decrease exponentially with increasing wavelength. A distinct blue shift is observed in the wavebands where an obvious decay occurs from 400 nm at station XM01 with a salinity of 0.18‰ to 300 nm at offshore station PN09 with a salinity of 34.5‰. The samples can be divided into two groups based on the slopes of the curves and the wavebands with the maximum attenuation, which is in good agreement with the salinity gradients of the three sections (Figure 3).

3.2.2. a ( 355 )

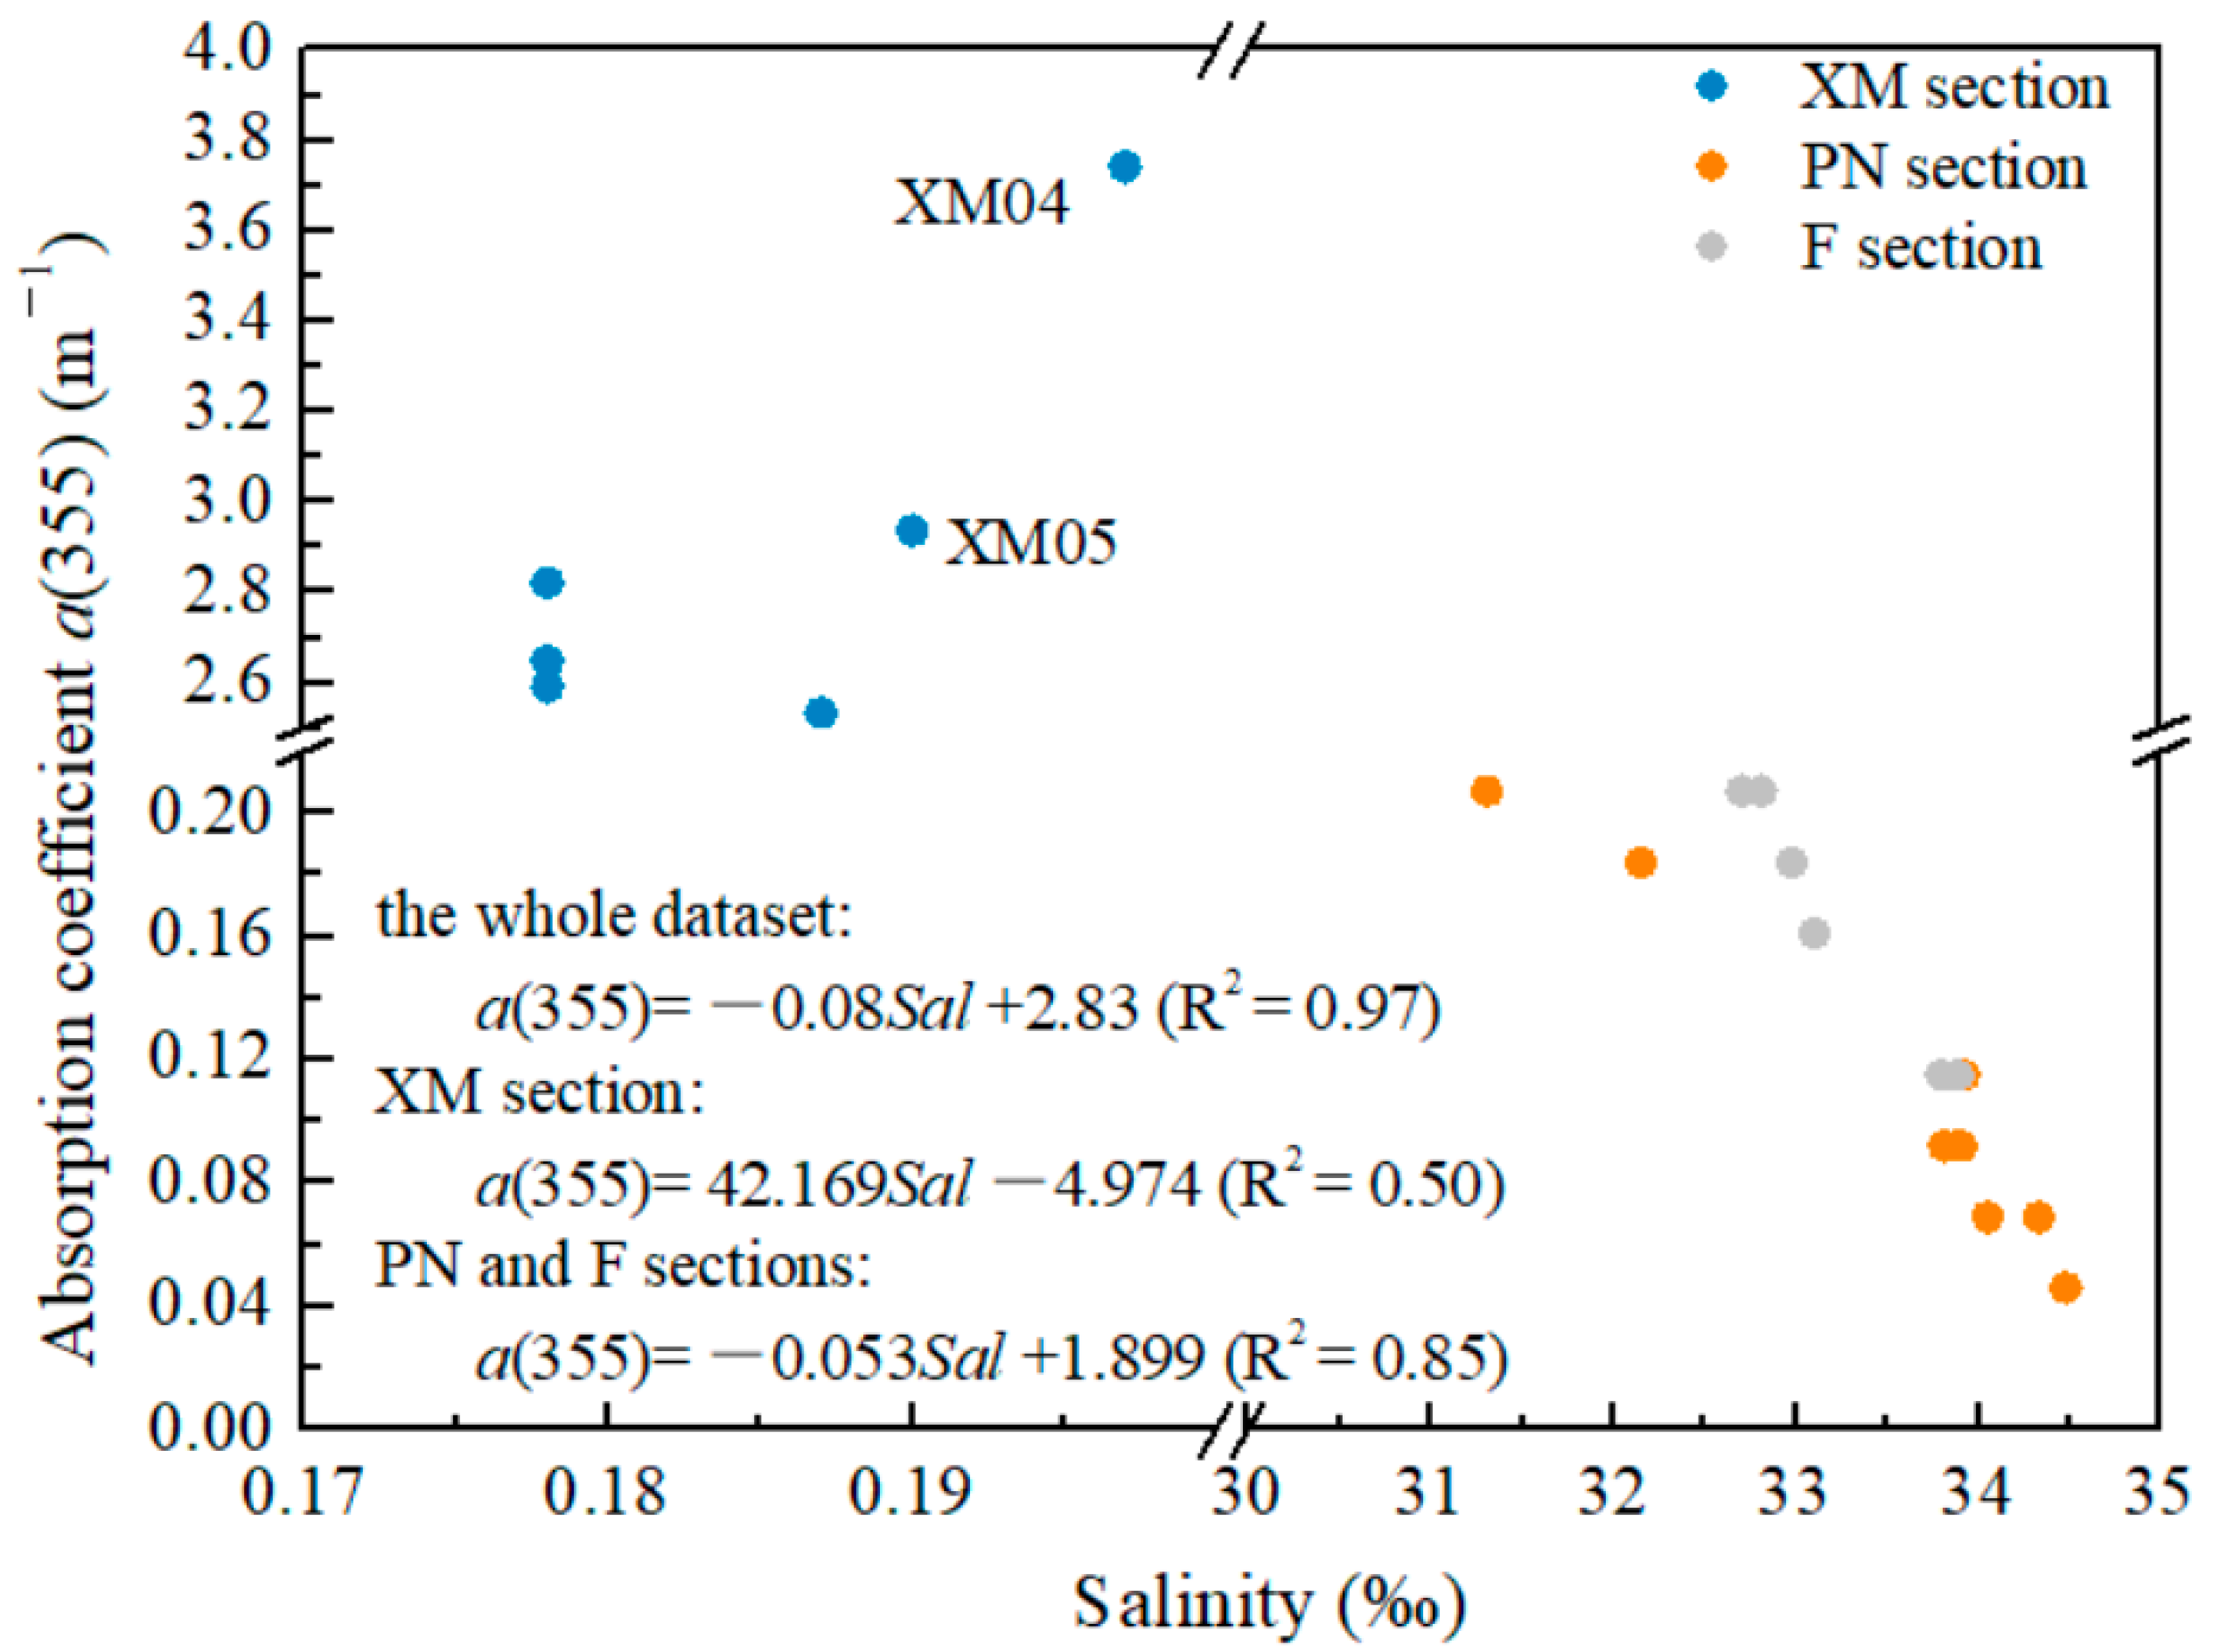
The absorption coefficient at a specific wavelength λ (e.g., 355, 375, or 440 nm) is usually adopted to quantify the CDOM, since the CDOM component contains a variety of mixtures and its concentration is difficult to measure directly. In this study, a ( 355 ) was selected to make our results comparable with other research results (see Table 1). The XM section shows highest a ( 355 ) ranging from 2.476–3.742 m−1. An extraordinarily high a ( 355 ) value (3.742 m−1) was observed at station XM04. A significantly low a ( 355 ) value was observed in the PN section (average of 0.107 m−1 varying from 0.046–0.207 m−1) and F section (average of 0.178 m−1 varying from 0.115–0.253 m−1). The a ( 355 ) value was slightly higher in section F than in section PN.
The a ( 355 ) value in this study is similar to those reported in previous studies in the Changjiang Estuary, as well as those in the Pearl Estuary, but it is much lower than those of most of the world’s major estuaries (see Table 1).
We noticed that the a strong negative linear correlation between the salinity and a ( 355 ) was observed for both sections PN and F and for the entire dataset (Figure 4). It is noteworthy that abnormally high a ( 355 ) values are observed at XM04 and XM05 stations with high DOC.

3.2.3. S g

S g has been demonstrated to be useful in distinguishing the composition and sources of the CDOM. The S g depends strongly on the chosen wavelength interval and less strongly on the method used to determine the parameter [39]. Usually, S g is fitted over a range of 300–500 nm, and steeper slopes indicate materials with lower molecular weights or decreasing aromaticity [62]. Most of the CDOM in the river was contributed to by terrestrial materials with higher aromatization, which are resistant to degradation. As a result, the riverine CDOM has a lower S g , and the marine water has a higher S g .
In this study, an exponential model of the CDOM absorption spectrum was established:
a ( λ ) = a ( 440 ) e 0.0213 × ( 440 λ )
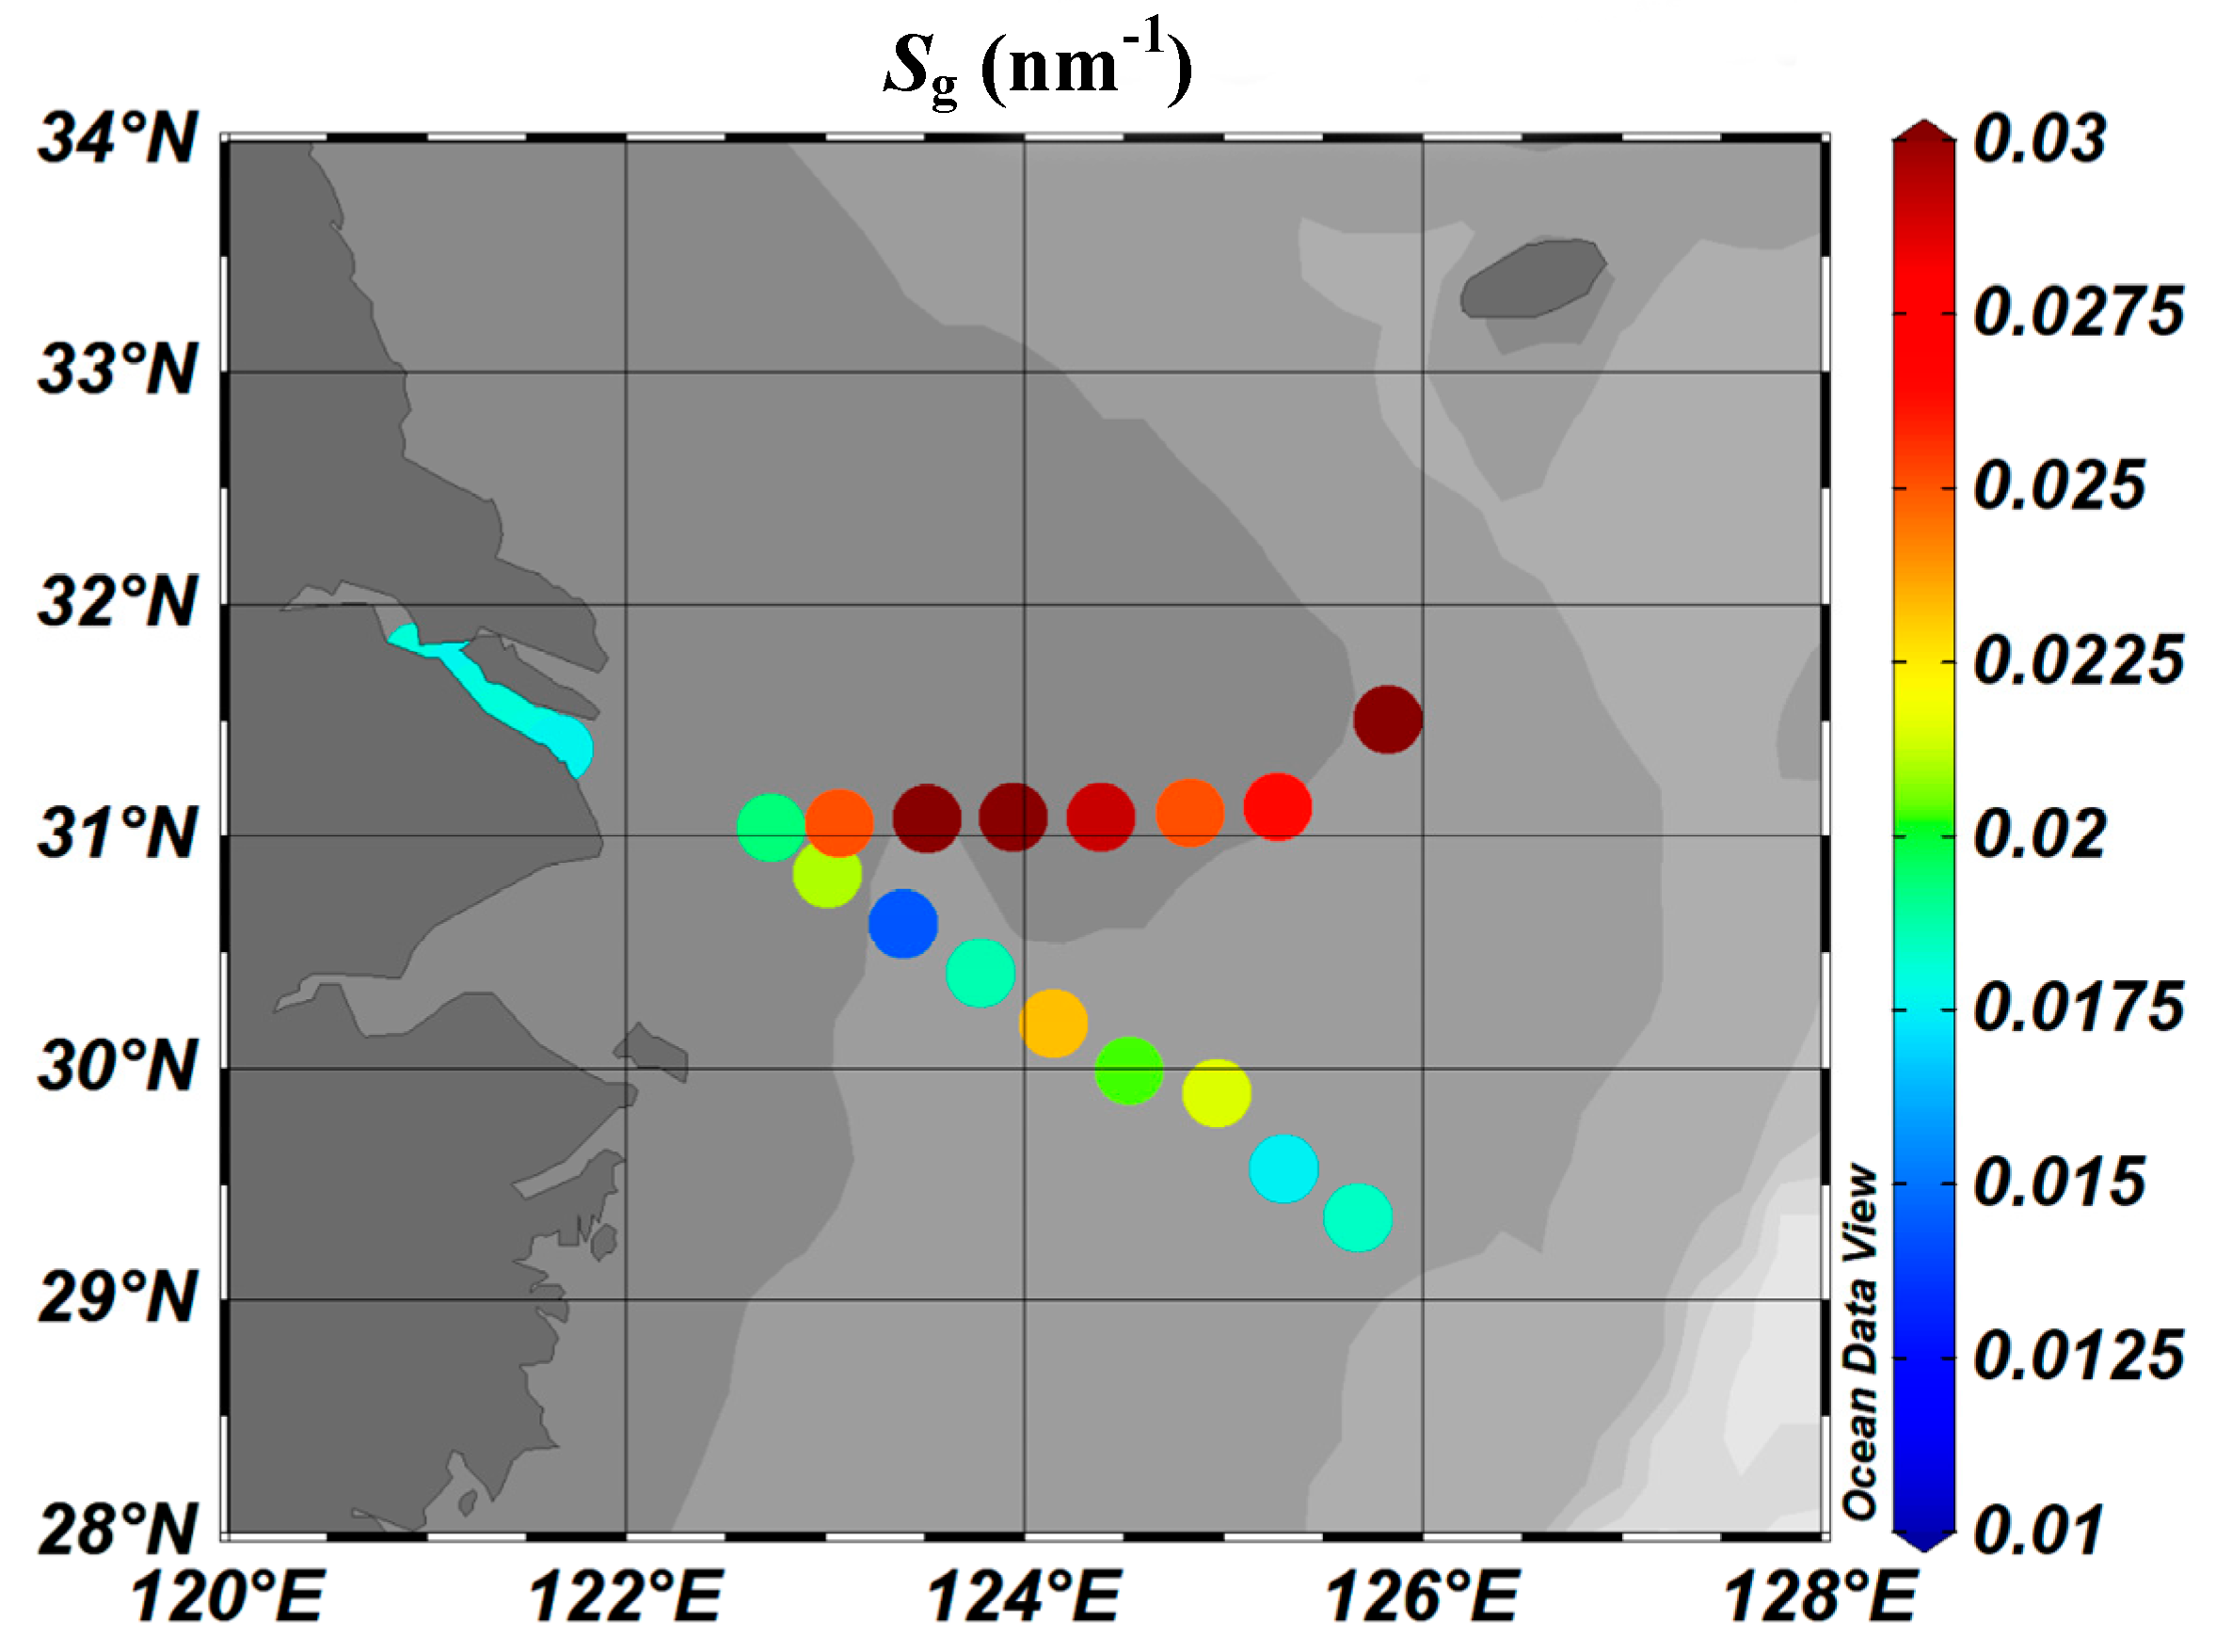
S g varied from 0.014 to 0.032 nm−1, with a mean of 0.021 nm−1. Stable, low S g values were observed along section XM, ranging from 0.0176 to 0.0180 nm−1. There were relatively higher S g values along both sections PN and F, with large fluctuations, ranging from 0.0143 to 0.023 nm−1 and from 0.025 to 0.0318 nm−1, respectively. It should be noted that the S g values in section F were higher than those in section PN.
Overall, the S g increased with increasing distance from shore (Figure 5), and exhibited a trend opposite that of the a ( 355 ) and DOC, which is consistent with previous findings (Table 1) [3,63,64].

3.3. CDOM Fluorescence Properties

3.3.1. Fluorescence Intensity Fs(355)

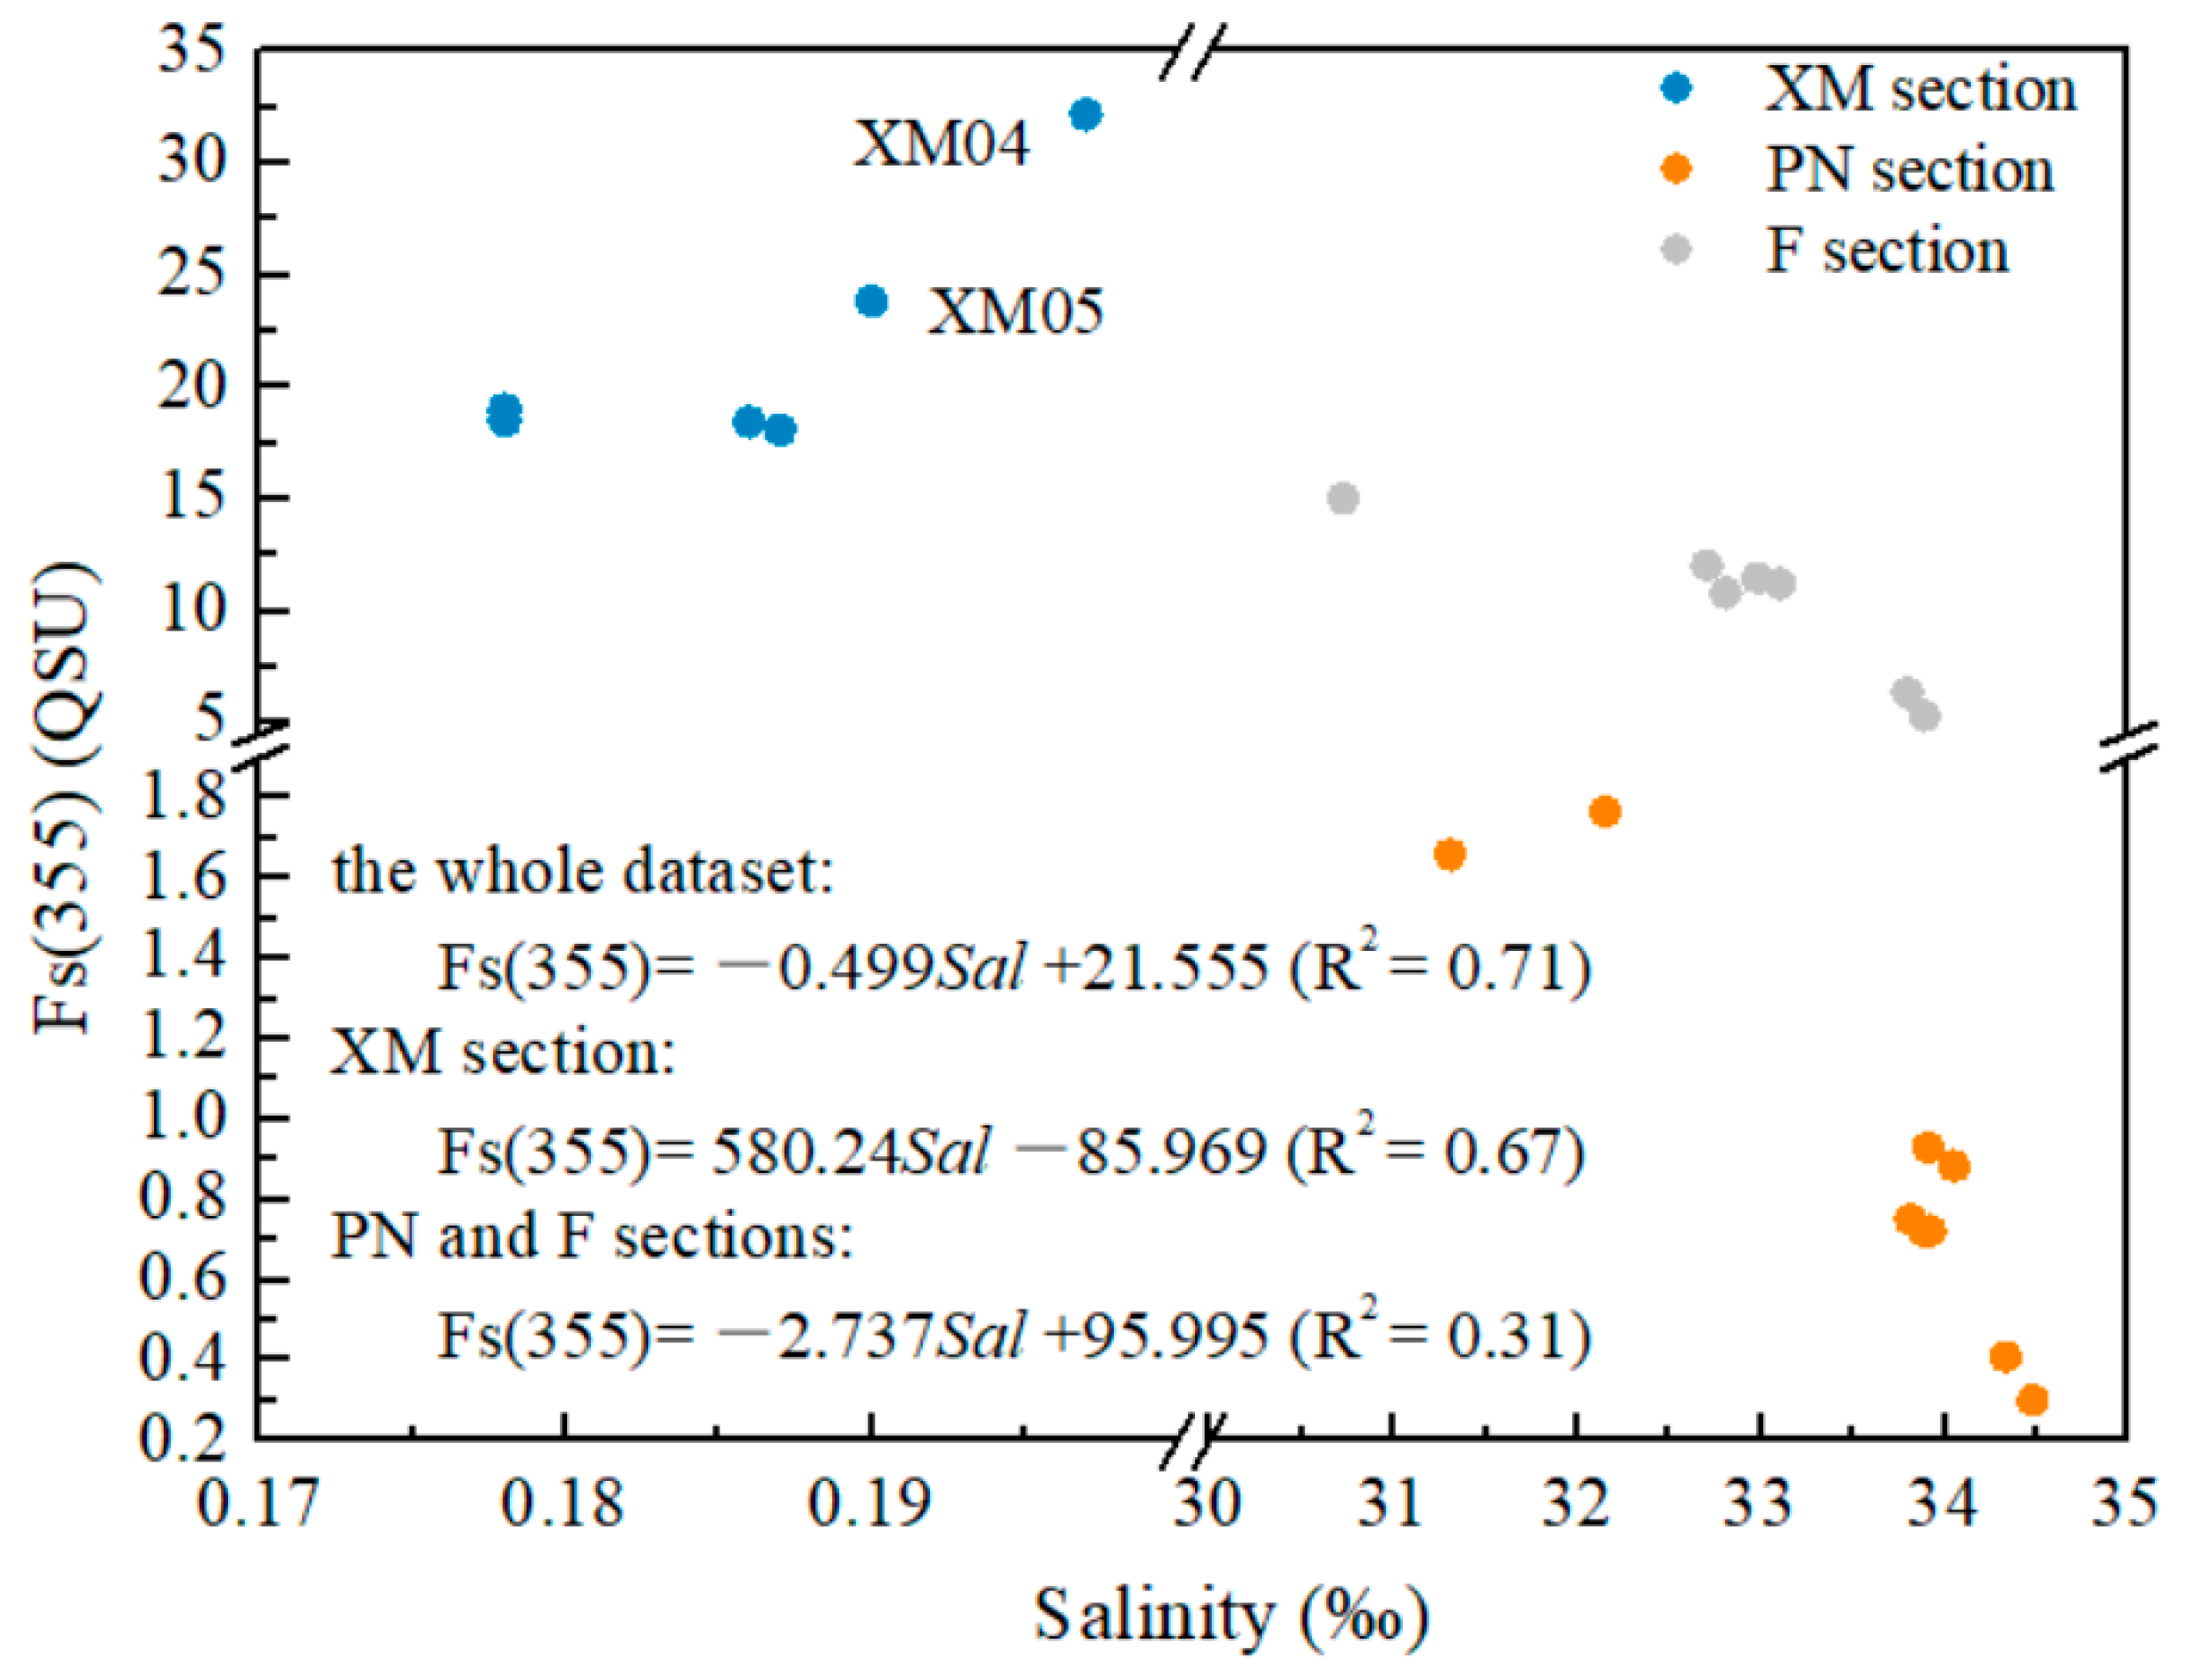
The total fluorescence intensity of the CDOM in this study was characterized by the fluorescence intensity of Fs(355) at an excitation wavelength of 355 nm with emission spectrum recorded at 450 nm (Ex/Em = 355/450 nm) [48,58,61]. The Fs(355) values of sections PN and F were 0.301–1.767 quinine sulfate units (QSU) (average of 0.905 QSU) and 1.45–2.01 QSU (average of 1.39 QSU), respectively, and there was a decreasing trend along both sections. In contrast, section XM had the highest average Fs(355) value (21.294 QSU), with values ranging from 18.107–32.181 QSU. Stations XM04 and XM05 had abnormally high Fs(355) values. A strong correlation between Fs(355) and salinity was observed for the whole dataset and for PN and F sections, respectively (Figure 6).
Moreover, Fs(355) exhibited similar distribution patterns to a ( 355 ) along sections PN and F, and along XM section as well (Figure 7), which was consistent with the results of previous studies [2,65].

3.3.2. CDOM Excitation–Emission Matrix Spectroscopy (EEMS)

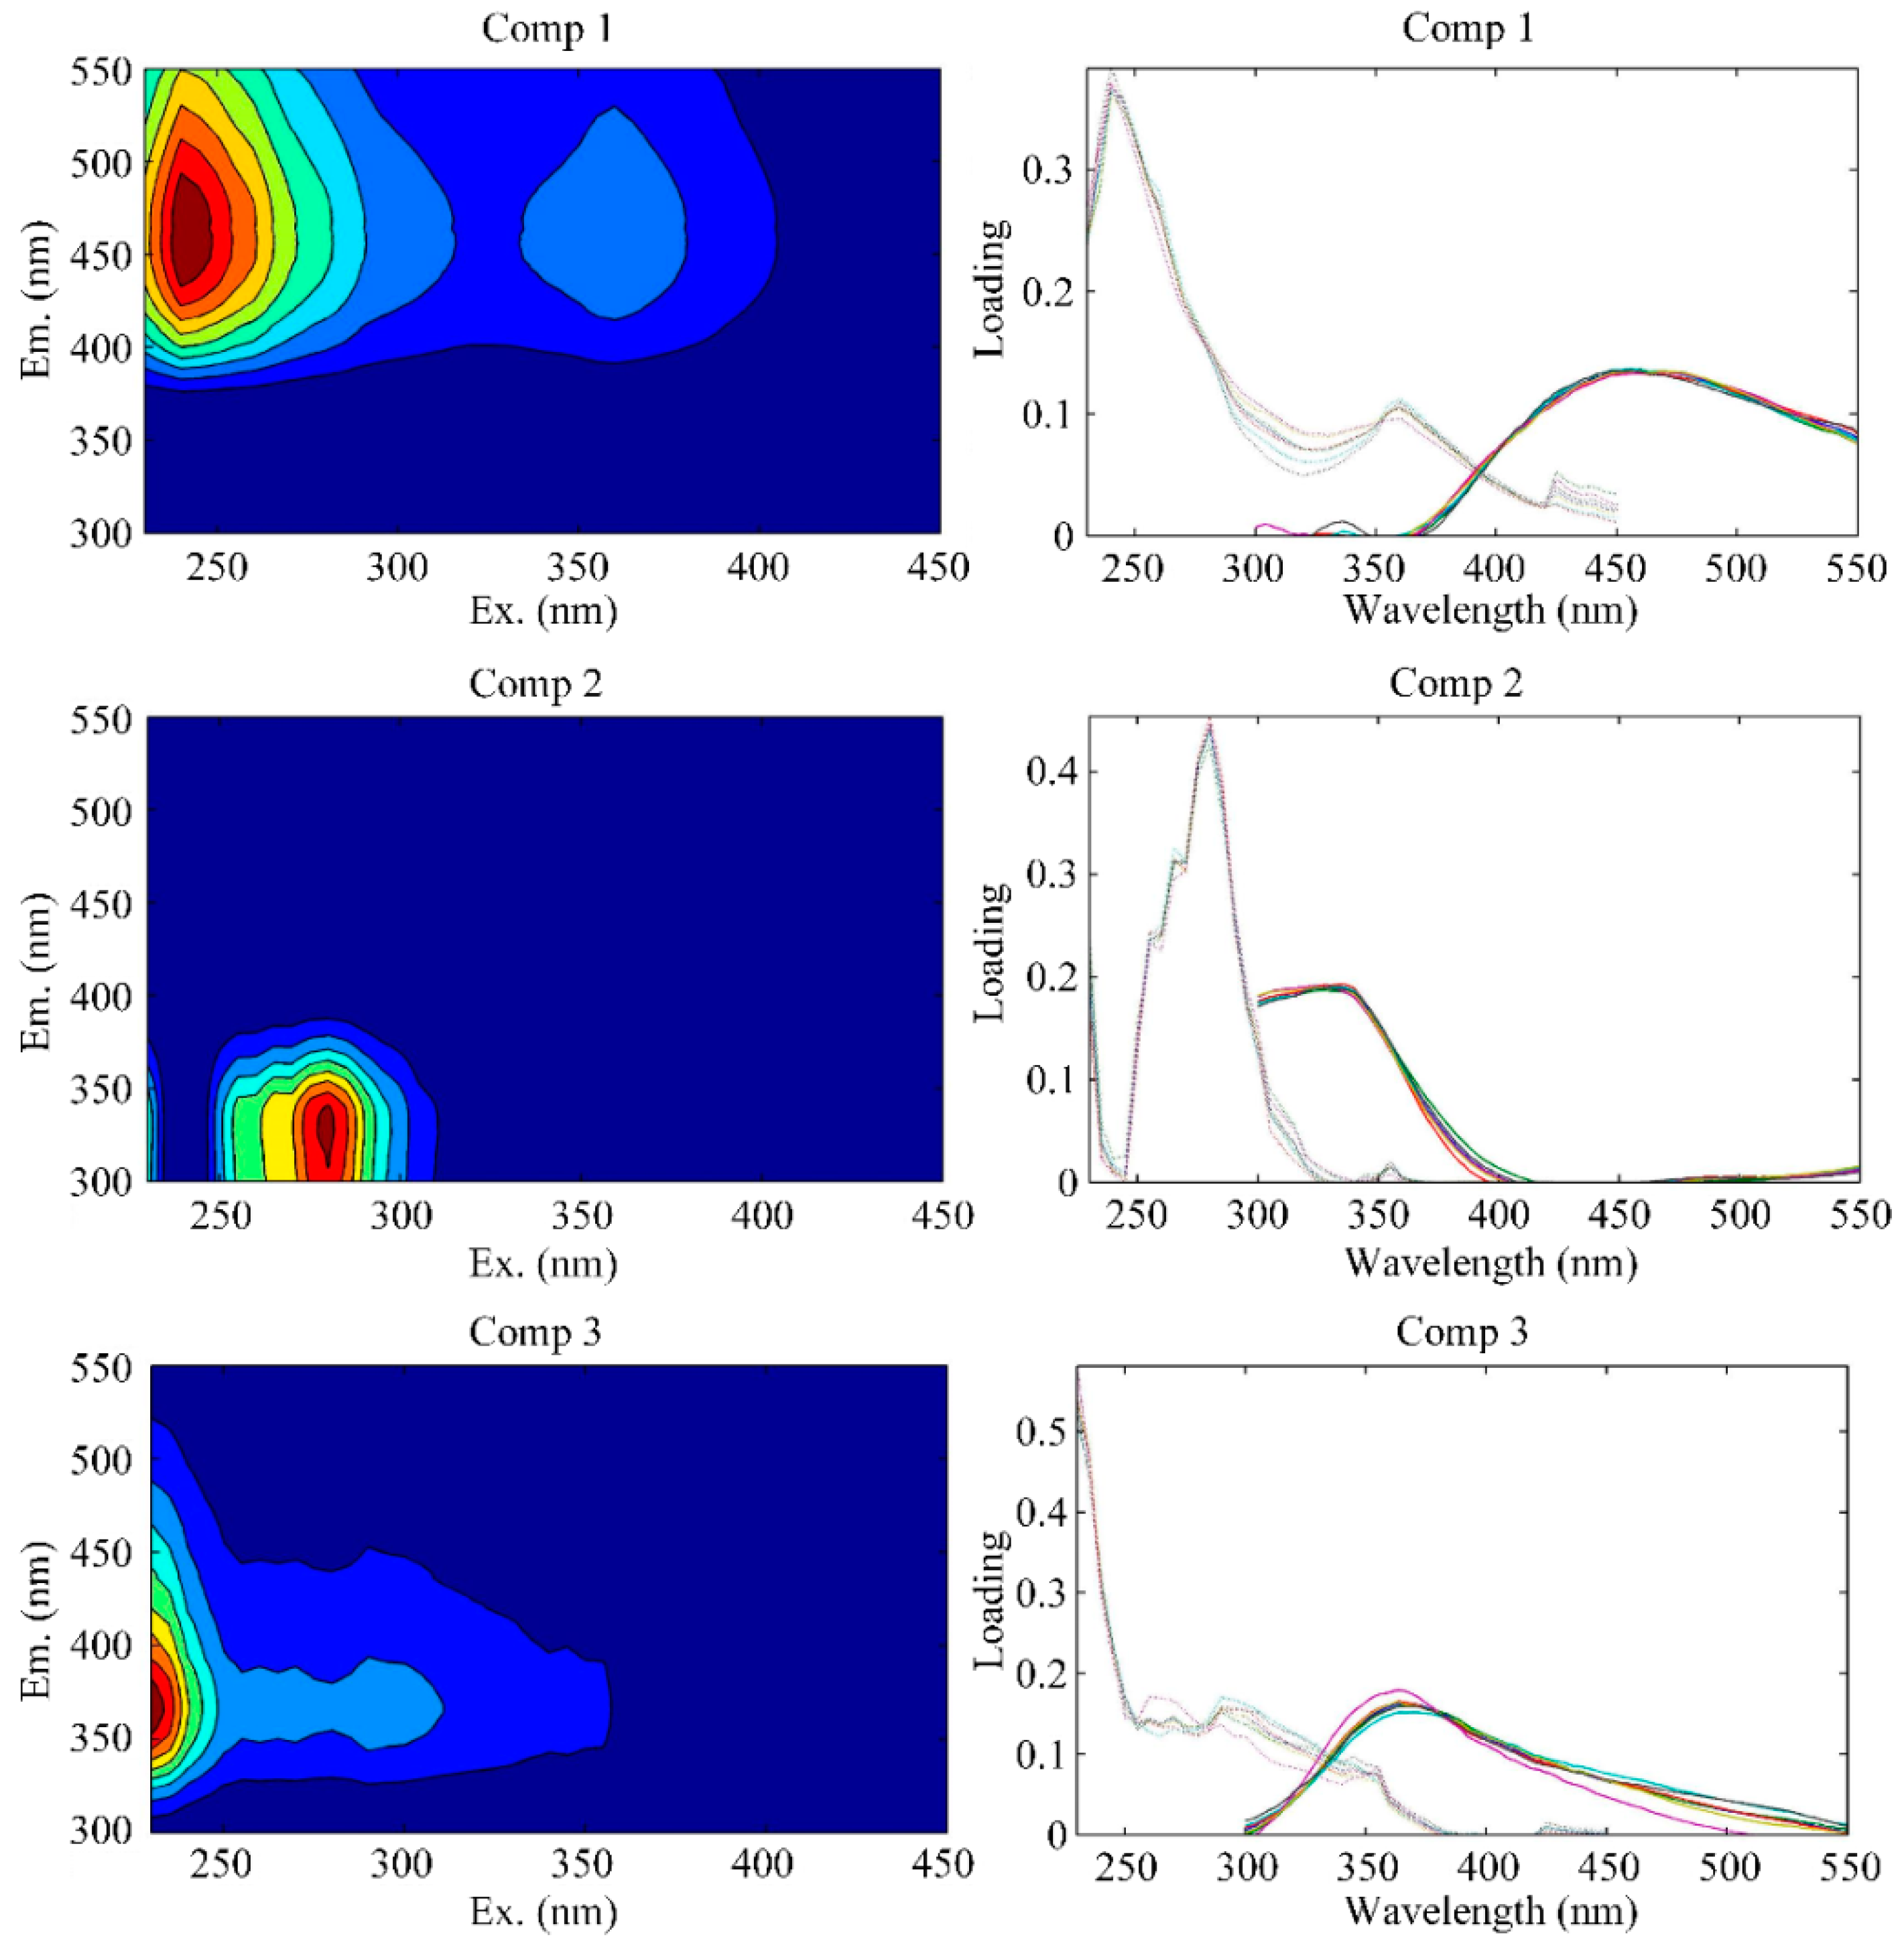
Three fluorescence components, including C1 (humic-like component), C2 (protein-like component), and C3 (protein-like component), were extracted from all 23 samples using PARAFAC (Figure 8, Table 2), which is similar to the method used in previous studies conducted in this area [66]. C1 has a maximum excitation/emission at 240/456 nm. This is similar to the traditionally defined humic-like fluorescence peak A ((230–260)/(380–460) nm), which primarily originates from terrestrial sources. C2 has a maximum excitation/emission at 280/328 nm, which was confirmed to be tryptophan-like fluorescence peak T ((270–280)/(320–350) nm). Tryptophan-like peak T can be derived from both allochthonous and autochthonous sources [67,68]. C3 has a maximum excitation/emission at 230/366 nm, resembling a combination of peak N (280/370 nm) and peak T. Peak N is believed to represent labile materials produced as a result of biological production [69,70].

3.3.3. Fluorescent Components

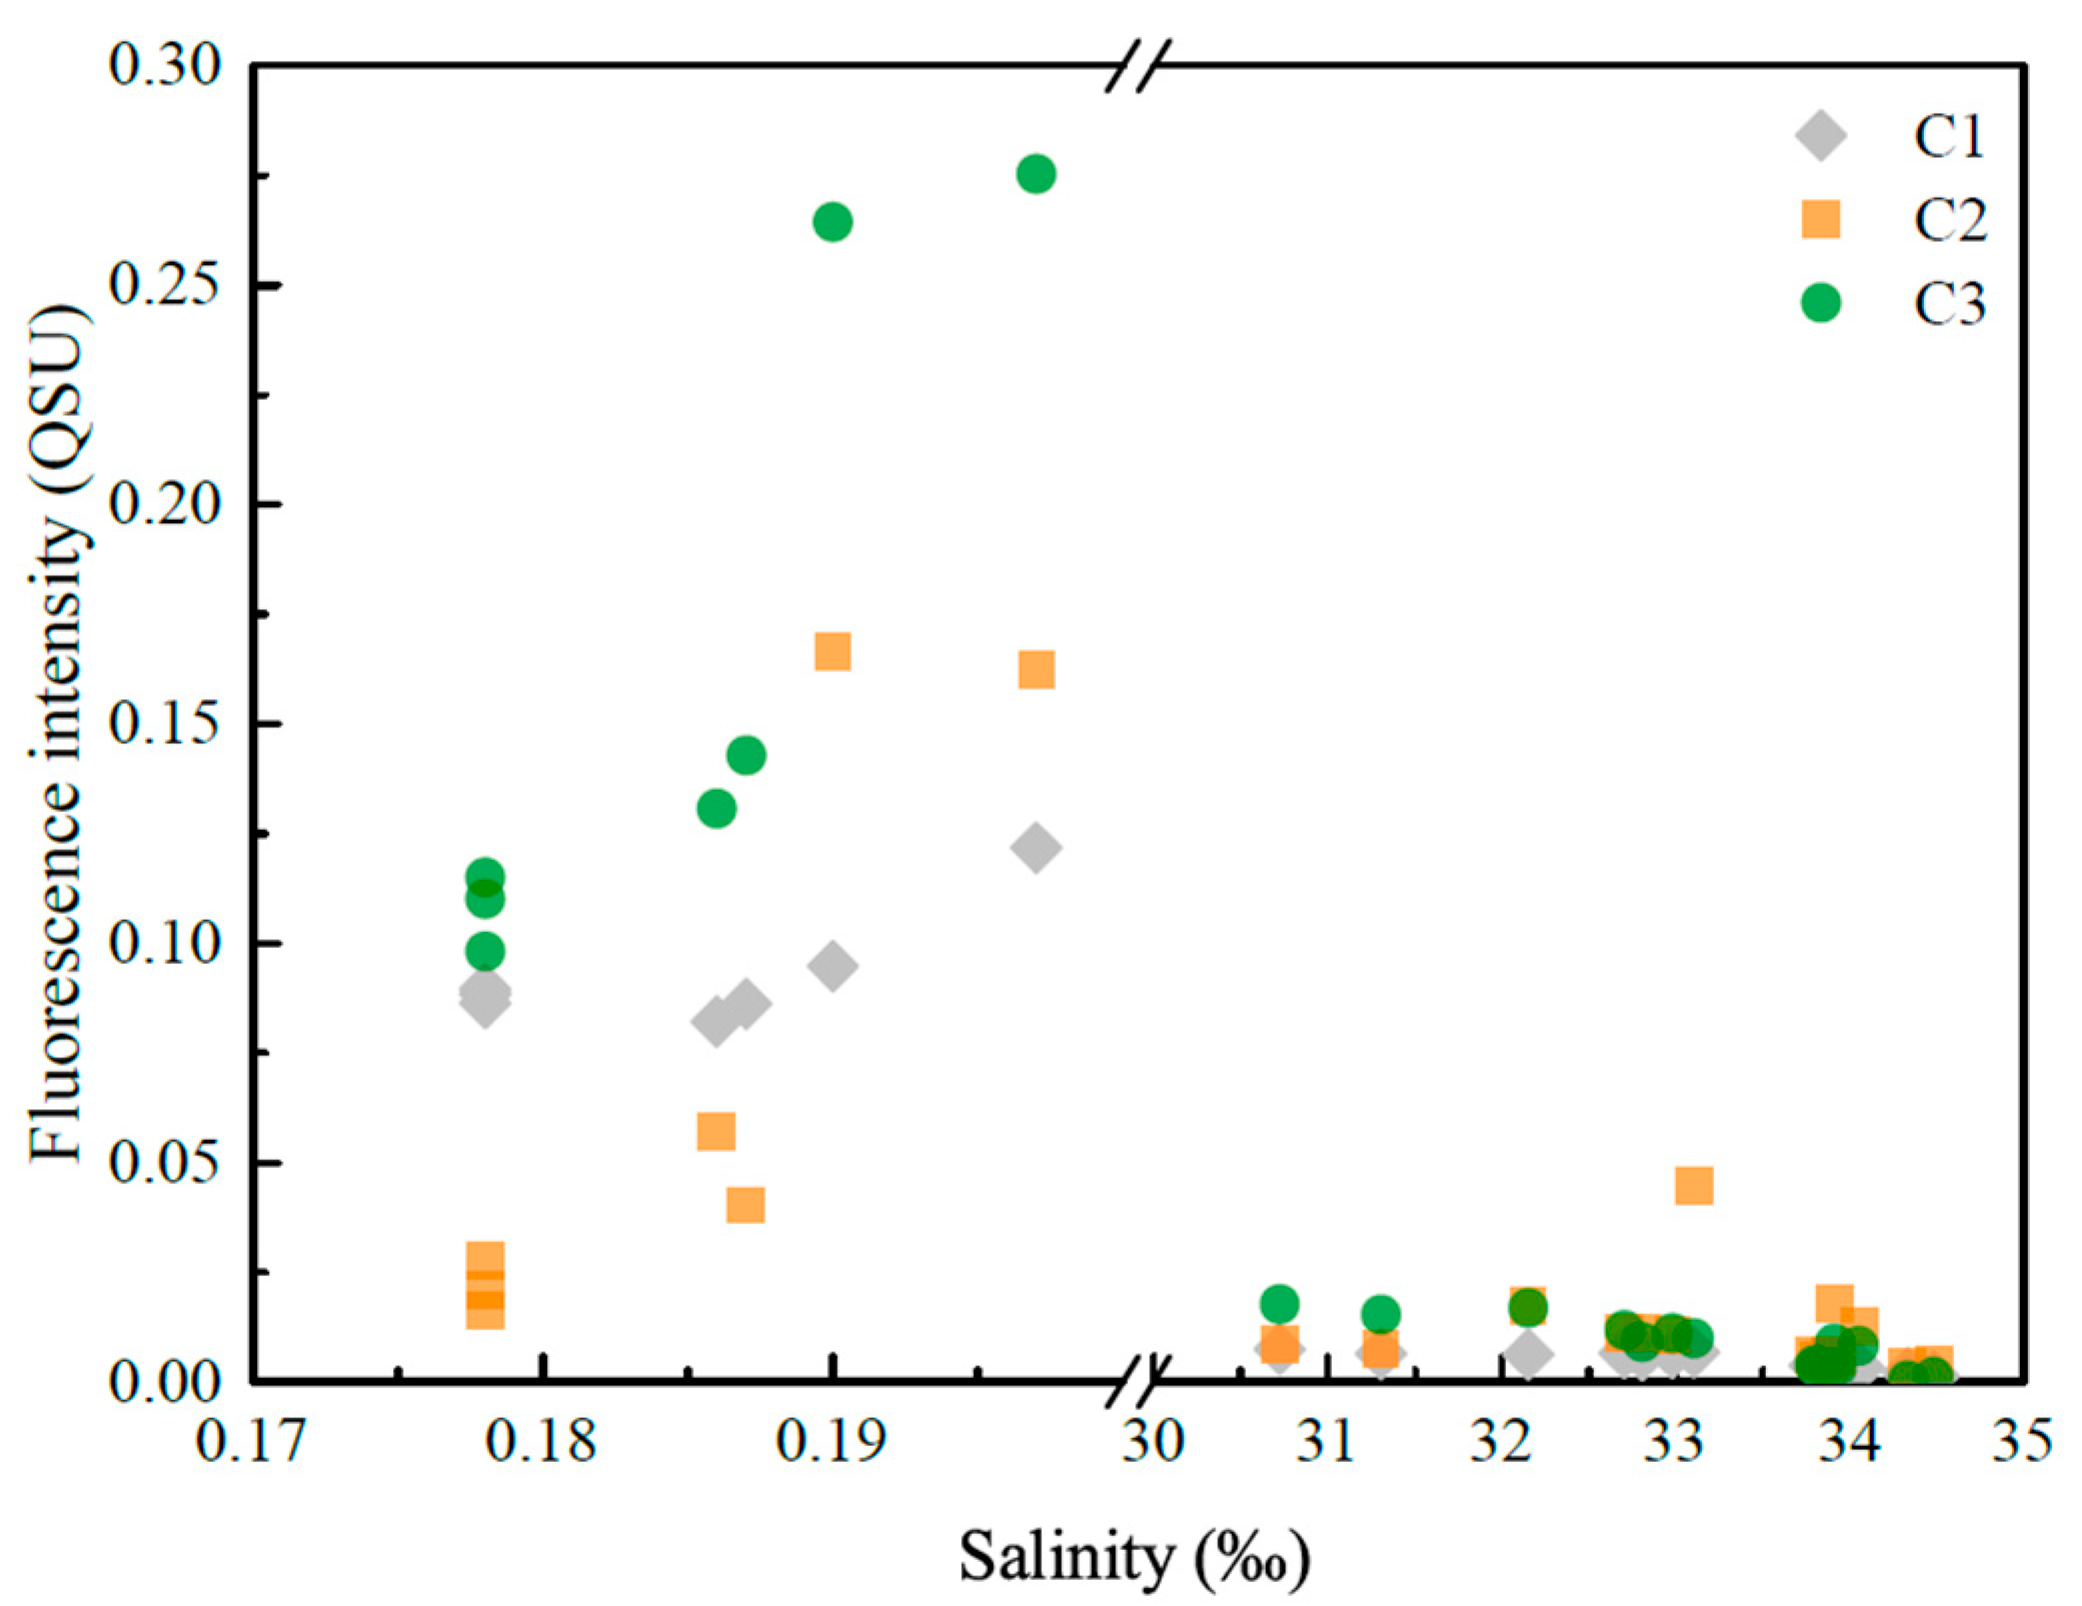
As is shown in Figure 9, the fluorescence intensities of components C1, C2, and C3 were much lower along sections PN and F than along section XM.
Along sections PN and F, all three components exhibited similar patterns: decreasing with increasing salinity. It should be noted that the intensity of C1 was relatively steady throughout section XM, whereas C2 and C3 varied consistently, and both increased abruptly at stations XM04 and XM05.

4. Discussion

Relationships between the DOC and the optical properties of the CDOM and the possible impact factors in different sections were analyzed in this study. The analysis of variance (ANOVA) statistics were utilized to determine whether the changes in the DOM composition were statistically significant. The F values of the one-way ANOVA of the Fs(355) (F > 70.67, p = 8.57 × 10⁻¹⁰), DOC (F > 73.68, p = 5.94 × 10⁻¹⁰), and a ( 355 ) (F > 295.75, p = 1.4 × 10⁻¹⁵) values are all greater than 1, indicating that the differences in the three sections were statistically significant. The following discussion is based on the results of the ANOVA statistical analysis.

4.1. Relationship between CDOM and DOC

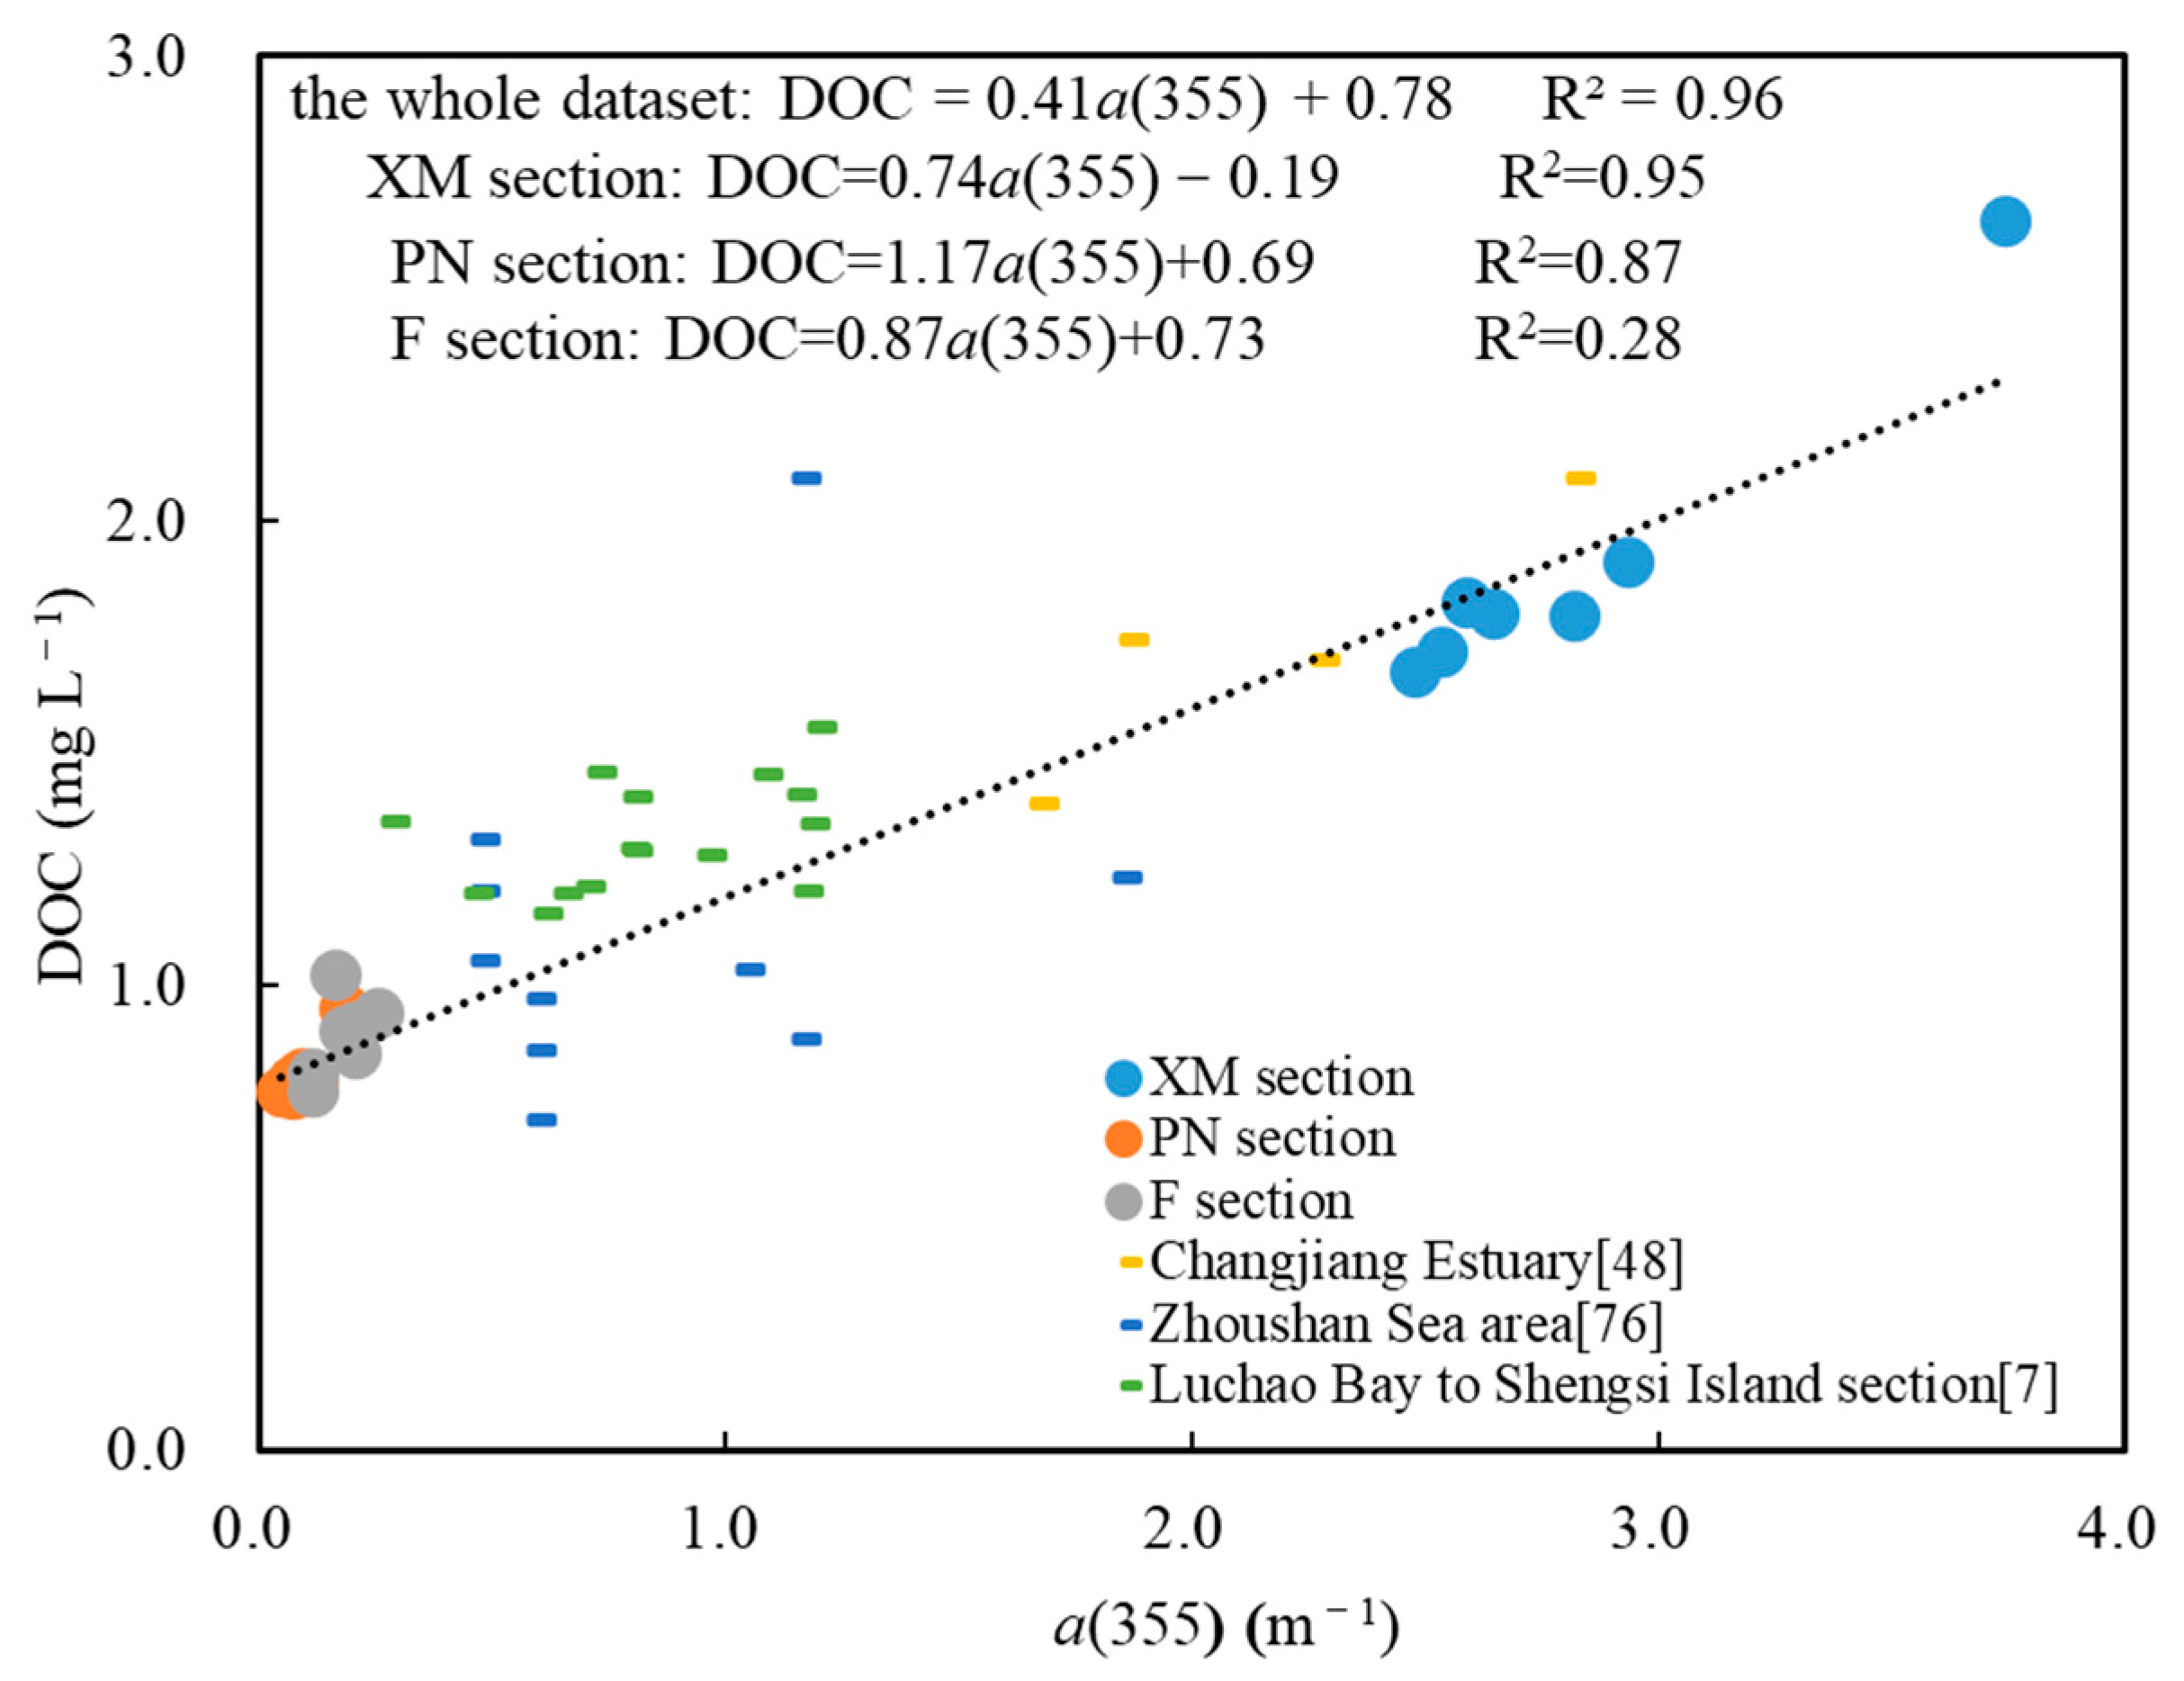
The low production of soil organic matter due to the low vegetation coverage in the Changjiang Basin is the most likely reason for the low DOC in Changjiang Estuary. In addition, the high concentrations of suspended particles in the Changjiang River and in the estuary are another important mechanism for the removal of DOC through adsorption [75]. It is notable that the low DOC is consistent with the low a ( 355 ) . Strong correlations between the a ( 355 ) and DOC were observed in sections PN and XM. However, a weaker positive correlation was observed in section F (Figure 10).
Fs(355) shows strong correlations with DOC for the whole dataset and for the three sections respectively (Figure 11). Particularly, the correlation between the Fs(355) and DOC in F section was better than that between the a ( 355 ) and DOC, but it was still lower than those in sections PN and XM (Figure 10). The weaker correlations between the a ( 355 ) , Fs(355), and DOC in section F may be due to the more complicated material composition supplied by multiple sources and to the different abilities of a ( 355 ) and Fs(355) to represent the diverse DOC species [76]; however, further investigation is needed to clarify this issue. Usually, terrestrial CDOM absorbs light strongly in the ultraviolet band due to the tannins and lignin constituents [77]; whereas marine CDOM has few aromatic rings, and its ability to absorb light is weak in the 355 nm band [78,79]. Thus, the a ( 355 ) value has advantages in terms of reflecting terrestrial CDOM [80]. Additionally, it should be noted that with the abnormally high DOC, a ( 355 ) and Fs(355) at station XM04 and XM05 will impact the reliability of their correlations.
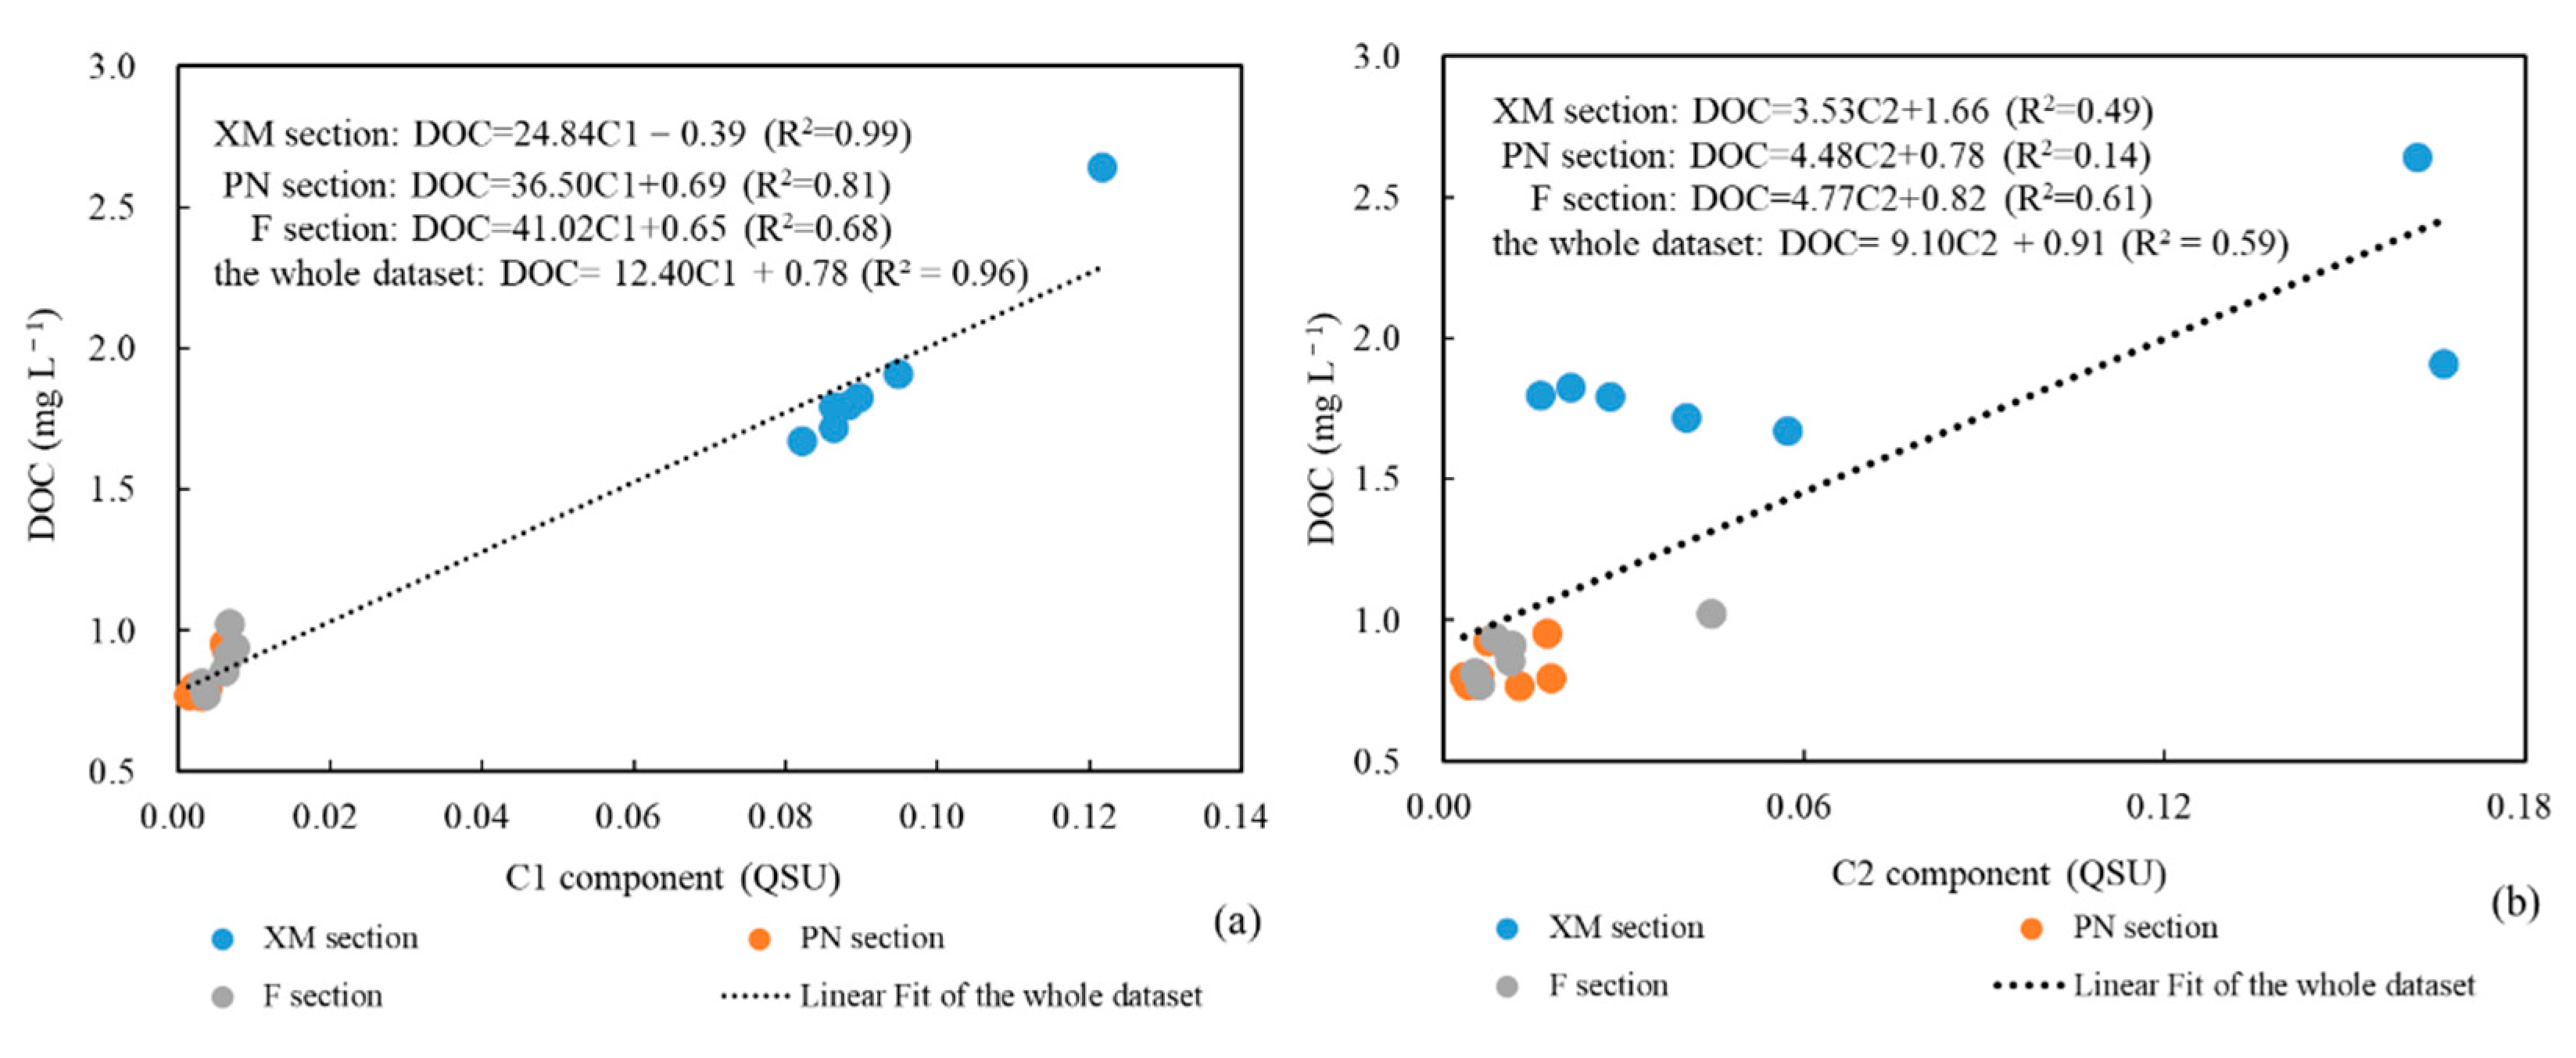
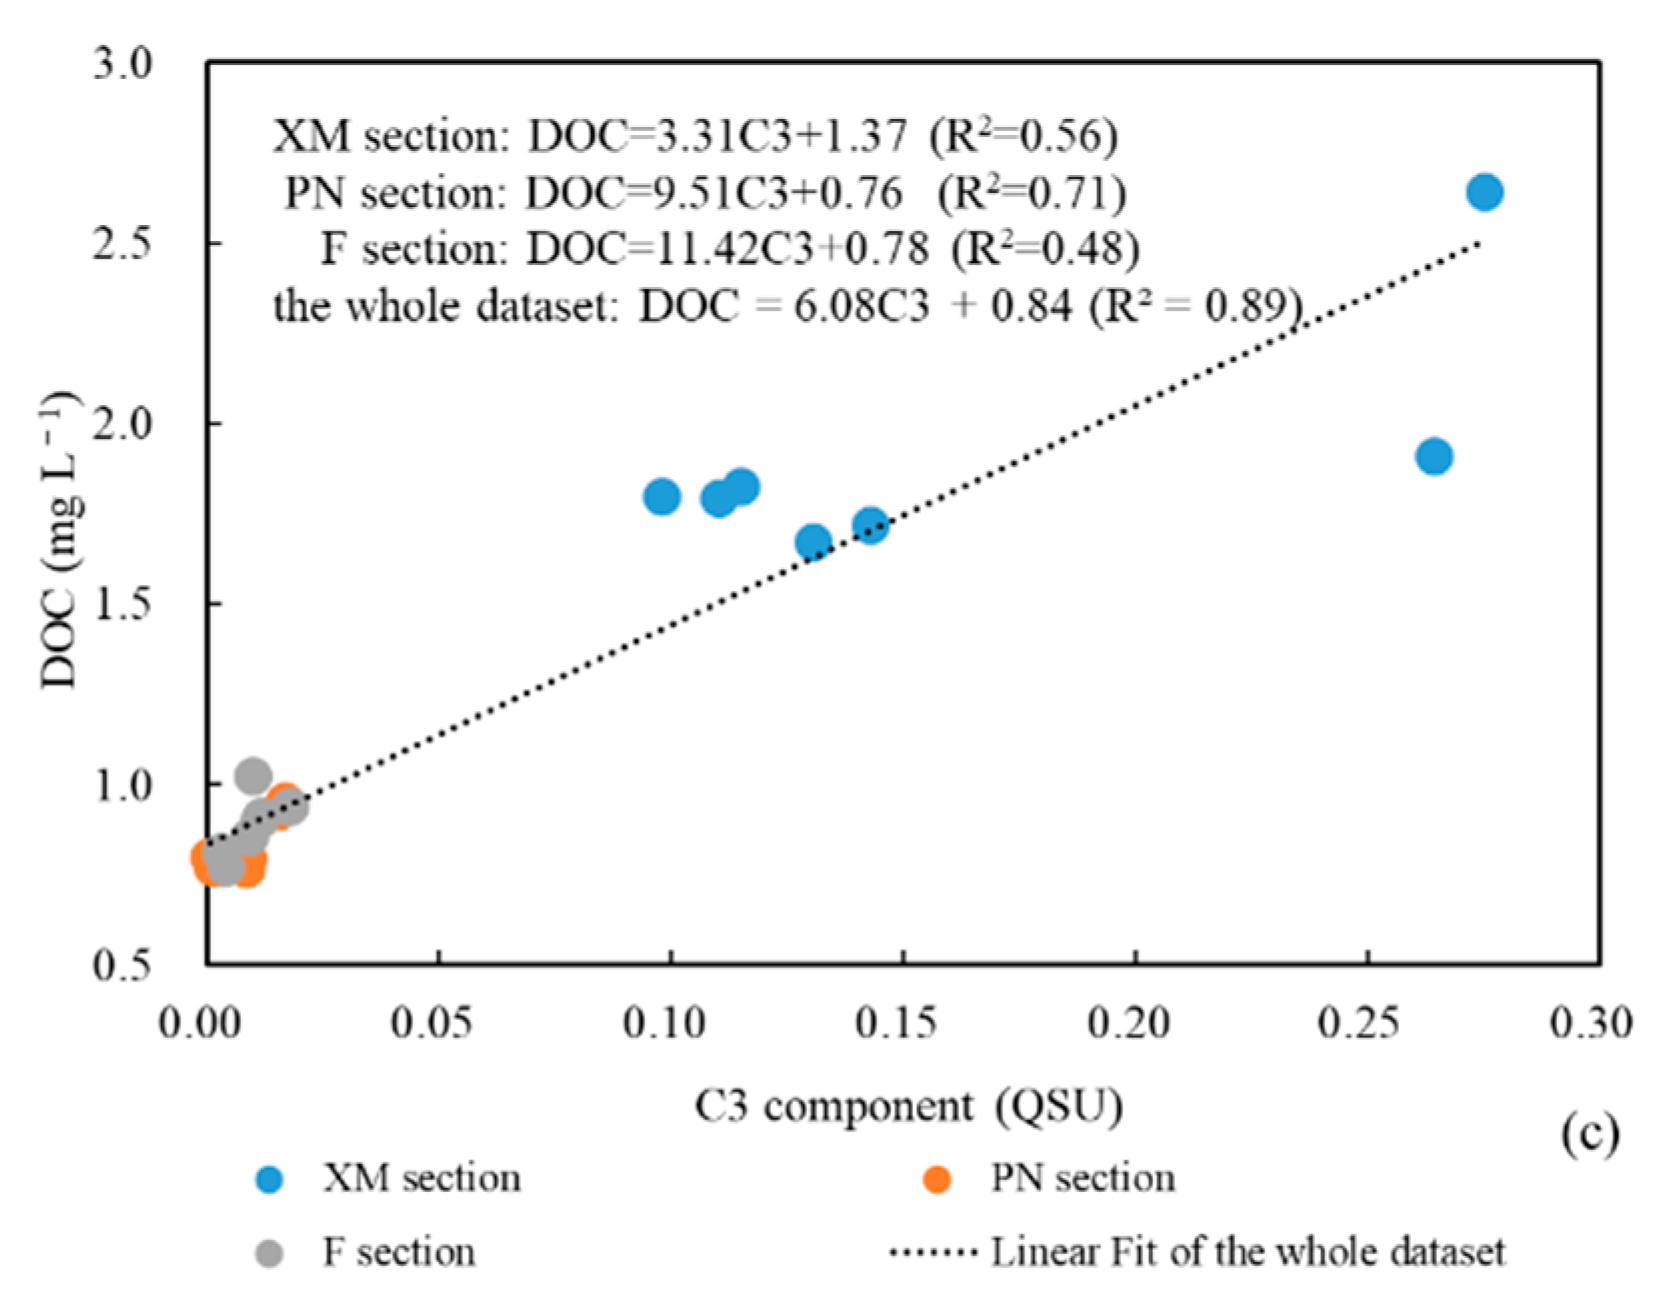
The correlations between the fluorophores and the DOC were further analyzed to explore the potential ability of the fluorescence intensities of the different fluorophores to represent the DOC content and species. In this study, the correlations between the DOC and the fluorescence intensities of the three fluorophores differed in the three different sections (Figure 12). (1) There was a strong correlation between C1 and the DOC for the entire dataset and in each section. The correlation coefficients along of the three sections decreases in the following order: XM > PN > F. Since C1 represents the humic-like component, the strong correlation between C1 and the DOC found in this study indicates the dominant control of the terrestrial materials in the study area and the decreasing impact of the terrestrial materials along the three sections. (2) The correlations between the protein-like components (C2 and C3) and the DOC vary along the three sections. A stronger positive correlation between C3 and the DOC was observed along section PN, which may indicate that biological production is one of the most important components of the DOC along section PN [69,70]. However, C2 and the DOC exhibit a stronger correlation along section F due to the more abundant input of bacteria-derived DOM and interstitial water through resuspension [80].

4.2. DOC Source Analysis

To obtain deeper insights into how the variable DOC component affects the relationships between the CDOM and the DOC, the possible DOC material sources that may introduce extra DOC and change the main DOC constituents along the three different sections were investigated.
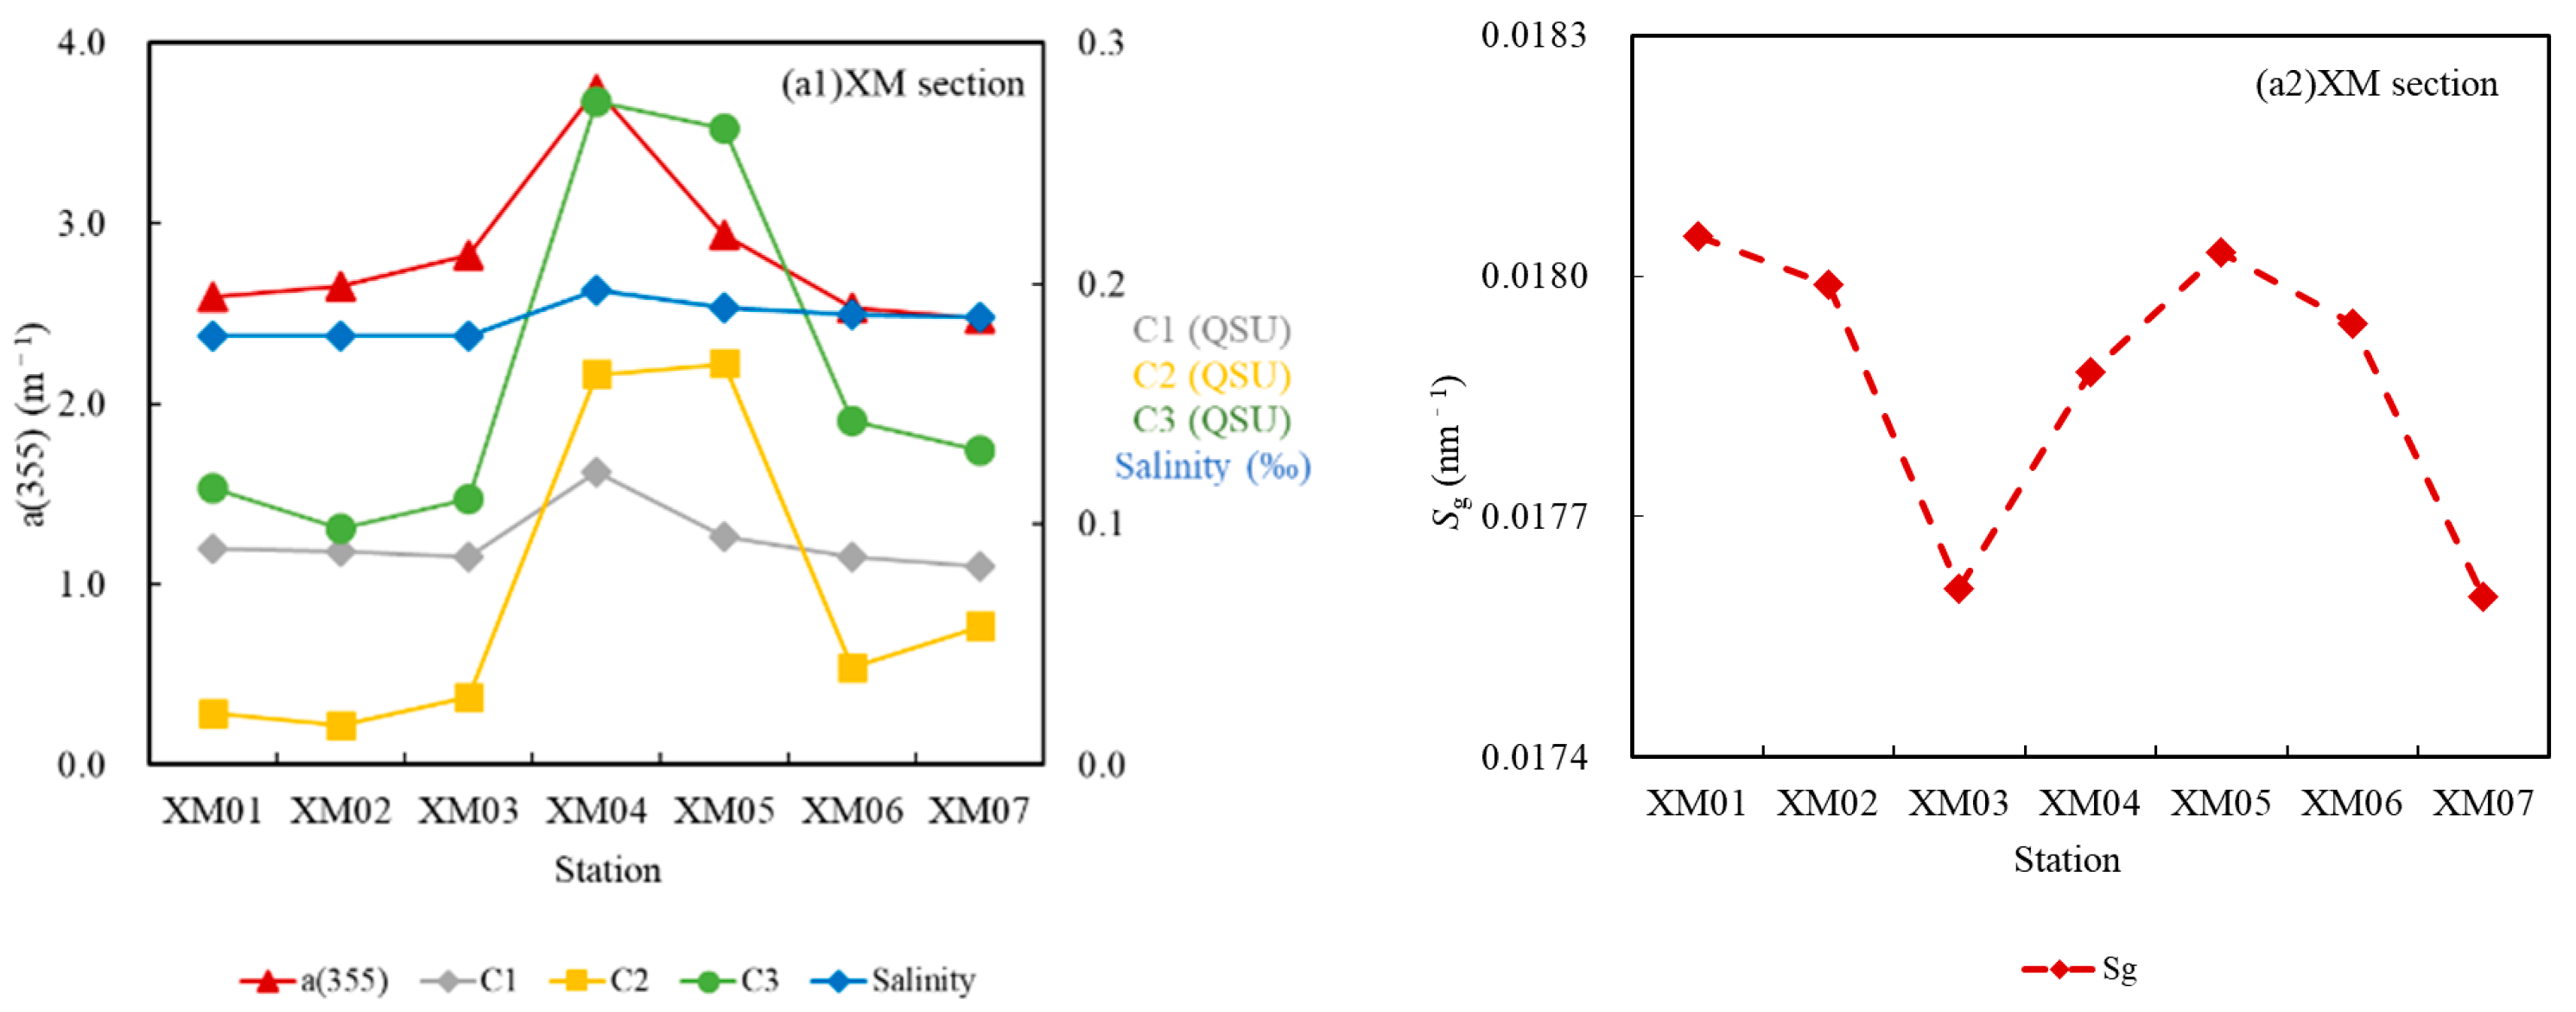
Particularly, Section XM is dominated by terrigenous materials, and therefore, it has the highest DOC concentration and a ( 355 ) , Fs(355), and C1 values and the lowest S g values [53,80]. However, the abnormal increases in the DOC, a ( 355 ) , Fs(355), C2, and C3 observed at stations XM04 and XM05 suggest sewage input from the Huangpu River (Figure 13(a1,a2)). Due to the rapid development of industry and agriculture in recent years, the water quality of the Huangpu River, which is an important tributary of the Changjiang Estuary, has deteriorated, and contains a great deal of organic matter, leading to the intensified autochthonous production of DOM [81,82]. This polluted water could have migrated to stations XM05 and XM04 or even further upstream after it flowed into the Changjiang River during high tides. The abnormally high DOC and CDOM optical properties due to the input from Huangpujiang River should be cautious, which may introduce overestimated DOC if they are used for DOC retrieval models’ construction.
Usually, C3 is associated with biological production [83], but the covariation in C3 and C2 along section XM mostly suggests that C3 contains tryptophan-like peak T (derived from an allochthonous source), which was noted by Hong et al. [84] in the Jiulong River watershed, and has been verified by its correlation with the tryptophan-like component.
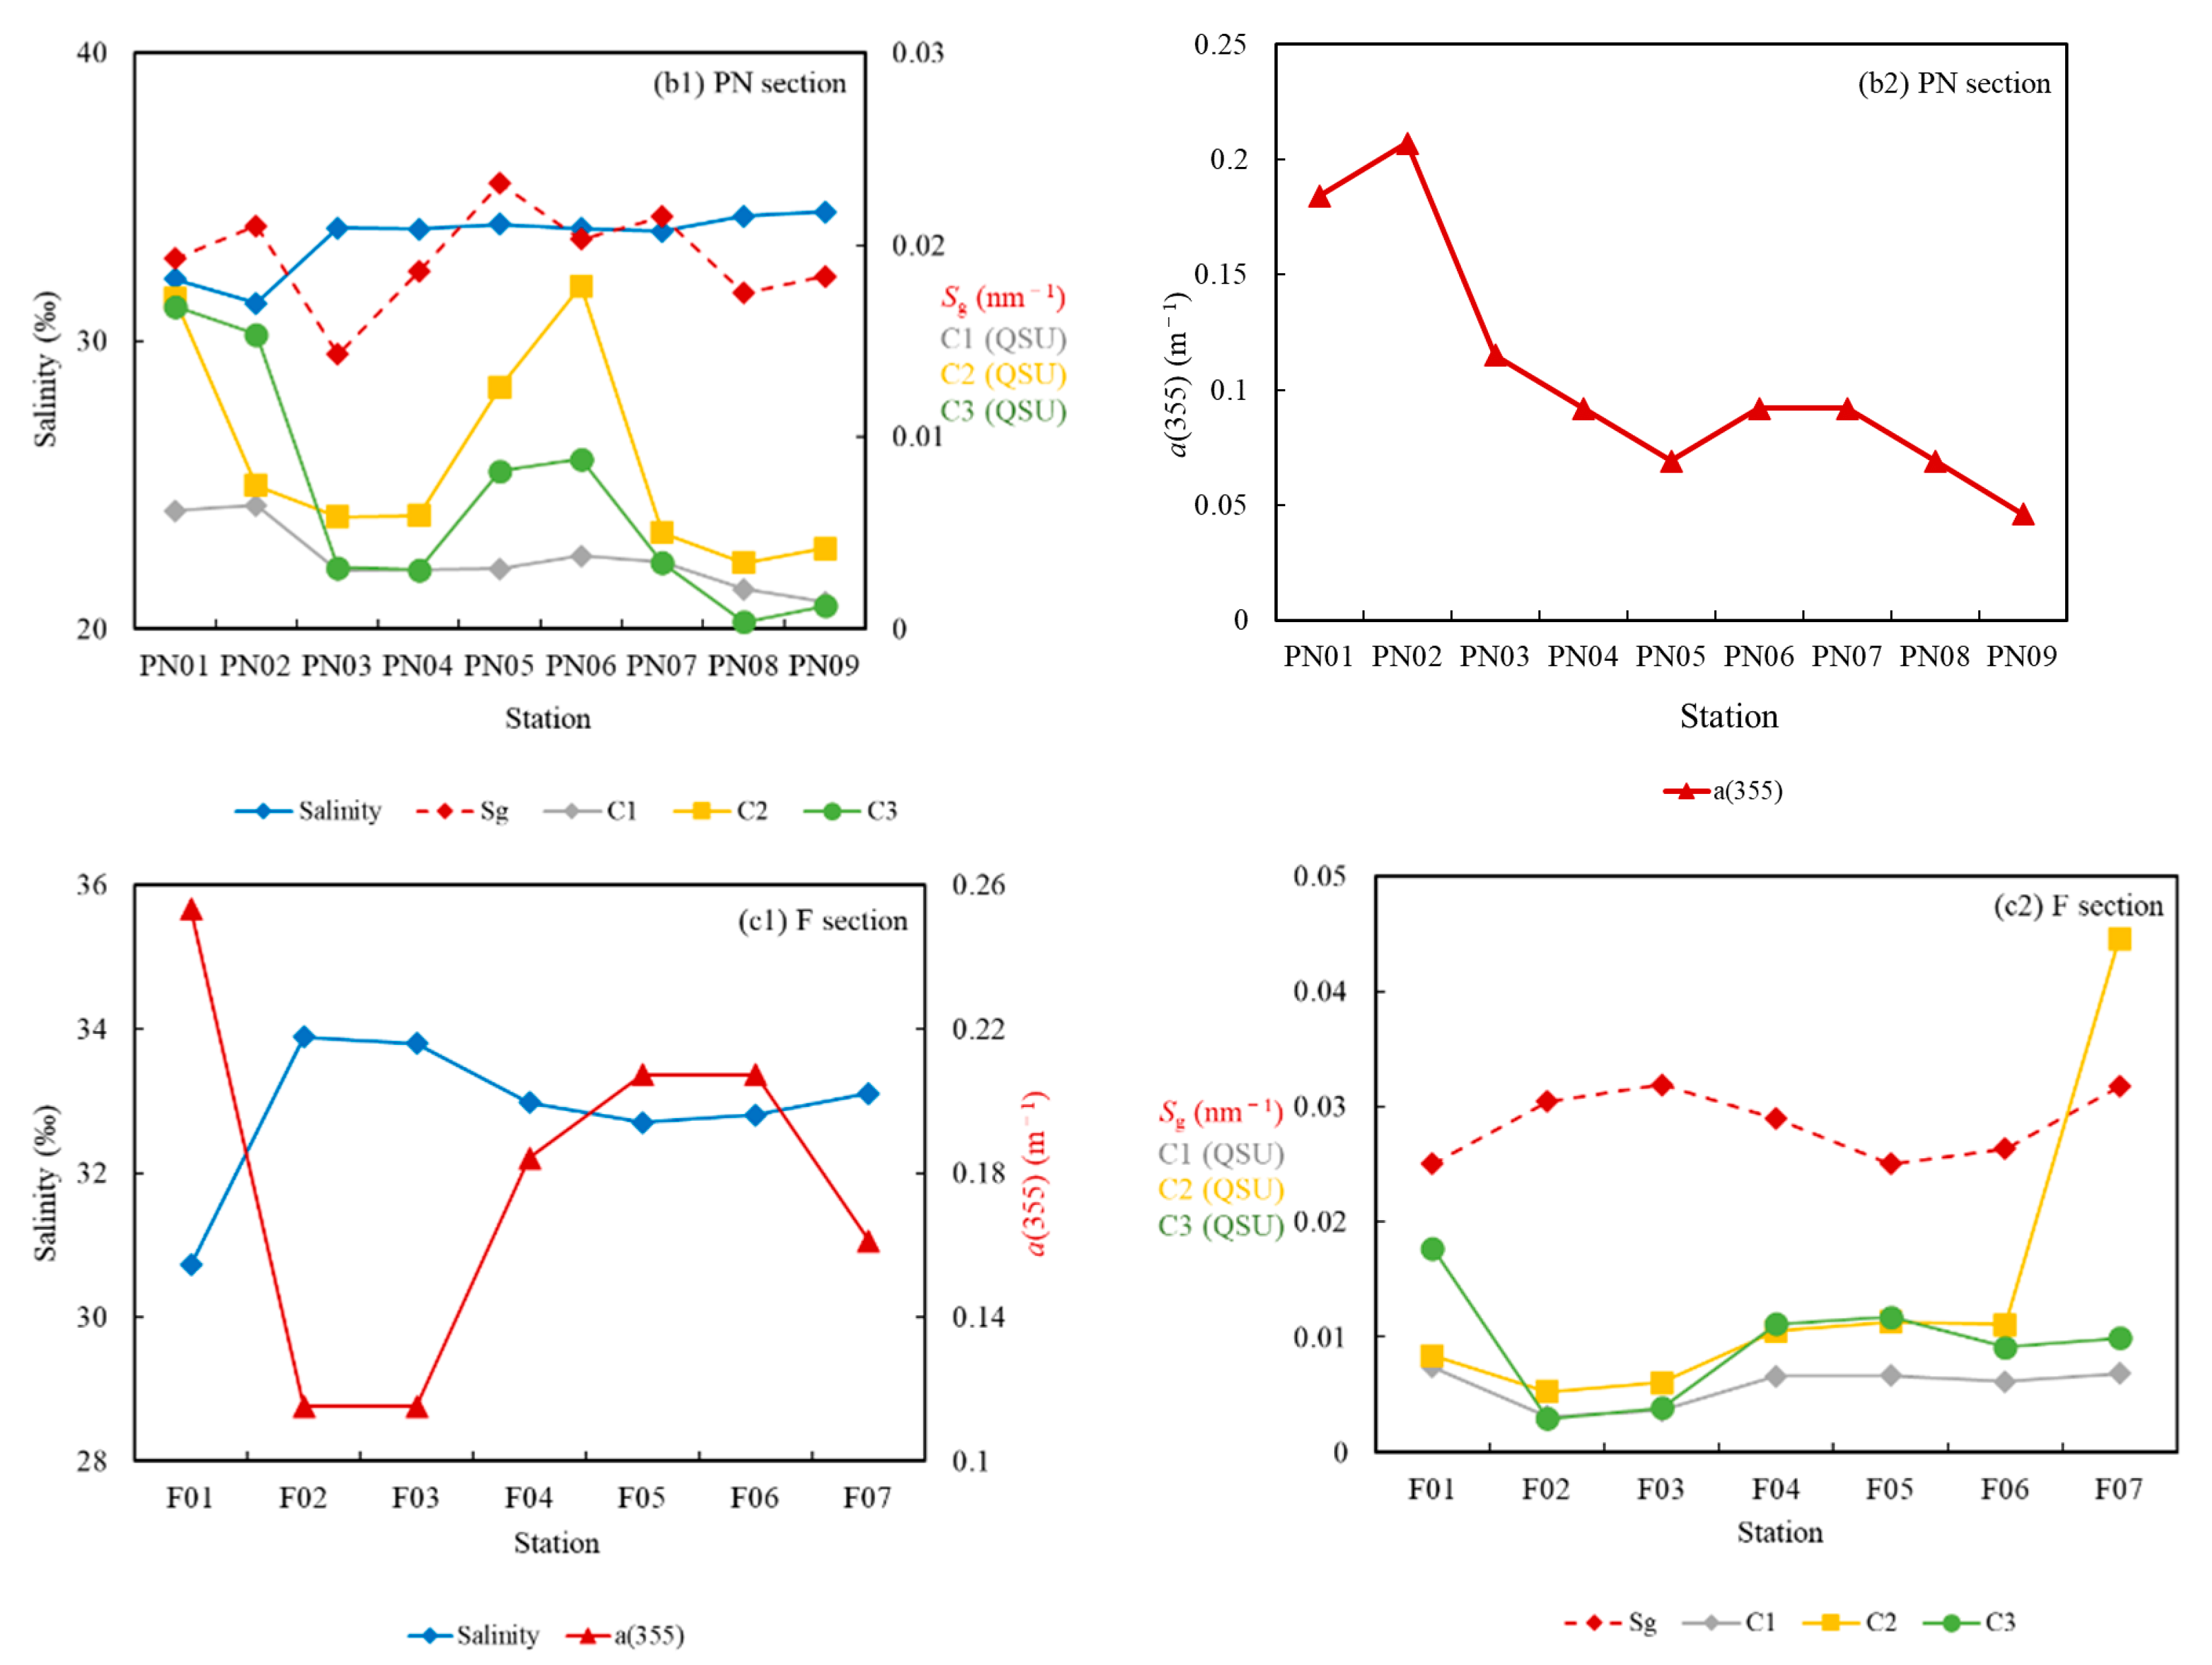
Along section PN (Figure 13(b1,b2)), the a ( 355 ) and C1 vary consistently with the DOC, suggesting the predominance of the terrestrial materials carried by the CDW and that the diffusion of the CDW is the basic hydrodynamic process. However, C2 and C3 vary differently than C1. They decrease gradually (similar to C1) at the first four stations, but they increase unexpectedly at stations PN05 and PN06. This is accompanied by abnormal increases in the Chl-a concentration from 0.75 μg L−1 at station PN04 to 1.29 μg L−1 at station PN05 and to 1.09 μg L−1 at station PN06. Because they are protein-like fluorescence components, C2 and C3 are usually attributed to autochthonous production during the exponential growth of phytoplankton [67]. Usually, high chlorophyll-a concentrations are observed in the Changjiang Estuary, especially in spring when the TWC converges with the saline water on the continental shelf [85], which promotes the aggregation of marine autochthonous substances. Thereafter, in addition to the terrestrial materials carried by the CDW, autochthonous DOM is also a main source of the DOC along section PN. The regional occurrence of marine autochthonous substances could be one of the main factors impairing the conservative behavior of the DOC along section PN.
Along section F (Figure 13(c1,c2)), C1 continuously decreases from station F01 to station F03, and it abruptly increases at station F04. Station F04 is located in the southwestern part of a cyclonic eddy to the southwest of Jeju Island, where materials from both the Changjiang Basin and the Old Huanghe Delta settle to the bottom [86]. This unexpected sustained increase in C1 at certain stations may suggest the input of additional terrestrial materials at station F04, except for the materials from the Changjiang Basin carried by the CDW.
Similar to C1, C2 and C3 decrease at the first few stations and then gradually increase starting at station F04. This may suggest the mitigation of the influence of the protein-like component (peak T) carried by the CDW runoff and the enhancement of the impact of the autochthonous marine materials, which are stimulated by the convergence of the SCC and the CDW.
An unexpected maximum for component value of C2 was observed at station F07, which is consistent with its abnormally high DOC concentration. Station F07 is located in an area where complex currents exchange materials and mix, the rich nutrients support plankton blooms, and the biological activities and degradation of biological debris produce protein-like fluorescence peaks [87]. Furthermore, there is an upwelling system to the south of Jeju Island (125°30′ E–127° E), which contains rich nutrients, and the frequent resuspension of bottom sediments has been observed [88]. The release of sediment interstitial water and/or sediment resuspension could cause the higher fluorescence intensity of the tryptophan and tyrosine in the bottom water [87], thus inducing an increase in the intensity of the protein-like C2 and the DOC in the surface sea water during upwelling. However, an abrupt decrease in the a ( 355 ) value was observed at this station, suggesting the weakness of using a ( 355 ) to represent marine CDOM and the weak influence of the terrestrial DOC.

5. Conclusions

In this study, the correlations between the optical properties of the CDOM and the DOC were discussed for the whole dataset, the south branch of Changjiang River (XM section), the main axis and the northern boundary of the CDW, i.e., sections PN and F, respectively. Both the absorptive and fluorescent properties of the CDOM in these sections and the possible sources of the extra DOC input were analyzed. The ability of the optical properties of the CDOM to reflect the main intrinsic mechanism impairing the correlation between the optical properties of the DOC and the CDOM in the CDW were investigated, and it was found that in addition to the hydrodynamic environment, phytoplankton, and microbial activities, the material sources may have a profound impact on the spatial CDOM and DOC variations and their correlations. Specifically, the following conclusions were drawn based on the results of this study.
Essentially, DOC shows conservative behavior, and the dilution of terrestrial material transported by CDW is dominant, controlling the DOC distribution features and the CDOM optical properties correspondingly. No obvious removal of DOC was observed in the three sections, however, extra inputs were observed in all three sections in different ways, impacting the correlations between the CDOM and DOC. In particular, the polluted water input from Huangpujiang River will produce overestimated DOC if data are used without cautious screening. The sustained terrestrial material input in section F included terrestrial materials from the Huanghe Basin, mainly from the Old Huanghe River Delta transported by the SCC, and from the Yellow Sea transported by the YSWCC, besides from the Changjiang Basin transported by the CDW. This may be one of the main factors causing the differences in the correlations between the optical properties of the DOC and CDOM. However, the degree of impact from the continuous material input from Huanghe River Basin should be studied further. In the PN section, the impact of autochthonous DOC input on the correlation between DOC and CDOM can be neglected in comparison with the conservative dilution procedure on the main axis of CDW.
Both a ( 355 ) and Fs(355) were demonstrated to be promising indexes for reflecting the DOC. However, it should be noted that a ( 355 ) worked well for the datasets, except for section F, while Fs(355) exhibited a strong correlation with the DOC in section F. Fs(355) was demonstrated to be a good indicator of the DOC concentrations of multiple source materials. Moreover, compared with a ( 355 ) and Fs(355), the fluorescence components were demonstrated to be powerful indicators of the different DOC species in complex estuary environments.
This study revealed that for the introduction of different species of DOC in multiple ways and for the different abilities of the CDOM absorptive and fluorescence properties to reflect the DOC, there are significant differences in the relationships between the DOC and the optical properties of the CDOM, even within the CDW. To establish a feasible inversion algorithm for determining DOC from the optical properties of the CDOM, long-term observations of the seasonal and annual variations in the DOC inputs from the different sources in this area are necessary in order to consider the effects of the CDW discharge, the magnitude of the currents, and even the wind stress. The optical properties of the DOC input from the different sources also require further study, and chemical analysis of different DOC species is a solution to provide insights into the intrinsic mechanisms determining the variable optical properties of the CDOM.

Author Contributions

Conceptualization, X.Z. and Y.D.; methodology, Z.M., L.B., J.C. and H.J.; software, Y.D.; writing—original draft preparation, X.Z. and Y.D.; writing—review and editing, Y.D. and S.M. All authors have read and agreed to the published version of the manuscript.

Funding

This study was funded by the National Key Research and Development Program of China (2018YFC1406600), which is supported by the Ministry of Science and Technology of the People’s Republic of China; the National Natural Science Foundation of China (40706057, 41773005); the Key Research and Development Program of Zhejiang Provence, China (2021C01017); and the Jiyang College of Zhejiang A&F University (Grant No. RQ1911F11).

Institutional Review Board Statement

Not applicable.

Informed Consent Statement

Not applicable.

Data Availability Statement

The data contained in this paper are available from the authors.

Acknowledgments

We thank all of the R/V “DFH” crew for their support during the sample collection, and Yunlin Zhang and Yongqiang Zhou of the Nanjing Institute of Geography and Limnology, Chinese Academy of Sciences, for their assistance in extracting the CDOM EEMS using PARAFAC and for fruitful discussions.

Conflicts of Interest

The researchers have no conflict of interest.

Disclosures

XYZ: School of Earth Sciences, Zhejiang University, China, and Ocean Academy, Zhejiang University, China; YD: Jiyang College of Zhejiang A&F University, China; ZHM: State Key Laboratory of Satellite Ocean Environment Dynamics, Second Institute of Oceanography, Ministry of National Resources, China; LB: School of Earth Sciences, Zhejiang University, China; JYC: State Key Laboratory of Satellite Ocean Environment Dynamics, Second Institute of Oceanography, Ministry of National Resources, China; HYJ: Laboratory of Marine Ecosystems and Biogeochemistry, the Second Institute of Oceanography, Ministry of National Resources, China; MSC: School of Earth Sciences, Zhejiang University, China.

Abbreviations

CDOMChromophoric Dissolved Organic Matter
CDWChangjiang Diluted Water
chlorophyll-aChl-a
DOCDissolved Organic Carbon
DOMDissolved Organic Matter
ECSEast China Sea
EEMsExcitation Emission Matrix Fluorescence spectroscopy
HTCOHigh-Temperature Catalytic Oxidation
MTZMaximum Turbidity Zone
PARAFACParallel Factor Analysis
SCCSubei Coastal Current
SSSuspended Sediments
TWCTaiwan Warm Current
YSWCYellow Sea Warm Current
YSWCCYellow Sea Western Coastal Current
ZCCZhejiang Coastal Current

References

  1. John, A.H.; Nina, C.; Sybil, P.S. Global patterns and sources of dissolved organic matter export to the coastal zone: Results from a spatially explicit, global model. Glob. Biogeochem. Cycles 2005, 19, 367–384. [Google Scholar] [CrossRef]
  2. Chen, X.; Zhang, X.Y.; Lei, H. Optical absorption properties of CDOM and tracing implication of DOC in the Changjiang Estuary. Mar. Environ. Sci. 2012, 31, 625–630. [Google Scholar] [CrossRef]
  3. Sun, Q.Y.; Wang, C.; Wang, P.F.; Hou, J.; Ao, Y.H. Absorption and fluorescence characteristics of chromophoric dissolved organic matter in the Yangtze Estuary. Environ. Sci. Pollut. Res. 2014, 21, 3460–3473. [Google Scholar] [CrossRef] [PubMed]
  4. Li, Y.; Song, G.; Hu, S.; Xie, H. Optical characterization, distribution and sources of chromophoric dissolved organic material (CDOM) in the Changjiang river estuary in July 2014. Oceanol. Limnol. Sin. 2015, 46, 670–678. [Google Scholar]
  5. Zhou, Q.; Su, R.; Bai, Y.; Zhang, C.; Shi, X. Characterization of chromophoric dissolved organic matter (CDOM) in Zhoushan Fishery Using Excitation-Emission Matrix Spectroscopy (EEMs) and Parallel Factor Analysis (PARAFAC). Environ. Sci. 2015, 36, 163–171. [Google Scholar] [CrossRef]
  6. Liu, Q.; Pan, D.; Bai, Y.; Wu, K.; Chen, C.A.; Sun, J.; Zhang, L. The satellite reversion of dissolved organic carbon (DOC) based on the analysis of the mixing behavior of DOC and colored dissolved organic matter: The East China Sea as an example. Acta Oceanol. Sin. 2013, 32, 1–11. [Google Scholar] [CrossRef]
  7. Zhang, X.Y.; Chen, X.; Deng, H.; Du, Y.; Jin, H.Y. Absorption features of chromophoric dissolved organic matter (CDOM) and tracing implication for dissolved organic carbon (DOC) in Changjiang Estuary, China. Biogeosci. Discuss. 2013, 101, 2217–12250. [Google Scholar] [CrossRef]
  8. Yu, X.L.; Shen, F.; Liu, Y.Y. Light absorption properties of CDOM in the Changjiang (Yangtze) estuarine and coastal waters: An alternative approach for DOC estimation. Estuar. Coast. Shelf Sci. 2016, 181, 302–311. [Google Scholar] [CrossRef] [Green Version]
  9. Bodineau, L.; Thournelin, G.; Beghin, V.; Wartel, M. Tidal Time-scale Changes in the Composition of Particulate Organic Matter within the Estuarine Turbidity Maximum Zone in the Macrotidal Seine Estuary, France: The Use of Fatty Acid and Sterol Biomarkers. Estuar. Coast. Shelf Sci. 1998, 47, 37–49. [Google Scholar] [CrossRef]
  10. Yang, L.Y.; Chen, W.; Zhuang, W.E.; Cheng, Q.; Li, W.X.; Wang, H.; Guo, W.D.; Chen, C.T.A.; Liu, M.H. Characterization and bioavailability of rainwater dissolved organic matter at the southeast coast of China using absorption spectroscopy and fluorescence EEM-PARAFAC. Coast. Shelf Sci. 2019, 217, 45–55. [Google Scholar] [CrossRef]
  11. William, L.M.; Mary, A.M. Interaction of photochemical and microbial processes in the degradation of refractory dissolved organic matter from a coastal marine environment. Limnol. Oceanogr. 1997, 42, 1317–1324. [Google Scholar] [CrossRef]
  12. Nelson, N.B.; Siegel, D.A.; Michaels, A.F. Seasonal dynamics of colored dissolved material in the Sargasso Sea. Deep Sea Res. Part I Oceanogr. Res. Pap. 1998, 45, 931–957. [Google Scholar] [CrossRef]
  13. Siegel, D.A.; Maritorena, S.; Nelson, N.B.; Behrenfeld, M.J. Independence and interdependencies among global ocean color properties: Reassessing the bio-optical assumption. J. Geophys. Res. Ocean. 2005, 110, 1–14. [Google Scholar] [CrossRef] [Green Version]
  14. Yang, L.Y.; Guo, W.D.; Hong, H.S.; Wang, G.Z. Non-conservative behaviors of chromophoric dissolved organic matter in a turbid estuary: Roles of multiple biogeochemical processes. Estuar. Coast. Shelf Sci. 2013, 133, 285–292. [Google Scholar] [CrossRef]
  15. Dai, Z.; Fagherazzi, S.; Mei, X. Decline in suspended sediment concentration delivered by the Changjiang (Yangtze) River into the East China Sea between 1956 and 2013. Geomorphology 2016, 268, 123–132. [Google Scholar] [CrossRef] [Green Version]
  16. Zhao, B.R.; Limeburner, R.; Hu, D.X.; Cui, M.C. Oceanographic charactreistics of the southern Yellow sea and the northern east China sea in summer. Oceanol. Limnol. Sin. 1991, 22, 132–139. [Google Scholar] [CrossRef]
  17. Zhu, J.R.; Shen, H.T.; Zhou, J. Numerical Simulation of the Impact of the Subei Coastal Current on the Expansion of the Changjiang River Diluted Water in Summer. Oceanol. Limnol. Sin. 1997, 2, 62–67. [Google Scholar] [CrossRef]
  18. Lin, C.; Ning, X.; Su, J.; Lin, Y.; Xu, B. Environmental changes and the responses of the ecosystems of the Yellow Sea during 1976–2000. J. Mar. Syst. 2004, 55, 223–234. [Google Scholar] [CrossRef]
  19. Sun, X. Chinese Offshore Marine Area (Chinese Edition); Ocean Press: Beijing, China, 2006; ISBN 9787502766108. [Google Scholar]
  20. Hu, D.X. Some Striking Features of Circulation in Huanghai Sea and East China Sea. In Oceanology of China Seas; Springer: Dordrecht, The Netherlands, 1994; pp. 27–38. ISBN 978–0-7923-2616-8. [Google Scholar]
  21. Wei, Q.S.; Yu, Z.G.; Wang, B.D.; Fu, M.Z.; Xia, C.S.; Liu, L.; Ge, R.F.; Wang, H.W.; Zhan, R. Coupling of the spatial–temporal distributions of nutrients and physical conditions in the southern Yellow Sea. J. Mar. Syst. 2016, 156, 30–45. [Google Scholar] [CrossRef]
  22. Alan, L.S.; Jonathan, D.T. Marine snow: Microscale nutrient patched. Limnol. Oceanogr. 1979, 24, 850–854. [Google Scholar] [CrossRef]
  23. Fu, M.; Wang, Z.; Li, Y.; Li, R.; Sun, P.; Wei, X.; Lin, X.; Guo, J. Phytoplankton biomass size structure and its regulation in the Southern Yellow Sea (China): Seasonal variability. Cont. Shelf Res. 2009, 29, 2178–2194. [Google Scholar] [CrossRef]
  24. Qi, L.; Hu, C.; Duan, H.; Barnes, B.; Ma, R. An EOF-Based Algorithm to Estimate Chlorophyll a Concentrations in Taihu Lake from MODIS Land-Band Measurements: Implications for Near Real-Time Applications and Forecasting Models. Remote Sens. 2014, 6, 10694–10715. [Google Scholar] [CrossRef] [Green Version]
  25. Deng, B.; Zhang, J.; Wu, Y. Recent sediment accumulation and carbon burial in the East China Sea. Glob. Biogeochem. Cycles 2006, 20, 1–12. [Google Scholar] [CrossRef]
  26. Zhang, L.J.; Zang, J.Y.; Xing, M.A.Y.; Ling, L.L.; Liu, W.; Zhang, B.T.; Ran, X.B. Variability and influence of dissolved silica in the Qiangtangjiang Estuary. Mar. Sci. 2015, 8, 51–57. [Google Scholar]
  27. Kang, L.K.; Lu, H.M.; Sung, P.T.; Chan, Y.F.; Lin, Y.C.; Gong, G.C.; Chiang, K.P. The summer distribution of coccolithophores and its relationship to water masses in the East China Sea. J. Oceanogr. 2016, 72, 883–893. [Google Scholar] [CrossRef]
  28. Han, B.; Zhang, X.; Yang, J.; Pei, J. Multiple-height analytical continuation in processing the gravity anomaly data from the East China Sea and adjacent regions. Chin. High Technol. Lett. 2007, 17, 1272–1277. [Google Scholar] [CrossRef]
  29. Ogawa, H.; Tanoue, E. Dissolved Organic Matter in Oceanic Waters. J. Oceanogr. 2003, 59, 129–147. [Google Scholar] [CrossRef]
  30. Aoyama, M.; Hirose, K. Radiometric determination of anthropogenic radionuclides in seawater. Radioact. Environ. 2008, 11, 137–162. [Google Scholar] [CrossRef]
  31. Wang, S.Y.; Liu, J.P. Delving into the relationship between autumn Arctic sea ice and central–eastern Eurasian winter climate. Atmos. Ocean Sci. Lett. Engl. Version 2016, 9, 366–374. [Google Scholar] [CrossRef] [Green Version]
  32. Chen, C.C.; Gong, G.C.; Shiah, F.K. Hypoxia in the East China Sea: One of the largest coastal low-oxygen areas in the world. Mar. Environ. Res. 2007, 64, 399–408. [Google Scholar] [CrossRef] [Green Version]
  33. Wang, B.; Hu, J.; Li, S.; Liu, D. Anumerical analysis of biogeochemical controls with physical modulation on hypoxia during summer in the Pearl River estuary. Biogeoences 2017, 14, 1–31. [Google Scholar] [CrossRef] [Green Version]
  34. Murphy, K.R.; Dunsmuir, W.T.; Waite, T.D.; Ruiz, G.M.; Coble, P.G. Chromophoric dissolved organic matter (CDOM): Fluorescence losses in frozen samples. In Proceeding of the American Geophysical Union Fall Meeting, San Francisco, CA, USA, 11–15 December 2005. [Google Scholar]
  35. Griffin, C.G.; McClelland, J.W.; Vonk, J.E.; Holmes, R.M.; Frey, K.E. Chromophoric dissolved organic matter during the Mackenzie River spring freshet: Observations and freeze-thaw experiments. In Proceedings of the American Geophysical Union Fall Meeting, Vienna, Austria, 22–27 April 2012. [Google Scholar]
  36. Zhang, J.B.; Song, C.C.; Yang, W.Y. Seasonal dynamics of dissolved organic carbon and its impact factors in the Doyeuxia augustifolia marsh soil. J. Environ. Sci. 2005, 25, 1397–1402. [Google Scholar] [CrossRef]
  37. Su, J. China Offshore Hydrological (Chinese Edition); Ocean Press: Beijing, China, 2005; ISBN 9787502762926. [Google Scholar]
  38. Robyn, N.C.; Paula, G.C.; Robert, F.C.; Gardner, B.G. Optical properties of colored dissolved organic matter in the Northern Gulf of Mexico. Mar. Chem. 2004, 89, 127–144. [Google Scholar] [CrossRef]
  39. Stedmon, C.A.; Markager, S.; Kaas, H. Optical Properties and Signatures of Chromophoric Dissolved Organic Matter (CDOM) in Danish Coastal Waters. Estuar. Coast. Shelf Sci. 2000, 51, 267–278. [Google Scholar] [CrossRef]
  40. Colin, A.S.; Stiig, M.; Rasmus, B. Tracing dissolved organic matter in aquatic environments using a new approach to fluorescence spectroscopy. Mar. Chem. 2003, 82, 239–254. [Google Scholar] [CrossRef]
  41. Zhang, Y.L.; Mark, A.V.D.; Liu, M.L.; Zhu, G.W.; Qin, B.Q. The contribution of phytoplankton degradation to chromophoric dissolved organic matter (CDOM) in eutrophic shallow lakes: Field and experimental evidence. Water Res. 2009, 43, 4685–4697. [Google Scholar] [CrossRef]
  42. Zhang, Y.L.; Zhang, E.L.; Yin, Y.; Mark, A.V.D.; Feng, L.Q.; Shi, Z.Q.; Liu, M.L.; Qin, B.Q. Characteristics and sources of chromophoric dissolved organic matter in lakes of the Yungui Plateau, China, differing in trophic state and altitude. Limnol. Oceanogr. 2010, 55, 2645–2659. [Google Scholar] [CrossRef]
  43. Colin, A.S.; Rasmus, B. Characterizing dissolved organic matter fluorescence with parallel factor analysis: A tutorial. Limnol. Oceanogr. Methods 2008, 6, 572–579. [Google Scholar] [CrossRef]
  44. Lin, J.R.; Li, X.L.; Chen, W.F. Sampling and determination of marine dissolved organic carbon. Oceanol. Limnol. Sin. 2008, 39, 604–611. [Google Scholar] [CrossRef]
  45. National Marine Standardization Technical Committee. The Specification for Marine Monitoring GB 17378.4-2007. Available online: http://www.gb688.cn/bzgk/gb/newGbInfo?hcno=9FB14D0EE23D77A96D54A9BDAAF6EA07 (accessed on 7 November 2008).
  46. Zhang, J.; Wu, Y.; Jennerjahn, T.C.; Ittekkot, V.; He, Q. Distribution of organic matter in the Changjiang (Yangtze River) Estuary and their stable carbon and nitrogen isotopic ratios: Implications for source discrimination and sedimentary dynamics. Mar. Chem. 2007, 106, 111–126. [Google Scholar] [CrossRef]
  47. Chen, Z.Q.; Li, Y.; Pan, J.M. Distributions of colored dissolved organic matter and dissolved organic carbon in the Pearl River Estuary, China. Cont. Shelf Res. 2004, 24, 1845–1856. [Google Scholar] [CrossRef]
  48. Guo, W.; Yang, L.; Zhai, W. Runoff-mediated seasonal oscillation in the dynamics of dissolved organic matter in different branches of a large bifurcated estuary-The Changjiang Estuary. J. Geophys. Res. Biogeosci. 2014, 119, 776–793. [Google Scholar] [CrossRef]
  49. Blough, N.V.; Oliver, Z.; Bonilla, J.J. Optical absorption spectra of waters from the Orinoco River outflow: Terrestrial input of colored organic matter to the Caribbean. J. Geophys. Res. Atmos. 1993, 98, 2271–2278. [Google Scholar] [CrossRef]
  50. Ferrari, G.M.; Dowell, M.D. CDOM Absorption Characteristics with Relation to Fluorescence and Salinity in Coastal Areas of the Southern Baltic Sea. Estuar. Coast. Shelf Sci. 1998, 47, 91–105. [Google Scholar] [CrossRef]
  51. Guo, L.; Santschi, P.H.; Bianchi, T.S. Dissolved organic matter in estuaries of the Gulf of Mexico. Biogeochem. Gulf Coast Estuaries 1999, 269–299. [Google Scholar] [CrossRef] [Green Version]
  52. Guo, W.D.; Colin, A.S.; Han, Y.C.; Wu, F.; Yu, X.X.; Hu, M.H. The conservative and non-conservative behavior of chromophoric dissolved organic matter in Chinese estuarine waters. Mar. Chem. 2007, 107, 357–366. [Google Scholar] [CrossRef]
  53. Kong, D.X.; Yang, H.; Wu, J.H. Optical absorption properties of chromophoric dissolvable organic matter in Changjiang Estuary. Mar. Environ. Sci. 2008, 27, 629–631. [Google Scholar] [CrossRef]
  54. Wang, X.; Yang, H.; Wu, X.L.; Kong, D.X. Optical absorption properties of chromophoric dissolved organic matter in the seawater of outer Yangtze Estuary. J. Oceanogr. Taiwan Strait 2010, 29, 518–524. [Google Scholar] [CrossRef]
  55. Hong, H.S.; Wu, J.Y.; Shang, S.L.; Hu, C.M. Absorption and fluorescence of chromophoric dissolved organic matter in the Pearl River Estuary, South China. Mar. Chem. 2005, 97, 78–89. [Google Scholar] [CrossRef]
  56. Rosa, A.; Véronique, R.; Christiane, L. Coloured dissolved organic matter (CDOM) in Southern North Sea waters: Optical characterization and possible origin. Estuar. Coast. Shelf Sci. 2009, 85, 633–640. [Google Scholar] [CrossRef]
  57. Rochelle-Newall, E.J.; Fisher, T.R. Chromophoric dissolved organic matter and dissolved organic carbon in Chesapeake Bay. Mar. Chem. 2002, 77, 23–41. [Google Scholar] [CrossRef]
  58. Sarah, A.G.; Neil, V.B. Optical Absorption and Fluorescence Properties of Chromophoric Dissolved Organic Matter in Natural Waters. Limnol. Oceanogr. 1994, 39, 1903–1916. [Google Scholar] [CrossRef]
  59. Hoge, F.E.; Vodacek, A.; Swift, R.N.; Yungel, J.K.; Blough, N.V. Inherent optical properties of the ocean: Retrieval of the absorption coefficient of chromophoric dissolved organic matter from airborne laser spectral fluorescence measurements. Appl. Opt. 1995, 34, 1394–1402. [Google Scholar] [CrossRef]
  60. Fichot, C.G.; Benner, R. The spectral slope coefficient of chromophoric dissolved organic matter (S275–295) as a tracer of terrigenous dissolved organic carbon in river-influenced ocean margins. Limnol. Oceanogr. 2012, 57, 1453–1466. [Google Scholar] [CrossRef] [Green Version]
  61. Matsuoka, A.; Bricaud, A.; Benner, R.; Para, J.; Sempéré, R.; Prieur, L.; Bélanger, S.; Babin, M. Tracing the transport of colored dissolved organic matter in water masses of the Southern Beaufort Sea: Relationship with hydrographic characteristics. Biogeosciences 2012, 9, 925–940. [Google Scholar] [CrossRef] [Green Version]
  62. Chen, H.; Zheng, B.H.; Song, Y.H.; Qin, Y.W. Correlation between molecular absorption spectral slope ratios and fluorescence humification indices in characterizing CDOM. Aquat. Sci. 2011, 73, 103–112. [Google Scholar] [CrossRef]
  63. Mannino, A.; Russ, M.E.; Hooker, S.B. Algorithm development and validation for satellite-derived distributions of DOC and CDOM in the U.S. Middle Atlantic Bight. J. Geophys. Res. Ocean. 2008, 113, 827–830. [Google Scholar] [CrossRef]
  64. Blough, N.; del Vecchio, R. Chromophoric DOM in the Coastal Environment. Biogeochem. Mar. Dissolved Org. Matter. 2002, 509–546. [Google Scholar] [CrossRef]
  65. Piotr, K.; Michael, J.D.; Heather, Y.; Amanda, E.K.; William, J.C.; Michael, G. Characterization of dissolved organic matter fluorescence in the South Atlantic Bight with use of PARAFAC model: Interannual variability. Mar. Chem. 2009, 113, 182–196. [Google Scholar] [CrossRef]
  66. Zhang, Y.L.; Qin, B.Q.; Yang, L.Y. Spatial distribution and absorption characteristics with relation to fluorescence of chromophoric dissolved organic matter (CDOM) in Meiliang Bay of Lake Taihu. Lake Sci. 2006, 18, 319–326. [Google Scholar] [CrossRef] [Green Version]
  67. Huang, W.; Zhou, L.; Zheng, X. Seasonal Variation of Colloidal Organic Carbon in Changjiang (Yangtze) River Estuary. Oceanol. Limnol. 2013, 44, 1194–1199. [Google Scholar] [CrossRef]
  68. Colin, A.S.; Stiig, M. Resolving the Variability in Dissolved Organic Matter Fluorescence in a Temperate Estuary and Its Catchment Using PARAFAC Analysis. Limnol. Oceanogr. 2005, 50, 686–697. [Google Scholar] [CrossRef]
  69. Stiig, M.; Warwick, F.V. Spectral Light Attenuation and the Absorption of UV and Blue Light in Natural Waters. Limnol. Oceanogr. 2000, 45, 642–650. [Google Scholar] [CrossRef]
  70. Youhei, Y.; Rudolf, J.; Nagamitsu, M.; Eiichiro, T. Assessing the Dynamics of Dissolved Organic Matter (DOM) in Coastal Environments by Excitation Emission Matrix Fluorescence and Parallel Factor Analysis (EEM-PARAFAC). Limnol. Oceanogr. 2008, 53, 1900–1908. [Google Scholar] [CrossRef]
  71. Paula, G.C.; Carlos, E.D.C.; Bernard, A. Distribution and optical properties of CDOM in the Arabian Sea during the 1995 Southwest Monsoon. Deep-Sea Res. Part II 1998, 45, 2195–2223. [Google Scholar] [CrossRef]
  72. Paula, G.C. Characterization of marine and terrestrial DOM in seawater using excitation-emission matrix spectroscopy. Mar. Chem. 1996, 51, 325–346. [Google Scholar] [CrossRef]
  73. Murphy, K.R.; Stedmon, C.A.; Waite, T.D.; Ruiz, G.M. Distinguishing between terrestrial and autochthonous organic matter sources in marine environments using fluorescence spectroscopy. Mar. Chem. 2008, 108, 40–58. [Google Scholar] [CrossRef]
  74. Guo, W.D.; Yang, L.Y.; Hong, H.S.; Colin, A.S.; Wang, F.L.; Xu, J.; Xie, Y.Y. Assessing the dynamics of chromophoric dissolved organic matter in a subtropical estuary using parallel factor analysis. Mar. Chem. 2011, 124, 125–133. [Google Scholar] [CrossRef]
  75. Jason, C.N.; Gregory, P.A. Dissolved Organic Carbon in Terrestrial Ecosystems: Synthesis and a Model. Ecosystems 2001, 4, 29–48. [Google Scholar] [CrossRef] [Green Version]
  76. Huang, Q.; Wu, J.; Jiang, Y.; Li, J. Variability of terrigenous dissolved organic matter as a response to coastal plume in Zhoushan area of the East China Sea. Acta Oceanol. Sin. 2011, 33, 66–73. [Google Scholar] [CrossRef]
  77. Piotr, K.; William, J.C.; Michael, J.D.; Amanda, E.K.; Michael, G.; Heather, Y. Characterization of dissolved organic matter fluorescence in the South Atlantic Bight with use of PARAFAC model: Relationships between fluorescence and its components, absorption coefficients and organic carbon concentrations. Mar. Chem. 2009, 118, 22–36. [Google Scholar] [CrossRef]
  78. Peter, J.H.; Ronald, B. Photochemical and microbial degradation of dissolved lignin phenols: Implications for the fate of terrigenous dissolved organic matter in marine environments. J. Geophys. Res. Ocean. 2003, 108, 351–378. [Google Scholar] [CrossRef]
  79. John, R.H.; Aron, S.; Jason, D.R.; Elizabeth, C.M.; David, J.K.; Kenneth, M. Absorption Spectral Slopes and Slope Ratios as Indicators of Molecular Weight, Source, and Photobleaching of Chromophoric Dissolved Organic Matter. Limnol. Oceanogr. 2008, 53, 955–969. [Google Scholar] [CrossRef] [Green Version]
  80. Yan, B.; Pan, D.L.; Cai, W.J.; He, X.Q.; Wang, D.F.; Bang, Y.T.; Zhu, Q.K. Remote sensing of salinity from satellite-derived CDOM in the Changjiang River dominated East China Sea. J. Geophys. Res. Ocean. 2013, 118, 227–243. [Google Scholar] [CrossRef]
  81. Yan, L.H.; Chen, X.J.; Su, R.G.; Han, X.R.; Zhang, C.S.; Shi, X.Y. Resolving Characteristic of CDOM by Excitation-Emission Matrix Spectroscopy Combined with Parallel Factor Analysis in the Seawater of Outer Yangtze Estuary in Autumn in 2010. Environ. Sci. 2013, 34, 51–60. [Google Scholar]
  82. Baker, A. Fluorescence Excitation-Emission Matrix Characterization of Some Sewage-Impacted Rivers. Environ. Sci. Technol. 2001, 35, 948–953. [Google Scholar] [CrossRef] [PubMed]
  83. Guo, W.D.; Huang, J.P.; Hong, H.S.; Xu, J.; Deng, X. Resolving excitation emission matrix spectroscopy of estuarine CDOM with parallel factor analysis and its application in organic pollution monitoring. Environ. Sci. 2010, 31, 1419–1427. [Google Scholar] [CrossRef]
  84. Hong, H.S.; Yang, L.Y.; Guo, W.D.; Wang, F.L.; Yu, X.X. Characterization of dissolved organic matter under contrasting hydrologic regimes in a subtropical watershed using PARAFAC model. Biogeochemistry 2012, 109, 163–174. [Google Scholar] [CrossRef] [Green Version]
  85. Wen, F.; Sun, X.X.; Zhang, S.; Luo, X.; Feng, Q.; Sun, S. Spatial and seasonal variations of chlorophyll-a and primary productivity in spring and summer in the Yellow Sea and East China Sea. Oceanol. Limnol. Sin. 2012, 43, 438–444. [Google Scholar]
  86. Zhang, X.Y.; Zhang, F.Y.; Gao, A.G.; Zhang, W.Y. Source tracing implication of Pt and Pd fractionation in the surface sediment of continental shelf around Changjiang Estuary. Earth Sci. J. China Univ. Geosci. 2009, 34, 604–612. [Google Scholar] [CrossRef]
  87. Lawrence, M.M.; Linda, L.S.; Theodore, C.L. Dissolved protein fluorescence in two Maine estuaries. Mar. Chem. 1999, 64, 171–179. [Google Scholar] [CrossRef]
  88. Vignudelli, S.; Santinelli, C.; Murru, E.; Nannicini, L.; Seritti, A. Distributions of dissolved organic carbon (DOC) and chromophoric dissolved organic matter (CDOM) in coastal waters of the northern Tyrrhenian Sea (Italy). Estuar. Coast. Shelf Sci. 2003, 60, 133–149. [Google Scholar] [CrossRef]
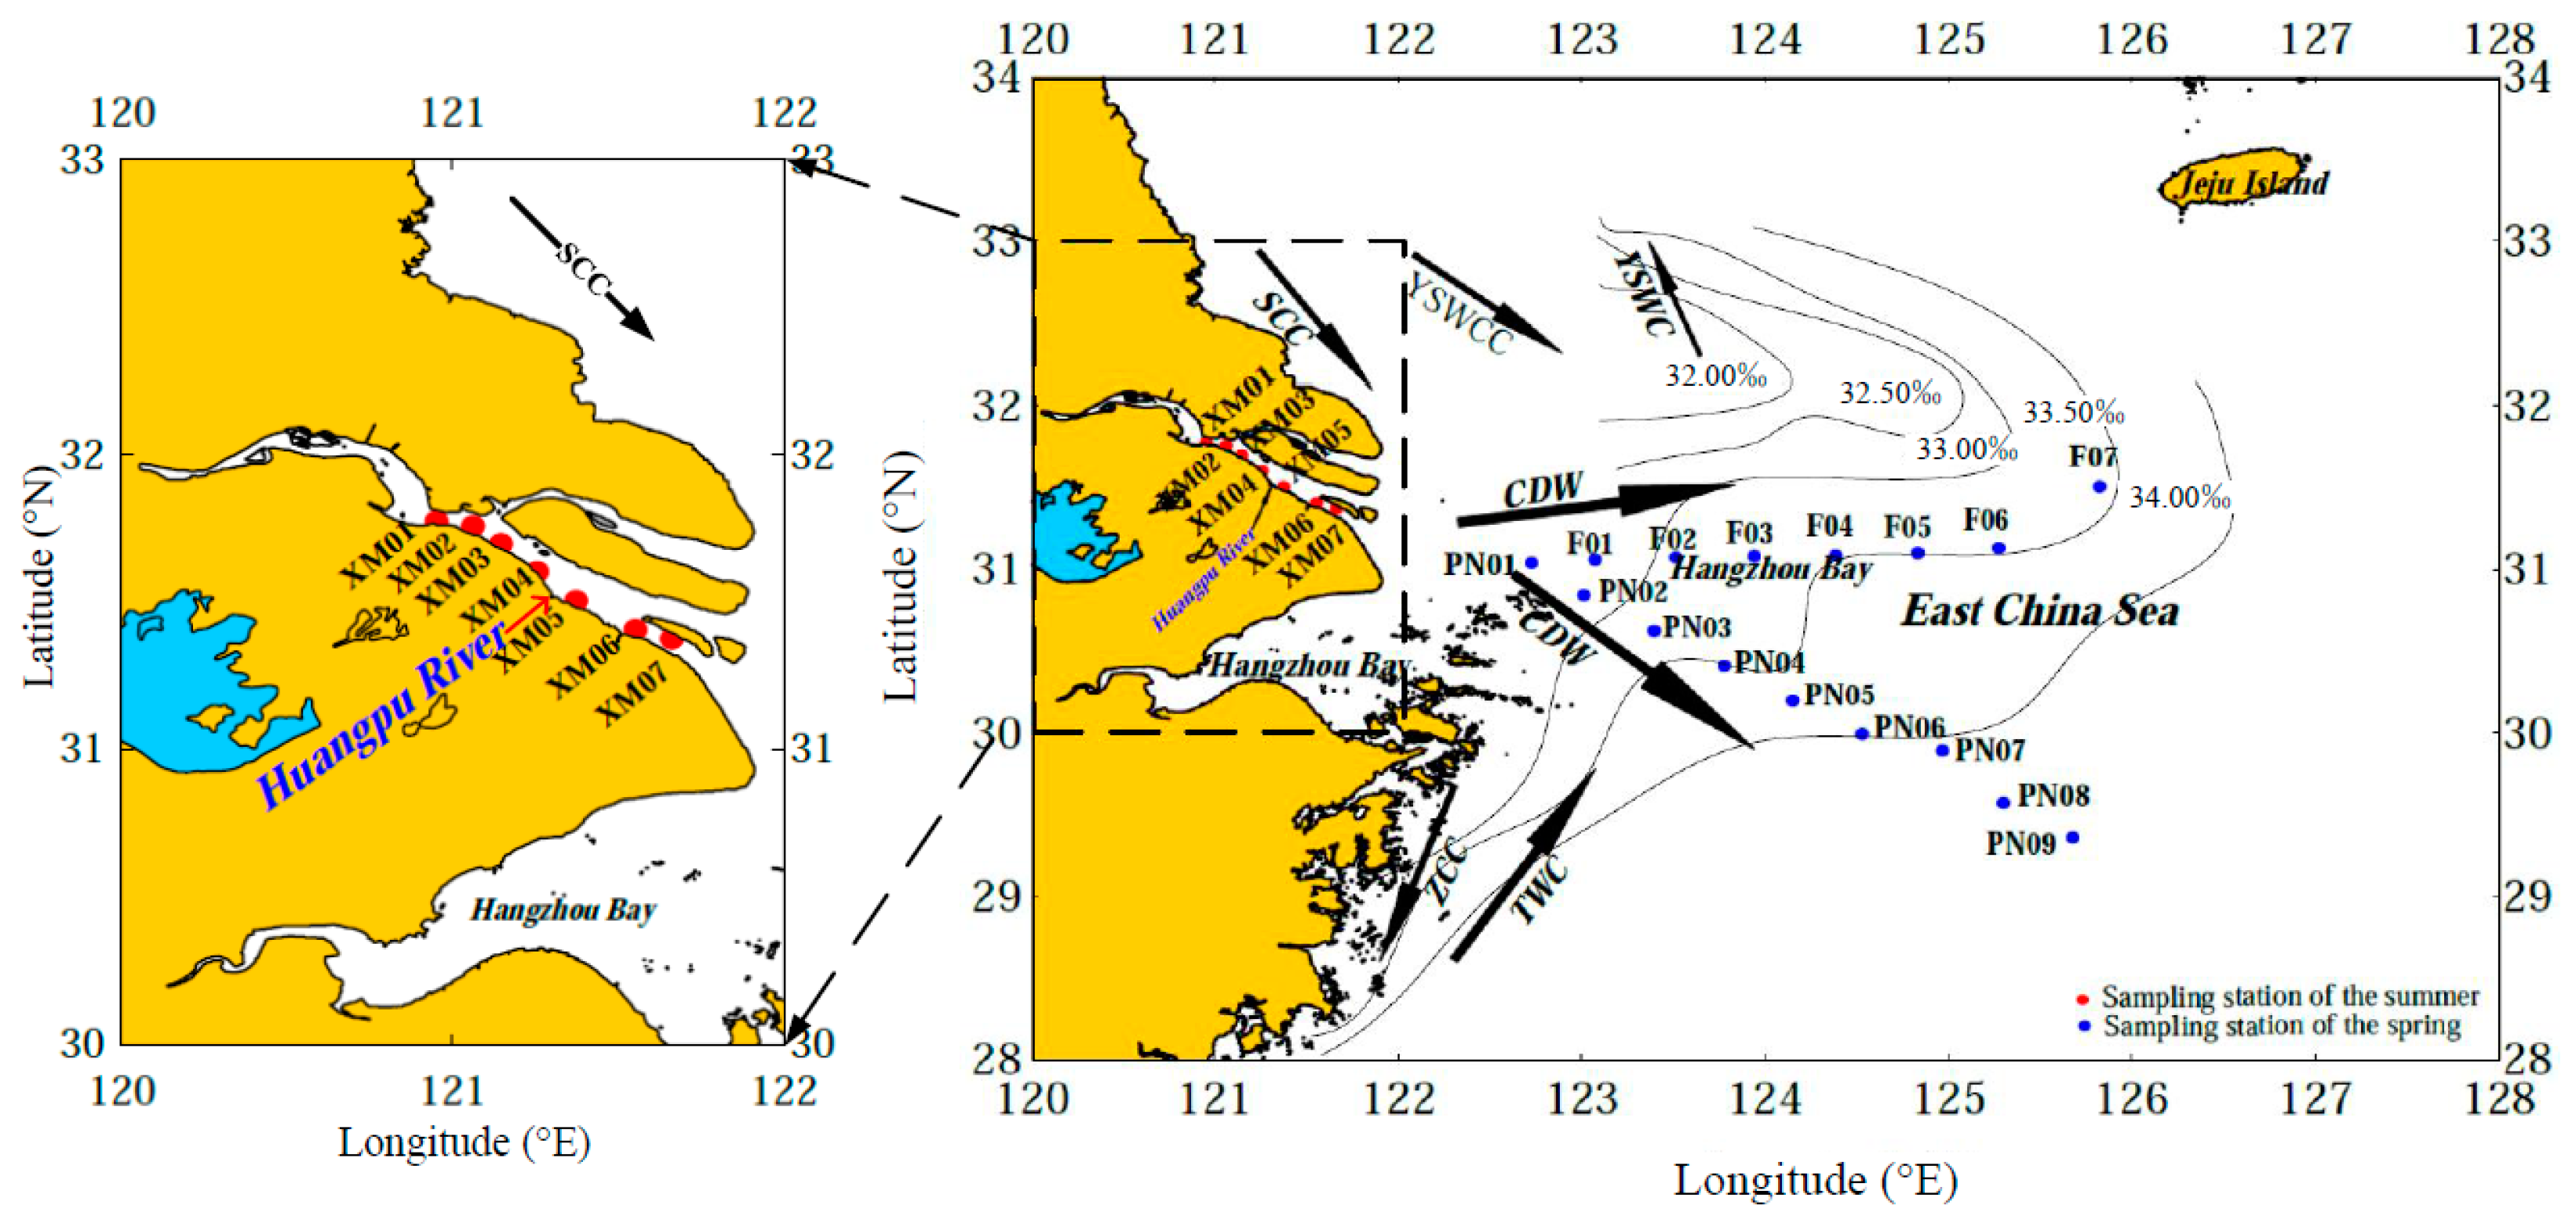
Figure 1. Diagram showing the hydrodynamic environment (in spring) and the sampling stations (modified from [18,19,20]). CDW: Changjiang diluted water; SCC: Subei coastal current; TWC: Taiwan warm current; YSWC: Yellow Sea warm current; YSWCC: Yellow Sea western coastal current; ZCC: Zhejiang coastal current. Section PN begins in the Zhoushan sea area and ends in the Ryukyu Islands, running across the continental shelf of the ECS with water depths ranging from ~100 m to >1000 m. Section PN represents the main axis of the CDW, and it vertically converges with the Kuroshio Current. Section F represents the northern boundary of the CDW, and it is the interface between the ECS and the Yellow Sea. Nine stations (PN01–PN09) with a regular spacing of 42.9 ± 3.3 km were sampled along section PN. Seven stations (F01–F07) with an average spacing of 46.1 ± 9.3 km were sampled along section F. In addition, section XM represents the riverine end member. Seven stations were evenly distributed (with an average spacing of 13.8 ± 3.5 km) along the southern branch of the Changjiang River, which has an oligohaline environment.
Sensors 21 08450 g001
Figure 2. Relationship between the dissolved organic carbon (DOC) and salinity. Distinct positive correlations were observed for the inclusive dataset and the datasets of the respective three sections, even though there was no medium salinity dataset.
Sensors 21 08450 g002
Figure 3. Absorption spectral curves for the chromophoric dissolved organic matter (CDOM) in all three sections. There are distinct differences between the slopes of the dataset for section XM and those of sections PN and F.
Sensors 21 08450 g003
Figure 4. Relationship between salinity and a ( 355 ) . Strong correlations for the datasets of sections PN and F and for the entire dataset.
Sensors 21 08450 g004
Figure 5. The distributions of the S g values obtained in this study. S g increases with increasing salinity, which is opposite to the correlation between a ( 355 ) and salinity (Figure 4).
Sensors 21 08450 g005
Figure 6. Relationship between salinity and Fs(355) for the datasets of sections PN and F and for the entire dataset.
Sensors 21 08450 g006
Figure 7. Relationship between Fs(355) and a ( 355 ) . (a) Entire dataset for all three sections; (b): dataset for sections PN and F. Strong positive correlations between Fs(355) and a ( 355 ) were found in sections PN and F.
Sensors 21 08450 g007
Figure 8. Excitation–emission matrix fluorescence spectroscopy (EEMS) contour plots and loadings of each component determined using parallel factor analysis (PARAFAC). Three fluorescence components, including the humic-like component (Comp1), the protein-like component (Comp2), and the protein-like component (Comp3), were extracted using PARAFAC.
Sensors 21 08450 g008
Figure 9. Variations in the fluorescence intensities of C1, C2, and C3 at the different stations. In general, the fluorescence intensities of all of the CDOM components decreased from the inner estuary to the offshore area.
Sensors 21 08450 g009
Figure 10. The correlations between the a ( 355 ) and dissolved organic carbon (DOC) in the three sections sampled in this study. The datasets from previous studies [7,48,76] are distributed evenly along the regression line for this study.
Sensors 21 08450 g010
Figure 11. The correlations between the Fs(355) and dissolved organic carbon (DOC) in the three sections sampled in this study. The dataset from a previous study [7] is distributed evenly along the regression line for this study.
Sensors 21 08450 g011
Figure 12. Correlations between the dissolved organic carbon (DOC) and the chromophoric dissolved organic matter (CDOM) fluorescence intensities of the components: (a) C1 versus DOC; (b) C2 versus DOC; and (c) C3 versus DOC. The correlations between the DOC and the fluorescence intensities of the three fluorophores in the three different sections differ.
Sensors 21 08450 g012aSensors 21 08450 g012b
Figure 13. a ( 355 ) (m−1), S g (nm−1), salinity (‰), and the fluorescence intensity of the fluorophores (QSU) along the three sections. (a1,a2) section XM; (b1,b2) section PN; and (c1,c2) section F.
Sensors 21 08450 g013aSensors 21 08450 g013b
Table 1. Comparison of the a ( 355 ) and S g values of the chromophoric dissolved organic matter (CDOM) from several estuaries around the world.
Research Areas a ( 355 )   ( m 1 ) S g   ( nm 1 ) Salinity (‰)References
Changjiang Estuary (summer)0.1–3.20.017–0.020 (300–650 nm)0–32.0[52]
Changjiang Estuary (spring)1.152–8.7150.0034–0.014 (380–800 nm)/[53]
Changjiang Estuary (summer)0.20–0.73/0.2–25.3[54]
Changjiang Estuary (summer)0.20–0.77/0.3–29.5
Changjiang Estuary (spring)0.10–2.820.017–0.020 (300–500 nm)0.12–29.4[3]
Changjiang Estuary (winter)0.11–1.200.008–0.018 (275–295 nm)18.7–34.9[8]
Changjiang Estuary (summer)0.23–1.910.012–0.025 (275–295 nm)4.0–33.6
Pearl River Estuary (November)0.24–1.930.0138–0.018 (300–500 nm)0–32.49[55]
Pearl River Estuary (June)0.34–1.40/0–34.96[47]
South of the North Sea (February)Scheldt Estuary0.97–4.30
a ( 375 )
0.0167–0.019 (350–500 nm)0.7–29.6[56]
Belgium coastal sea0.20–1.31
a ( 375 )
0.0110–0.020 (350–500 nm)29.8–33.6
Chesapeake BayRiver end member2.2–4.10.0163–0.019 (280–650 nm)0–35.0[57]
coast0.4–1.10.0178–0.022 (280–650 nm)
Mississippi Estuary
(summer)
1.2–4.2//[49]
Amazon Estuary (winter)0.14–3.12//[58]
Georgia coast0.06–1.20//[59]
Northern Gulf of Mexico3.96–17.52
a ( 350 )
/0–37.0[60]
Southern Beaufort Sea0.018–1.08
a ( 440 )
0.015–0.023 (350–500 nm)0–35.0[61]
Section XM (August 2011)2.476–3.7420.0176–0.0180.18–0.20This study
Section PN (March 2011)0.046–0.2070.0143–0.02331.31–34.5
Section F (March 2011)0.115–0.2530.025–0.031830.72–33.9
Note: a ( 355 ) and a ( 375 ) represent the CDOM absorption coefficients at 355 nm and 375 nm, respectively.
Table 2. Characteristics of the chromophoric dissolved organic matter (CDOM) components determined using the parallel factor analysis (PARAFAC) model in this study and comparison with the results of previous studies.
Ex/Em (nm)Coble [71,72] (Ex/Em (nm))References (Ex/Em (nm))
C1240/456peak A: 230–260/380–460;
humic-like component
C3: 270 (360)/478 [69]
C4: 250 (360)/440 [67]
C8: 250 (380)/416 [72]
C1: 270 (365)/453 [40]
C1: ≤250 (335)/428 [73]
C2280/328peak T: 270–280/320–350;
protein-like component
C5: 280(240)/368 [69]
C7: 280/344 [67]
C7: 240 (300)/338 [72]
C4: 280/318 [68]
C6: 250(290)/356 [74]
C4: 275/328 [73]
C3230/366combination of peak N (280/370) and peak T (270–280/320–350);
protein-like component
C5:280(<240)/368 [69]
C4: 250 (320)/370 [72]
C5: 285/362 [68]
C2: ≤250(300)/368 [73]
Publisher’s Note: MDPI stays neutral with regard to jurisdictional claims in published maps and institutional affiliations.