
A New Method to Perform Direct Efficiency Measurement and Power Flow Analysis in Vibration Energy Harvesters

 , , , , , and
Abstract
:1. Introduction
Efficiency
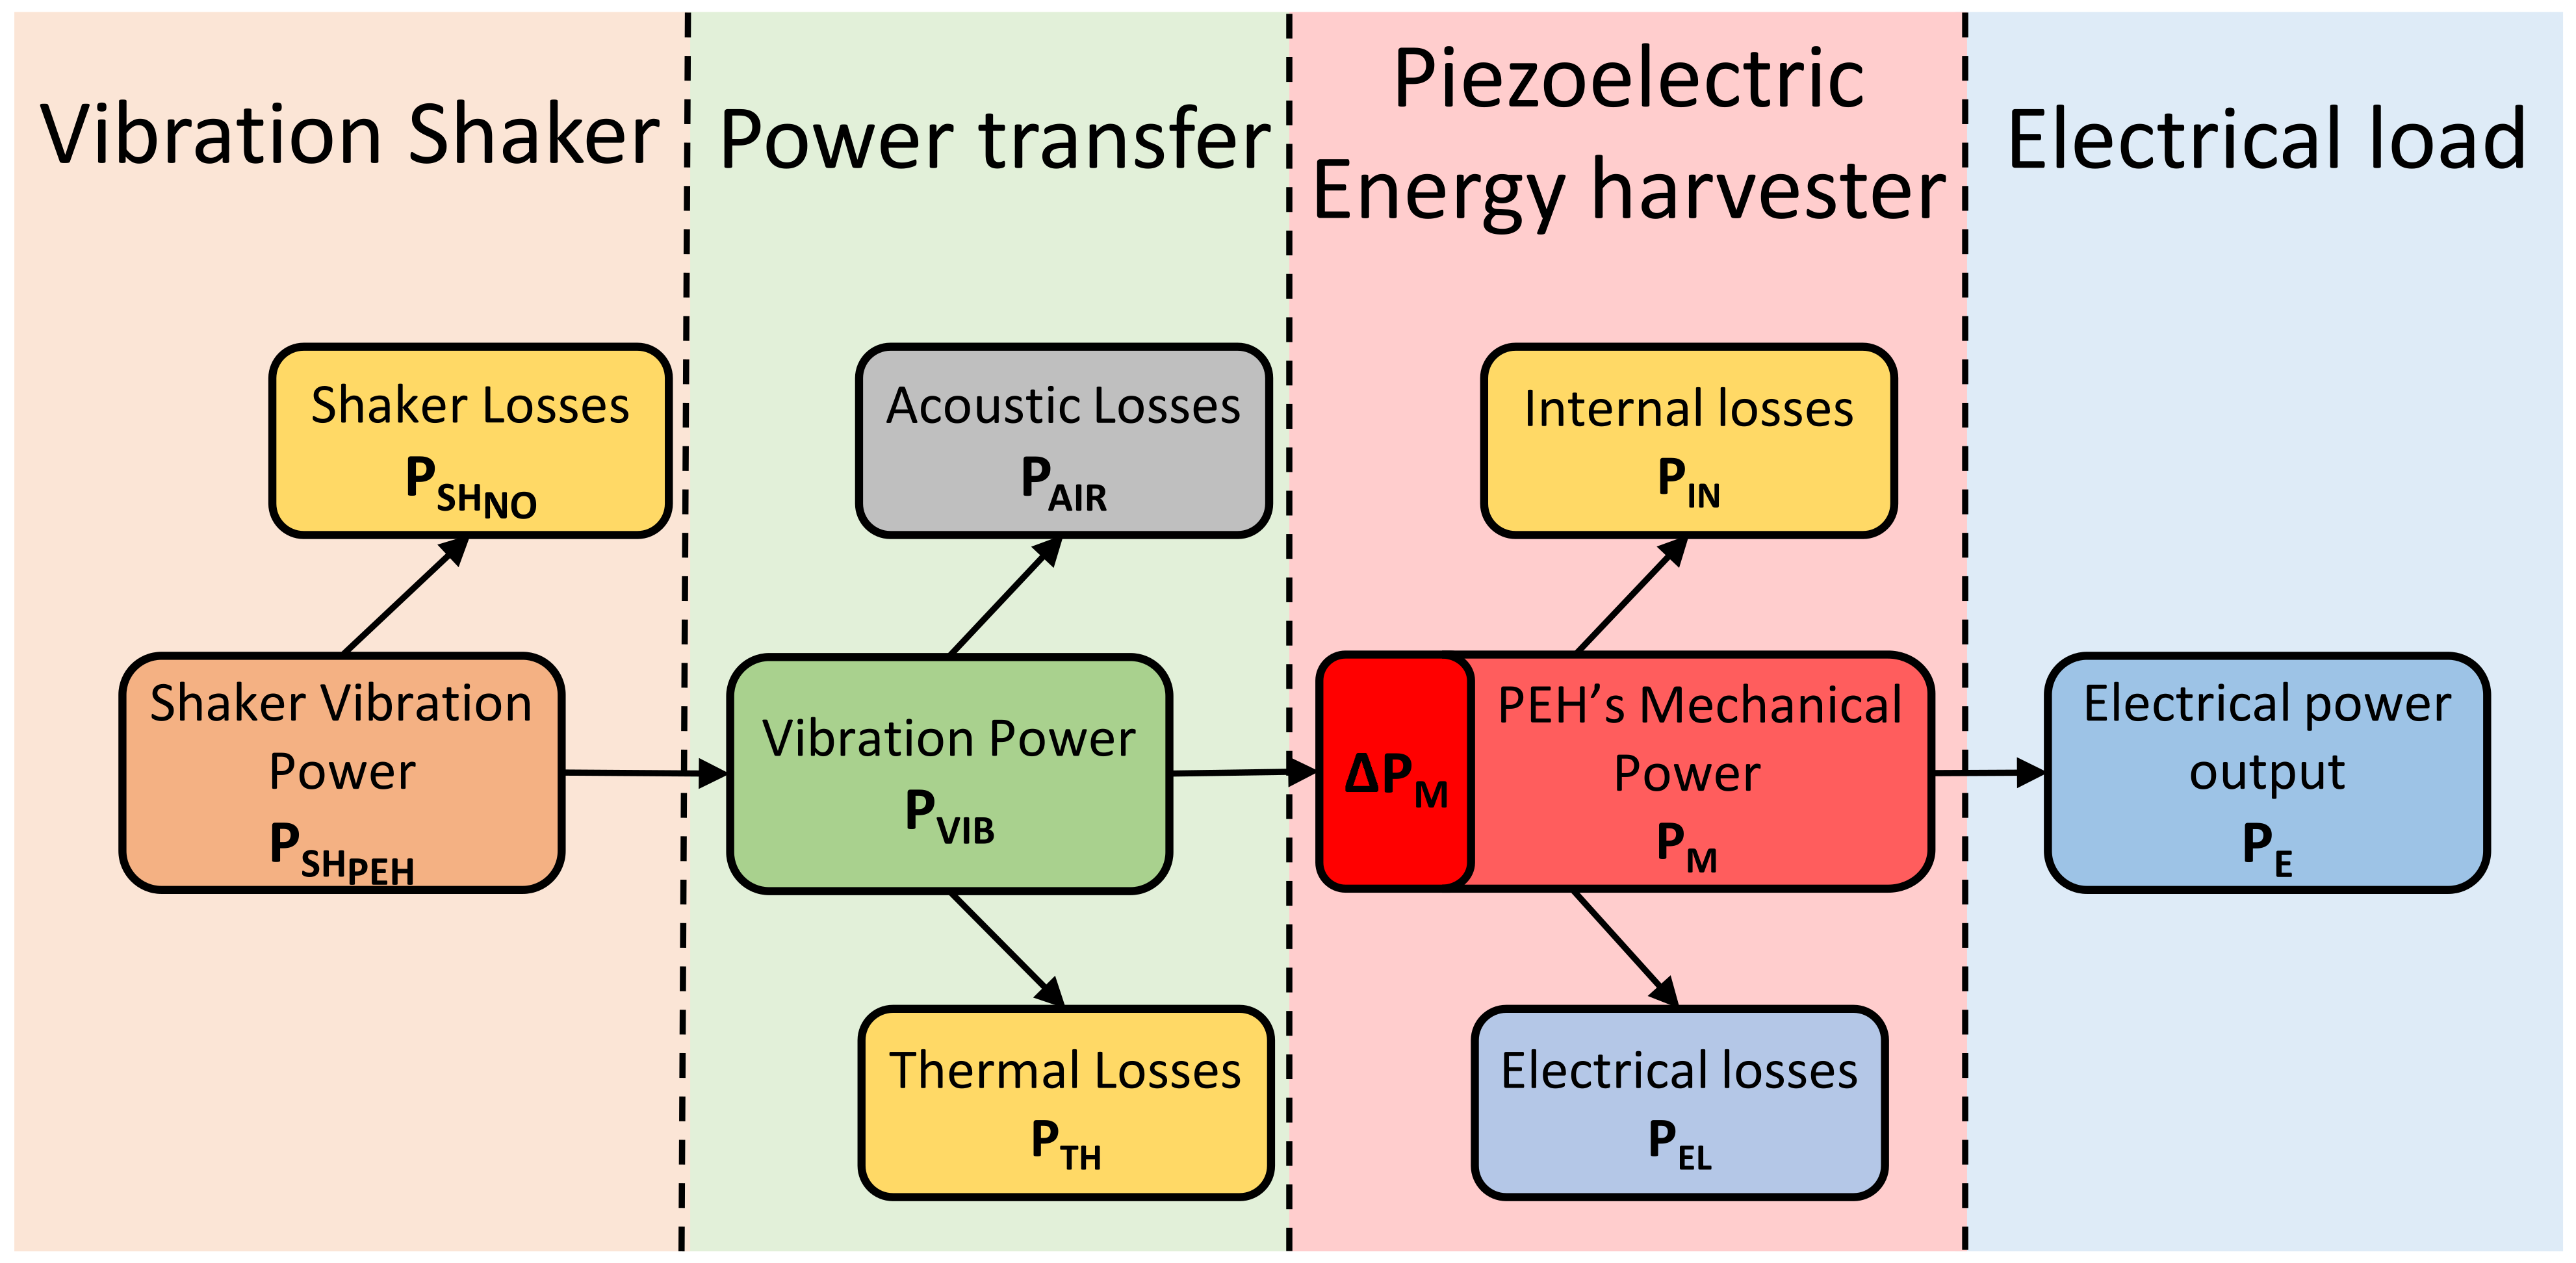
2. Methods
2.1. Shaker Vibration Power
2.2. Vibration Power
2.3. Acoustic Losses
2.4. Thermal Losses
2.5. PEH Mechanical Power
2.6. Electrical Power Output
2.7. Electrical Losses
2.8. Internal Losses
2.9. Efficiency Calculation
2.10. Efficiency Measurement
2.11. Mode Measurement System
2.12. Efficiency Measurement System
2.13. Comparison with the Methodology Currently in Use
3. Results and Discussion
3.1. Uncertainties of the Measurement System
3.2. Uncertainty in Simplified Efficiencies
3.3. Efficiency of the PZT Ceramic Based Harvester
3.4. Efficiency of the PVDF Foil Based Harvester
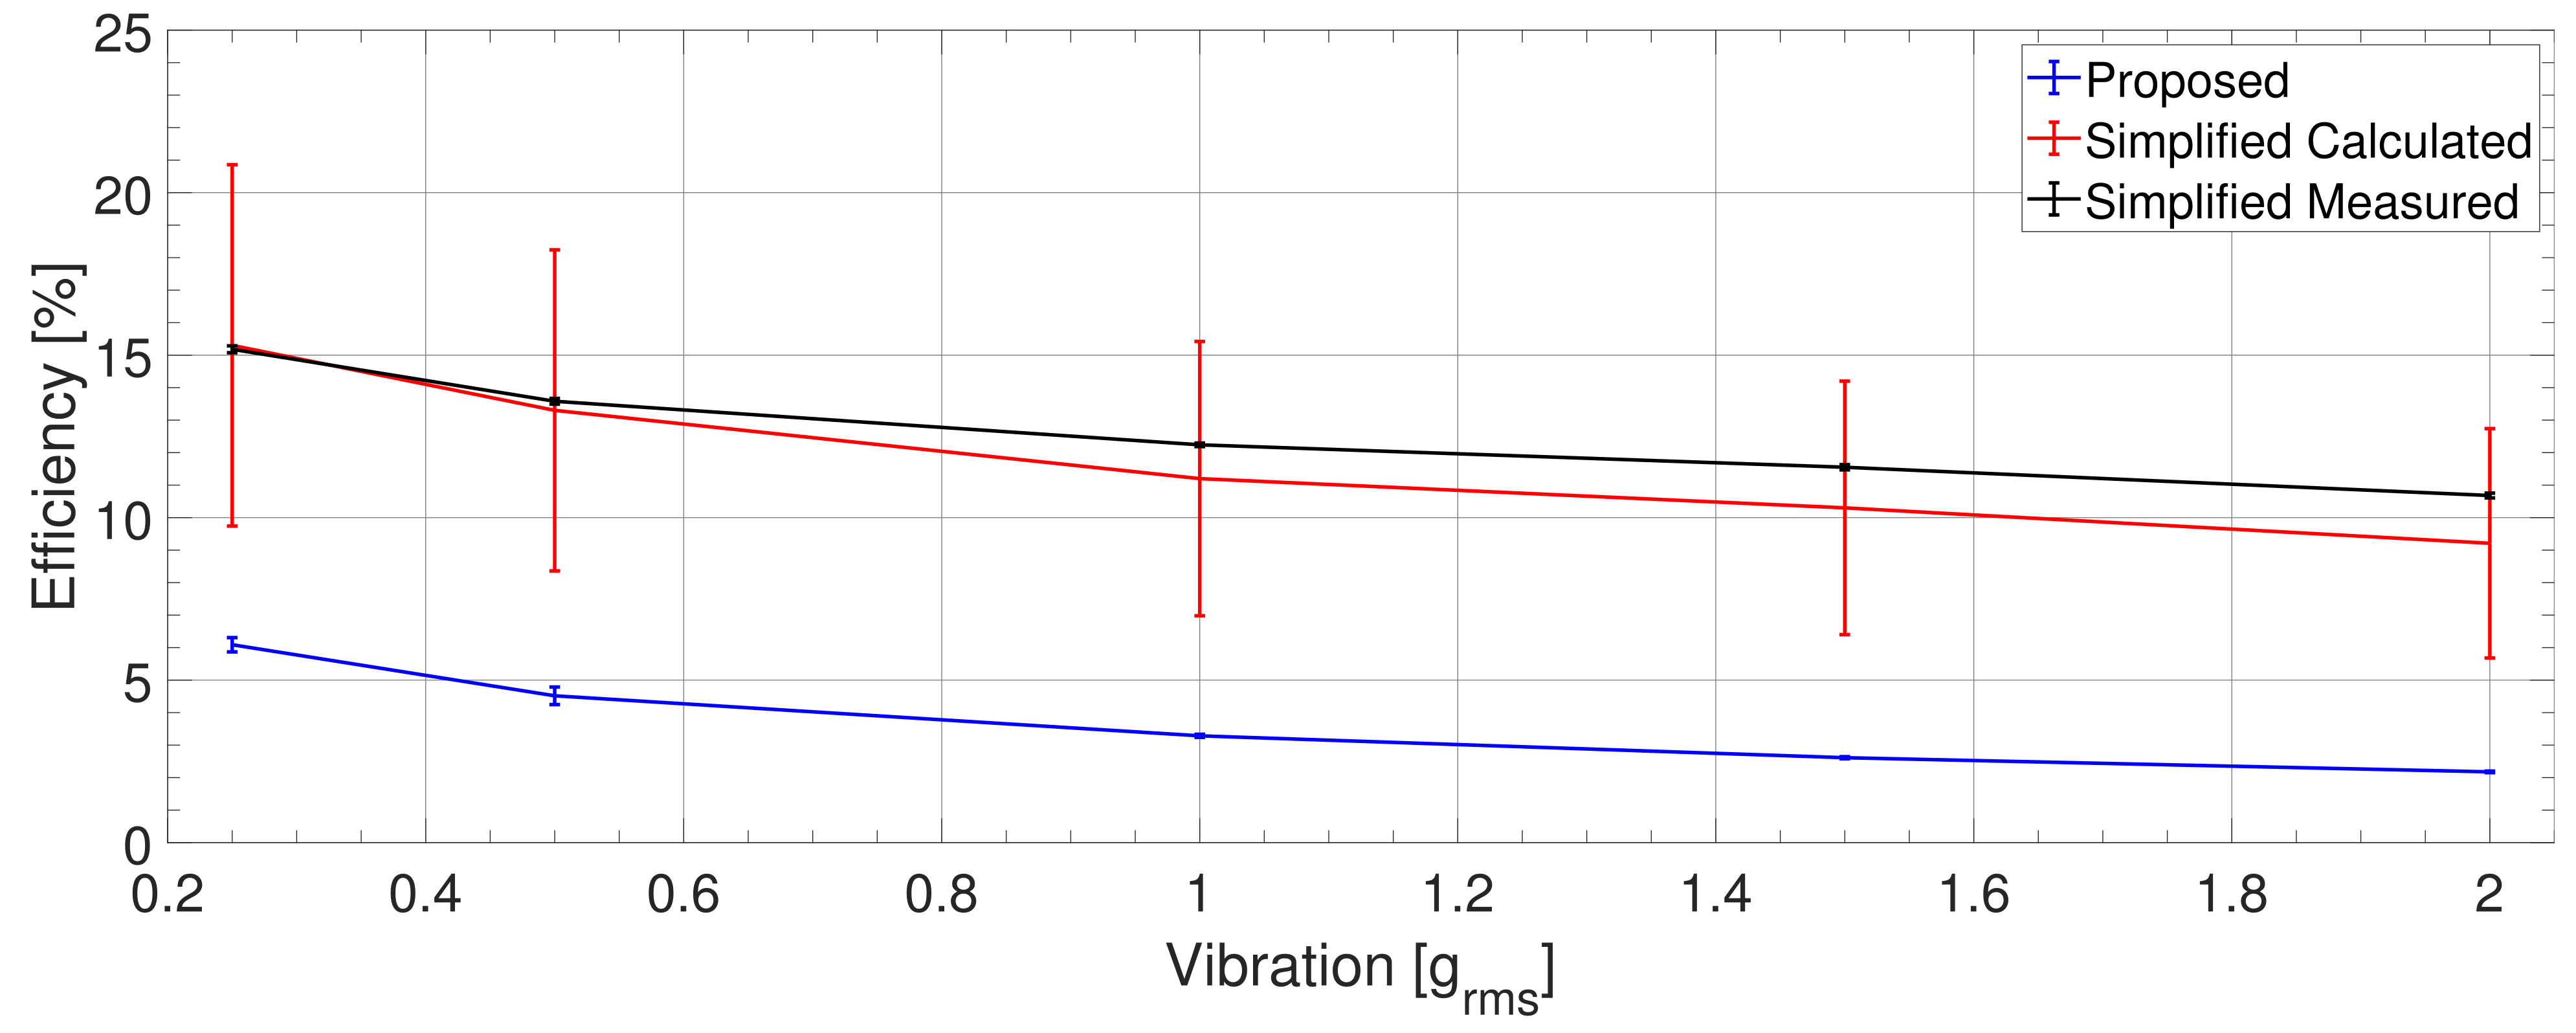
3.5. Comparing the Efficiencies
3.6. Power Flow
4. Conclusions
Author Contributions
Funding
Institutional Review Board Statement
Informed Consent Statement
Data Availability Statement
Acknowledgments
Conflicts of Interest
Abbreviations
| PEH | Piezoelectric Energy Harvester |
| PZT | Lead Zirconate Titanate |
| PVDF | Polyvinylidene Fluoride |
| System Coupling Coefficient | |
| Q | Quality Factor |
| Open Circuit Natural Frequency | |
| Short Circuit Natural Frequency | |
| Shaker Vibration Power | |
| Shaker Vibration Power with Mounted PEH | |
| Shaker Vibration Power without PEH | |
| Vibration Power | |
| Acoustic Losses | |
| Thermal Losses | |
| PEH Mechanical Power | |
| Internal Losses | |
| Electrical Losses | |
| Electrical Power Output | |
| F | Vibration Force |
| v | Vibration Velocity |
| Shaker Bl Coefficient | |
| a | Vibration Amplitude |
| f | Frequency of Vibration |
| Percent as Absolute Quantity (used for the efficiency value and its absolute error) | |
| Percent as Relative Quantity (used for the relative error) |
References
- Beeby, S.P.; White, N.M. Energy Harvesting for Autonomous Systems; Artech House: Norwood, MA, USA, 2010. [Google Scholar]
- Teso-Fz-Betoño, D.; Aramendia, I.; Martinez-Rico, J.; Fernandez-Gamiz, U.; Zulueta, E. Piezoelectric Energy Harvesting Controlled with an IGBT H-Bridge and Bidirectional Buck–Boost for Low-Cost 4G Devices. Sensors 2020, 20, 7039. [Google Scholar] [CrossRef]
- Fitzgerald, P.C.; Malekjafarian, A.; Bhowmik, B.; Prendergast, L.J.; Cahill, P.; Kim, C.W.; Hazra, B.; Pakrashi, V.; OBrien, E.J. Scour Damage Detection and Structural Health Monitoring of a Laboratory-Scaled Bridge Using a Vibration Energy Harvesting Device. Sensors 2019, 19, 2572. [Google Scholar] [CrossRef] [Green Version]
- Beeby, S.P.; Torah, R.; Tudor, M.; Glynne-Jones, P.; O’donnell, T.; Saha, C.; Roy, S. A micro electromagnetic generator for vibration energy harvesting. J. Micromechanics Microengineering 2007, 17, 1257. [Google Scholar] [CrossRef]
- Hadas, Z.; Smilek, J.; Kanoun, O. (Eds.) Energy Harvesting for Wireless Sensor Networks: Technology, Components and System Design; Walter de Gruyter GmbH & Co KG: Berlin, Germany, 2018; pp. 45–63. [Google Scholar]
- Yang, Z.; Erturk, A.; Zu, J. On the efficiency of piezoelectric energy harvesters. Extrem. Mech. Lett. 2017, 15, 26–37. [Google Scholar] [CrossRef]
- Richards, C.D.; Anderson, M.J.; Bahr, D.F.; Richards, R.F. Efficiency of energy conversion for devices containing a piezoelectric component. J. Micromech. Microeng. 2004, 14, 717. [Google Scholar] [CrossRef]
- Kim, M.; Dugundji, J.; Wardle, B.L. Efficiency of piezoelectric mechanical vibration energy harvesting. Smart Mater. Struct. 2015, 24, 055006. [Google Scholar] [CrossRef]
- Shu, Y.; Lien, I. Analysis of power output for piezoelectric energy harvesting systems. Smart Mater. Struct. 2006, 15, 1499. [Google Scholar] [CrossRef]
- Akaydin, H.D.; Elvin, N.; Andreopoulos, Y. The performance of a self-excited fluidic energy harvester. Smart Mater. Struct. 2012, 21, 025007. [Google Scholar] [CrossRef]
- Janphuang, P.; Lockhart, R.; Henein, S.; Briand, D.; de Rooij, N.F. On the experimental determination of the efficiency of piezoelectric impact-type energy harvesters using a rotational flywheel. J. Phys. Conf. Ser. 2013, 476, 012137. [Google Scholar] [CrossRef] [Green Version]
- Cho, J.; Richards, R.; Bahr, D.; Richards, C.; Anderson, M. Efficiency of energy conversion by piezoelectrics. Appl. Phys. Lett. 2006, 89, 104107. [Google Scholar] [CrossRef]
- EN:50324-2. Piezoelectric Properties of Ceramic Materials and Components Methods of Measurement—Low Power, 3rd ed.; CENELEC: Brussels, Belgium, 2002. [Google Scholar]
- IEC Standard. Guide to Dynamic Measurements of Piezoelectric Ceramics with High Electromechanical Coupling; IEC: Geneva, Switzerland, 1976. [Google Scholar]
- Renno, J.M.; Daqaq, M.F.; Inman, D.J. On the optimal energy harvesting from a vibration source. J. Sound Vib. 2009, 320, 386–405. [Google Scholar] [CrossRef]
- Erturk, A.; Inman, D.J. Piezoelectric Energy Harvesting; John Wiley & Sons: Hoboken, NJ, USA, 2011. [Google Scholar]
- Ruan, J.J.; Lockhart, R.A.; Janphuang, P.; Quintero, A.V.; Briand, D.; de Rooij, N. An automatic test bench for complete characterization of vibration-energy harvesters. IEEE Trans. Instrum. Meas. 2013, 62, 2966–2973. [Google Scholar] [CrossRef]
- Wang, X. A study of harvested power and energy harvesting efficiency using frequency response analyses of power variables. Mech. Syst. Signal Process. 2019, 133, 106277. [Google Scholar] [CrossRef]
- Shafer, M.W.; Garcia, E. The Power and Efficiency Limits of Piezoelectric Energy Harvesting. J. Vib. Acoust. 2014, 136. [Google Scholar] [CrossRef]
- Liao, Y.; Sodano, H.A. Structural Effects and Energy Conversion Efficiency of Power Harvesting. J. Intell. Mater. Syst. Struct. 2009, 20, 505–514. [Google Scholar] [CrossRef]
- Hadas, Z.; Vetiska, V.; Vetiska, J.; Krejsa, J. Analysis and efficiency measurement of electromagnetic vibration energy harvesting system. Microsyst. Technol. 2016, 22, 1767–1779. [Google Scholar] [CrossRef]
- Beranek, L. Acoustics; Electrical and Electronic Engineering, American Institute of Physics: College Park, MD, USA, 1986. [Google Scholar]
- Kunz, J.; Fialka, J.; Benes, P.; Havranek, Z. An Automated measurement system for measuring an overall power efficiency and a characterisation of piezo harvesters. J. Phys. Conf. Ser. 2018, 1065, 202008. [Google Scholar] [CrossRef]
- Gade, S.; Herlufsen, H. Use of Weighting Functions in DFT/FFT Analysis (Part I); Brüel & Kjær Technical Review; Brüel & Kjær: Nærum, Denmark, 1987; pp. 1–28. [Google Scholar]
- Quattrocchi, A.; Freni, F.; Montanini, R. Power Conversion Efficiency of Cantilever-Type Vibration Energy Harvesters Based on Piezoceramic Films. IEEE Trans. Instrum. Meas. 2021, 70, 1–9. [Google Scholar] [CrossRef]
- Roundy, S.; Leland, E.S.; Baker, J.; Carleton, E.; Reilly, E.; Lai, E.; Otis, B.; Rabaey, J.M.; Wright, P.K.; Sundararajan, V. Improving power output for vibration-based energy scavengers. IEEE Pervasive Comput. 2005, 4, 28–36. [Google Scholar] [CrossRef]
- Alameh, A.; Gratuze, M.; Elsayed, M.; Nabki, F. Effects of Proof Mass Geometry on Piezoelectric Vibration Energy Harvesters. Sensors 2018, 18, 1584. [Google Scholar] [CrossRef] [Green Version]
- Peralta, P.; Ruiz, R.; Natarajan, S.; Atroshchenko, E. Parametric study and shape optimization of Piezoelectric Energy Harvesters by isogeometric analysis and kriging metamodeling. J. Sound Vib. 2020, 484, 115521. [Google Scholar] [CrossRef]


| Power Type | MIDE PPA-1011 | TE LDTM-028K | |||
|---|---|---|---|---|---|
| [mW] | [%] | [μW] | [%] | ||
| Vibration power | 43.04 | 100 | 3745 | 100 | |
| → Acoustic losses | 16.56 | 38.5 | 1770 | 47.3 | |
| → Thermal losses | 14.93 | 34.7 | 1963 | 52.4 | |
| → PEH mechanical power | 11.55 | 26.8 | 11.94 | 0.318 | |
| → Internal losses | 8.72 | 20.2 | 11.55 | 0.308 | |
| → Electrical losses | 1.41 | 3.3 | 0.197 | 0.005 | |
| → Electrical power output | 1.41 | 3.3 | 0.197 | 0.005 | |
Publisher’s Note: MDPI stays neutral with regard to jurisdictional claims in published maps and institutional affiliations. |
© 2021 by the authors. Licensee MDPI, Basel, Switzerland. This article is an open access article distributed under the terms and conditions of the Creative Commons Attribution (CC BY) license (https://creativecommons.org/licenses/by/4.0/).
Share and Cite
Kunz, J.; Fialka, J.; Pikula, S.; Benes, P.; Krejci, J.; Klusacek, S.; Havranek, Z. A New Method to Perform Direct Efficiency Measurement and Power Flow Analysis in Vibration Energy Harvesters. Sensors 2021, 21, 2388. https://doi.org/10.3390/s21072388
Kunz J, Fialka J, Pikula S, Benes P, Krejci J, Klusacek S, Havranek Z. A New Method to Perform Direct Efficiency Measurement and Power Flow Analysis in Vibration Energy Harvesters. Sensors. 2021; 21(7):2388. https://doi.org/10.3390/s21072388
Chicago/Turabian StyleKunz, Jan, Jiri Fialka, Stanislav Pikula, Petr Benes, Jakub Krejci, Stanislav Klusacek, and Zdenek Havranek. 2021. "A New Method to Perform Direct Efficiency Measurement and Power Flow Analysis in Vibration Energy Harvesters" Sensors 21, no. 7: 2388. https://doi.org/10.3390/s21072388