In this chapter, the methods and metrics used in evaluating the proposed discovery and tracking algorithms performance and the experiment setup are presented and detailed.
3.1. Methods and Metrics
The proposed experiment to evaluate the discovery and tracking algorithms is divided into two sequential phases: the recording phase and the processing or evaluation phase.
In the first phase, a transmitting source moving at constant speeds is recorded. A constant velocity is preferred to evaluate the system over time. Highlight that during recording, the system is transmitting pseudo-random data using PRNG (pseudorandom number generator) algorithms. This allows the performance of the detection algorithms to be evaluated independently of the transmitted data. In addition, the experiment is recorded within indoor laboratory conditions.
In the second phase, both the discovery and tracking algorithm are evaluated separately. The metrics discussed at the end of the chapter are computed to evaluate the performance of the discovery and tracking algorithms. Highlight that the tracking algorithm’s analysis relies on the results obtained during the discovery algorithm’s evaluation.
For both discovery and tracking, three types of movements are analyzed: lateral, diagonal, and frontal. In lateral movement, the transmitter moves in the perpendicular plane concerning the camera, with 0° of inclination. In the diagonal movement, the transmitter also moves in the perpendicular plane, but with 45° of inclination. Finally, in the frontal movement, the transmitter moves in the central axis normal to the camera. The transmitter moves away from and towards the camera.
Regarding the metrics used for evaluating the performance of discovery algorithm, the following are contemplated: average execution time and recall. The latter parameter measures the system’s ability not to discard legitimate sources in the image. The definition of recall is given in Equation (
2).
where
cases are those where the receiver detects a legitimate source in the image correctly, and
are those cases in which the system misses a legitimate source.
A preliminary analysis of the proposal generation algorithms reveals that the Selective Search has a computation time of 10 greater than the edge boxes ( ), for the same image. However, both algorithms have approximately the same recall (87%). Therefore, the edge boxes algorithm is preferred for the implementation of the detection system. On the other hand, for the proposals classification, an algorithm is chosen that detects and lists the contours within the evaluation region using binarization and edge detection.
Regarding the tracking evaluation, preliminary metrics are considered: average execution time and scalability. The last parameter refers to the system’s ability to track sources that move closer and further away from the camera, increasing and decreasing the area of their projection on the image. Some current tracking mechanisms do not support that the object increases or decreases its size in the image. Therefore, they have to be discarded for the implementation of this system. In addition, this preliminary evaluation allows one to discard those algorithms that are less efficient.
After the preliminary evaluation of the tracking algorithms, the deterioration of the tracking ROI is analyzed. For this purpose, an initial ROI, obtained by the discovery algorithm, is selected, and the edges are slightly expanded (delta pixel basis). This ROI is delivered to the tracking algorithm as selected ROI. The ROIs that the tracking algorithm returns for a number n of consecutive frames are then stored. These ROIs are then compared against the ROIs that the discovery algorithm would deliver if used instead of the tracker algorithm.
Under perfect conditions, the selected ROI and the tracking ROI should coincide to a large extent. It should stay centered and maintain its relative size of delta pixels on all edges. However, as was aforementioned, deterioration is accentuated over time. To evaluate this deterioration, the difference in distance between the edges of both ROIs it analyzed. These distances are identified as K parameters shown in
Figure 6, which coincide with the upper, lower, left, and right separation (in pixels) of each ROI. These parameters are summarized in Equation (
3).
The combined analysis of these parameters allows one to evaluate the centrality and scale deviation over time, using the mean and standard deviation of the overall K parameters.
The mean of K parameters indicates the scaling relationship between the tracking ROI and the selected ROI. In the case where the mean is zero, it indicates that the ROIs are equal in area. Otherwise, one ROI has a larger area than the other. In the case study, it is desired that the increase in area is constant over time and equal to the delta parameter. On the other hand, if the value is negative, part of the transmitter falls outside the tracking ROI. In this case, the transmitting source is considered to be lost.
The standard deviation of K parameters indicates the centrality. For values close to zero, centrality is preserved. Otherwise, it is shifted to any of the possible sides.
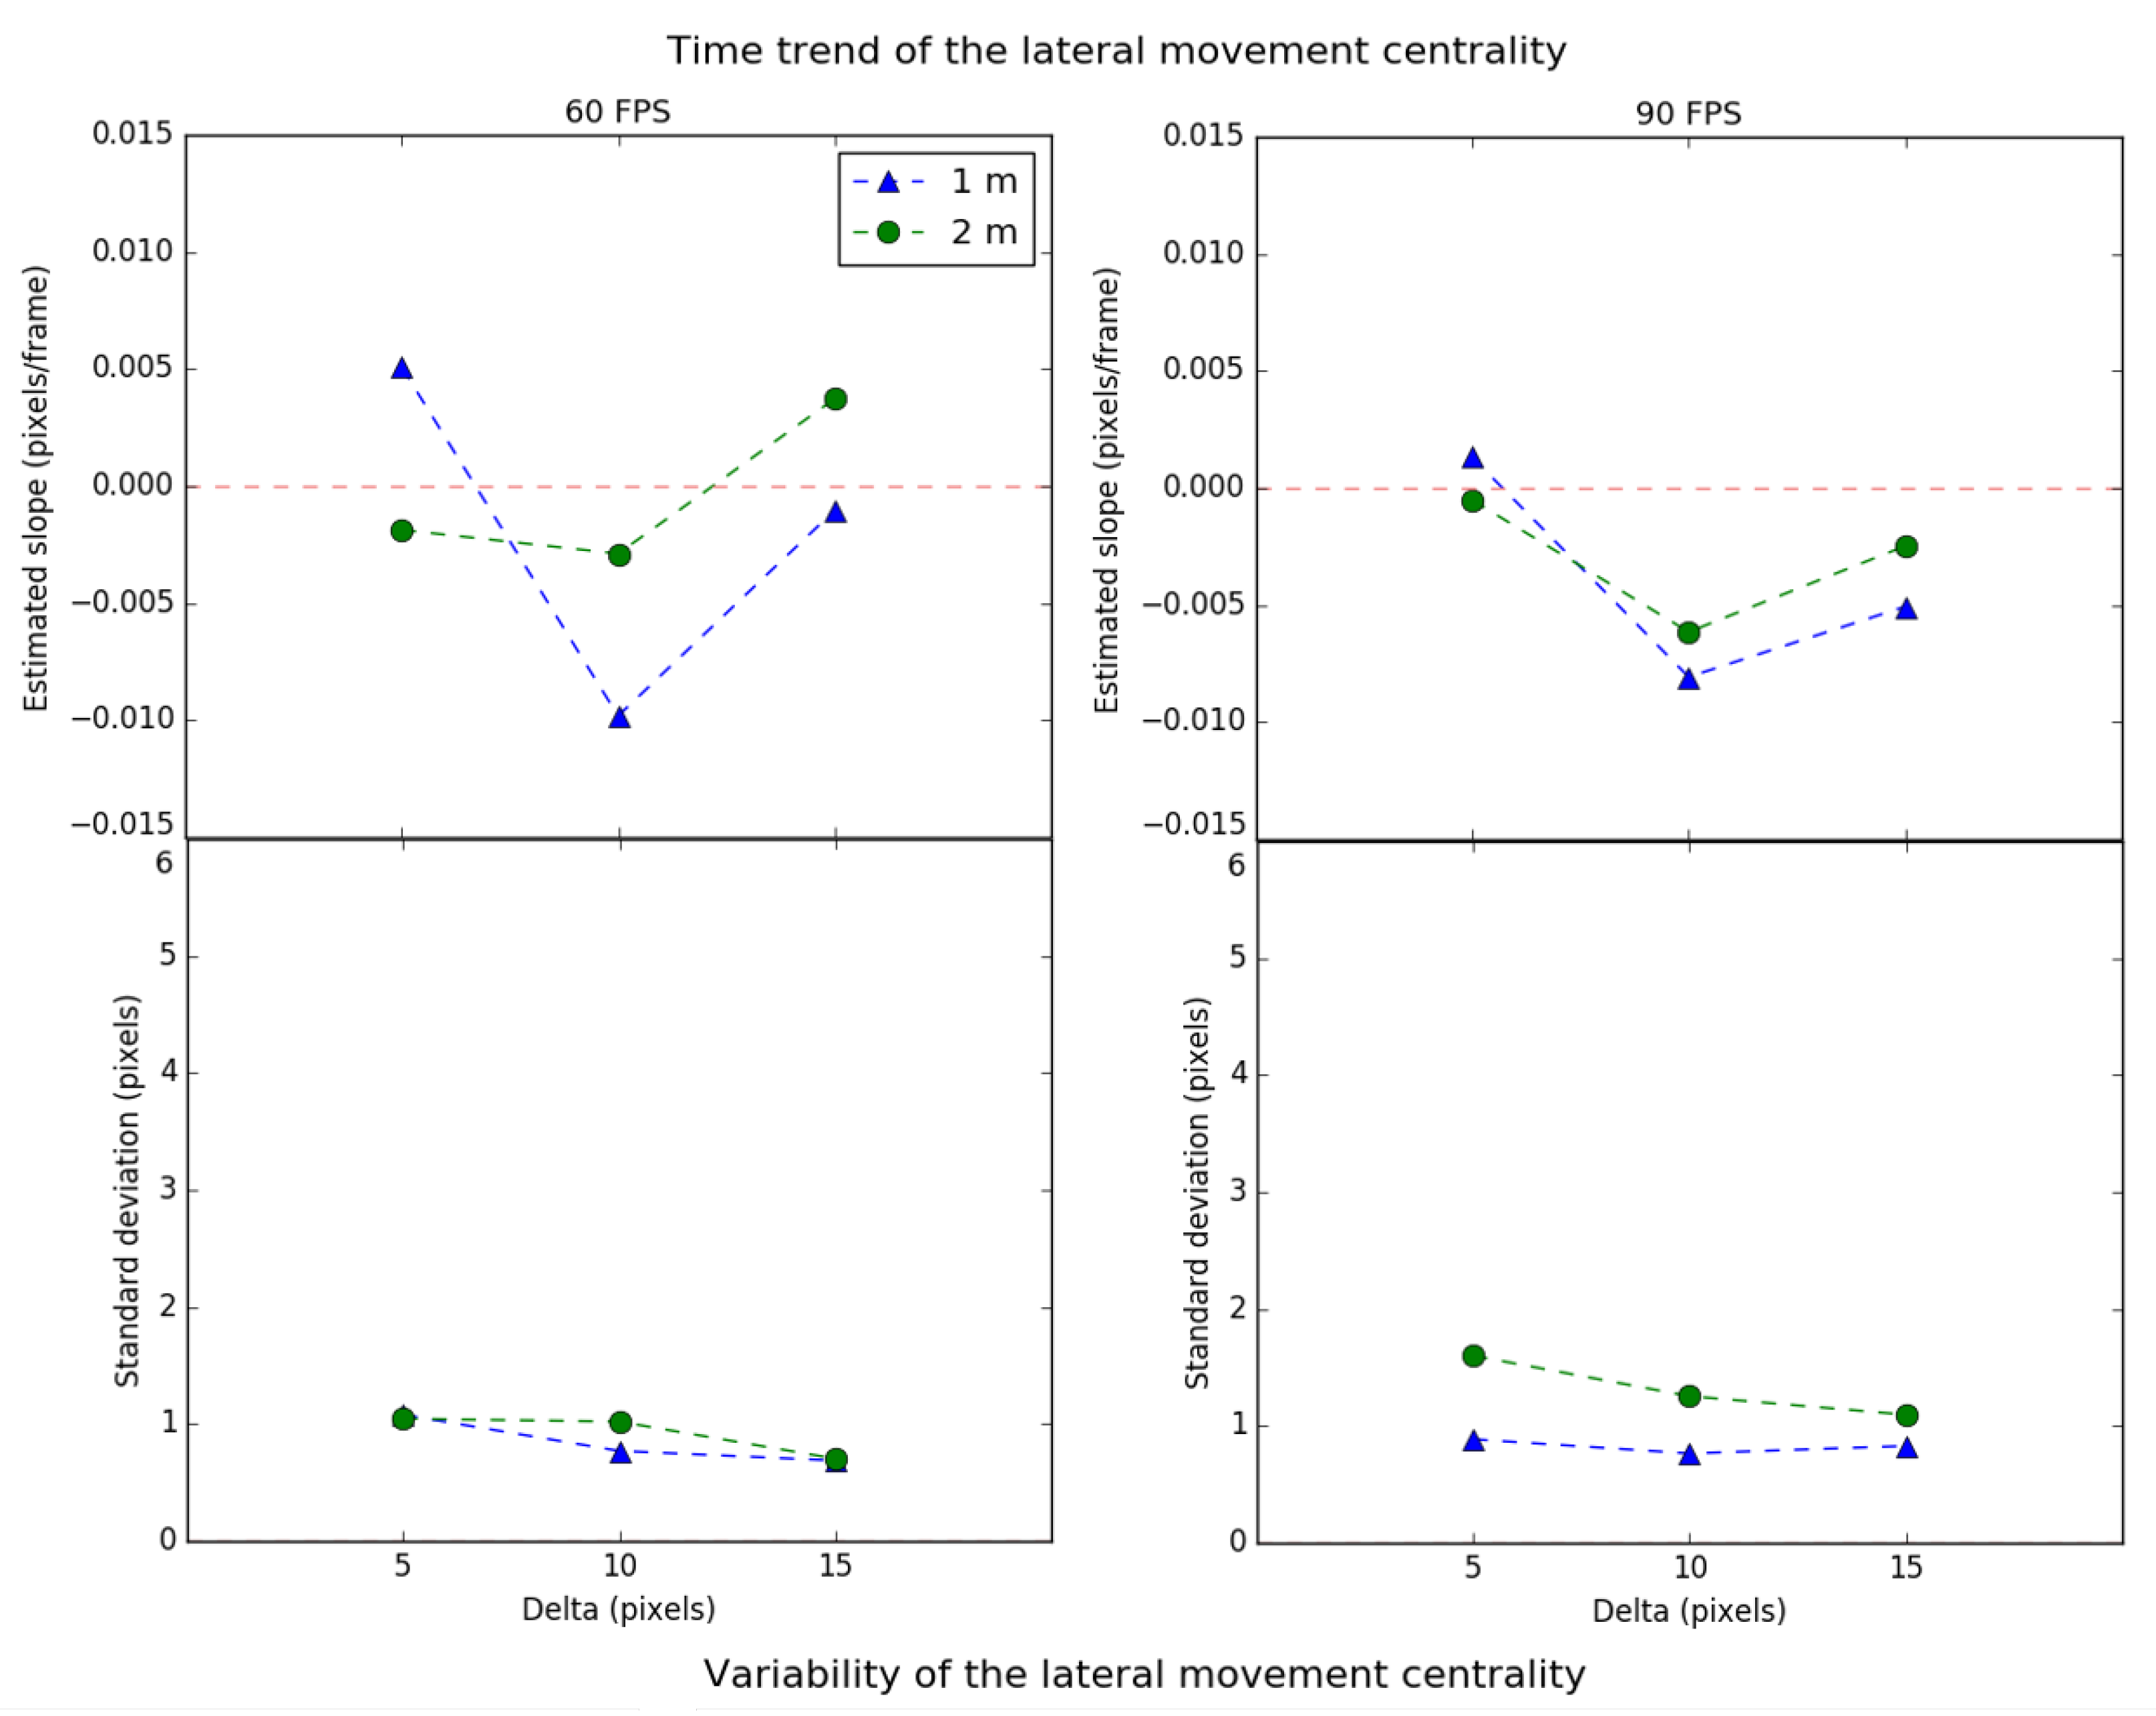
Finally, the temporal evolution of the scale and centrality is fitted using a linear regression. The slope and standard deviation of the residuals of this fitting illustrate the temporal trend and variability with respect to the trend, respectively, of the scalability and centrality over time.
However, since only a series of experiments have been carried out, it is necessary to contrast the values obtained for the means and variances using a Student’s t-test to determine if the regression has a linear behavior with a 95% confidence interval. The slope of the linear regression is studied. In this case, the null hypothesis is understood as a null slope, so the system converges to tracking. In this case, the system does not need to return to the discovery state. Otherwise, when the null hypothesis is rejected, the system must discover the source, since tracking will deteriorate over time.
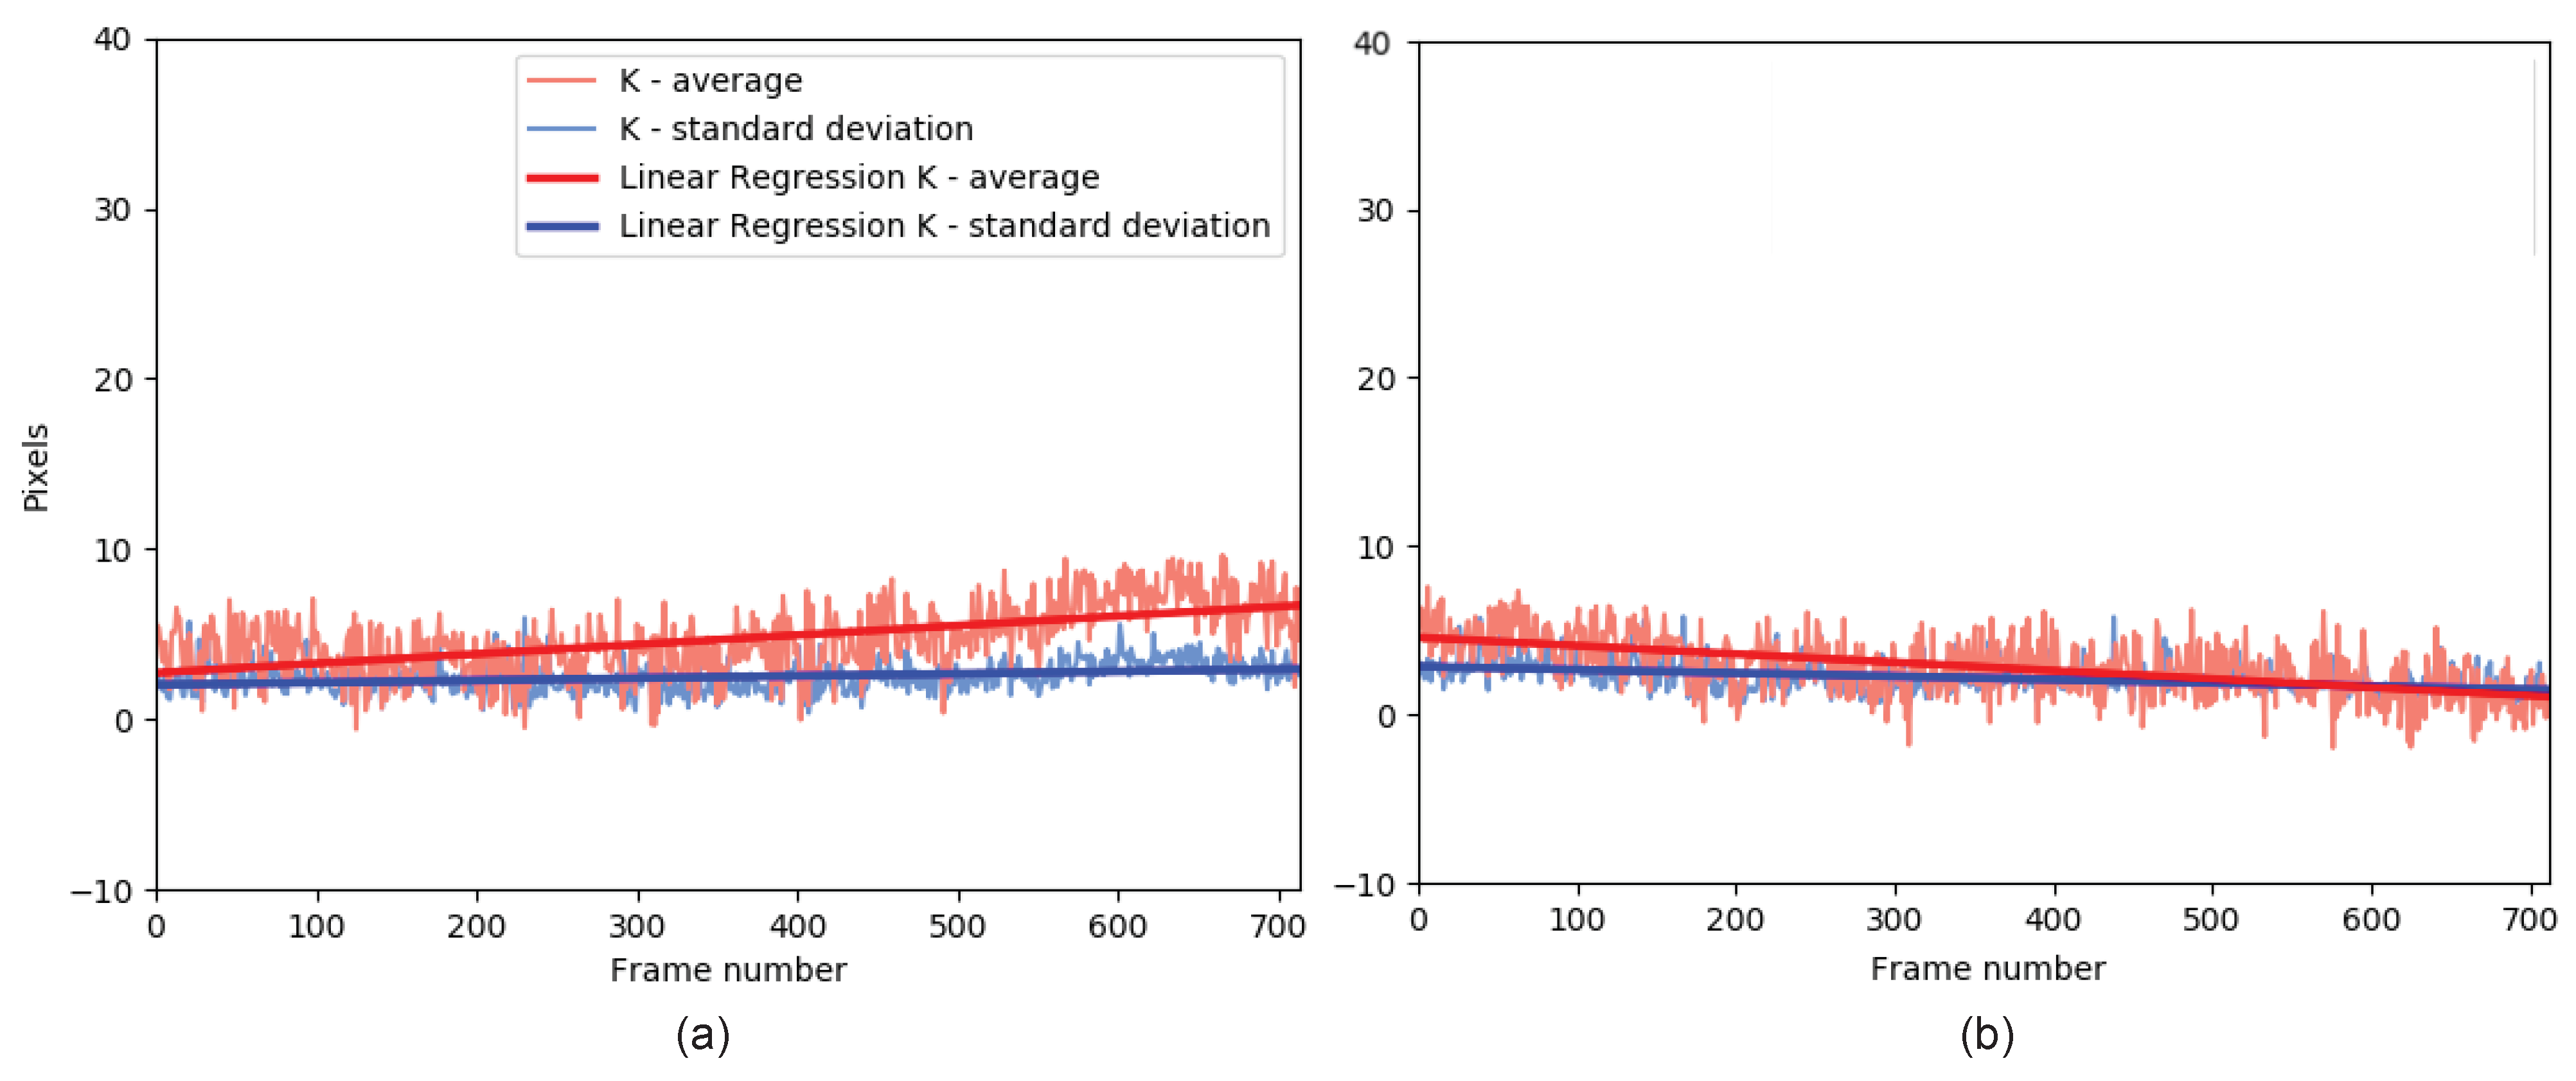
Figure 7 shows two examples of positive slopes (
Figure 7a) and negative slopes (
Figure 7b). The red curve corresponds to the scale (mean of the K parameters), while the blue color corresponds to the variability (standard deviation of the K parameters).
A positive slope for the scale indicates that the tracking ROI area increases over time, while a negative slope indicates that the area decreases. Thus, a positive slope indicates that there is a higher probability of interference from an unwanted object. In contrast, a negative slope implies that the source is partially lost over time.
A positive slope for the centrality indicates that the tracking tends to decentralize, while a negative slope indicates the opposite. In this case, a positive slope indicates that the tracking ROI will have a more significant variation over time between consecutive frames, while a negative slope indicates that the tracking ROI will tend to remain static concerning the transmitter over time.


 ,
, 


