1. Introduction
With the rapid development of urban transportation infrastructure, urban traffic flow is also increasing. At present, footbridges are commonly used in cities to ease the growing burden of urban traffic operations, making urban traffic three-dimensional and diverting people and vehicles [
1,
2,
3]. Contrary to highways and bridges, the main load form of footbridges is pedestrian load, which is easily affected by human-induced vibration [
4,
5,
6,
7]. However, it was not until the closure of the Millennium Bridge in London that the problem of human-induced vibration attracted more and more attention from researchers [
8,
9,
10]. At the same time, vibration comfort has also become one of the important control criteria for footbridge designs, in addition to strength and deflection deformation requirements.
Vibration comfort is an important index for evaluating the performance of footbridges. The structural response parameters required for the evaluation of comfort are generally acceleration peak value, vibration dose value (VDV) [
11], or acceleration root mean square value (
rms) [
12]. Traditional testing methods are based on traditional sensors (such as accelerometers) to collect structural vibration responses [
13,
14,
15]. The sensors have the advantages of small size, lightweight, high sampling frequency, and high precision. Chilamkuri et al. [
16] introduced an intelligent sensor system for bridge structural health monitoring, using acceleration sensors to measure the vibration of the Varadhi bridge deck. This monitoring method can be applied to many infrastructures to aid in structural disaster management and recovery. However, the use of traditional sensor testing is prone to traffic jams, complicated operations, and time-consuming and labor-intensive phenomena. Therefore, noncontact laser and radar measurement methods [
17,
18] are increasingly used by researchers for structural displacement detection. Gichun Cha et al. [
19] proposed a method to estimate the vertical displacement of a structure using light detection and ranging, enabling noncontact measurements. Laser inspection methods can cause misalignment of measurement results when measuring structures with uneven surfaces. In addition, Guan et al. [
20] proposed a bridge displacement intelligent radar sensor network, which is used to measure the static and dynamic displacement of the structure, process the node data of the sensors in the network, and perform wireless transmissions. Whereas the distribution of the test positions of the radar detection method is not flexible enough, and noise will be introduced in the acquisition process, which will affect the accuracy of the measurement results. While conventional sensors are advantageous in accuracy detection, such vibration testing instruments are often expensive and difficult to set up and maintain. More importantly, when there are many locations to be measured, many devices are required to complete the detection, which is very inconvenient.
The computer vision-based vibration response acquisition method is a method of acquiring digital image information using a mobile camera device. This method has the advantages of long distance, noncontact, low cost, convenient operation, and a wide application range. Many domestic and foreign research scholars have conducted a lot of research in combination with computer vision [
21,
22]. Lee et al. [
23] proposed a long-term displacement measurement strategy based on computer vision for self-motion compensation. The method they propose uses two cameras, the main camera uses conventional computer vision methods to measure the structural displacement, and the sub-camera is used to eliminate the measurement error of the main camera. It is used to measure the displacement of a single point in a structure. While the identification of single-target structural displacement is not sufficient for the study of structural health monitoring, Feng et al. [
24] proposed a vision-sensor system for remote measurements of structural displacement. They used a template matching method for multipoint displacement measurements, whereas computer vision methods for the assessment of vibration comfort are relatively few. Dong et al. [
25] proposed a noncontact footbridge vibration comfort assessment method based on computer vision. Additionally, they conducted a series of footbridge experiments with different synchronicities. Their method only studies the vibration comfort at the mid-span position of the footbridges. Nevertheless, pedestrians may feel different when walking at different positions of the footbridge.
Shahabpoor et al. [
26] proposed a new concept of vibration comfort assessment based on the actual vibration level experienced by each pedestrian rather than the typical maximum vibration response at fixed points. However, this idea has only been implemented with simulation methods, and has not been implemented in the presence of real pedestrians walking. Additionally, so far, the evaluation of structural vibration comfort based on computer vision only uses the vibration response at the mid-span position to represent the pedestrian’s feelings during the whole process of walking. While computer vision-based comfort assessment is a promising assessment method with many advantages, more research is needed to consider the actual vibration levels experienced by pedestrians on this basis.
All in all, there are three difficulties that need to be overcome to realize the vibration comfort assessment based on the actual vibration level experienced by pedestrians:
One of the key points for achieving the vibration comfort assessment based on the actual vibration level of pedestrians is to obtain the global displacement of the structure.
This evaluation method needs to grasp the position information of pedestrians during walking.
The vibration response at different positions of the structure needs to be combined with the pedestrian position to obtain the actual vibration experienced by the pedestrian at the position.
Based on these, this research proposes a computer vision-based global vibration comfort evaluation method for footbridges. This paper uses computer vision to measure the structural displacement of pedestrians at each step during walking and evaluates the comfort level of the actual vibration level of pedestrians at each step, so as to obtain the real feeling of pedestrians in the whole process of walking. This method first uses the YOLOv5 algorithm to detect pedestrians and obtain the location information of pedestrians. Secondly, the improved LK optical flow method is used to identify the structural multitarget displacement. Then, according to the pedestrian’s position, the actual structural displacement at each step of the structure is extracted from the multitarget displacement of the structure, and the global displacement response of the structure is obtained. Meanwhile, the global acceleration response is obtained by a secondary derivation of the global structural displacement. Finally, the rms value is calculated according to the global acceleration, so as to evaluate the global vibration comfort of the footbridges.
2. Global Vibration Comfort Evaluation of Footbridges Based on Computer Vision
2.1. The Basic Steps
The computer vision-based global vibration comfort evaluation method for footbridges proposed in this paper consists of pedestrian detection and structural multipoint displacement recognition. The so-called global vibration comfort evaluation method refers to firstly using the YOLOv5 algorithm to detect pedestrians to obtain the position of each step the pedestrian takes; secondly, using the improved LK optical flow method to detect the full structure displacement of the footbridge; then, the obtained multipoint displacement of the structure is combined with the pedestrian position information to establish the actual vibration level detection system experienced by pedestrians moving continuously on the footbridge during the walking process; the obtained actual vibration level index is used to evaluate the vibration comfort. The flowchart is shown in
Figure 1.
2.2. Pedestrian Detection Algorithms
2.2.1. YOLOv5 Algorithms
In order to obtain the real-time position information about pedestrians, the YOLOv5 algorithm needs to be used for pedestrian detection. YOLO is an end-to-end target detection model. Its core idea is to use the entire image as the input of the network, and directly return to the position and category of the bounding box in the output layer. It achieves the best balance of accuracy and speed in the current target detection algorithms. Therefore, the YOLOv5s model in the YOLOv5 algorithms is selected here to detect the position of pedestrians on the footbridge.
Figure 2 is a network structure diagram of the YOLOv5s algorithm.
2.2.2. Train
The training environment configuration of the YOLOv5 model is shown in
Table 1.
Considering that this article only needs to identify one category of “person”, this example uses the standard dataset VOC-2007 dataset, which is a standard for measuring the ability of image classification and recognition. The dataset provides 20 categories, including 9963 pictures, a training set (5011 pictures), and a test set (4952 pictures). Among them, the pedestrian detection in this article only involves one category, namely, “person”. The person category is extracted from VOC-2007, and the YOLO configuration file is modified, recompiled, and then trained.
Training parameters: the batch size is 16, the image size is 640*640, the learning rate is 0.01, and the number of training iterations (epochs) is 500 rounds. After the training is completed, the model is saved, and the training curve is drawn. The evaluation indicators in the training process include the metric and train data line graphs. Metrics is a monitoring table for completing various data during the training process, including precision, recall rate, and loss curve. The training results are shown in
Figure 3.
Training result analysis: As more and more samples are selected, the recall rate will definitely become higher and higher, and the precision will generally decline. Among them, the recall rate refers to the probability that the correct category in the sample is predicted to be correct, and the precision refers to how many of the samples whose predictions are positive are truly positive samples. As the number of training rounds increases, the precision and recall rate will increase, but after 300 rounds, the precision increases slowly, while the recall rate begins to decrease. For the loss graph, before 300 rounds of training, the loss declined, and after 300 rounds, the loss increased slightly. It shows that after 300 rounds of training, there is an overfitting phenomenon, resulting in a slight increase in loss and a decrease in recall rate. Therefore, it is best to train for approximately 300 rounds.
2.3. Multitarget Displacement Recognition
This section uses the improved LK optical flow method to measure the structural displacement from the footbridge vibration video.
Figure 1 shows the general steps of the structure displacement detection method in this paper. First, the structure vibration video is collected, and image preprocessing is performed on it to improve the calculation speed and displacement detection accuracy. Secondly, the camera is calibrated and the conversion relationship between the image coordinate system and the real coordinate system is calculated. Then, the improved LK optical flow method is used to select the detection feature points from the image for target tracking. Finally, by comparing the position changes of the feature points in each frame of the image, the displacement in the image coordinate system is calculated, and the final displacement in the actual coordinate system is obtained by combining the camera calibration results.
The method in this paper selects the bilateral filtering method to preprocess the collected images, which can not only effectively remove noise, but also preserve the image edges.
In multitarget displacement identification, a portable SLR camera is placed in front of the footbridge, and the target detection and tracking are carried out on multiple target points of the whole bridge at the same time. Since only the longitudinal displacement needs to be measured, the multitarget displacement identification part adopts a simplified camera calibration method, that is, the scale factor method [
27]. The scale factor method equation used is shown in Equations (1) and (2). Among them, Equation (1) is the calculation formula of the scale factor
s when the optical axis of the camera is perpendicular to the structural plane, and Equation (2) is the calculation formula of the scale factor
s when the optical axis of the camera is at an angle with the structural plane. Since the optical axis of the camera is always perpendicular to the structure plane during the shooting process, all the target points are calculated using Equation (1) for the scale factor.
Among them, D is the physical unit size of the selected target, d is the pixel unit size corresponding to the selected target, and α is the angle between the optical axis of the camera and the normal of the structure plane.
In this paper, the method used for structural displacement detection is the improved LK optical flow method [
28]. The Lucas–Kanade optical flow method was proposed by Bruce D. Lucas and Takeo Kanade. It assumes that the optical flow is a constant in the field of pixels, and then uses the least squares method to solve the basic optical flow equation for all pixels in the field. The premise of the LK method is that the moving distance of the target in the image between two consecutive frames before and after is not large, and there is approximate motion consistency around the fixed point.
In this paper, when measuring the structural displacement under human-induced vibration, the bridge vibration may be severe when pedestrians pass through the bridge. At this time, the second assumption may not be true, resulting in an error in the algorithm. The improved LK optical flow method mentioned in this article combines the SIFT feature point matching with the LK optical flow method. First, feature points are extracted in the first frame (previous frame), and then feature points are matched in the second frame (current frame). Then we use optical flow to solve the corresponding relationship between the feature points of the two frames. When pedestrians pass through the footbridge, the contact between the pedestrian’s feet and the bridge deck may be recognized as a corner point. Since the SIFT feature points have good stability under environmental disturbances, such as illumination, noise, viewing angle, zoom, and rotation, they can overcome the original shortcomings of the LK optical flow method, so the SIFT feature point matching method is combined with the optical flow method.
The improved LK optical flow method can obtain the image pixel displacement of multiple positions of the footbridge structure during the same vibration process, and it is necessary to further convert the pixel displacement into the real displacement. Using the scale factor obtained by the multitarget camera calibration method, the pixel displacement of each point is converted into the real physical displacement, and the conversion equation is shown in Equation (3).
2.4. Global Comfort Assessment
2.4.1. Global Acceleration Extraction
The computer vision-based global vibration comfort evaluation method for footbridges first obtains the real-time position of pedestrians on the footbridge through a pedestrian detection algorithm based on deep learning. Then, the vibration response of the structure is obtained with the multiobjective structural displacement identification method. The structural displacement responses at each step position are extracted and combined to obtain a set of structural displacement curves, that is, the global displacement response of the footbridge. Additionally, the global displacement response of the footbridge is obtained with the acceleration calculation method described above. The
rms value of the global acceleration is then calculated, and the vibration comfort is assessed against the vibration limits.
Figure 4 depicts the method for extracting the global displacement of the footbridge mentioned in this method. As shown in
Figure 5, picture a is the pedestrian position, and picture b is the structural displacement response curve at point
i.
- (1)
When the pedestrian walks to the measuring point i, according to the pedestrian coordinate information obtained by the pedestrian detection, the moment when the pedestrian is at the middle position between the measuring point i − 1 and the measuring point i can be obtained as ti1. The time at the middle position between the measuring point i and the measuring point i + 1 is ti2.
- (2)
Corresponding to the part from ti1 to ti2 of the structural displacement time-history curve intercepted to the measuring point i, the real displacement response of the pedestrian at the measuring point i is obtained.
- (3)
The respective real displacement responses are intercepted from the displacement responses of n measuring points and combined into a time sequence, which is the global displacement curve of the footbridge described in this paper.
This paper describes a computer vision-based global vibration comfort assessment method for footbridges. Therefore, after obtaining the structural global displacement, the structural global displacement data needs to be converted into the structural global acceleration data through the second-order derivative. In this way, the comfort evaluation index related to the global acceleration is calculated.
2.4.2. Comfort Assessment Specifications
Most of the evaluation indicators used in previous comfort evaluation methods are acceleration peaks, but the computer vision-based footbridge global vibration comfort evaluation method mentioned in this paper is closely related to the walking position of pedestrians. Therefore, considering the influence of time on the evaluation index, this paper selects rms (root mean square value of acceleration) as the comfort evaluation index of this method. This section states the ISO 2631-1 (1997) standard for evaluating the vibration comfort of footbridges.
This paper adopts the basic evaluation method in the ISO2631-1 (1997) specification. For the so-called basic evaluation method, the vibration intensity index is the root mean square acceleration
rms after frequency weighting, which is calculated according to Equation (4):
Among them, rms is the weighted acceleration rms value, in m/s2 or rad/s2; aw(t) is the weighted acceleration (including translation and rotation) as a function of time, in m/s2 or rad/s2; T is the vibration duration, the unit is s.
The vibration limits used in this standard include perception limits and comfort limits.
- (1)
Perception limit: Fifty percent of alert and robust people have a detection limit of 0.015 m/s2 (peak).
- (2)
Comfort limits: As shown in
Table 2.
As shown in
Table 2, when pedestrians pass, the comfort assessment of the footbridge is based on the above vibration limits. Therefore, the displacement time history is first obtained by the improved LK optical flow method described in
Section 2.3, and then the acceleration time history is obtained by calculating the displacement time history. The acceleration root mean square value is calculated based on the acceleration data, and the root mean square value is compared with the vibration limit to evaluate whether the vibration comfort meets the specification requirements.
4. Conclusions and Discussion
On the basis of previous research, in order to more accurately evaluate the vibration comfort of footbridges, this paper proposes a computer vision-based global vibration comfort evaluation method for footbridges that considers the influence of pedestrian position on the vibration comfort of the footbridge. This method is different from the previous footbridge vibration comfort evaluation method, which uses the typical maximum response at the mid-span position and that represents the full-bridge response. Instead, this method extracts the real responses of pedestrians at each step from the multipoint displacement identification results of the footbridge according to the pedestrian’s positions, and then combines the real responses at each point to obtain the global response of the footbridge. According to the experimental data listed in this paper, the following conclusions were drawn:
- (1)
Through testing the footbridge in the laboratory, the error of the vision displacement result compared with the displacement response collected by the displacement meter is 2.298%, the error is small, and the accuracy is high.
- (2)
The YOLOv5 algorithm can quickly and accurately perform target detection, and can obtain the position information of pedestrians in the process of walking. It is a feasible pedestrian detection algorithm.
- (3)
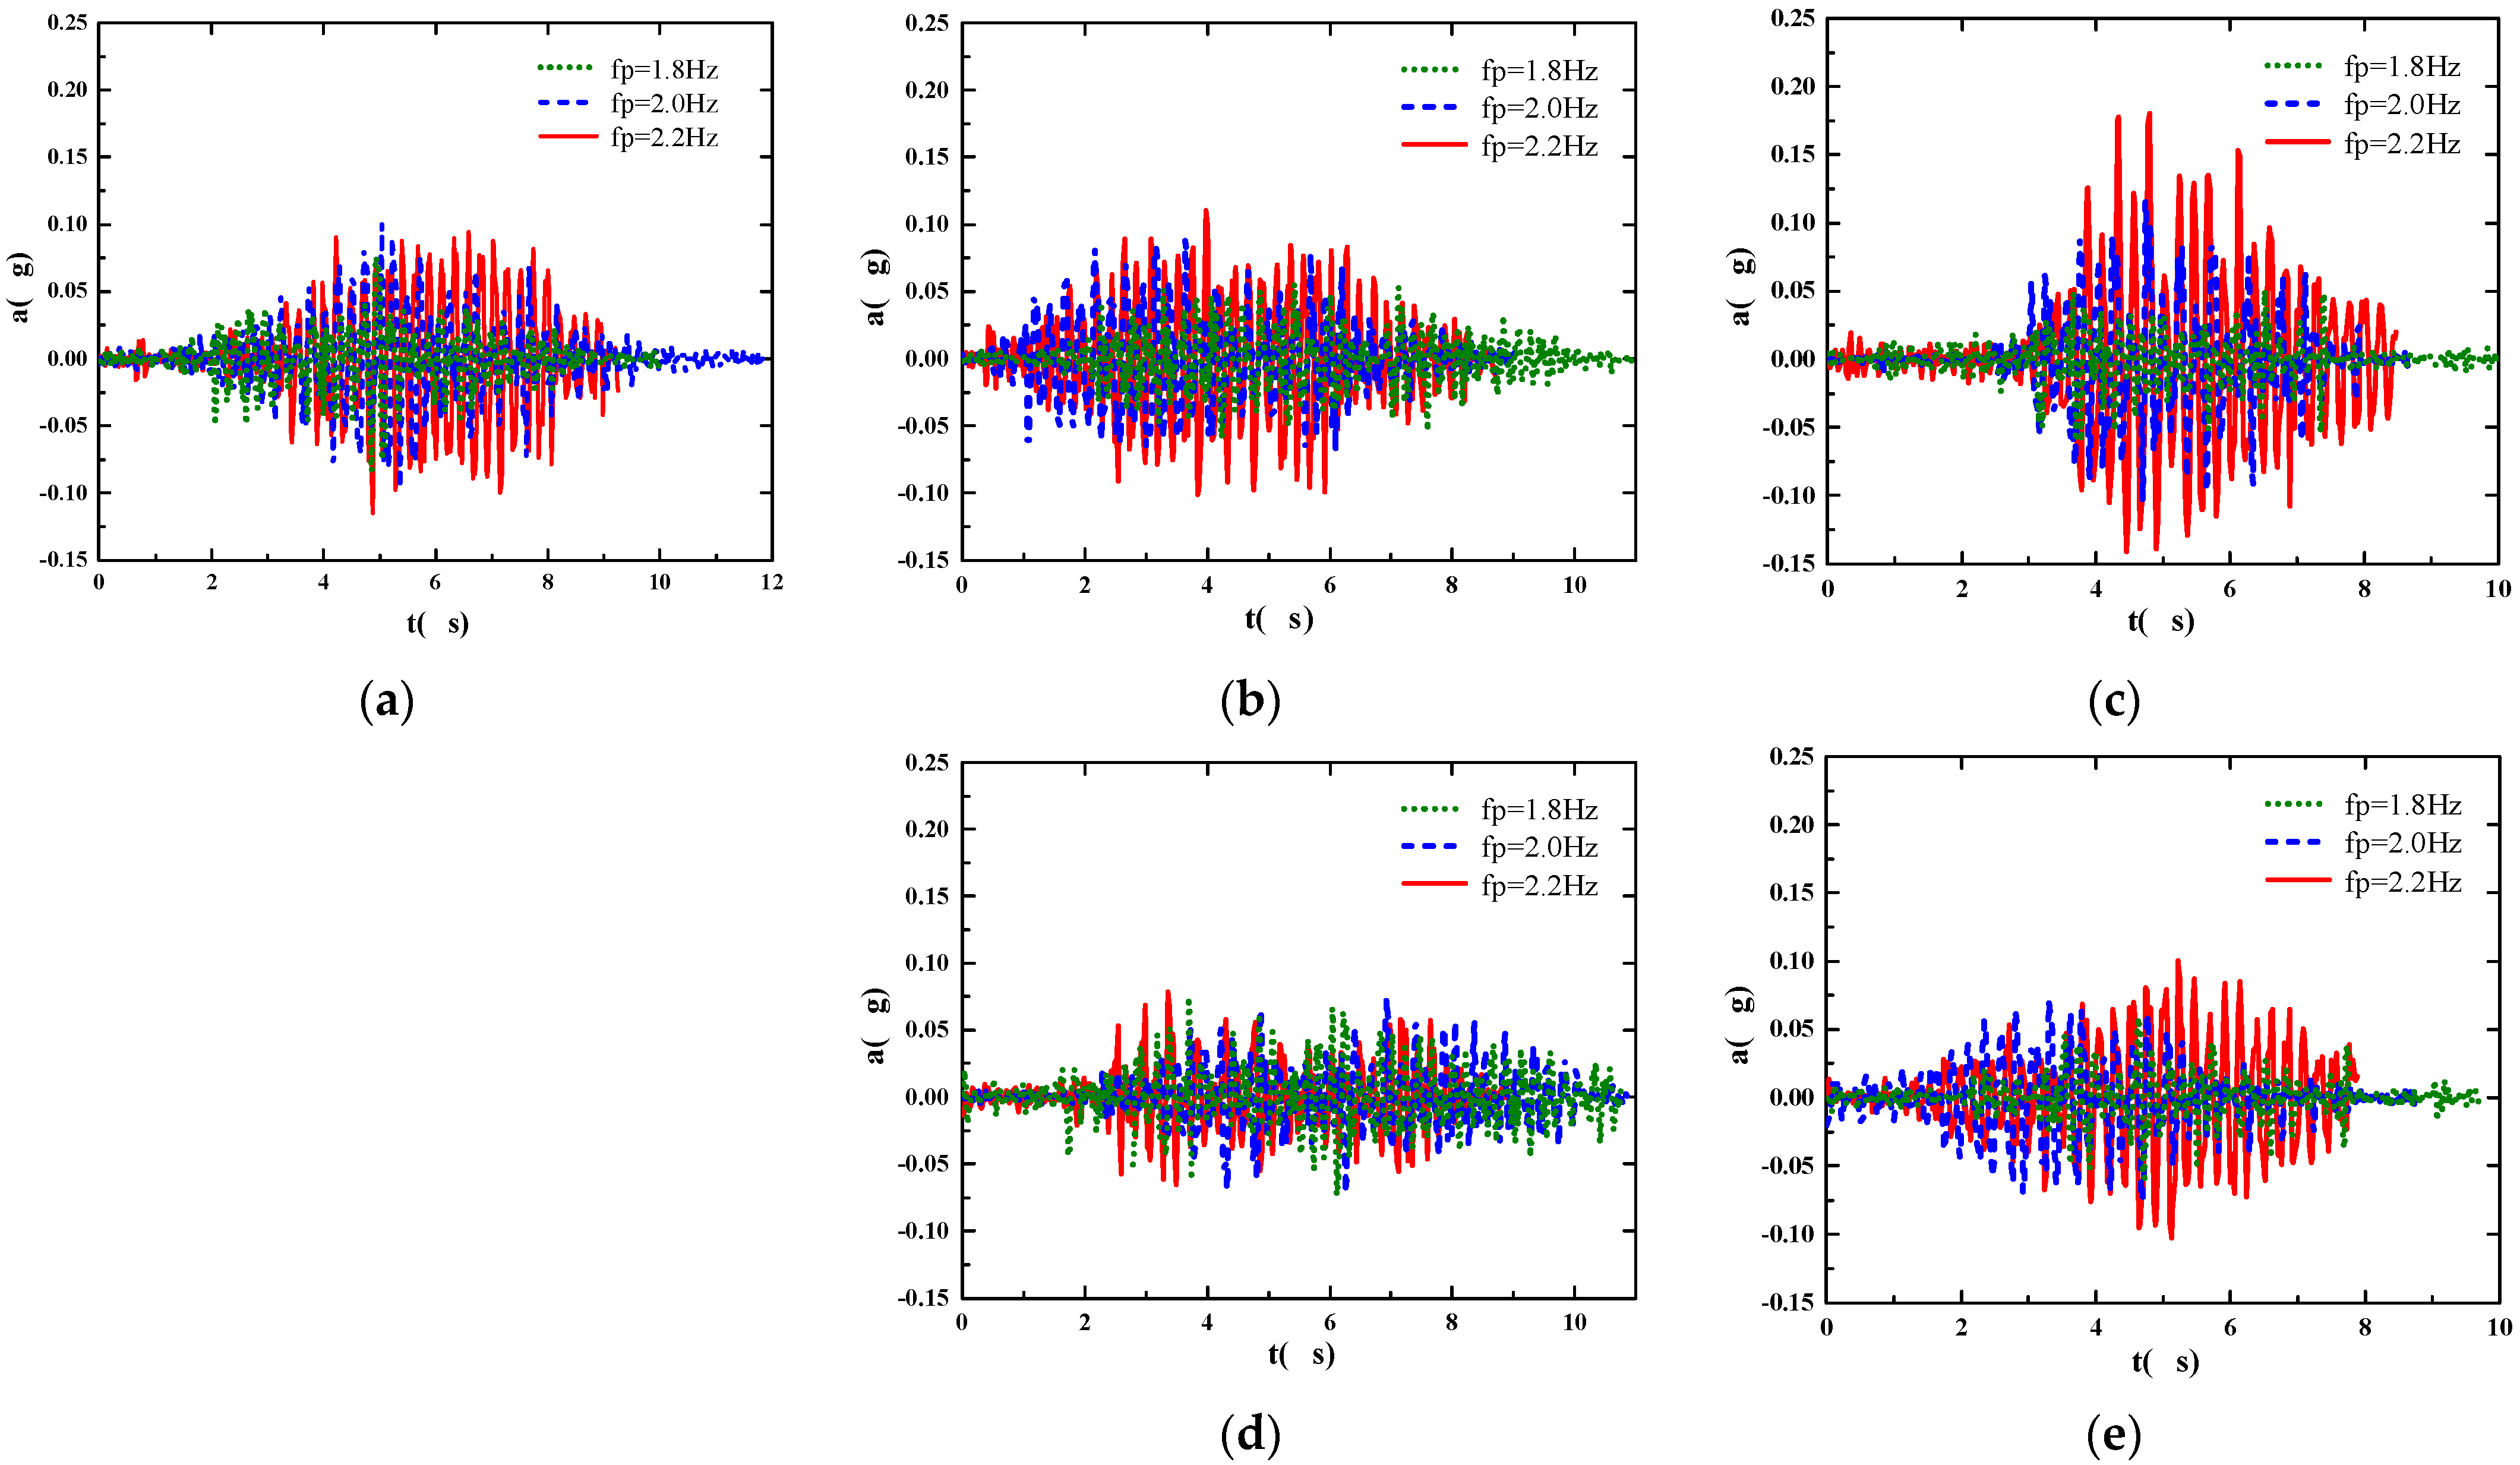
By comparing the global acceleration rms value of a single pedestrian walking on the footbridge at three frequencies of 1.8 Hz, 2.0 Hz, and 2.2 Hz with the acceleration rms value at the mid-span position of the footbridge, it is found that the rms value calculated by the acceleration time history of the mid-span position is generally larger than the rms value obtained by the global acceleration of the footbridge. However, there are also cases where the acceleration rms value at the mid-span position is small. It shows that the traditional method of evaluating the comfort with the typical maximum response of the mid-span position is not accurate, but should be combined with the pedestrian’s position on the footbridge to evaluate the comfort of pedestrians at every moment.
Due to technical limitations, this method can only extract the global displacement of the footbridge according to the measured multipoint displacement results of the structure and the pedestrian position information after pedestrian detection, and calculate the global acceleration and its rms value, but cannot obtain real-time information about the pedestrian’s position at each step. In order to realize the real-time identification of the structural response where pedestrians go, it is necessary to further improve the model and algorithm, so as to realize the global vibration comfort evaluation faster. Further research can verify that the vibration comfort evaluation method for the entire area of the footbridge mentioned in this article can be verified in the case of pedestrians walking. We can judge whether this method of comfort evaluation still has advantages in the case of pedestrians walking, and apply this method to engineering practices.


