Abstract
Integration of vehicle-to-home (V2H) centralized photovoltaic (HCPV) systems is a requested and potentially fruitful research topic for both industry and academia. Renewable energy sources, such as wind turbines and solar photovoltaic panels, alleviate energy deficits. Furthermore, energy storage technologies, such as batteries, thermal, and electric vehicles, are indispensable. Consequently, in this article, we examine the impact of solar photovoltaic (SPV), microgrid (MG) storage, and an electric vehicle (EV) on maximum sun radiation hours. As a result, an HCPV scheduling algorithm is developed and applied to maximize energy sustainability in a smart home (SH). The suggested algorithm can manage energy demand between the MG and SPV systems, as well as the EV as a mobile storage system. The model is based on several limitations to meet households’ electrical needs during sunny and cloudy weather. A multi-agent system (MAS) is undertaken to ensure proper system operation and meet the power requirements of various devices. An experimental database for weather and appliances is deployed to evaluate and control energy consumption and production cost parameters. The obtained results illustrate the benefits of V2H technology as a prospective unit storage solution.
1. Introduction
1.1. Background
Humans have become more dependent on energy over time. Energy efficiency is necessary for intelligent household appliances and electric automobiles. Therefore, the conventional electrical grid confronts numerous challenges, including the inability to fulfil peak demand, expensive power outages, and pollution-induced environmental catastrophes. Because of these challenges and high energy consumption, power generating and distribution technologies must progress [1]. Clean and renewable energy helps prevent air pollution and increases the industry’s sustainability. Solar photovoltaic (SPV) or solar power systems can create solar energy without harming the environment. Consequently, solar energy produces less expensive energy than fossil fuels. Load balance and maximum power management both have downsides [2]. Accordingly, some smart grid (SG) technologies have evolved to solve these issues. In [3], the authors implemented smart metering to regulate the energy demand of smart homes (SHs). The latter is a crucial component of a SG to balance energy demand and generation. Additionally, it incorporates fog computing technologies for more precise load balancing. In [4], the authors conceptualized and constructed an SH prototype for storing SPV energy during power outages. The grid and SPV energy use were processed to compute costs, generate a bill, and identify the overall energy consumption. The load control technique has established several power consumption profiles for reducing peak demand. In [5], the authors published and designed sophisticated energy management for SHs. The proposed system integrated both wireless communication and renewable energy sources (RnEs).
In addition, the model combines a demand, supply, and peak load scheduling technique to reduce electricity bills and conserve energy. The authors created and developed an SH prototype in [6]. The suggested solution combined cloud infrastructure with IoT-enabled smart sockets to regulate their functioning and store device load patterns. In addition, an efficient real-time demand response (DR) scheduling system was created, reducing consumers’ electricity costs without altering their use habits. Load balancing and maximum power management are not the primary obstacles to power management. Energy management systems (EMSs) must be implemented to efficiently and locally manage each SMG. A building energy management system is an example of an environmental management system for businesses such as schools, hospitals, factories, etc. While a HEMS is intended primarily for homes and their appliances, home automation has been introduced as a potential innovation to provide uninterrupted electrical performance, resolve concerns with energy consumption, and enable intelligent devices to coordinate with new technology. Recently, energy businesses have worked to develop technologies that improve energy commercialization through energy system management and lower prices [7]. A HEMS is a potential form of home automation that can increase energy efficiency; it includes appliances, entertainment systems, security systems, environmental controls, etc. In [8], the authors proposed a HEMS strategy for efficiently scheduling energy resources in a SH. In addition, the suggested HEMS modeled the lifestyle-related functional dependencies of home appliances to assess the lifestyle requirements of the user. In [9], the authors described the self-scheduling of an efficient HEMS system using a stochastic framework of mixed integer linear programming. The suggested system determined the condition of household appliances throughout the day. In [10], the authors proposed an intelligent HEMS system based on a multi-agent system (MAS) to meet loading criteria and carry out the necessary system tasks. The results indicated that a smart HEMS system could intelligently plan the on/off status of a home by controlling the system’s conditions. This improved the SH’s energy efficiency. In fact, a HEMS design incorporating a RnE source and an energy storage system (ESS) was built and considered. Particle swarm optimization and binary particle swarm optimization have been utilized to enhance mathematical methods for general energy costs. According to the findings, the proposed structure saved up to 19.7% more money than prior efforts. Utilities have implemented time-of-use (TOU) pricing for residential customers. During times of heavy demand, this tariff increases the price of electricity. Maintaining a steady SG necessitates an efficient method for reducing the peak-to-average power demand ratio (PAR). In [11], the authors suggested an approach for home loads that incorporated SPV devices with battery storage. In this configuration, grid electricity was the primary source, with battery storage serving as a backup during moments of peak demand. Using ant colony optimization, the authors of [12] developed and presented an improved HEMS that reduced peak demand and improved user comfort. A comparison of the achieved results to non-scheduled alternatives demonstrated the expanded potential of HEMS to reduce PAR by scheduling household appliances depending on the terms of use pricing. In [13], the authors devised and discussed a HEMS strategy for SHs. The proposed strategy tried to facilitate peak-to-off-peak transitions while concurrently minimizing peak demand. In fact, it was built on a multi-objective scheduling issue that must be handled by addressing the objectives with a decision support problem (DSP), which helped maintain peak demand low and expenses low. An EMS system that employed an algorithm to automatically limit the power consumption of household appliances has been described. In [14], the authors stated that consumption was planned such that the highest load could be lowered for the least amount of money, based on user priorities. Prosumers and the creation of an effective HEMS system would benefit both end-users and system operators in terms of cost control and the reduction of peak-hour consumption costs. In [15], the authors presented a modular and automated HEMS system with three essential subsystems: load determination, prediction, and optimization. Energy consumption information was recorded and securely stored. The system was capable of adapting to each of the three subsystems. The most efficient subsystem substituted the least efficient subsystem in the background to maintain user comfort while ensuring the lowest cost of energy used. While in [16], the authors proposed a multipurpose HEMS system with variable rate tariffs in order to save costs and increase customer convenience. By controlling a household’s appropriate energy consumption pattern and consumer priorities and preferences, the HEMS could balance cost savings and comfort. In [17], the authors explored and suggested a prediction and optimization model for an intelligent HEMS system. The forecasting model took into consideration the uncertainty of future energy consumption and prices. In [18], the authors presented an optimization approach for scheduling household appliances. The results demonstrated that energy usage and utility bills were lowered as a result of the HEMS strategy. Previous research has suggested that an efficient HEMS system may overcome constraints such as peak demand, dynamic pricing, and consumption. Finding a thorough and optimal answer to various problems is my research area. DSM is an integral approach to protect operations and increase power reliability. A DSM plan addresses environmental concerns, high energy costs, limited power supply, and grid reliance issues. Some study have used DSM to improve the HEMS design. In [19], the authors studied how DSM can minimize energy usage and increase efficiency using new development methodologies. According to the research, SGs improve security and energy efficiency while retaining environmental awareness. In [20], the authors used a DSM with support vector regression (SVR) to estimate the number of days before distributed generation to tackle an intelligent home energy planning challenge. DSM considers equipment use, battery bank capacity, electricity price variations, and duty cycles. In [21], a MAS model based on DSM was proposed. SH agents managed how smart home gadgets were turned on and off. In [22], the authors presented a smart DSM and HEMS system. Several metrics were compared with and without the intelligent HEMS system to ensure the technology would operate, including maximum switchable power, maximum standby power loss, energy savings, and peak shaving capabilities. Electric vehicles (EVs) enhance fossil fuel independence, energy variability, and cost reduction in DSM. This SG component draws interest in modern power systems as a source of elastic demand. In [23], the authors presented some models and solutions to ensure the proper running of SG electric vehicles. A stochastic adaptive dynamic programming (ADP) approach to the HEMS model with SPV and EVs was provided. The models discovered HVAC charging and discharging schedule adjustment points for electric vehicles considering SOC, SPV generation, and outside temperature. Moreover, a predictive control framework was constructed to simulate a residential home with continual updates of the optimal hardware schedules. A comparison of the suggested model to the standard model indicated that it could cut energy expenditures while preserving thermal comfort and decreasing EV SOC problems. In [24], the authors examined customers’ scheduling preferences for electric cars, ESSs, and RnEs. In addition, ESS and EV charging and discharging technologies were integrated into a HEMS. This technology provided cost-effective solutions and enhances battery life. The proposed model’s MILP reduced costs and maintained user convenience by scheduling intelligent home energy. In [25], the authors developed a framework for charging EVs using the local energy model and HEMS system. Simulations of high EV adoption in a community indicated the framework’s efficiency in reducing peak demand and nighttime energy use. In [26], the authors described a centralized way to improve energy management for BIM components. The analysis considered SPV, EV, metering infrastructure, and loads for the BIM model. The BIM model could run thermal loads and could fulfil power demand flexibly. Managing the BIM process correctly enhanced the energy balance between production and loads in the MG of the new HEMS system.
MAS applications that forecast energy effects are essential research areas because they simplify understanding and modeling RnE energy demand. In [27], the authors discovered greater use of market models, distributed control, system recovery, and optimization in MAS applications in small networks. In [28], the authors reviewed the literature on MAS network power management. The authors mentioned that no other design compared to a MAS. In [29], the authors created an SPV modeling system for efficient power generation. The energy management system displayed demand- and attribute-based scenarios. In [30], the authors proposed an energy-efficient intelligent home prototype. The MAS simulated RT-EMS power management (RT-ES-EM). Each agent’s energy consumption and production prices determined source circumstances. In [31], the authors suggested a HEMS framework to minimize power expenditures and boost PV for self-consumption while balancing comfort and spending. A multi-agent P2P energy trading format was proposed and discussed in [32]. The proposed technique promoted cost-effective energy balance by facilitating domestic supply and demand.
1.2. Gaps and Contribution
Previous studies have demonstrate that EVs in SHs can cut grid electricity at peak times. RnEs, appliances, and EVs must be scheduled optimally. A HEMS assesses SG and innovative home conditions to schedule intelligent home devices, and to charge and discharge electric vehicles appropriately. V2H technology coordinates EV and HEMS tasks in intelligent homes [33]. In [34], the authors suggested V2H and DR software. Network power and capacity optimization enhanced resilience, self-healing, and operational costs. The results showed that the proposed model could meet off-grid demand. In [35], presented a HEMS strategy for residential on-peak self-power. During a network outage, PHEV electricity was used to power a home. In [36], the authors proposed an innovative approach for energy charging and discharging coupled with a HEMS to establish V2H economic efficiency. Electric car charging and discharge should be based on off-peak electricity pricing. Grid-to-vehicle (G2V) saves 11.6% more than V2H. (G2V). An energy-management unit was implemented and discussed in [37]. The study compared V2H and conventional efficiency. Range and SPV subsidies were considered. SPV and V2H improved the valley’s electricity and SPV usage and resulted in economic benefits. Home-distributed PV and V2H panels could meet the home load demand on sunny and overcast days without a grid. Valley SPV and V2H accepted wet-day restrictions. From the previous works, it is seen that the proposed HEMSs have considerable research gaps:
- The vast majority of EMS-optimized systems are incompatible with V2H and/or SPV systems.
- There is a lack of study analyzing the effects of meteorological conditions and driving behavior on SPV production and consumption.
- Additional research should be conducted on V2H services for SPV power transmission and peak shaving.
- The economic sustainability of V2H’s two-way operation is still up for debate.
- There is a need to develop an optimal HEMS system with or without V2H and/or SPV.
- V2H services should be examined for SPV power transmission and peak reduction.
- An upgraded HEMS should consider weather, driving behaviors, and SPV advantages.
- The HCPV design should be examined economically.
- An optimal schedule should be developed for home appliances to determine the on/off load states and charging and discharging times for EVs and V2H systems.
Here, we simulate four cost-optimization scenarios based on state transition diagrams to determine the most cost-effective SH solution.
The remainder of the paper is structured as follows: In Section 2, we introduce the MAS and intelligent agent concepts and the V2H-HCPV cost-benefit and V2H energy balance models designed to lower the net expenditures of families; in Section 3, the scenario-based MAS scheduling method is created and discussed for the HCPV model; in Section 4, the test performance and results are summarized; finally, we outline our conclusions.
2. Methodology
2.1. Multi-Agent System (MAS) and Intelligent Agent Concepts
An agent is seen as an entity (software or tool) that operates in a defined setting and can interact independently with improvements to the environments. An agent interacts with its environment through a physical representation or by recording diagnostic data in a database accessible to others. The concept of SG can be extended to existing software and hardware. An “agent” is considered to be in a SG if: an energy system is located within its ecosystem, it responds to system status such as voltage and current changes, it suggests a high level of autonomy (individuality).
Thus, it is necessary to distinguish between agents and multi-agent systems (MASs) and their usefulness in solving technological difficulties. To do this, the term “agent” must be expanded to include “intelligent agent” (IA). Depending on the task at hand, different internal architectures have been suggested so that the agents of the system can work on their own as follows:
- Reactive agents are reactive variables with little environmental understanding. The first use of the Brooks skeleton is significant. This structure’s class hierarchy has a specific behavior. Each layer or behavior in the system is independent, although high-level activity will remove low-level behavior. This type of anatomy highlights why it does not need to be examined but can be taken up quickly if necessary. Factors can not change or get rid of uncertainty, and it may be hard to tell where a factor will be in a given situation.
- Regarding deliberative agents, an explanatory model contains deliberative agents in which judgments are made correctly. Agents with this type of anatomy form strategies to achieve their goals, making them better suited to solving mysteries and responding to unexpected events. Several Belief–Desire–Intention (BDI) models have been introduced for building commercial agents, as well as many alternative models. In this model, the agent’s beliefs represent his feelings about the world. The agent’s motives are his desires. This is the agent’s goal, but they will conflict if the agent has many objectives. An agent’s plans are the actions he must take to achieve his goals.
- Regarding hybrid agents, during the procedure, most agents are hybrids of reaction and reflection, with examples intrinsic to Turing machines.
- A multi-agent system (MAS) is essentially a system with two or more IAs being implemented. Indeed, in a MAS, there is no clear goal for the system as a whole; instead, this is achieved by bringing together several independent agents, each with a distinct local objective. In contrast, a MAS has proven to be the most intelligent management unit regarding power distribution. The decentralized structure of MAS technology enables the division of complex problems into subproblems through simultaneous processing to achieve the end goal, thus, reducing the computational overhead of a single machine. Extensive research has shown, for example, that intelligent elements could be used to control the power grid sustainably and to isolate the part of the system that is not working.
2.2. HCPV Design
As shown in Figure 1 and Figure A1, the HCPV design consists of a GEV, SPV, a HEMS, and HAs. The HCPV is designed to accommodate midday electricity demand. If the photovoltaic generation exceeds the load capacity, the excess power returns to the grid. A GEV battery generates electricity for a residence during peak hours. A bi-directional power converter, consisting of an AC-DC converter as a front end and a DC-DC converter as a backend, is used for the V2H unit. This bi-directional converter is useful for discharging the power from the GEV battery to the home. Thus, the GEV battery can be considered to be an energy source during peak demand. Furthermore, a stationary battery (SB) for storing excess energy is activated during a power shortage.
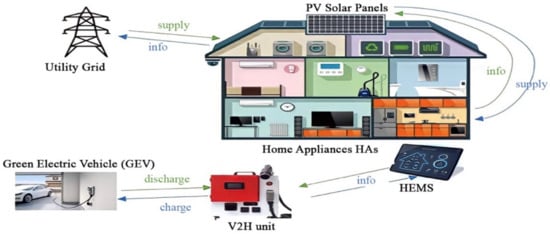
Figure 1.
Smart home platform design.
The following power system components will be designed for a smart home:
- Renewable energy sources (solar photovoltaic panels);
- Real-time intelligent energy management module (HEMS);
- HEMS storage device (batteries);
- Vehicle-to-home unit (V2H).
The agents in our proposed HEMS can make decisions, compare parameters, send real-time data, and send feedback about the system and consumption, which make the energy management process intelligent. Thus, the interactions among the subsystems become more efficient as compare with a HEMS without an MAS.
The energy balance equation for home automation using SPV or GEV stored energy is mainly represented in Equation (1). The following equations show that you cannot use both MG and GEV simultaneously and that the GEV must be constantly fed and released. Where the total SPV energy all day (Pspv,t) is subtracted from the total power (m) produced from the GEV (PGEV) to obtain the grid power requirement (PHCPV). The relay state for the grid should be specified either 0 or 1. Accordingly, PHCPV at time t should be less than or equal to the maximum grid power Pgrid-max:
2.3. V2H-HCPV Cost Benefit Model
Depending on its configuration, a SH is equipped with a battery that provides power and energy storage or a GEV that powers and maintains the home. The method predicts the efficiency of the GEV throughout the charging and discharging schedule to reduce the user’s energy expenditure. In [22], the authors suggested an optimization process for determining the electricity cost for each period using the mathematical Equation (2) (The assumption is that the energy demand will remain constant for the practical use of energy, Cnet,min is the cost of household electricity (in USD), CHas,SPE is the total cost of getting electricity (HAs, GEV, V2V) = 1, CHCPV,SPV is the cost of installing a HCPV system, and CHCPV,TR predicts total income for HCPV):
Rooftop solar PSPVt,s is computed by combining solar PSPVt,t at time t under typical rated conditions, SPV generated power, gSPV,s solar irradiance s, and average temperature TSPV,t rated under suitable conditions [38]. Where, PSPV,t indicates the SPV radiation at time t, and indicates the electricity temperature coefficient. It is written as Equation (3):
2.4. V2H Energy Balance Model
The energy stored at the end of time t is determined by Equation (4). In addition, the state of BT/V2H should reflect the amount of electricity remaining from the previous period (PST) and the charge/discharge in the period t. Similarly, g(t) is the efficiency of charging activities ∆c, and discharging ∆d is evaluated to lower net household expenditures on energy costs [34]. As a result, PST, the energy stored during time t, should be equal to PST (initial) which is the energy stored by the GEV at the beginning of period 1 (W/h). Here is a summary of the objective function:
2.5. Agent Renewable Energy System
We demonstrated a hybrid system capable of managing energy demand among a MG, a SPV unit, and vehicle energy storage (GEV) in real time. The proposed system is designed to ensure that it is efficient and responsive to energy changes using an MAS. In practice, as shown in Figure 2, each system component has an independent unit that monitors its state and communicates with the primary agent.
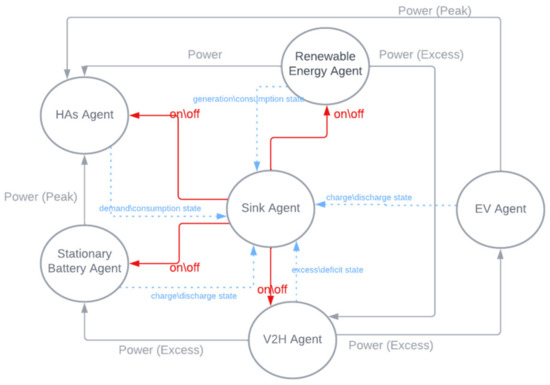
Figure 2.
Agent interactions.
- ▪
- The primary agent (sink) coordinates with intermediate-level agents (renewable agent, EV agent, V2H agent, and HAs agent). Each IA can communicate with other implementing agencies to coordinate energy supply and demand through the basin. Additionally, the shared power state must be sent to all connected agents.
- ▪
- The renewable energy agent collects real-time energy demand data to assess whether there is an energy surplus or deficit. The formula for estimating the rate of consumption for a particular purpose is given in Equation (5), where Ppv,comp indicates the SPV consumption rate in our situation; are the power consumption of the SPV and the GEV, respectively, at time t; is the consumption of SPV at total time T:
- ▪
- The EV agent is responsible for charging and discharging the GEV batteries, which can be charged via SPV or the grid [34]. For the GEV network power transfer, the battery charger capacity is determined by , where PGEV,t is the maximum power usage of a GEV when ψ2 is deactivated. When ψ3, the charging power (DGEV,i) must be less than the DGEV,i,max limit (Equation (6)). Further, the effectiveness of the charged and discharged activities is taken into account.
- ▪
- The V2H agent regulates the output power to provide backup power during power shortage conditions. The V2H unit involves a bi-directional charger to support the power converting function. The simulation considers a root mean square (RMS) 220 V for an AC supply and 350 V for the DC input at the front end. The battery is a hydrogen fuel cell 4.0 Ah capacity that contains 84 cells to produce from 0.5 to 0.08 V per cell.
The V2H agent is responsible for managing the nonlinear consumption of energy. The agent has complete control over the charging and discharging of the GEV battery. PC,i represents the maximum power required to charge a GEV battery. The battery’s capacity must be equal to or less than the power of charge/discharge (PBch/disch) The state of charge (SOCGEV) for GEV must meet certain conditions:
- ▪
- The minimum SOC of the GEV should be less than or equal to the charging and discharging efficiencies () of the maximum GEV’s SOC.
- ▪
- The SOC should meet the daily driving distance () to the maximum driving distance of the GEV ().
When SOCV2H,i was introduced, it was shown that a charging converter (V2H) was present (Equations (7) and (8)):
- ▪
- Stationary battery agent (SBA) is a lead-acid battery with 56 Ah capacity and 12 V voltage. It is capable of storing about 0.55 kWh of energy. Thus, this SB is responsible for storing excess energy and the SBA is activated when a power deficit occurs. Equation (4) defines the stored energy at the end of time t. In addition, the condition of the BT/V2H should reflect the amount of electricity remaining from the previous period and the charge/discharge in the period t. In addition, the efficiency of charge/discharge processes are considered [35], where ∆t is the period of the elementary level; PTR (t) is the amount of energy expended during trip at time t; Pc1, Pc2 are charged and discharged in time t (W/h).
- ▪
- The HA agent is a physical presence agent that monitors the total household energy demand determined through the use of appliances (shiftable and non-shiftable), as defined in Equation (9) [36], where PHAS represents the energy rating and αHAs represents the state of the HAs, then the daily electricity consumption PHAS,comp is expressed as:
Indeed, a MAS is a self-contained model consisting of many variables that cooperate to perform a complex task. Agents are used to accurately model consumption and production in response to changes in demand. Using a MAS, energy demand, system modeling, and simulation will be justified in order to coordinate the growth of energy storage in a way that benefits everyone. Table 1 summarizes the agents of the proposed system.

Table 1.
Agents and their roles.
3. HCPV Scheduling Algorithm
3.1. HAs Scheduling Controller Condition
The majority of SH devices must be effectively classified and managed to lower the total cost of electricity, give convenience to customers, and reduce communication time. Home appliances are categorized based on their impact on user convenience and configuration according to user preferences and operational scheduling constraints [36]. Intelligent devices are shiftable and non-shiftable. The schedules for dishwashers and televisions are different. Non-shiftable appliances, such as a refrigerator, are required to operate at specific times. The console schedules shiftable appliances, such as a dishwasher, to run when electricity is less expensive. The hurdles are user convenience, electrical cost, and the peak-to-average ratio [37]. The objective function is defined to achieve this goal. While operating off-grid, the proposed HCPV can give information and electricity via the smart home, BT/V2H, and power. This connection may increase peak traffic on the leading network. Applications outside the network can handle this problem. A smart home is associated with both shiftable and non-shiftable everyday gadgets.
3.2. Scenario-Based MAS Scheduling Algorithm
This section illustrates alternative power distribution states to highlight the significance of incorporating V2H as an alternative energy source inside the HCPV framework. Figure 3 depicts the charging and discharging models of V2H and GEV utilized in a smart home with or without an SPV power supply. Standard GEV charging, GEV charging supplemented by SPV, standard V2H charging and discharging, and normal V2H charging and discharging supplemented by SPV are the power distribution states in this context. These states stipulate additional overall expenditures and energy balance standards, which necessitate appropriate scheduling patterns depending on specific scenarios. Our proposed framework tries to comprehend the impact of HCPV and V2H on power use efficiency while reducing expenditures. Included is real-time monitoring of the GEV’s produced and consumed power and power exchange among the microgrid, H2V, GEV, and SPV. A GEV form and a V2H form are submitted at a standard home.
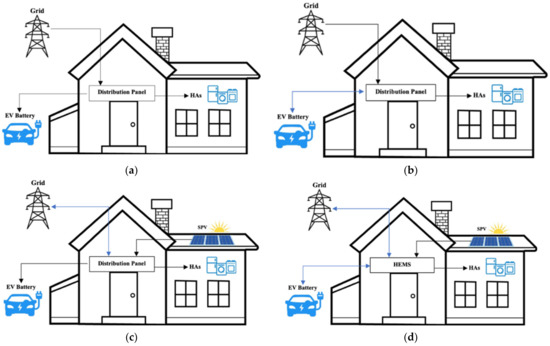
Figure 3.
Energy flow in four different cases at a smart house. (a) State 1: standard GEV charging. (b) State 2: standard V2H charging/discharging. (c) State 3: GEV charging supplemented by SPV. (d) State 4: V2H charging/discharging supplemented by SPV.
3.2.1. State 1: Standard GEV Charging
This state is devoid of SPV sources. In the conventional GEV charging state, both the intelligent home and GEV charging are powered by the utility grid. Consequently, the sink and EV agents collaborate with the HAs agent to regulate the supply and schedule, the net cost of utilizing electricity (Cnet,min). Equation (10) forecasts the average charging model for State 1, given that CHCPV-TR = 0.
The variables Pr, PEL, , and SOC represent the HAs power load at time j, the electricity price at time j, the GEV state of charge, and the electricity price over 24 h, respectively. Moreover, the interaction between GEV and the grid ensures proper energy flow distribution (ΩSPV = 0), as seen in Figure 3a. While the SOC is integrated, grid electricity will charge the V2H/BT. To prevent the charger/converter from sustaining damage, the CGEV,max measurement in Equations (6) and (7) regulate the power flow. If SOC is less than the maximum SOCGEV, the leftover power can charge the GEV/battery. Ultimately, excess electricity is provided by the grid.
3.2.2. State 2: Standard V2H Charging/Discharging
During normal conditions, V2H supplies the energy to HAs without the inclusion of SPV, while the energy exchanged is sourced only from the grid. Therefore, the sink and V2H agents work with the HAs agents to manage the supply and timetable. In this state, the GEV supplies power to the HAs with a minimum state of charge (SOC(V2H),min) such that the total spending CHAs,SPE = . Consequently, Equation (11) is utilized to determine the total cost of :
The spending SPV and the grid produce the HA loads during particular time intervals (TSPV, TGEV). TSPV is the usual period, and TGPP is the nighttime peak period. In Equation (12), ∑Ωi is the installation cost (kW) (Ω = on (1), Ω = off (0), I ε [0 or 1]); indicates the net capacity, and g (δ) is the investment interest rate (1/Year (SPV lifespan)).
3.2.3. State 3: GEV Charging Supplemented by SPV
SPV and GEV provide power to the HAs in this state, whereas only grid power is used for power exchange (see Figure 3c). SPV can power the HAs, whereas GEV is mostly a load (V2H = 0 and GEV = 0). Similarly, the sink, EV, and renewable energy agents collaborate with the HAs agent to manage the supply and schedule. Therefore, Equation (13) forecasts the total cost as CHAs, SPE ()where Cnet, min = :
3.2.4. State 4: V2H Charging/Discharging Supplemented by SPV
As indicated in Figure 3d, in this scenario, SPV, V2H/GEV, and the grid provide electricity to the HAs. As a result, the sink, renewable energy, V2H, and EV agents collaborate with the HAs agent to regulate the supply and schedule. Consequently, Cnet,min = and Equation (14) are used to anticipate the entire expense of (). Furthermore, the total revenue of CHCPV-V2H = :
As compared with State 1, States 3 and 4 permit SPV to charge GEVs, which is more environmentally beneficial. However, merging V2H with HCPV mitigates economic obstacles, decreases emissions, and conserves energy. There is no difference in travel time or energy consumption across the scenarios. Additionally, V2H/GEV offers energy for the house load in addition to SPV and the grid. It can store the extra SPV energy in an electrical battery in the home’s power supply. This helps the user optimize their revenue. Figure 4 depicts the entire system behavior of agents’ communication and coordination, used to make the most suitable decisions. Each agent checks the energy consumption of each SG component. The state of each element is then communicated to the supervisor (sink) agent to coordinate the conditions of other agents. On the one hand, if a shortage in SPV power (Pspv) is detected, the GEV agent will be activated to supply the power requirement. On the other hand, the SBA agent will be contacted if there is an excess of power.
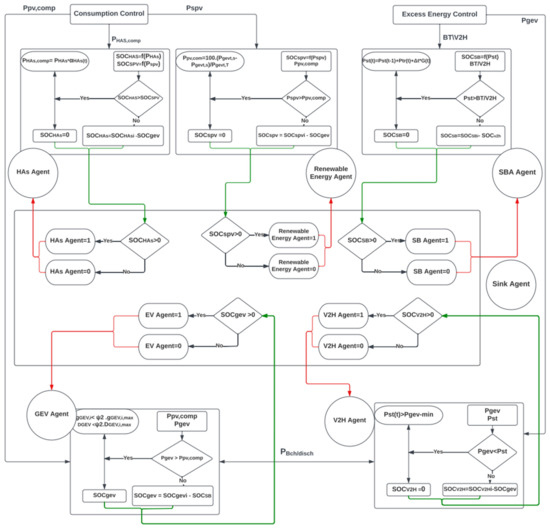
Figure 4.
HCPV scheduling algorithm.
4. Results and Discussion
In this study, electrical appliances, solar, GEV, and storage systems were all considered. The experimental simulation extracted accurate solar radiation and outdoor temperature profiles over four days from a Saudi meteorological database [38] (see Table A1). The consumption characteristics of major household appliances are depicted in Figure 5d. Indeed, this section contains simulation results that demonstrate the performance and efficiency of the proposed algorithm in reducing the daily electricity cost of a smart home. This study completed its calculations in less than 96 h. Bright sunlight and temperature data were derived from an experimental database. For simplicity, daily solar meteorological data were used to calculate the projected solar output curve during the summer and winter, as shown in Figure 5c,which shows that input irradiance is about 0.8–0.10 W/m2 during the period from 8 a.m. to 3 p.m. Figure 5d represents the total consumption, which reaches 10 kW during summer and 8 kW during winter.
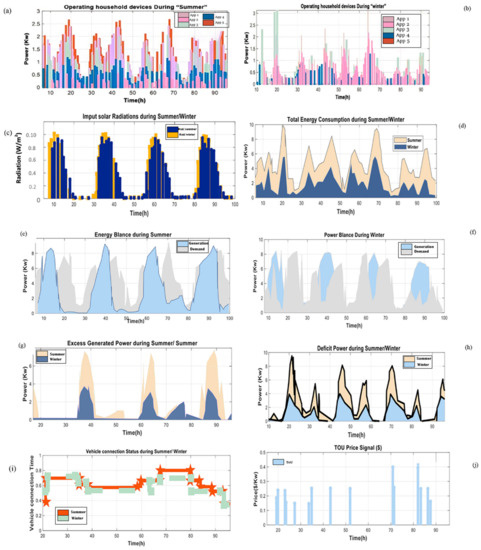
Figure 5.
Input experimental profiles during “winter” and “summer”: (a,b) Operating household devices; (c) input solar radiation; (d) total energy consumption; (e,f) power balance; (g) excess generated power; (h) deficit generated power; (i) vehicle connection status; (j) TOU price.
Our study also found that household electricity use is higher in the summer months based on near-real-time electricity consumption data. In comparison, during winter, the electrical load by hour varies less, but peaks in the morning and evening. As a result, household energy consumption in the summer and winter were as expected in this study, as shown in Figure 5a,b. Electric vehicles are assumed to be charged only at home, and the appropriate charging level for the EV in the home is between 1.5 and 5 kW. The daily travel distance of an electric car is assumed to be 60 miles, which is the average distance of a trip in the Saud Arabia. Additionally, it is assumed that the electric car leaves the house at 8:00 a.m., returns at noon, departs again at 2:00 p.m., and returns at 5:00 p.m., as illustrated in (Figure 5i).
A behavioral system was analyzed, and its ability to respond reliably to diverse energy needs was determined by measuring the balance between production and demand. In fact, Figure 5e,f show the energy balance achieved between demand and production between winter and summer, allowing the system condition to be examined and controlled (excess/deficit). The excess and deficit transition phases are depicted in Figure 5g,h during the operation of the system in winter and summer, respectively. Thus, the EMS’s supervision of the transition between states determines the energy distribution flows and the behavior of the system.
The home energy price signal is illustrated in Figure 5j, which depicts time-of-use (TOU) charges for resident users. This figure demonstrates the energy pricing pattern with term TOU at different periods during the day, including off-peak, average, and peak prices. The figure shows high prices during on-peak as compared with those in Figure 5e,f when the demand exceeded the generation. It incentivizes users to charge their stationery battery energy storage and EV at low electricity rates, which can then be used to meet load demands or resold to the grid at high electricity prices for economic gain.
4.1. Load Scheduling Capability Analysis
The load distributions of appliances (shiftable and non-shiftable) depending on time slots are shown in Table 2. During the first and second periods, the shiftable appliances used approximately 19.1 KW. While the total number of times ahead is equal to 24 times, the time intervals required for each device to function are shown in the same table. Figure 6 illustrates the appropriate home load scheduling profile. These households execute their given duties efficiently within the specified periods, and even non-shiftable homes operate continuously. Most homes run when the amount of power generated by SPV panels is high; 9 a.m.–3 p.m., according to Figure 5e, or the real-time energy price is low during off-peak periods, according to Figure 5j. Similarly, SPV power is employed to balance home power usage before it can be used to charge V2H. Table 2 shows the operating intervals for each device, with a total of 24 times ahead. Indeed, it summarizes the household attributes and total usage time according to the appropriate schedule.
Table 2.
Household parameters (non-shiftable appliances are highlighted with gray color) [39].
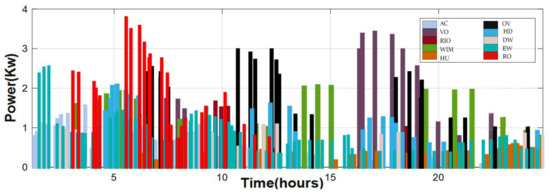
Figure 6.
The optimal household load-scheduling pattern.
4.2. Impact of V2H/GEV on Household Energy Consumption
In the above scenarios, SPV energy is used to improve household energy consumption, and therefore, SPV energy is used to charge the V2H (see Figure 7). If SPV surplus remains, it is sold back to the grid, as shown in Figure 7a. Additionally, by 8 p.m., the power generated by the home SPV panels is minimum or non-existent, which requires charging the GEV through the grid (Figure 7b). Thus, the proposed HCPV system can be considered to be a financial benefit to domestic consumers and, at the same time, promotes the use of renewable energy during the periods of 8:35 a.m., 9:50 a.m., 5 p.m., 6:30 p.m., and 8 p.m. Indeed, it provides power data from the V2H to either meet the total power required or contributes during insufficient power. Since SPV production is sufficient to power the required homes, there is no need to purchase additional electricity from the grid during other high-cost periods such as 12:35 a.m. and 3:32 p.m. Due to V2H’s limited capacity and SPV output depending on the intensity of sunlight, V2H cannot be charged until 7:40 a.m. the day before with no SPV production and no additional electricity. For example, at around 8 p.m., the GEV helps V2H discharge, thus, reducing the power consumed by the network during peak hours, as shown in Figure 7a,b. The GEV is charged only during low hourly cost periods (Figure 7b). Preparing the battery to its full charge before departure guarantees driver satisfaction. Its stored capacity and charging/discharging force are within the mentioned limitations. Specific V2H and GEV discharge cost limits reduce charge/discharge cycles, thereby, increasing battery life. The interaction between the grid and HEMS is presented (Figure 7a,b).
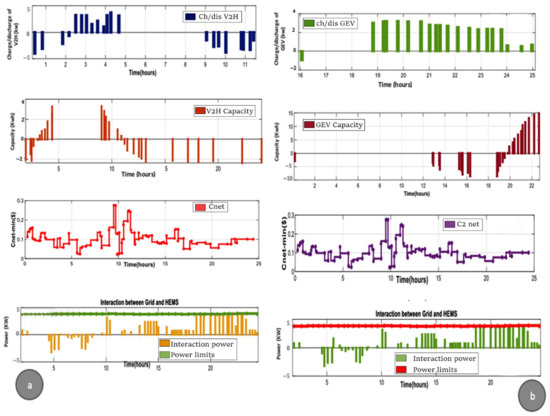
Figure 7.
Amount of charging/discharging power (a,b); overall power storage capacity of V2H/V2G (a,b); amount of power traded between Grid and HEMS (a,b).
4.3. Transferring SPV by V2H during Four Scenarios
The V2H/BT is charged in Figure 8 to power the monitoring appliances. Before the micro-grid expands and retracts with GEV, the V2H/BT is discharged between 7:30 a.m. and 8:00 a.m. The V2H/BT is charged to power the supervisory devices, as depicted. Before GEV was identified and attached to the micro-grid, V2H/BT was discharged between 7:30 a.m. and 8:00 a.m. Scenario A shows that GEV and microgrid energy exchange was not required during this period, hence, relays ψ2 and ψ4 remained available. However, as solar energy exceeded demand, the SOCV2H began to recharge, as shown in Scenario B. This value dropped again around 5:00 p.m. The charge lowers swiftly to 600 W at 1:30 p.m., allowing the SOCGEV to improve to 68%. Extending GEV charging hours at night or during peak periods increases grid power demand when the GEV battery powers the residence. In Scenario C, the GEV may deposit extra SPV power in the V2H battery and use it when solar is available to support the home during power outages. Scenario D shows how V2H and SPV impact on household electricity use can substantially lower peak demand. This is twice the price of residential electricity in Saudi Arabia. V2H’s highest energy delivery will increase demand while saving money.
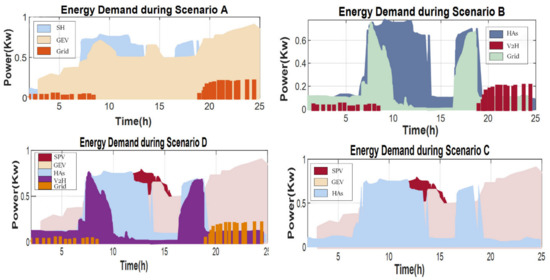
Figure 8.
HCPV energy demand during four scenarios.
4.4. Impact of Travel Distance on V2H
In Saudi Arabia, scheduling day trips are divided into three categories: (1) average travel distances of 80, 120, and 180 km are calculated for ease of calculation. Vehicle motion activity is vital to perfect vehicle control as this varies greatly. Due to the expansion of the public transport system in Saudi Arabia, the population is highly dependent on such transportation, however, private car trips are simple. Therefore, vehicle travel characteristics vary on weekends and business days. Vehicle travel affects SoCV2H for short, medium, and long trips (Figure 9):
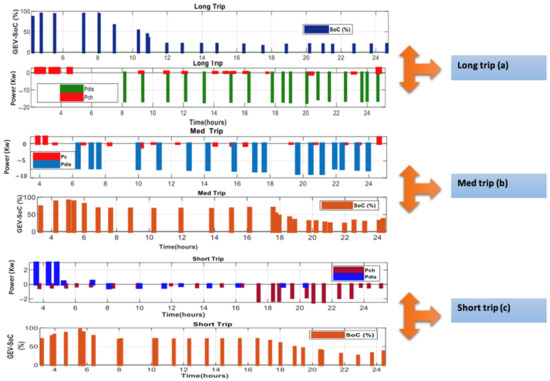
Figure 9.
Influence of the travel distance on SoCV2H.
- -
- Short travel distance, the SOCV2H starts dropping less than 50% from 7:30 p.m.;
- -
- Medium travel distance, the SOCV2H starts dropping less than 50% from 6 p.m.;
- -
- Long travel distance, the SOCV2H starts dropping less than 50% from 10:30 a.m.
Generally, full-day load power distribution and excess solar energy distribution vary for different climatic conditions: sunny or cloudy. The maximum demand for household energy is between 5 p.m. and 10 p.m.
4.5. Analysis of Energy Flows and Cost Expenditure
4.5.1. State 1: Standard GEV Charging
The GEV is discharged with the grid from 7:30 to 8:00 a.m. No power exchange is required either for the vehicle or the grid. The HAs load subsequently increased by 700 W. The GEV fulfilled the lowest demand for energy. The solar energy peaked around 10:00 a.m. When solar energy exceeded the demand for HAs load, SOCGEV began charging. The result of this mode is shown in Figure 10a. Due to limitations of the bi-directional charger, the charging schedule was optimized. Surplus energy was saved, and the demand for the GEV increased by 3 kW (see Figure A2). The household battery has a maximum charging capacity of 3 kW. The fee is terminated when the SOC is 10%. The model shows batteries charging when SPV is available; the power price is low at night, while peak demand occurs during charging, as shown in Figure 10a. Peak demand is limited to the maximum charging rate of each system.
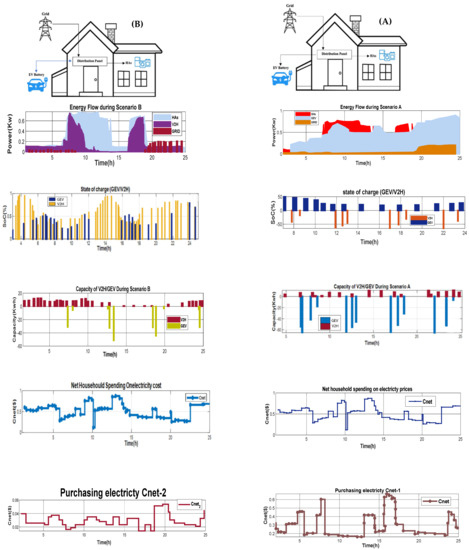
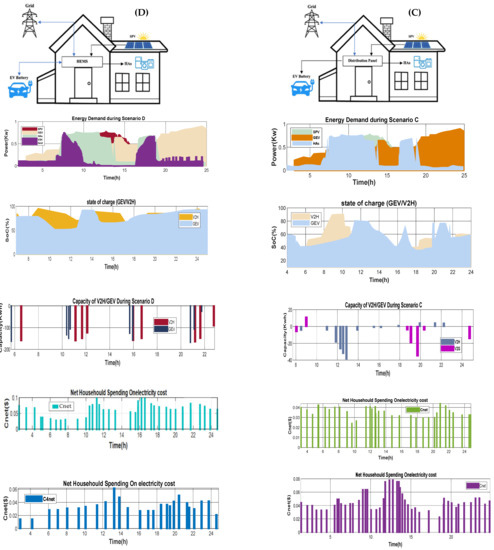
Figure 10.
Energy flows and cost expenditure comparison for the four scenarios (A) Energy flows and cost expenditure of Scenario A (B) Energy flows and cost expenditure of Scenario B (C) Energy flows and cost expenditure of Scenario C (D) Energy flows and cost expenditure of Scenario D.
4.5.2. State 2: Standard V2H Charging/Discharging
The BT/V2H and V2G can be charged from the grid at night. This reduced the energy required to assess the vehicle. The GEV and grid became available to set the V2H due to when the GEV was fully charged. As stated before, the higher profit potential more than offsets the increased power usage. SoCGEV and SoCV2H remained at 28% and 82%, respectively; thus, the GEV was nearly empty (Pc,max = PGEV,min). Figure 10b shows the peaking requirements of up to 3 kW (the V2H’s maximum charge limit) and 2.8 kW, and 2.9 kW (the V2H’s maximum charge limit). When applied on the V2H, this tariff’s SOC stays above 40% for approximately 24 h. In the GEV, SOC dips below 40% for nearly a day.
4.5.3. State 3: GEV Charging Supplemented by SPV
The SPV in this scenario interacted with the GEV and GEV-supported HAs, replacing only grid power, Cnet, with a minimum of . Equation (13) estimated the total number of CHAs and SPEs (). SPV may power the house in this case, while the GEV is mostly loaded (V2H = 0). Figure 10c shows the SPV smart home system and grid power supply system (see Figure 10c). The SPV/V2H may be charged from the network at night. This significantly reduced the amount of energy required to charge the car at home. Since the GEV was sometimes fully charged, more solar energy was available to charge the GEV/V2H (Pc,max = Pmax GEV). Microgrid usage rises, but potential profits offset this. SoCGEV and SoCV2H remained at 28% and 80%, respectively, with the GEV almost completely depleted in Figure 10c because of this situation. The bulk tariff in Figure 10c shows requirements of up to 6 kW (maximum charging) and peak requirements of up to 5 kW in the middle of the afternoon and at night, when electricity prices drop almost every day because of dynamic changes in electricity prices. Due to higher SOC levels on most days, charging at night is less frequent with this tariff than with the previous two. In contrast to time-of-day prices, the dynamic adjustment in energy currency values at the slightest rise in demand peaks throughout most of the week.
4.5.4. State 4: V2H Charging/Discharging Supplemented by SPV
SPVs interact with HA groups in this scenario, SPVs interact with V2H groups, and V2H/GEV communicate with the HA groups. In terms of Cnet,min = , Equation (14) contains the projected total expenditures for all health and social service entities (HSSEs) (). In addition, CHCPV-V2H is equivalent to . By 7:00 p.m., this project will be fully powered by renewable energy. V2G options are available from 8:00 a.m. to 8:00 p.m., while V2H is available all night. Because of V2G, energy savings of 40% were achieved. However, it is necessary to evaluate the amount of energy used in the house. V2G is an efficient way to save energy when the GEV and SPV are insufficient to meet demand. Although the number of cars lost due to SPV (Pmin-ch) charging and discharging is significant, the cost-effectiveness of this solution depends on whether energy rates are low at night or during the day. When refilling the V2H, an electric car driver may return to base overnight (Pmax-ch). SOCV2H had a 46% success rate when the SPV was low. The GEV is completely discharged from about 7:00 a.m. The V2H will be charged until 10:00 a.m. The GEV charging will start at 10:00 a.m. and will be activated at 7:00 p.m. The result of this situation is shown in Figure 10d.
To sum up, the four scenarios have been compared in terms of energy demand, SoC and capacity of V2H and the GEV, net household spending electricity cost, and net purchasing electricity cost. The bi-directional power converter used for the V2H unit in Scenarios B and D minimizes the energy required to assess the GEV as compared with Scenarios A and C. However, Scenario D depends on RnEs which significantly impact the SOCGEV and SOCV2H. Scenario C performs better than Scenarios A and B in term of frequent charging at night due to sufficient SOC levels from SPV power generation. Scenarios A and B are highly affected by the TOU tariffs, whereas Scenarios C and D are affected by whether energy rates are low at night or during the day.
4.6. Daily Household Electricity Expenditure
Figure 11 illustrates how much household power is consumed in each trip, the average home energy Cnet, and the minimum cost in each trip. Additionally, Cnet increases in value because of the GEV trip. The typical annual residential energy cost (Cnet,min) is shown in Figure 11a,b. Minor- and travel-related minimums decrease by 28%, 23%, and 19%, respectively, for V2H without SPV and by 24%, 19.9%, and 9.97%, respectively. Both Scenarios A and B are recommended for medium- and long-distance travel. When both are operated from a single power source, the SPV mode has a lower cost of spending than the V2H mode. Grid power and SPV sales cost are different, with the latter having higher point pricing. Annual net expenditures with SPV decreased by 38%, 30.9%, and 31.5%, respectively, due to SPV’s superior cost performance. During short trips, travel lowers Cnet by 51, 42, and 40.2%, respectively. On the other hand, medium trips reduce the annual Cnet by 50.5%, 41.5%, and 30%, respectively. The yearly Cnet in SPV-V2H mode decreased by 48.5%, 46.85%, and 31%, respectively, while travelling long distances. Along with the economic advantages of utilizing V2H with SPV for different modes of transport, the data below demonstrate the technology’s potential. Additionally, weather impacts HCPV income and sustainable energy use.
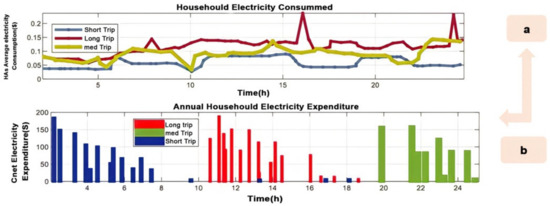
Figure 11.
(a) Household annual average cost during long, medium, and short trips; (b) annual HCPV electricity expenditure.
However, energy sustainability using V2H technology has its limitation as the SG depends on the GEV existence and being plugged in. Thus, including prediction of the GEV driving patterns and DR is vital to balance the demand and response. Furthermore, uncertainty of solar power generation, load, market prices and user behavior should be considered during scheduling to optimize energy management.
5. Conclusions
This study employs V2H technology to discuss the impact of renewable energy systems, which can better handle peak energy demand while simultaneously reducing prices. The HCPV solar energy and energy recovery systems were set up with this in mind. The backup energy recovery device recovers deficit power (V2H). A power shortage is alleviated thanks to V2H energy harvesting during peak hours. Additionally, our work designed and implemented an accurate HEMS strategy. The proposed approach aims to regulate energy production and consumption. Thus, the HCPV system is based on the two operating modes: storage and recovery. There is no doubt that the proposed approach can intelligently manage the proposed system to prevent unexpected fluctuations. The effects of V2H and/or HCPV on residential energy consumption and net electricity consumption are explored and discussed. In addition to driving hours, the weather is also considered for the GEV. The obtained results demonstrate that the HCPV system provides acceptable quality charging power with resistance to unwanted fluctuations, as recommended by the HEMS. Our proposed algorithm shows that energy savings up to 40% were achieved when V2H is integrated with an intelligent HEMS. Furthermore, the MAS simulation indicates that the state of charge of V2H had a 46% success rate when the solar power generation was low.
Future research should focus on embedded systems due to delays in these systems. Real-time operations save money and energy while improving power design based on variations in how electricity is metered.
Author Contributions
O.A. planned the presented idea and wrote the manuscript with support from S.B.S. and B.Z. who contributed to the original draft preparation, supervised the findings, and final revisions. All authors have read and agreed to the published version of the manuscript.
Funding
This research received no external funding.
Institutional Review Board Statement
Not applicable.
Informed Consent Statement
Not applicable.
Data Availability Statement
Not applicable.
Conflicts of Interest
The authors declare no conflict of interest.
Nomenclature
| Acronyms | |
| HCPV | Home centralized PV |
| MAS | Multi-agent system |
| IA | Intelligent agent |
| GEV | Green electric vehicle |
| SPV | Solar photovoltaic |
| HEMS | Home energy management |
| HAs | Home appliances |
| SH | Smart home |
| SB | Stationary battery |
| MG | Microgrid |
| SG | Smart grid |
| V2H | Vehicle-to-home |
| RnEs | Renewable energies |
| Ah | amp hours |
| Sets | |
| PHCPV,I | Grid power requirement |
| gHome,i | Home electricity demand |
| PSPVt,s | SPV supply |
| ψ1,2,3 | Relay states 0/1 |
| I | Time index |
| δ | Discharge depth |
| S(i) | V2H/GEV state in/out |
| SOC | State of charge |
| T | Maximum discharge |
| PCmax | Max power for charging |
| PBch/disch- | max: Max battery |
| Ts (s) | Starting Time Interval |
| Cnet-min | Household elec. costs |
| PHCPV,I | Grid power requirement |
| Parameters | |
| PPV,comp | SPV consumption rate |
| PSPV,T | Total SPV energy all/days |
| δSPV | Investment cost ($/Kw) |
| PBch/disch,i | Battery capacity, KW |
| SPVt,s | Solar power supply |
| PC,i | Maximum amount of energy |
| PST | Saved power during time t |
| gGEV,i | V2H-PEV battery charger |
| ηch/ηdisch | Charging/discharging (%) |
| χ | Daily driving distance (KM) |
| Dβ | GEV max-distance (KM) |
| CHAs-SPE | Total sp on purchasing |
| CHCPV-SPV | Cost of installation |
| CHCPV-TR | Forecasts total revenue |
| PSPVt,s | Solar power at time t |
| GSPVt,s | Solar irradiance |
| Average Temperature | |
| PSPV,t | SPV irradiance at time t |
| Prated | Output power rated (KW) |
| GGEV,i,max | Max V2H-PEV charger |
| ∆c | Charge |
| ∆d | Discharge |
Appendix A

Figure A1.
(a) Simulink prototype; (b) PIL simulation under STM32; (c) model generation.
Figure A1.
(a) Simulink prototype; (b) PIL simulation under STM32; (c) model generation.


Figure A2.
Hourly surplus GPV power during sunny and rainy periods.
Figure A2.
Hourly surplus GPV power during sunny and rainy periods.

Appendix B
Table A1.
Input parameters of HCPV system.
Table A1.
Input parameters of HCPV system.
| Items | Parameters |
|---|---|
| HCPV System Technical Parameters | |
| SPV related power | 1.0 Kw |
| Interest rate | 4.80% |
| HCPV lifetime | 25.0 |
| Rated Capacity: gratedSPV (KW) | 8.02 Kw |
| Investment cost (δSPV) ($/KW) | 769.0 $/KW |
| SPV Cell Numbers | Ns 3; Np 6 |
| PGrid,max (Kw) | 9725 Kw |
| GEV Technical Specifications | |
| V2H Energy Efficiency (KWh/100 Km) | 10.0 KWh/100 Km |
| PchmaxGEV (KW) = 5.0 | CMaxGEV (KW) = 30 |
| PDismaxV2H (KW) = 0.95 | CMinGEV (KW) = 5.0 |
| ηchGEV/ηdischGEV= | |
| Cdisnet (RTPGEV) = 1.85 RTPAvg | |
| Daily Driving Distance (Km) | 32.0 Km |
| Maximum Charging Power (PBdichmax) (Kw) | 3.0 Kw |
| SoCV2H-min (%) | 19% |
| SoCV2H-max (%) | 90% |
| SOCGEV Range | 30~80% |
| GEV Technical Specifications | |
| Weather Data | From 2014 to 2019 |
| CMaxV2H (KW) = 8.0 | ηchV2H/ηdischV2H= |
| CMinV2H (KW) = 3.0 | Cdisnet(RTPV2H) = 1.2 RTPAvg |
| PchmaxV2H (KW) = −3.5 | CMaxV2H (KW) = 8.0 |
| PDismaxV2H (KW) = 0.95 | |
| Probability Distribution of Daily Travel Behavior | |
| GEV parked Home (H) | From 7 p.m. to 7 a.m. |
| Short Distances Km | 8~30 km |
| medium distances Km | 50~80 km |
| Long Distance Km | 100~120 km |
References
- Dawoud, S.M. Developing different hybrid renewable sources of residential loads as a reliable method to realize energy sustainability. Alex. Eng. J. 2021, 60, 2435–2445. [Google Scholar] [CrossRef]
- Torres, J.F.; Troncoso, A.; Koprinska, I.; Wang, Z.; Martínez-Álvarez, F. Big data solar power forecasting based on deep learning and multiple data sources. Expert Syst. 2019, 36, e12394. [Google Scholar] [CrossRef]
- Saoud, A.; Recioui, A. Hybrid algorithm for cloud-fog system based load balancing in smart grids. Bull. Electr. Eng. Inform. 2022, 11, 477–487. [Google Scholar] [CrossRef]
- Recioui, A.; Dekhandji, F.Z. Implementation of Load Control for Smart Metering in Smart Grids. In Optimizing and Measuring Smart Grid Operation and Control; IGI Global: Hershey, PA, USA, 2021; pp. 119–155. [Google Scholar]
- Shakir, H.H.; Zdiri, M.A.; Salem, F.B. Optimal Energy Management of Smart Grid Connected Residential PV Power System. In Proceedings of the 2021 12th International Renewable Energy Congress (IREC), Hammamet, Tunisia, 26–28 October 2021; pp. 1–4. [Google Scholar]
- Sharda, S.; Sharma, K.; Singh, M. A Real-Time Automated Scheduling Algorithm with PV Integration for Smart Home Prosumers. J. Build. Eng. 2021, 44, 102828. [Google Scholar] [CrossRef]
- Toquica, D.; Agbossou, K.; Malhamé, R.; Henao, N.; Kelouwani, S.; Cárdenas, D.C.T. Adaptive Machine Learning for Automated Modeling of Residential Prosumer Agents. Energies 2020, 13, 2250. [Google Scholar] [CrossRef]
- De Luca, G.; Ballarini, I.; Paragamyan, A.; Pellegrino, A.; Corrado, V. On the improvement of indoor environmental quality, energy performance and costs for a commercial nearly zero-energy building. Sci. Technol. Built Environ. 2021, 27, 1056–1074. [Google Scholar] [CrossRef]
- Nematchoua, M.K.; Nishimwe, A.M.-R.; Reiter, S. Towards nearly zero-energy residential neighbourhoods in the European Union: A case study. Renew. Sustain. Energy Rev. 2020, 135, 110198. [Google Scholar] [CrossRef]
- Luo, F.; Kong, W.; Ranzi, G.; Dong, Z.Y. Optimal Home Energy Management System With Demand Charge Tariff and Appliance Operational Dependencies. IEEE Trans. Smart Grid 2019, 11, 4–14. [Google Scholar] [CrossRef]
- Javadi, M.S.; Gough, M.; Lotfi, M.; Nezhad, A.E.; Santos, S.F.; Catalão, J.P. Optimal self-scheduling of home energy management system in the presence of photovoltaic power generation and batteries. Energy 2020, 210, 118568. [Google Scholar] [CrossRef]
- Ramalingam, S.P.; Shanmugam, P.K. A Home Energy Management System with Peak Demand Reduction Using Ant Colony Optimization and Time of Use Pricing Scheme. In Soft Computing for Problem Solving; Springer: Berlin, Germany, 2021; pp. 531–546. [Google Scholar]
- Jiang, Y.; Song, L.; Allen, J.K.; Mistree, F. Home Energy Management System (HEMS): Coupled Flexible Load Management in Homes. In Proceedings of the International Design Engineering Technical Conferences and Computers and Information in Engineering Conference, Online, 17–19 August 2021; Volume 85413, p. V005T05A016. [Google Scholar]
- Abdelwahed, A.S.; Zekry, A.; Amer, G.M.; Tawfeek, R.M. Implementation of a Priority-Based Home Energy Management System. In Proceedings of the 2021 International Mobile, Intelligent, and Ubiquitous Computing Conference (MIUCC), Cairo, Egypt, 26–27 May 2021; pp. 84–89. [Google Scholar]
- Shakir, M.; Biletskiy, Y. Smart Microgrid Architecture For Home Energy Management System. In Proceedings of the 2021 IEEE Energy Conversion Congress and Exposition (ECCE), Vancouver, BC, Canada, 10–14 October 2021; pp. 808–813. [Google Scholar]
- Alıç, O.; Filik, B. A multi-objective home energy management system for explicit cost-comfort analysis considering appliance category-based discomfort models and demand response programs. Energy Build. 2021, 240, 110868. [Google Scholar] [CrossRef]
- Diyan, M.; Khan, M.; Zhenbo, C.; Silva, B.N.; Han, J.; Han, K.J. Intelligent Home Energy Management System Based on Bi-directional Long-Short Term Memory and Reinforcement Learning. In Proceedings of the 2021 International Conference on Information Networking (ICOIN), Jeju Island, Korea, 13–16 January 2021; pp. 782–787. [Google Scholar]
- Chioran, D.; Valean, H. Design and Performance Evaluation of a Home Energy Management System for Power Saving. Energies 2021, 14, 1668. [Google Scholar] [CrossRef]
- Hussain, M.M.; Akram, R.; Memon, Z.A.; Nazir, M.H.; Javed, W.; Siddique, M. Demand Side Management Techniques for Home Energy Management Systems for Smart Cities. Sustainability 2021, 13, 11740. [Google Scholar] [CrossRef]
- Rocha, H.R.; Honorato, I.H.; Fiorotti, R.; Celeste, W.C.; Silvestre, L.J.; Silva, J.A. An Artificial Intelligence based scheduling algorithm for demand-side energy management in Smart Homes. Appl. Energy 2020, 282, 116145. [Google Scholar] [CrossRef]
- Martins, S.; Rossetti, R.J.F.; Kokkinogenis, Z. A Resource-Based Model for Home Energy Management Using Multi-Agent Systems. In Proceedings of the 2021 IEEE International Smart Cities Conference (ISC2), Online, 7–10 September 2021; pp. 1–4. [Google Scholar]
- Zunnurain, I.; Maruf, N.I.; Rahman, M.; Shafiullah, G. Implementation of Advanced Demand Side Management for Microgrid Incorporating Demand Response and Home Energy Management System. Infrastructures 2018, 3, 50. [Google Scholar] [CrossRef]
- Liu, X.; Wu, Y.; Wu, H. PV-EV Integrated Home Energy Management Considering Residential Occupant Behaviors. Sustainability 2021, 13, 13826. [Google Scholar] [CrossRef]
- Hou, X.; Wang, J.; Huang, T.; Wang, T.; Wang, P. Smart Home Energy Management Optimization Method Considering Energy Storage and Electric Vehicle. IEEE Access 2019, 7, 144010–144020. [Google Scholar] [CrossRef]
- Blonsky, M.; Munankarmi, P.; Balamurugan, S.P. Incorporating Residential Smart Electric Vehicle Charging in Home Energy Management Systems. In Proceedings of the 2021 IEEE Green Technologies Conference (GreenTech), Online, 7–9 April 2021; pp. 187–194. [Google Scholar]
- Dagdougui, Y.; Ouammi, A.; Benchrifa, R. High Level Controller-Based Energy Management for a Smart Building Integrated Microgrid With Electric Vehicle. Front. Energy Res. 2020, 8, 248. [Google Scholar] [CrossRef]
- Ekrekli, M.A.; Dikmeçli, A.K.; Kökten, E.; Pınar, A.; Ürkmez, B.; Savut, D. A V2H Controller: Chargine, Technical Report. Available online: https://www.researchgate.net/publication/348779630_A_V2H_Controller_Chargine/ (accessed on 12 October 2022).
- Mehrjerdi, H.; Hemmati, R. Coordination of vehicle-to-home and renewable capacity resources for energy management in resilience and self-healing building. Renew. Energy 2019, 146, 568–579. [Google Scholar] [CrossRef]
- Yang, Y.; Wang, S. Resilient residential energy management with vehicle-to-home and photovoltaic uncertainty. Int. J. Electr. Power Energy Syst. 2021, 132, 107206. [Google Scholar] [CrossRef]
- Datta, U.; Saiprasad, N.; Kalam, A.; Shi, J.; Zayegh, A. A price-regulated electric vehicle charge-discharge strategy for G2V, V2H, and V2G. Int. J. Energy Res. 2019, 43, 1032–1042. [Google Scholar] [CrossRef]
- Rochd, A.; Benazzouz, A.; Abdelmoula, I.A.; Raihani, A.; Ghennioui, A.; Naimi, Z.; Ikken, B. Design and implementation of an AI-based & IoT-enabled Home Energy Management System: A case study in Benguerir—Morocco. Energy Rep. 2021, 7, 699–719. [Google Scholar]
- Qiu, D.; Ye, Y.; Papadaskalopoulos, D.; Strbac, G. Scalable coordinated management of peer-to-peer energy trading: A multi-cluster deep reinforcement learning approach. Appl. Energy 2021, 292, 116940. [Google Scholar] [CrossRef]
- Slama, S.A.B. Design and implementation of home energy management system using vehicle to home (H2V) approach. J. Clean. Prod. 2021, 312, 127792. [Google Scholar]
- Gedefa, T.; Melka, Y.; Sime, G. Cost-Benefit Analysis and Financial Viability of Household Biogas Plant Installation in Aleta Wondo District, Southern Ethiopia. Rearch Sq. 2021. [Google Scholar] [CrossRef]
- Shemami, M.S.; Alam, M.S.; Asghar, M.S.J. Reliable Residential Backup Power Control System Through Home to Plug-In Electric Vehicle (H2V). Technol. Econ. Smart Grids Sustain. Energy 2018, 3, 8. [Google Scholar] [CrossRef]
- Jamil, A.; Alghamdi, T.A.; Khan, Z.A.; Javaid, S.; Haseeb, A.; Wadud, Z.; Javaid, N. An Innovative Home Energy Management Model with Coordination among Appliances using Game Theory. Sustainability 2019, 11, 6287. [Google Scholar] [CrossRef]
- Tutkun, N.; Burgio, A.; Jasinski, M.; Leonowicz, Z.; Jasinska, E. Intelligent Scheduling of Smart Home Appliances Based on Demand Response Considering the Cost and Peak-to-Average Ratio in Residential Homes. Energies 2021, 14, 8510. [Google Scholar] [CrossRef]
- Saudi Meterology Dataset. The General Authority of Meteorology and Environmental Protection. 2019. Available online: https://data.gov.sa/Data/en/organization/ (accessed on 12 October 2022).
- Liu, Y.; Xiao, B.; Yao, G.; Bu, S. Pricing-based demand response for a smart home with various types of household appliances considering customer satisfaction. IEEE Access 2019, 7, 86463–86472. [Google Scholar] [CrossRef]


Publisher’s Note: MDPI stays neutral with regard to jurisdictional claims in published maps and institutional affiliations. |
© 2022 by the authors. Licensee MDPI, Basel, Switzerland. This article is an open access article distributed under the terms and conditions of the Creative Commons Attribution (CC BY) license (https://creativecommons.org/licenses/by/4.0/).