
Thermographic Fault Diagnosis of Shaft of BLDC Motor


Abstract
1. Introduction
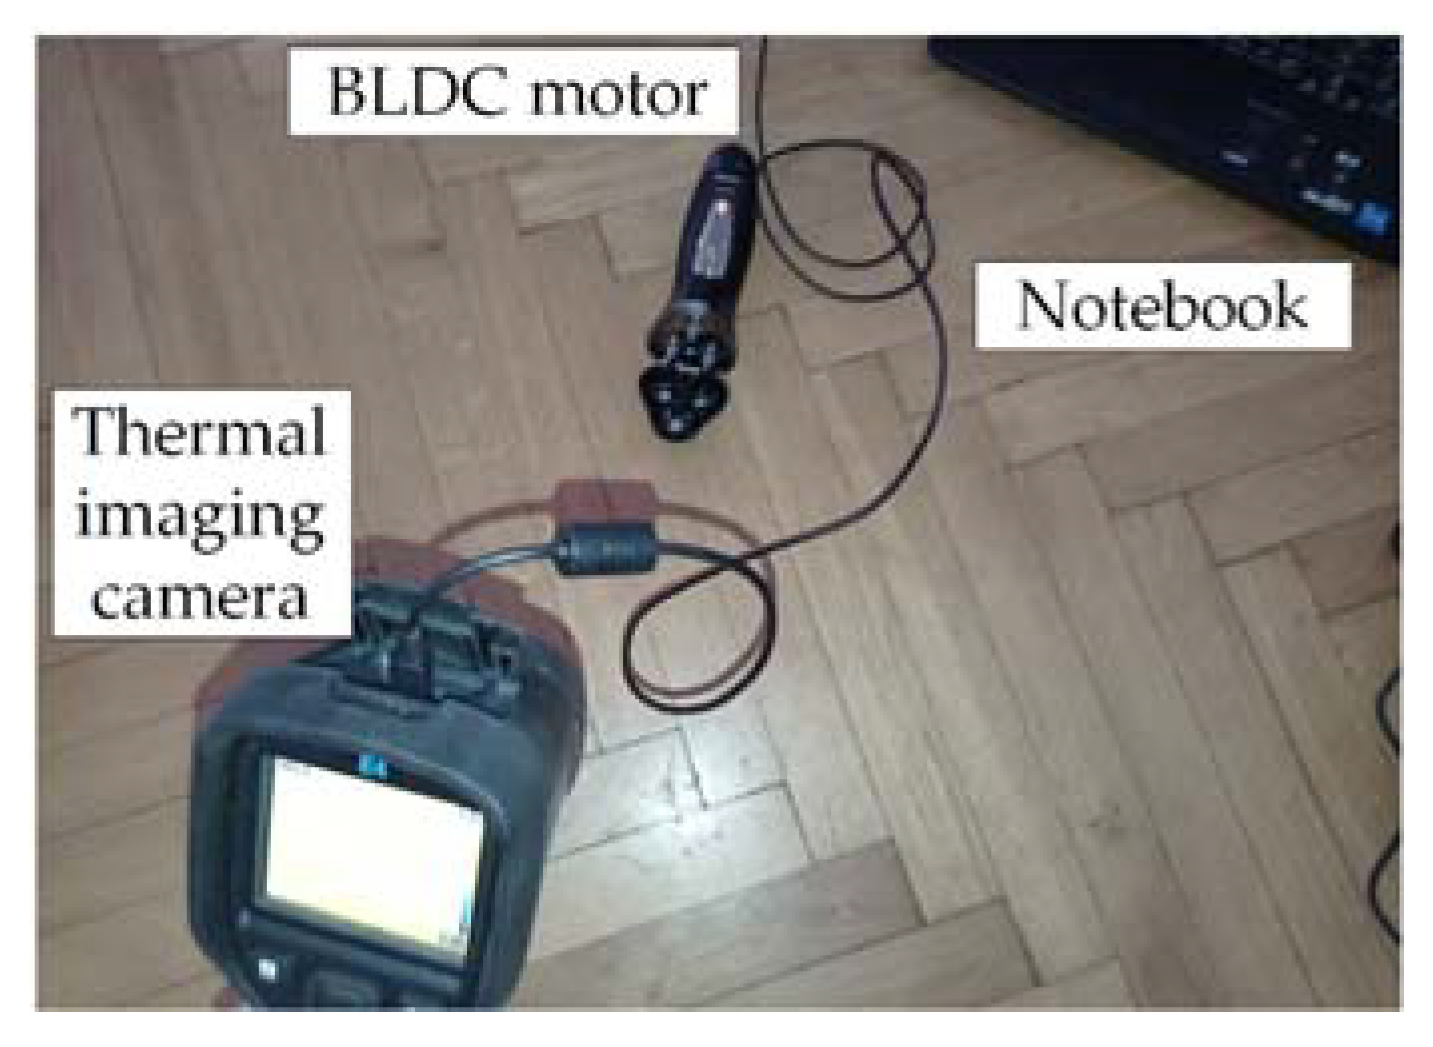
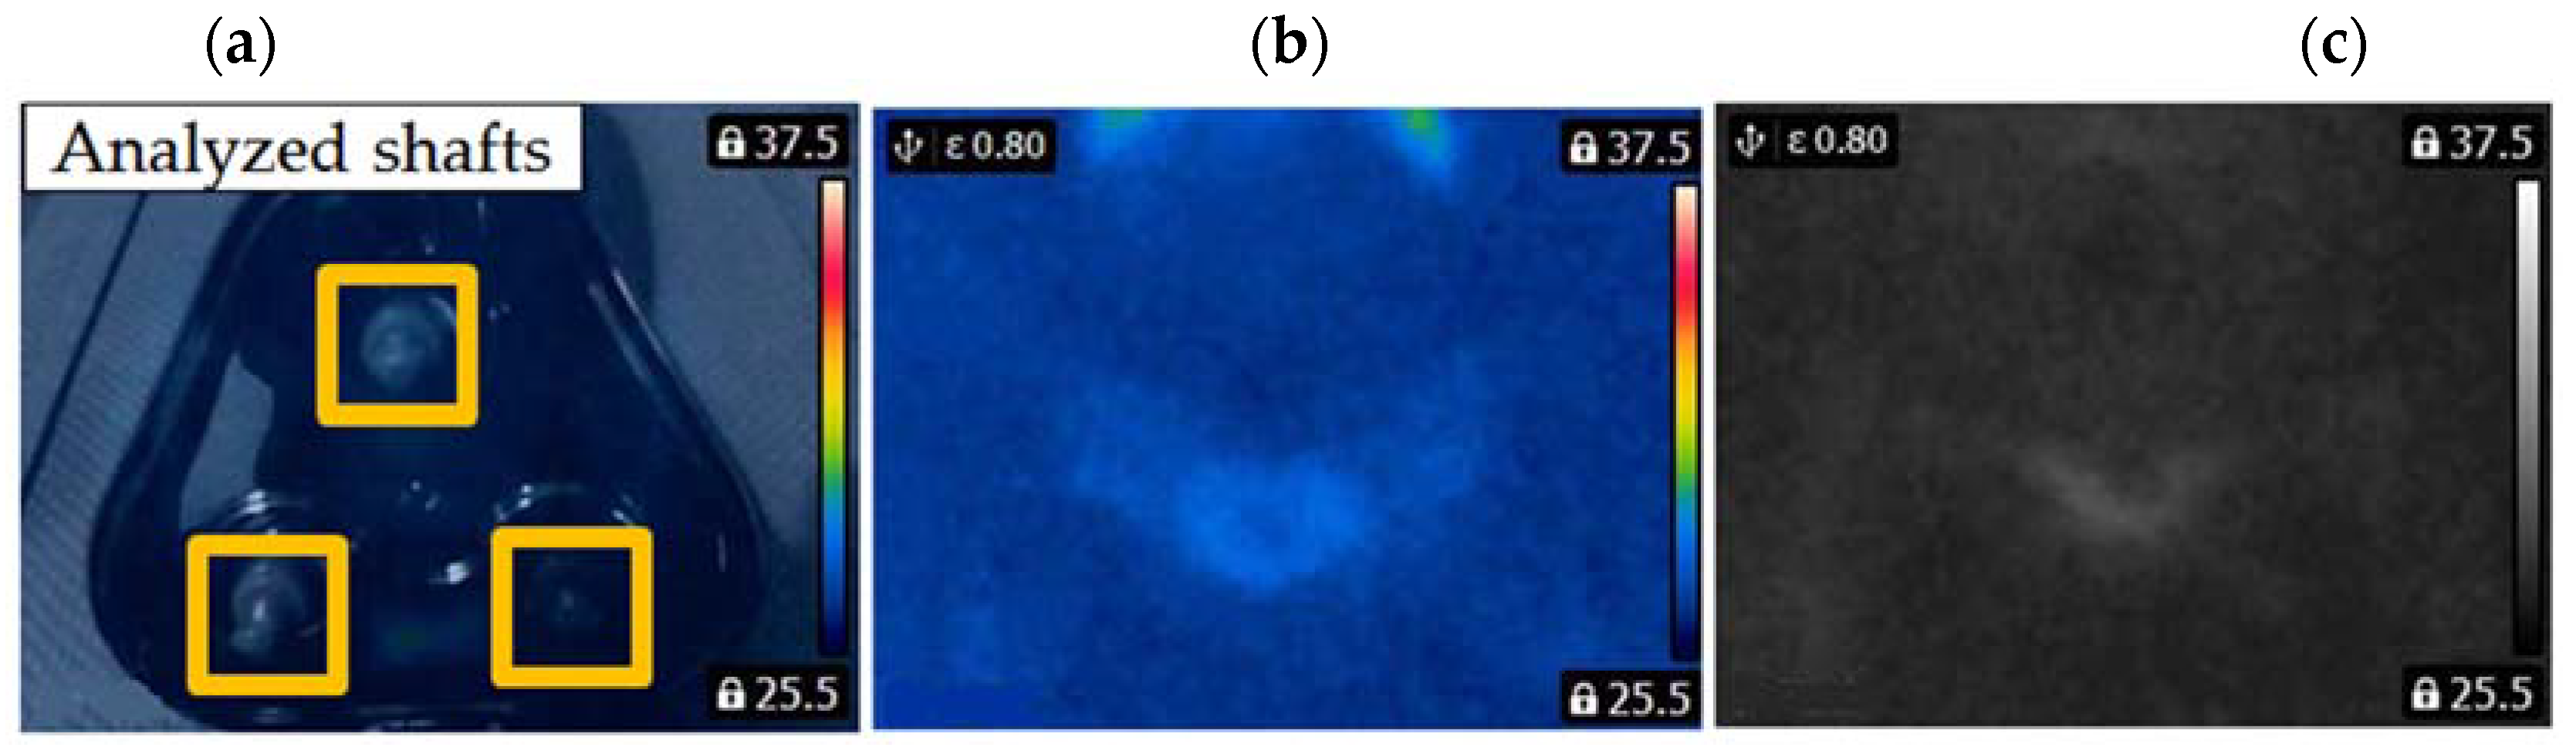
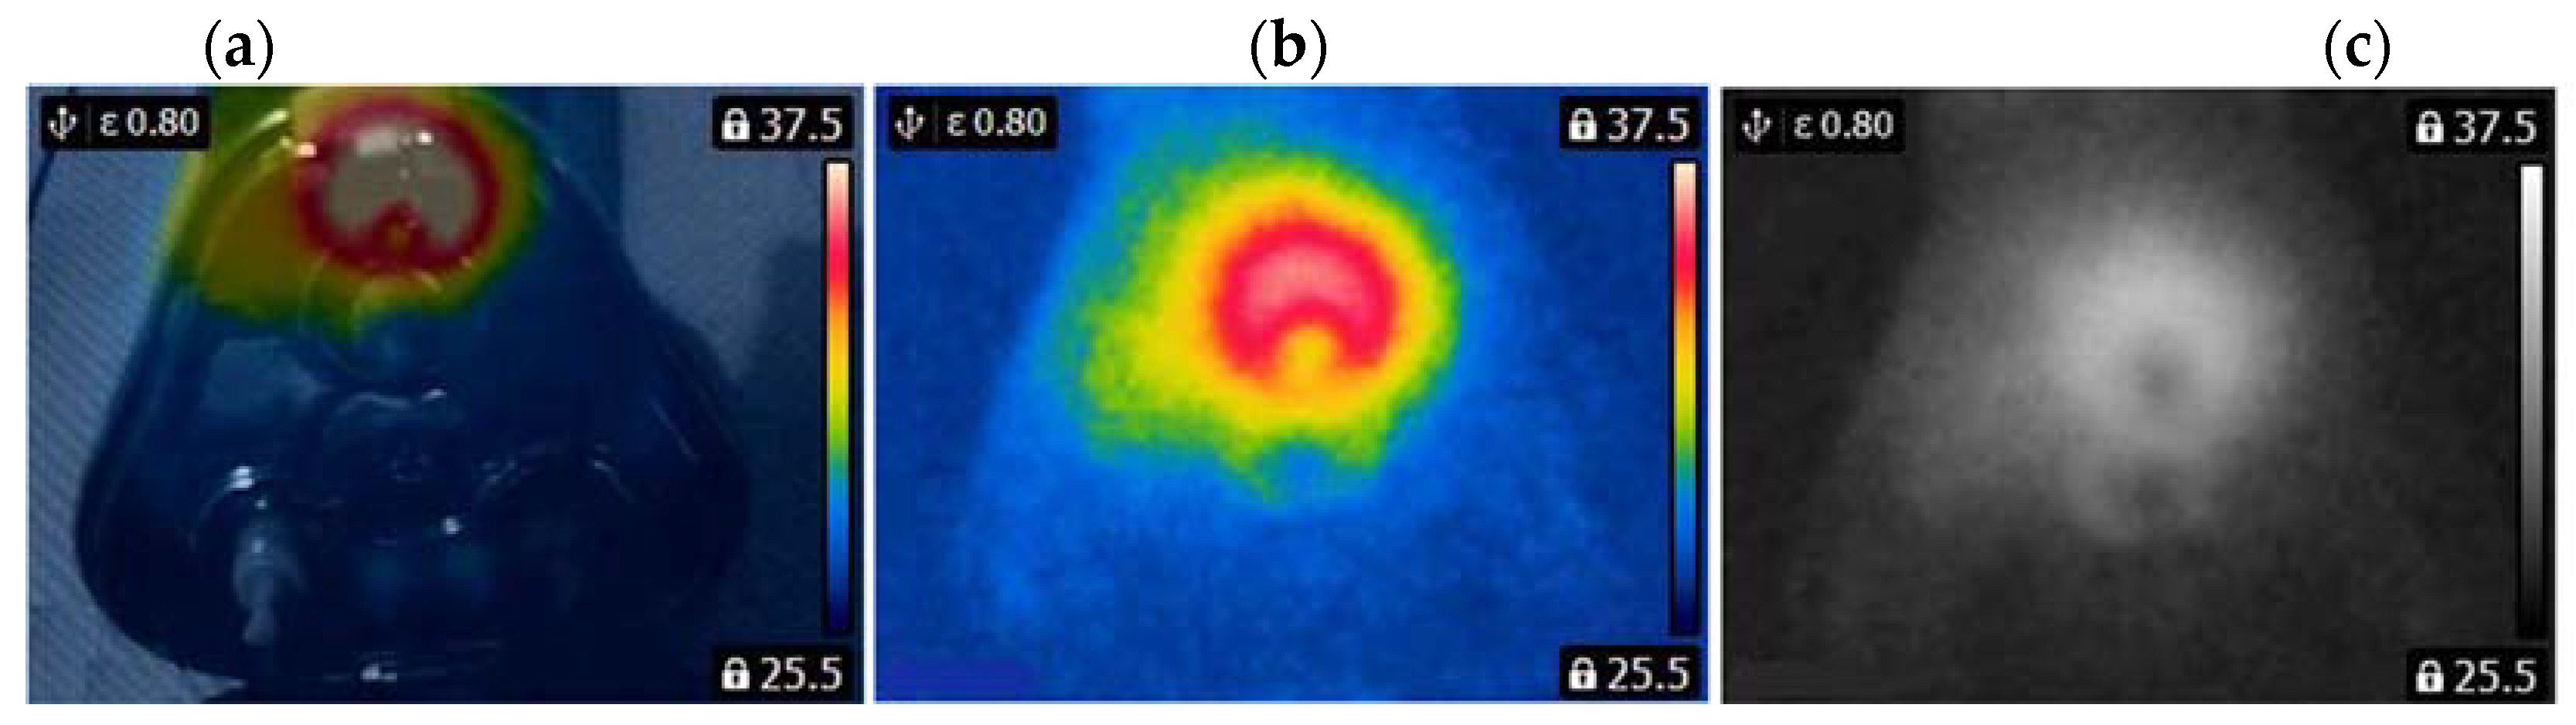
2. Measurements
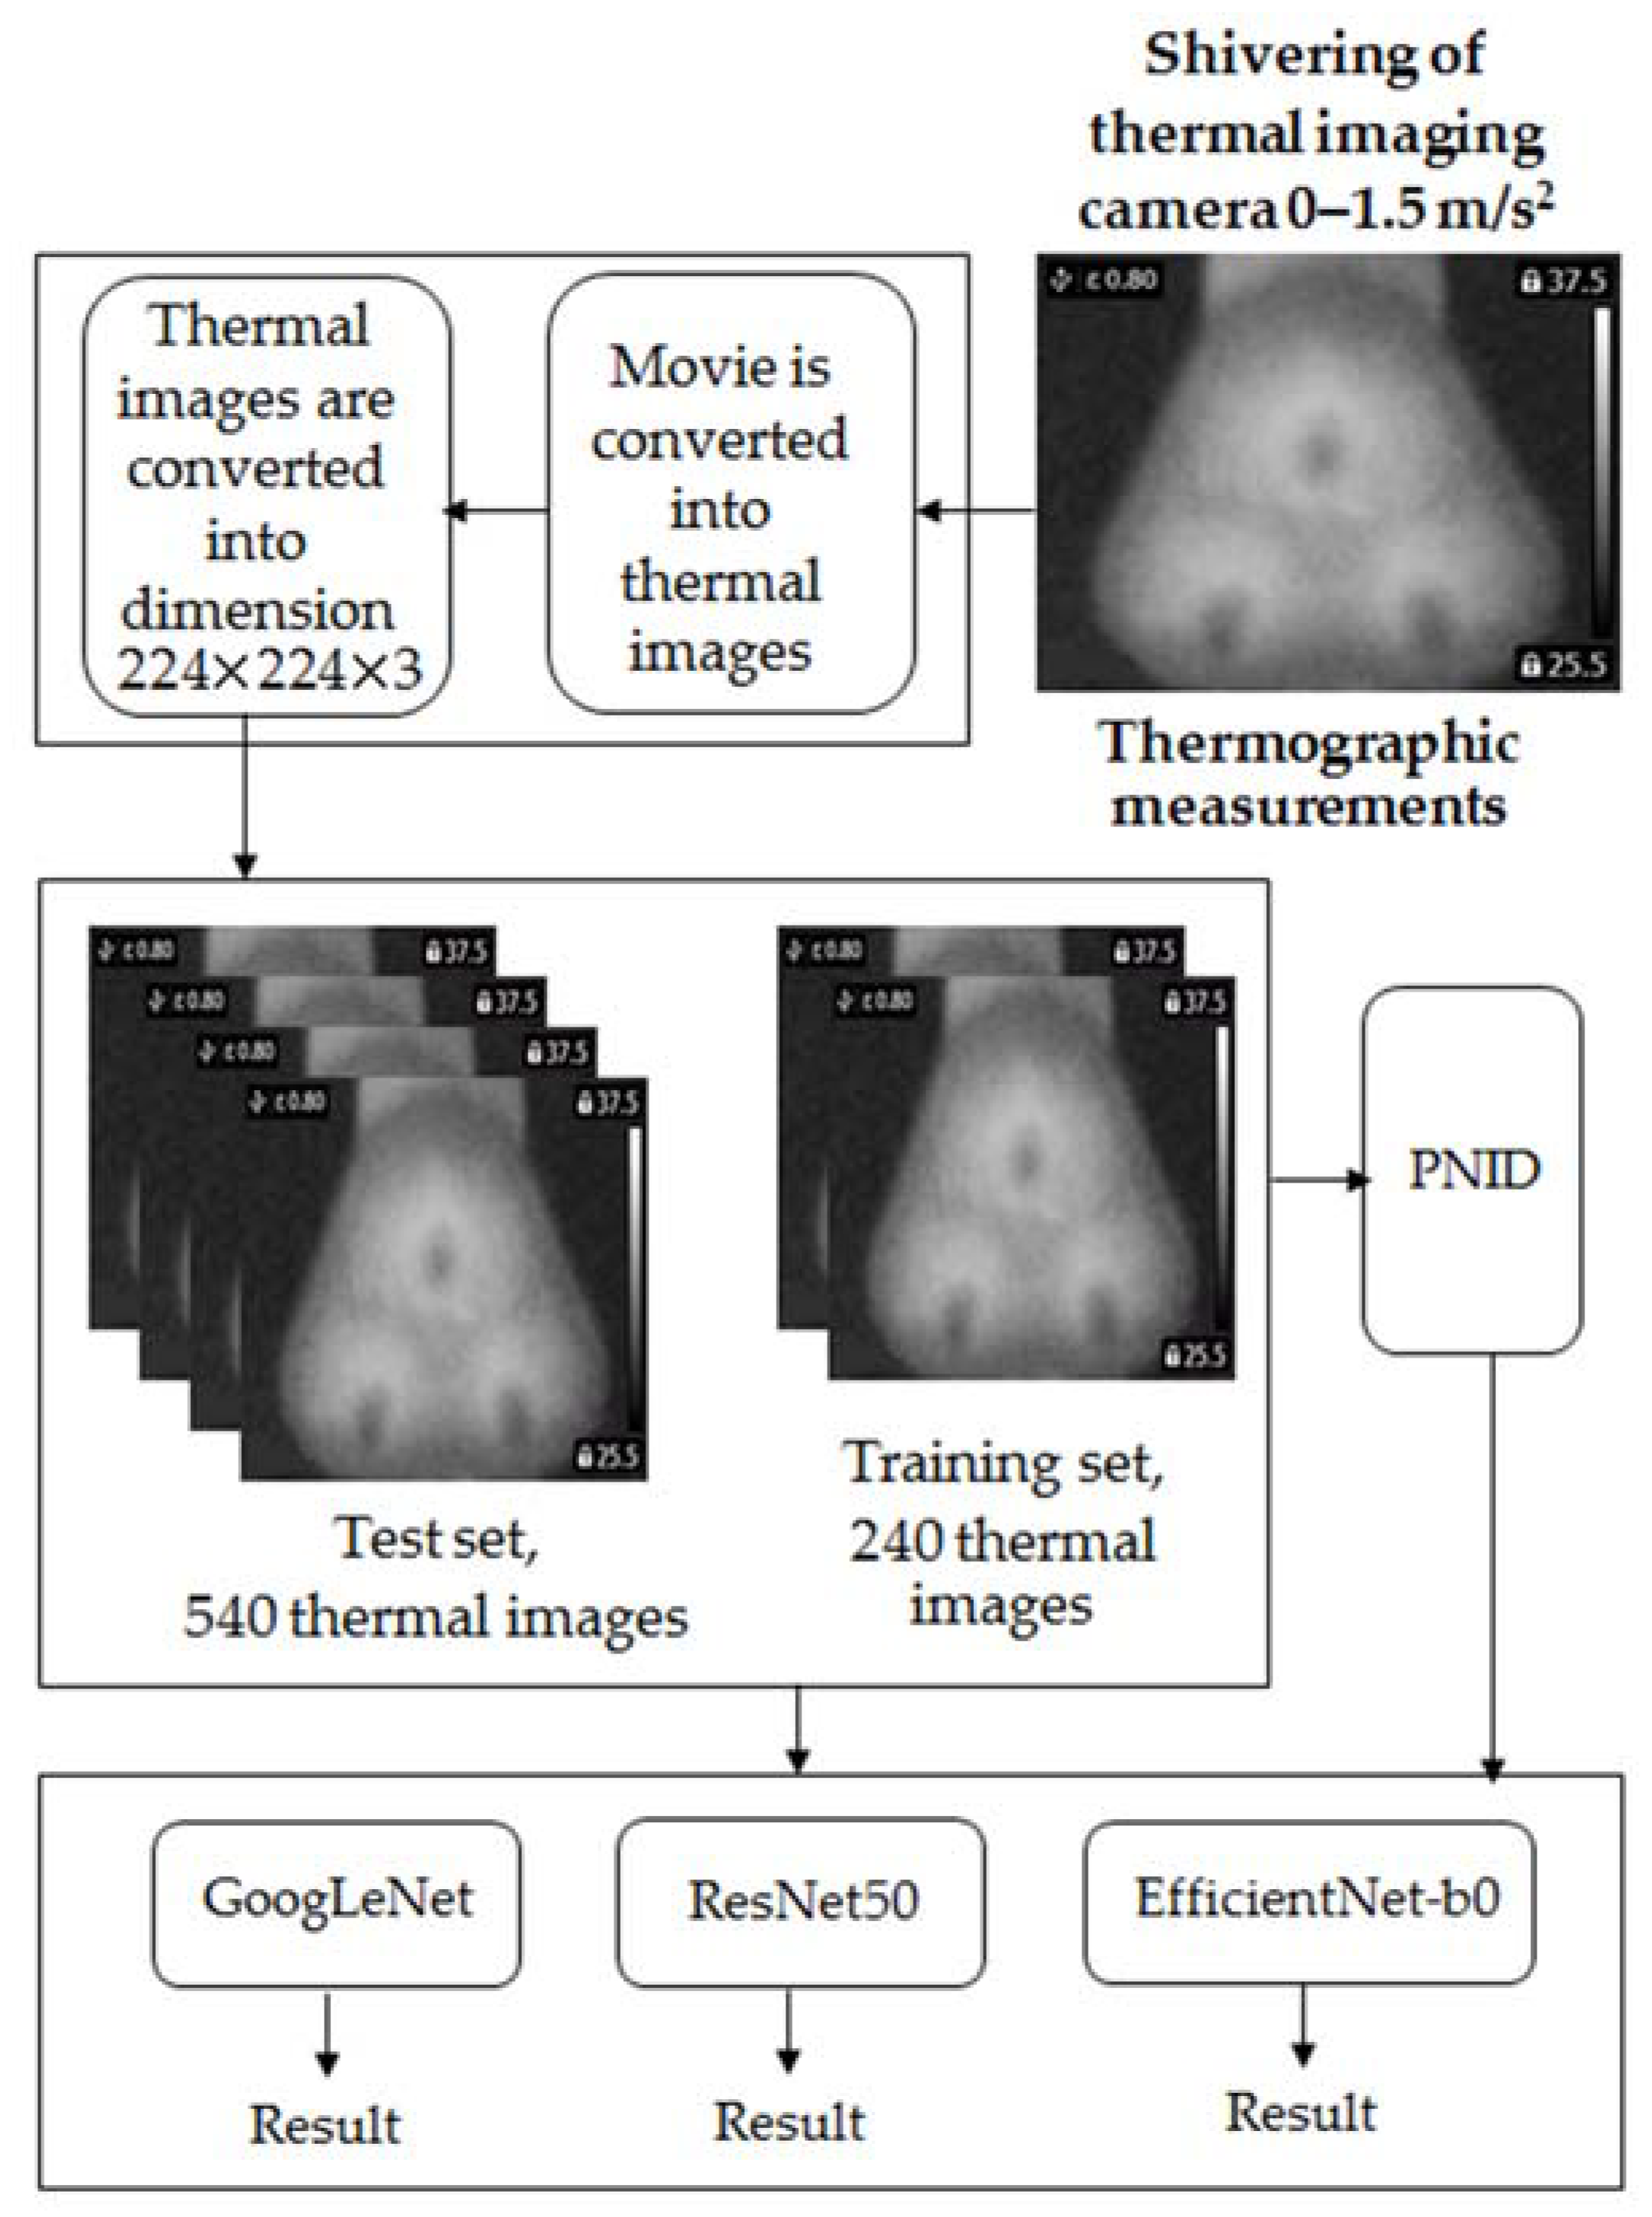
3. Thermographic Fault Diagnosis Technique
3.1. PNID (Power of Normalized Image Difference)
- Create training and test sets.
- Compute differences of thermal images: diff_hb_1f1 = |hb1-1f1|,…, diff_hb_1f30 = |hb30-1f30|, diff_hb_2f1 = |hb1-2f1|,…, diff_hb_3f1 = |hb1-3f1|,…, diff_1f_2f1 = |1f1-2f1|,…, diff_1f_3f1 = |1f1-3f1|,…, diff_2f_3f1 = |2f1-3f1|,…, diff_2f_3f30 = |2f30-3f30|; hb—matrix of thermal image of class HB, 1f—matrix of thermal image of class 1FSB, 2f—matrix of thermal image of class 2FSB, 3f—matrix of thermal image of class 3FSB.
- Compute matrix R, where R = diff_hb_1f1 + … + diff_hb_1f30 + diff_hb_2f1 + … + diff_hb_2f30 + diff_hb_3f1 + … + diff_hb_3f30 + diff_1f_2f1 + … + diff_1f_2f30 + diff_1f_3f1 + … + diff_1f_3f30 + diff_2f_3f1 + … + diff_2f_3f30.
- Compute Rmax—maximum value of matrix R.
- Compute matrix M = R/Rmax.
- Compute the value Bij = Mij × Mij, Bij—new value of matrix B, Mij—the value of matrix M.
- Compute matrix B.
- Compute the t threshold of binarization using Otsu’s method for matrix B. Compute the power of the computed threshold of binarization t2.
- Create binarization of matrix B using a new level of binarization (t2). Compute matrix A.
- Compute N = S + A, where S—matrix of the analyzed thermal image.
- Compute V=N−1.
- Change values less than 0 to 0 for matrix V. Form the output matrix Z (analyzed feature).
3.2. Convolutional Neural Network (CNN)
4. Results
5. Conclusions
Funding
Institutional Review Board Statement
Informed Consent Statement
Data Availability Statement
Conflicts of Interest
References
- Karabacak, Y.E.; Ozmen, N.G.; Gumusel, L. Worm gear condition monitoring and fault detection from thermal images via deep learning method. Eksploat. I Niezawodn.–Maint. Reliab. 2020, 22, 544–556. [Google Scholar] [CrossRef]
- Osornio-Rios, R.A.; Jaen-Cuellar, A.Y.; Alvarado-Hernandez, A.I.; Zamudio-Ramirez, I.; Cruz-Albarran, I.A.; Antonino-Daviu, J.A. Fault detection and classification in kinematic chains by means of PCA extraction-reduction of features from thermographic images. Measurement 2022, 197, 111340. [Google Scholar] [CrossRef]
- Faria, J.J.R.; Fonseca, L.G.A.; de Faria, A.R.; Cantisano, A.; Cunha, T.N.; Jahed, H.; Montesano, J. Determination of the fatigue behavior of mechanical components through infrared thermography. Eng. Fail. Anal. 2022, 134, 106018. [Google Scholar] [CrossRef]
- Karabacak, Y.E.; Ozmen, N.G.; Gumusel, L. Intelligent worm gearbox fault diagnosis under various working conditions using vibration, sound and thermal features. Appl. Acoust. 2022, 186, 10846. [Google Scholar] [CrossRef]
- Liang, Y.P.; Bai, L.B.; Zhang, X.; Ran, C.; Cheng, Y.H. Potential of Eddy Current Pulsed Thermography as a Nondestructive Testing Method. IEEE Instrum. Meas. Mag. 2022, 25, 5–15. [Google Scholar] [CrossRef]
- Li, X.; Cheng, J.; Shao, H.D.; Liu, K.; Cai, B.P. A Fusion CWSMM-Based Framework for Rotating Machinery Fault Diagnosis Under Strong Interference and Imbalanced Case. IEEE Trans. Ind. Inform. 2022, 18, 5180–5189. [Google Scholar] [CrossRef]
- Li, X.; Shao, H.D.; Lu, S.L.; Xiang, J.W.; Cai, B.P. Highly Efficient Fault Diagnosis of Rotating Machinery Under Time-Varying Speeds Using LSISMM and Small Infrared Thermal Images. IEEE Trans. Syst. Man Cybern. Syst. 2022, 1–13. [Google Scholar] [CrossRef]
- Huo, Z.Q.; Martinez-Garcia, M.; Zhang, Y.; Shu, L. A Multisensor Information Fusion Method for High-Reliability Fault Diagnosis of Rotating Machinery. IEEE Trans. Instrum. Meas. 2022, 71, 3500412. [Google Scholar] [CrossRef]
- Ali, M.Z.; Shabbir, M.N.S.K.; Liang, X.D.; Zhang, Y.; Hu, T. Experimental Investigation of Machine Learning Based Fault Diagnosis for Induction Motors. In Proceedings of the IEEE Industry Applications Society Annual Meeting, Portland, OR, USA, 23–27 September 2018. [Google Scholar]
- Wu, Y.K.; Jiang, B.; Wang, Y.L. Incipient winding fault detection and diagnosis for squirrel-cage induction motors equipped on CRH trains. ISA Trans. 2020, 99, 488–495. [Google Scholar] [CrossRef]
- Stief, A.; Ottewill, J.R.; Baranowski, J.; Orkisz, M. A PCA and Two-Stage Bayesian Sensor Fusion Approach for Diagnosing Electrical and Mechanical Faults in Induction Motors. IEEE Trans. Ind. Electron. 2019, 66, 9510–9520. [Google Scholar] [CrossRef]
- Zhang, W.; Li, X.; Ma, H.; Luo, Z.; Li, X. Universal Domain Adaptation in Fault Diagnostics With Hybrid Weighted Deep Adversarial Learning. IEEE Trans. Ind. Inform. 2021, 17, 7957–7967. [Google Scholar] [CrossRef]
- Glowacz, A.; Tadeusiewicz, R.; Legutko, S.; Caesarendra, W.; Irfan, M.; Liu, H.; Brumercik, F.; Gutten, M.; Sulowicz, M.; Daviu, J.A.; et al. Fault diagnosis of angle grinders and electric impact drills using acoustic signals. Appl. Acoust. 2021, 179, 108070. [Google Scholar] [CrossRef]
- He, M.; He, D. Deep Learning Based Approach for Bearing Fault Diagnosis. IEEE Trans. Ind. Appl. 2017, 53, 3057–3065. [Google Scholar] [CrossRef]
- Liu, C.Z.; Cichon, A.; Krolczyk, G.; Li, Z.X. Technology development and commercial applications of industrial fault diagnosis system: A review. Int. J. Adv. Manuf. Technol. 2021, 118, 3497–3529. [Google Scholar] [CrossRef]
- Xu, Y.; Li, Z.X.; Wang, S.Q.; Li, W.H.; Sarkodie-Gyan, T.; Feng, S.Z. A hybrid deep-learning model for fault diagnosis of rolling bearings. Measurement 2021, 169, 108502. [Google Scholar] [CrossRef]
- Gajewski, J.; Valis, D. Verification of the technical equipment degradation method using a hybrid reinforcement learning trees-artificial neural network system. Tribol. Int. 2021, 153, 106618. [Google Scholar] [CrossRef]
- Kochan, O. The Technique to Prepare a Training Set for a Neural Network to Model the Error of a Thermocouple Leg. In Proceedings of the 2019 9th International Conference on Advanced Computer Information Technologies (ACIT’2019), Ceske Budejovice, Czech Republic, 5–7 June 2019. [Google Scholar]
- Qiang, B.H.; Zhang, S.H.; Zhan, Y.S.; Xie, W.; Zhao, T. Improved Convolutional Pose Machines for Human Pose Estimation Using Image Sensor Data. Sensors 2019, 19, 718. [Google Scholar] [CrossRef]
- Cheng, X.R.; Cui, B.J.; Hou, S.Z. Fault Line Selection of Distribution Network Based on Modified CEEMDAN and GoogLeNet Neural Network. IEEE Sens. J. 2022, 22, 13346–13364. [Google Scholar] [CrossRef]
- Jiang, M.L.; Wu, P.L.; Li, F. Detecting dark spot eggs based on CNN GoogLeNet model. Wirel. Netw. 2021, 370, 116–126. [Google Scholar] [CrossRef]
- Wenchao, X.; Zhi, Y. Research on Strawberry Disease Diagnosis Based on Improved Residual Network Recognition Model. Math. Probl. Eng. 2022, 2022, 6431942. [Google Scholar] [CrossRef]
- Raksha, A.; Rajasekaran, R.K.; Francis, P.; Yogeshwara, S.; Iliev, A.I. Home Automation through Hand Gestures Using ResNet50 and 3D-CNN. In Proceedings of the Digital Presentation and Preservation of Cultural and Scientific Heritage, Meeting 11th International Conference on Digital Presentation and Preservation of Cultural and Scientific Heritage (DiPP), Burgas, Bulgaria, 23–25 September 2021; Volume 11, pp. 215–226. [Google Scholar]
- Konovalenko, I.; Maruschak, P.; Brezinová, J.; Prentkovskis, O.; Brezina, J. Research of U-Net-Based CNN Architectures for Metal Surface Defect Detection. Machines 2022, 10, 327. [Google Scholar] [CrossRef]
- Alia, A.; Maree, M.; Chraibi, M. A Hybrid Deep Learning and Visualization Framework for Pushing Behavior Detection in Pedestrian Dynamics. Sensors 2022, 22, 4040. [Google Scholar] [CrossRef] [PubMed]
- Qiu, X.J. U-Net-ASPP: U-Net based on atrous spatial pyramid pooling model for medical image segmentation in COVID-19. J. Appl. Sci. Eng. 2022, 25, 1015–1024. [Google Scholar] [CrossRef]
- Yu, Y.Z.; Qiu, Z.B.; Liao, H.S.; Wei, Z.X.; Zhu, X.; Zhou, Z.B. A Method Based on Multi-Network Feature Fusion and Random Forest for Foreign Objects Detection on Transmission Lines. Appl. Sci. 2022, 12, 4982. [Google Scholar] [CrossRef]


| State of the BLDC | E [%] |
|---|---|
| E1, HM | 100 |
| E2, 1FSB | 100 |
| E3, 2FSB | 100 |
| E4, 3FSB | 100 |
| MeanE [%] | |
| MeanE | 100 |
| State of the BLDC | E [%] |
|---|---|
| E1, HM | 100 |
| E2, 1FSB | 100 |
| E3, 2FSB | 100 |
| E4, 3FSB | 100 |
| MeanE [%] | |
| MeanE | 100 |
Publisher’s Note: MDPI stays neutral with regard to jurisdictional claims in published maps and institutional affiliations. |
© 2022 by the author. Licensee MDPI, Basel, Switzerland. This article is an open access article distributed under the terms and conditions of the Creative Commons Attribution (CC BY) license (https://creativecommons.org/licenses/by/4.0/).
Share and Cite
Glowacz, A. Thermographic Fault Diagnosis of Shaft of BLDC Motor. Sensors 2022, 22, 8537. https://doi.org/10.3390/s22218537
Glowacz A. Thermographic Fault Diagnosis of Shaft of BLDC Motor. Sensors. 2022; 22(21):8537. https://doi.org/10.3390/s22218537
Chicago/Turabian StyleGlowacz, Adam. 2022. "Thermographic Fault Diagnosis of Shaft of BLDC Motor" Sensors 22, no. 21: 8537. https://doi.org/10.3390/s22218537
APA StyleGlowacz, A. (2022). Thermographic Fault Diagnosis of Shaft of BLDC Motor. Sensors, 22(21), 8537. https://doi.org/10.3390/s22218537