
Molecular Level Sucrose Quantification: A Critical Review


Abstract
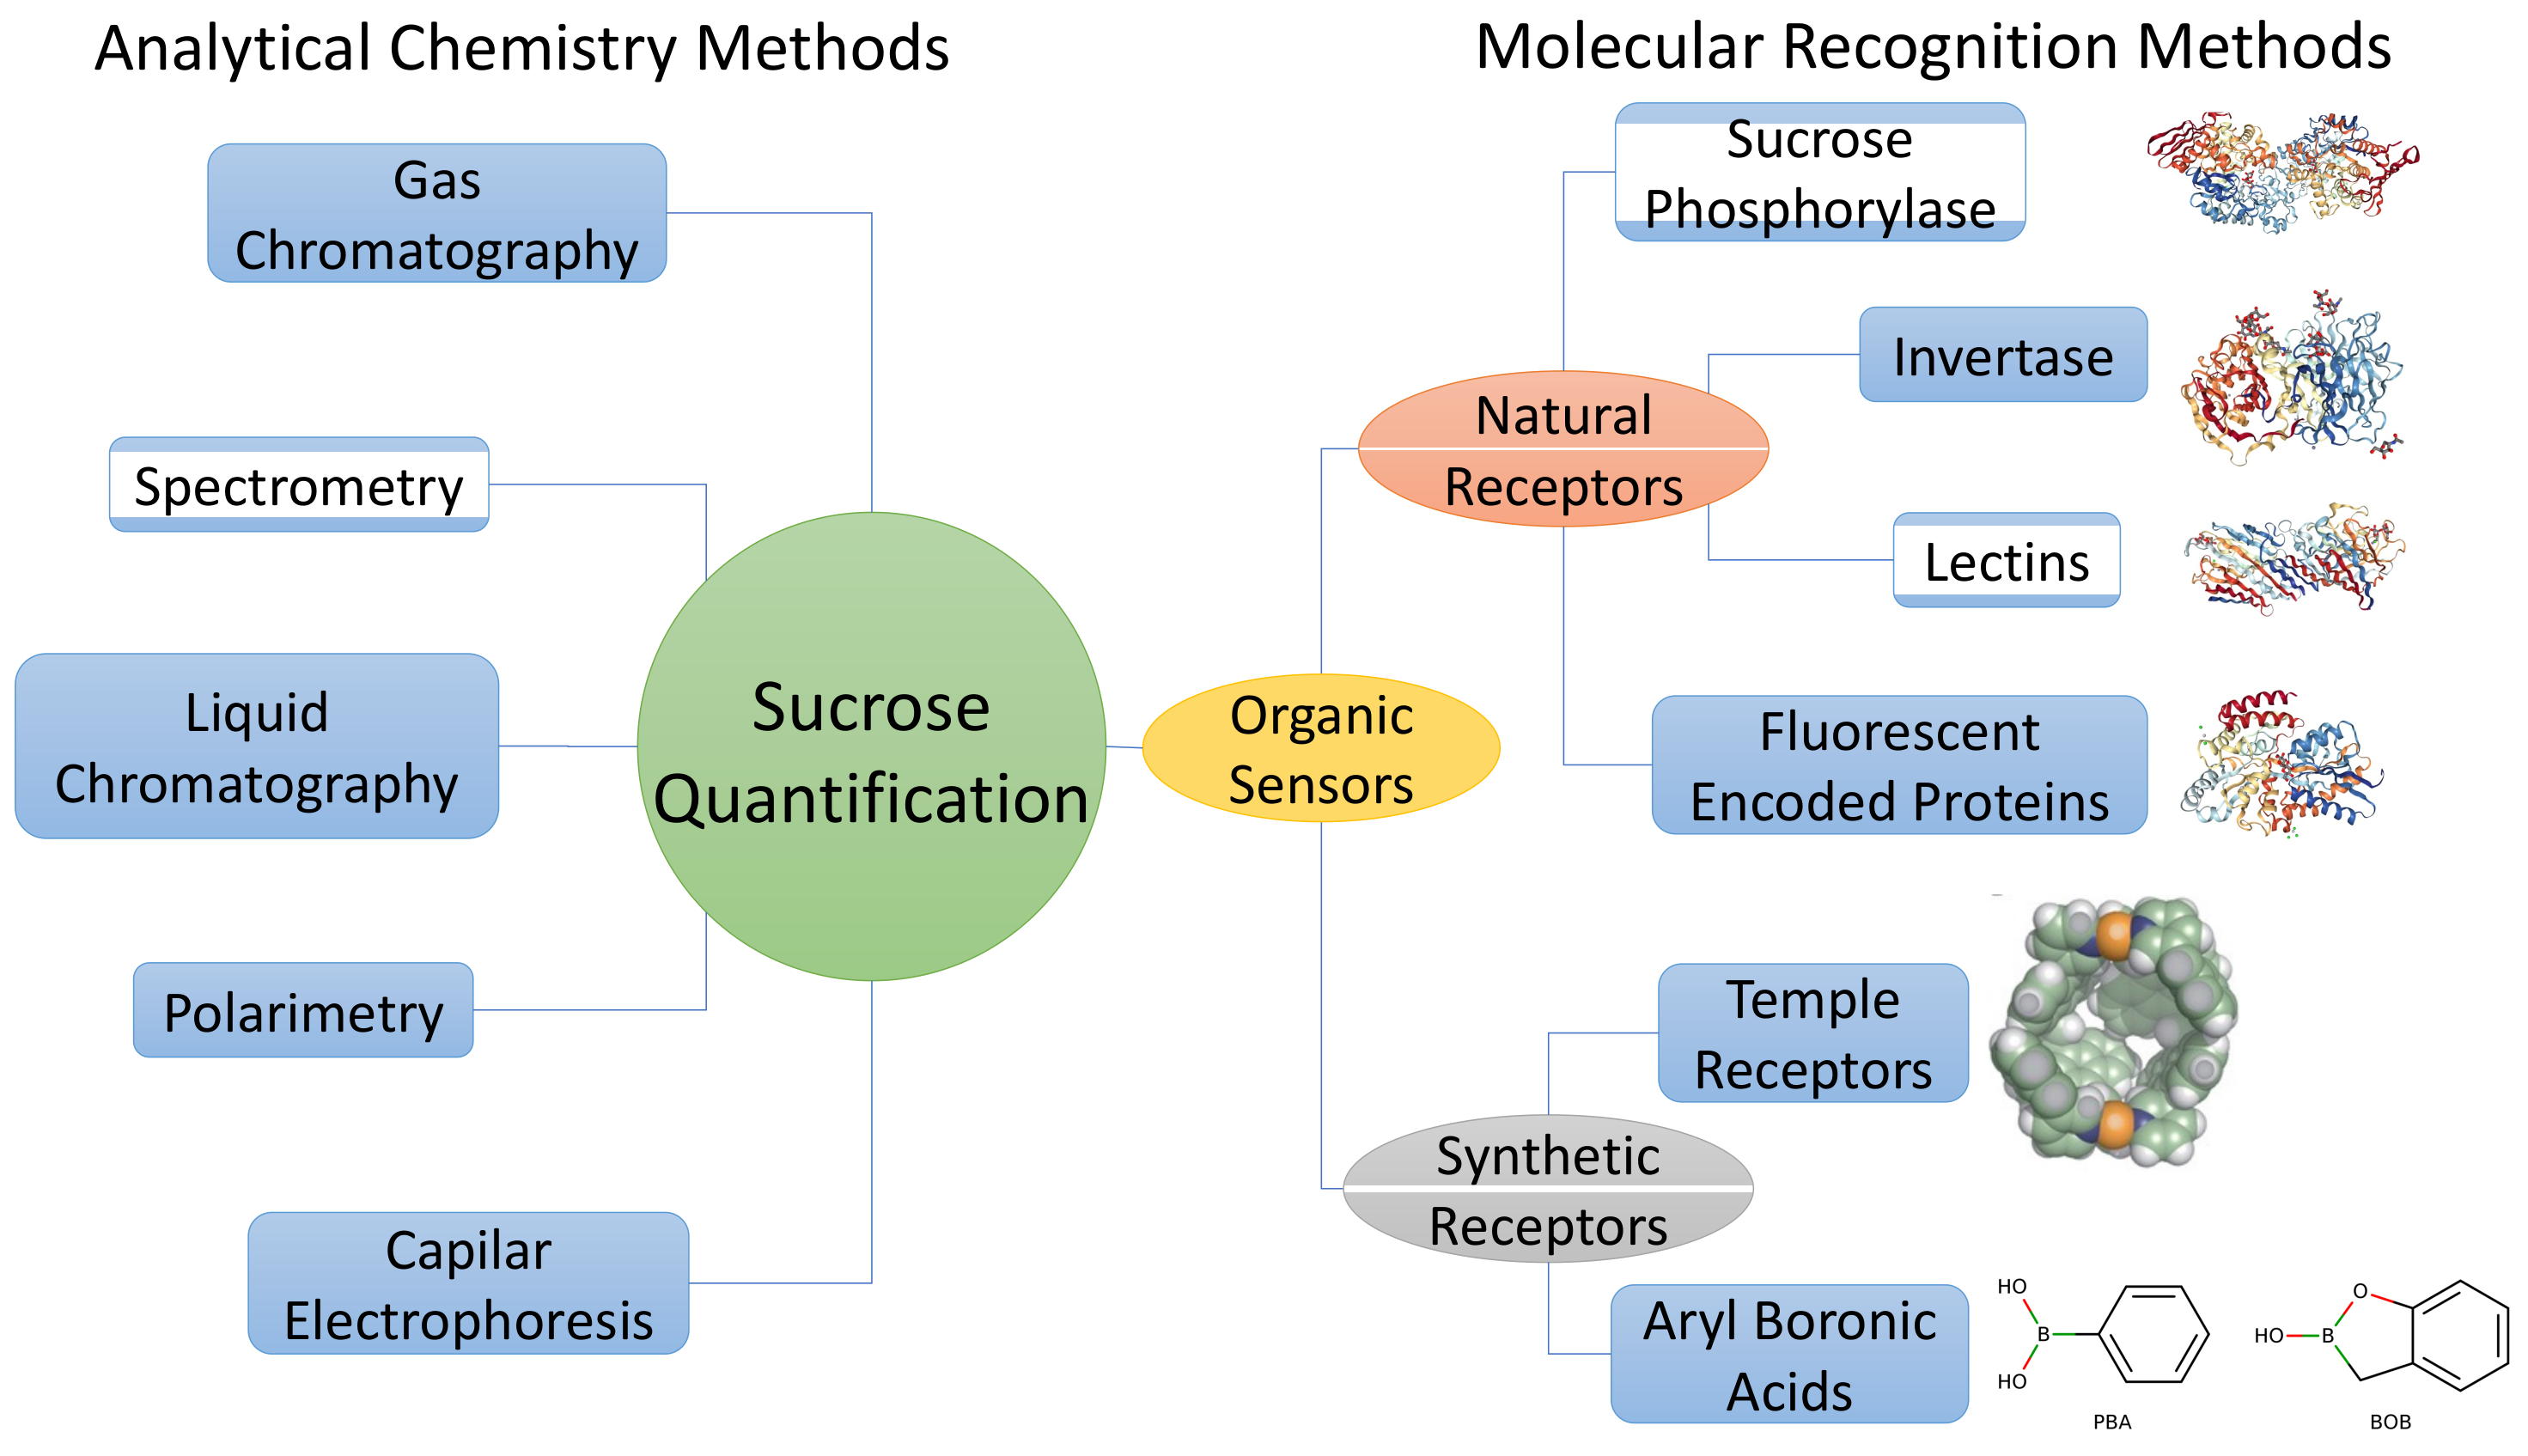
1. Introduction
2. Physicochemical Properties of Sucrose
3. Analytical Chemistry Methods
3.1. Polarimetry
3.2. Chromatography
3.2.1. Liquid Chromatography
3.2.2. Gas Chromatography
3.3. Capilar Electrophoresis
3.4. Spectrometry
3.5. Summary of Analytical Chemistry Methods
4. Sucrose Quantification Using Molecular Recognition Methods
4.1. Natural Receptors
4.1.1. Invertase (INV)
4.1.2. Sucrose Phosphorylase (SP)
4.1.3. Fluorescent Indicator Proteins (FLIPs)
4.1.4. Lectins
4.2. Synthetic Receptors
4.2.1. Temple Receptors
4.2.2. Aryl Boronic Acids
4.3. Molecularly Imprinted Polymers-Based Sensors, as Chemochemical Cavity Receptors
5. Conclusions and Perspectives
Author Contributions
Funding
Institutional Review Board Statement
Data Availability Statement
Acknowledgments
Conflicts of Interest
References
- Porter, J.R.; Xie, L.; Challinor, A.J.; Cochrane, K.; Howden, S.M.; Iqbal, M.M.; Lobell, D.B.; Travasso, M.I. 2014: Food security and food production systems. In Climate Change 2014: Impacts, Adaptation, and Vulnerability. Part A: Global and Sectoral Aspects. Contribution of Working Group II to the Fifth Assessment Report of the Intergovernmental Panel on Climate Change; Field, C.B., Barros, V.R., Dokken, D.J., Mach, K.J., Mastrandrea, M.D., Bilir, T.E., Chatterjee, M., Ebi, K.L., Estrada, Y.O., Genova, R.C., Eds.; Cambridge University Press: Cambridge, UK; New York, NY, USA, 2014; pp. 485–533. [Google Scholar]
- Cline, W.R. Global Warming and Agriculture. Financ. Dev. 2008, 45, A007. [Google Scholar] [CrossRef]
- Pounds, J.A.; Puschendorf, R. Clouded futures. Nature 2004, 427, 107–109. [Google Scholar] [CrossRef]
- Chakraborty, S.; Newton, A.C. Climate change, plant diseases and food security: An overview. Plant Pathol. 2011, 60, 2–14. [Google Scholar] [CrossRef]
- Rengel, Z. Soil pH, Soil Health and Climate Change. In Soil Health and Climate Change; Singh, B.P., Cowie, A.L., Chan, K.Y., Eds.; Springer: Berlin/Heidelberg, Germany, 2011; pp. 69–85. [Google Scholar] [CrossRef]
- Razzaq, A.; Kaur, P.; Akhter, N.; Wani, S.H.; Saleem, F. Next-Generation Breeding Strategies for Climate-Ready Crops. Front. Plant Sci. 2021, 12, 420. [Google Scholar] [CrossRef] [PubMed]
- Ceccarelli, S.; Grando, S.; Maatougui, M.; Michael, M.; Slash, M.; Haghparast, R.; Rahmanian, M.; Taheri, A.; Al-Yassin, A.; Benbelkacem, A.; et al. Plant breeding and climate changes. J. Agric. Sci. 2010, 148, 627–637. [Google Scholar] [CrossRef]
- Dreccer, M.F.; Bonnett, D.; Lafarge, T. Plant Breeding Under a Changing Climate. In Sustainable Food Production; Christou, P., Savin, R., Costa-Pierce, B.A., Misztal, I., Whitelaw, C.B.A., Eds.; Springer: New York, NY, USA, 2013; pp. 1296–1307. [Google Scholar] [CrossRef]
- Varotto, S.; Krugman, T.; Aiese Cigliano, R.; Kashkush, K.; Kondić-Špika, A.; Aravanopoulos, F.A.; Pradillo, M.; Consiglio, F.; Aversano, R.; Pecinka, A.; et al. Exploitation of epigenetic variation of crop wild relatives for crop improvement and agrobiodiversity preservation. Theor. Appl. Genet. 2022, 1–17. [Google Scholar] [CrossRef]
- Halford, N.; Curtis, T.; Muttucumaru, N.; Postles, J.; Mottram, D. Sugars in crop plants. Ann. Appl. Biol. 2011, 158, 1–25. [Google Scholar] [CrossRef]
- Yoon, J.; Cho, L.H.; Tun, W.; Jeon, J.S.; An, G. Sucrose signaling in higher plants. Plant Sci. 2021, 302, 110703. [Google Scholar] [CrossRef]
- Ciereszko, I. Regulatory roles of sugars in plant growth and development. Acta Soc. Bot. Pol. 2018, 87, 2. [Google Scholar] [CrossRef]
- Okumoto, S.; Jones, A.; Frommer, W.B. Quantitative Imaging with Fluorescent Biosensors. Annu. Rev. Plant Biol. 2012, 63, 663–706. [Google Scholar] [CrossRef]
- Sadoine, M.; Reger, M.; Wong, K.M.; Frommer, W.B. Affinity Series of Genetically Encoded Förster Resonance Energy-Transfer Sensors for Sucrose. ACS Sens. 2021, 6, 1779–1784. [Google Scholar] [CrossRef]
- Deuschle, K.; Chaudhuri, B.; Okumoto, S.; Lager, I.; Lalonde, S.; Frommer, W.B. Rapid Metabolism of Glucose Detected with FRET Glucose Nanosensors in Epidermal Cells and Intact Roots of Arabidopsis RNA-Silencing Mutants. Plant Cell 2006, 18, 2314–2325. [Google Scholar] [CrossRef]
- Chaudhuri, B.; Hörmann, F.; Lalonde, S.; Brady, S.M.; Orlando, D.A.; Benfey, P.; Frommer, W.B. Protonophore- and pH-insensitive glucose and sucrose accumulation detected by FRET nanosensors in Arabidopsis root tips. Plant J. 2008, 56, 948–962. [Google Scholar] [CrossRef]
- Chen, L.Q.; Qu, X.Q.; Hou, B.H.; Sosso, D.; Osorio, S.; Fernie, A.R.; Frommer, W.B. Sucrose Efflux Mediated by SWEET Proteins as a Key Step for Phloem Transport. Science 2012, 335, 207–211. [Google Scholar] [CrossRef] [PubMed]
- Eom, J.S.; Luo, D.; Atienza-Grande, G.; Yang, J.; Ji, C.; Thi Luu, V.; Huguet-Tapia, J.C.; Char, S.N.; Liu, B.; Nguyen, H.; et al. Diagnostic kit for rice blight resistance. Nat. Biotechnol. 2019, 37, 1372–1379. [Google Scholar] [CrossRef]
- Sosso, D.; Luo, D.; Li, Q.B.; Sasse, J.; Yang, J.; Gendrot, G.; Suzuki, M.; Koch, K.E.; McCarty, D.R.; Chourey, P.S.; et al. Seed filling in domesticated maize and rice depends on SWEET-mediated hexose transport. Nat. Genet. 2015, 47, 1489–1493. [Google Scholar] [CrossRef] [PubMed]
- Li, J.; Liesche, J. Strategies for Measuring Cytosolic Sugar Concentrations in Plant Cells. In Annual Plant Reviews Online; John Wiley & Sons, Ltd.: Hoboken, NJ, USA, 2022; pp. 233–250. [Google Scholar] [CrossRef]
- Lowman, D.W. Bibliography: Methods of sucrose analysis. J. Sugar Beat Res. 1978, 20, 233–250. [Google Scholar] [CrossRef]
- Pokrzywnicka, M.; Koncki, R. Disaccharides Determination: A Review of Analytical Methods. Crit. Rev. Anal. Chem. 2018, 48, 186–213. [Google Scholar] [CrossRef]
- Brown, G.M.; Levy, H.A. Further refinement of the structure of sucrose based on neutron-diffraction data. Acta Crystallogr. Sect. B 1973, 29, 790–797. [Google Scholar] [CrossRef]
- Rozada, T.D.C.; Pontes, R.M.; Rittner, R.; Basso, E.A. Stereoelectronic effects of the glycosidic linkage on the conformational preference of d-sucrose. RSC Adv. 2016, 6, 112806–112812. [Google Scholar] [CrossRef]
- Xia, J.; Case, D.A. Sucrose in aqueous solution revisited, Part 1: Molecular dynamics simulations and direct and indirect dipolar coupling analysis. Biopolymers 2012, 97, 276–288. [Google Scholar] [CrossRef] [PubMed]
- Feng, S.; Bagia, C.; Mpourmpakis, G. Determination of Proton Affinities and Acidity Constants of Sugars. J. Phys. Chem. A 2013, 117, 5211–5219. [Google Scholar] [CrossRef]
- Godshall, M.A.; Eggleston, G.; Thompson, J.; Kochergin, V.S. Kirk-Othmer Encyclopedia of Chemical Technology; John Wiley & Sons, Ltd.: Hoboken, NJ, USA, 2021; pp. 1–84. [Google Scholar] [CrossRef]
- O’Neil, M.J. The Merck Index: An Encyclopedia of Chemicals, Drugs, and Biologicals; Merck: Whitehouse Station, NJ, USA, 2001. [Google Scholar]
- Li, D.; Weng, C.; Ruan, Y.; Li, K.; Cai, G.; Song, C.; Lin, Q. An Optical Chiral Sensor Based on Weak Measurement for the Real-Time Monitoring of Sucrose Hydrolysis. Sensors 2021, 21, 1003. [Google Scholar] [CrossRef] [PubMed]
- Wang, R.; Zhou, J.; Zeng, K.; Chen, S.; Ling, X.; Shu, W.; Luo, H.; Wen, S. Ultrasensitive and real-time detection of chemical reaction rate based on the photonic spin Hall effect. APL Photonics 2020, 5, 016105. [Google Scholar] [CrossRef]
- Skoog, D.A.; West, D.M.; Holler, F.J.; Crouch, S.R. Fundamentals of Analytical Chemistry, 9th ed.; Cengage Learning: Belmont, CA, USA, 2013. [Google Scholar]
- Desai, H.; Sevak, M.; Panchal, V.; Panchal, K.; Patel, N. A new Polarimeteric method for the analysis of Sucrose in iron sucrose raw material, Iron Sucrose Injection and Inprocess Bulk Formulations. Int. J. Pharm. Sci. Res. 2013, 4, 3208–3213. [Google Scholar] [CrossRef]
- Ma, C.; Sun, Z.; Chen, C.; Zhang, L.; Zhu, S. Simultaneous separation and determination of fructose, sorbitol, glucose and sucrose in fruits by HPLC–ELSD. Food Chem. 2014, 145, 784–788. [Google Scholar] [CrossRef]
- Márquez-Sillero, I.; Cárdenas, S.; Valcárcel, M. Comparison of two evaporative universal detectors for the determination of sugars in food samples by liquid chromatography. Microchem. J. 2013, 110, 629–635. [Google Scholar] [CrossRef]
- Grembecka, M.; Lebiedzińska, A.; Szefer, P. Simultaneous separation and determination of erythritol, xylitol, sorbitol, mannitol, maltitol, fructose, glucose, sucrose and maltose in food products by high performance liquid chromatography coupled to charged aerosol detector. Microchem. J. 2014, 117, 77–82. [Google Scholar] [CrossRef]
- Chávez-Servín, J.L.; Castellote, A.I.; López-Sabater, M. Analysis of mono- and disaccharides in milk-based formulae by high-performance liquid chromatography with refractive index detection. J. Chromatogr. A 2004, 1043, 211–215. [Google Scholar] [CrossRef]
- Zakharova, A.M.; Grinshtein, I.L.; Kartsova, L.A. Determination of carbohydrates and sweeteners in foods and biologically active additives by high-performance liquid chromatography. J. Anal. Chem. 2013, 68, 1081–1084. [Google Scholar] [CrossRef]
- Wang, B.; Wang, X.; Bei, J.; Xu, L.; Zhang, X.; Xu, Z. Development and Validation of an Analytical Method for the Quantification of Arabinose, Galactose, Glucose, Sucrose, Fructose, and Maltose in Fruits, Vegetables, and Their Products. Food Anal. Methods 2021, 14, 1227–1238. [Google Scholar] [CrossRef]
- Ni, C.; Zhu, B.; Wang, N.; Wang, M.; Chen, S.; Zhang, J.; Zhu, Y. Simple column-switching ion chromatography method for determining eight monosaccharides and oligosaccharides in honeydew and nectar. Food Chem. 2016, 194, 555–560. [Google Scholar] [CrossRef]
- Kubica, P.; Kot-Wasik, A.; Wasik, A.; Namieśnik, J.; Landowski, P. Modern approach for determination of lactulose, mannitol and sucrose in human urine using HPLC–MS/MS for the studies of intestinal and upper digestive tract permeability. J. Chromatogr. B 2012, 907, 34–40. [Google Scholar] [CrossRef] [PubMed]
- Sevcik, R.S.; Mowery, R.A.; Becker, C.; Chambliss, C.K. Rapid analysis of carbohydrates in aqueous extracts and hydrolysates of biomass using a carbonate-modified anion-exchange column. J. Chromatogr. A 2011, 1218, 1236–1243. [Google Scholar] [CrossRef]
- Suksom, W.; Wannachai, W.; Boonchiangma, S.; Chanthai, S.; Srijaranai, S. Ion Chromatographic Analysis of Monosaccharides and Disaccharides in Raw Sugar. Chromatographia 2015, 78, 873–879. [Google Scholar] [CrossRef]
- Filip, M.; Vlassa, M.; Coman, V.; Halmagyi, A. Simultaneous determination of glucose, fructose, sucrose and sorbitol in the leaf and fruit peel of different apple cultivars by the HPLC–RI optimized method. Food Chem. 2016, 199, 653–659. [Google Scholar] [CrossRef] [PubMed]
- Fa, Y.; Liang, W.; Cui, H.; Duan, Y.; Yang, M.; Gao, J.; Liu, H. Capillary ion chromatography–mass spectrometry for simultaneous determination of glucosylglycerol and sucrose in intracellular extracts of cyanobacteria. J. Chromatogr. B 2015, 1001, 169–173. [Google Scholar] [CrossRef] [PubMed]
- Barzen-Hanson, K.A.; Wilkes, R.A.; Aristilde, L. Quantitation of carbohydrate monomers and dimers by liquid chromatography coupled with high-resolution mass spectrometry. Carbohydr. Res. 2018, 468, 30–35. [Google Scholar] [CrossRef]
- Ghfar, A.A.; Wabaidur, S.M.; Ahmed, A.Y.B.H.; Alothman, Z.A.; Khan, M.R.; Al-Shaalan, N.H. Simultaneous determination of monosaccharides and oligosaccharides in dates using liquid chromatography–electrospray ionization mass spectrometry. Food Chem. 2015, 176, 487–492. [Google Scholar] [CrossRef]
- Li, F.; Zhang, H.; Li, Y.; Yu, Y.; Chen, Y.; Xie, M.; Duan, G. Simultaneous Identification and Quantification of Dextran 20 and Sucrose in Lyophilized Thrombin Powder by Size Exclusion Chromatography with ELSD. Chromatographia 2012, 75, 187–191. [Google Scholar] [CrossRef]
- Liu, Z.; Lou, Z.; Ding, X.; Li, X.; Qi, Y.; Zhu, Z.; Chai, Y. Global characterization of neutral saccharides in crude and processed Radix Rehmanniae by hydrophilic interaction liquid chromatography tandem electrospray ionization time-of-flight mass spectrometry. Food Chem. 2013, 141, 2833–2840. [Google Scholar] [CrossRef] [PubMed]
- Li, J.; Chen, M.; Zhu, Y. Separation and determination of carbohydrates in drinks by ion chromatography with a self-regenerating suppressor and an evaporative light-scattering detector. J. Chromatogr. A 2007, 1155, 50–56. [Google Scholar] [CrossRef] [PubMed]
- Sun, S.; Wang, H.; Xie, J.; Su, Y. Simultaneous determination of rhamnose, xylitol, arabitol, fructose, glucose, inositol, sucrose, maltose in jujube (Zizyphus jujube Mill.) extract: Comparison of HPLC-ELSD, LC-ESI-MS/MS and GC-MS. Chem. Cent. J. 2016, 10, 25. [Google Scholar] [CrossRef] [PubMed]
- Medeiros, P.M.; Simoneit, B.R. Analysis of sugars in environmental samples by gas chromatography—Mass spectrometry. J. Chromatogr. A 2007, 1141, 271–278. [Google Scholar] [CrossRef]
- Cai, K.; Hu, D.; Lei, B.; Zhao, H.; Pan, W.; Song, B. Determination of carbohydrates in tobacco by pressurized liquid extraction combined with a novel ultrasound-assisted dispersive liquid–liquid microextraction method. Anal. Chim. Acta 2015, 882, 90–100. [Google Scholar] [CrossRef]
- Aid, T.; Paist, L.; Lopp, M.; Kaljurand, M.; Vaher, M. An optimized capillary electrophoresis method for the simultaneous analysis of biomass degradation products in ionic liquid containing samples. J. Chromatogr. A 2016, 1447, 141–147. [Google Scholar] [CrossRef]
- Rizelio, V.M.; Tenfen, L.; da Silveira, R.; Gonzaga, L.V.; Costa, A.C.O.; Fett, R. Development of a fast capillary electrophoresis method for determination of carbohydrates in honey samples. Talanta 2012, 93, 62–66. [Google Scholar] [CrossRef]
- Sarazin, C.; Delaunay, N.; Costanza, C.; Eudes, V.; Gareil, P. Application of a new capillary electrophoretic method for the determination of carbohydrates in forensic, pharmaceutical, and beverage samples. Talanta 2012, 99, 202–206. [Google Scholar] [CrossRef]
- Cortacero Ramírez, S.; Segura Carretero, A.; Cruces Blanco, C.; de Castro, M.H.B.; Fernández Gutiérrez, A. Indirect determination of carbohydrates in wort samples and dietetic products by capillary electrophoresis. J. Sci. Food Agric. 2005, 85, 517–521. [Google Scholar] [CrossRef]
- Zhu, J.; Shu, L.; Wu, M.; Wang, Z.; Wang, Q.; He, P.; Fang, Y. Development of a compact chemiluminescence system coupled with capillary electrophoresis for carbohydrate analysis. Talanta 2012, 93, 428–432. [Google Scholar] [CrossRef] [PubMed]
- Vochyánová, B.; Opekar, F.; Tůma, P.; Štulík, K. Rapid determinations of saccharides in high-energy drinks by short-capillary electrophoresis with contactless conductivity detection. Anal. Bioanal. Chem. 2012, 404, 1549–1554. [Google Scholar] [CrossRef] [PubMed]
- Liang, P.; Sun, M.; He, P.; Zhang, L.; Chen, G. Determination of carbohydrates in honey and milk by capillary electrophoresis in combination with graphene—Cobalt microsphere hybrid paste electrodes. Food Chem. 2016, 190, 64–70. [Google Scholar] [CrossRef]
- Chen, Q.; Zhang, L.; Chen, G. Facile Preparation of Graphene-Copper Nanoparticle Composite by in Situ Chemical Reduction for Electrochemical Sensing of Carbohydrates. Anal. Chem. 2012, 84, 171–178. [Google Scholar] [CrossRef]
- Cheng, X.; Zhang, S.; Zhang, H.; Wang, Q.; He, P.; Fang, Y. Determination of carbohydrates by capillary zone electrophoresis with amperometric detection at a nano-nickel oxide modified carbon paste electrode. Food Chem. 2008, 106, 830–835. [Google Scholar] [CrossRef]
- Chen, G.; Zhang, L.; Zhu, Y. Determination of glycosides and sugars in Moutan Cortex by capillary electrophoresis with electrochemical detection. J. Pharm. Biomed. Anal. 2006, 41, 129–134. [Google Scholar] [CrossRef]
- Silveira, L., Jr.; Moreira, L.M.; Conceição, V.G.B.; Casalechi, H.L.; Muñoz, I.S.; Da Silva, F.F.; Silva, M.A.S.R.; De Souza, R.A.; Pacheco, M.T.T. Determination of sucrose concentration in lemon-type soft drinks by dispersive Raman spectroscopy. Spectroscopy 2009, 23, 217–226. [Google Scholar] [CrossRef]
- Ilaslan, K.; Boyaci, I.H.; Topcu, A. Rapid analysis of glucose, fructose and sucrose contents of commercial soft drinks using Raman spectroscopy. Food Control 2015, 48, 56–61. [Google Scholar] [CrossRef]
- Kemsley, E.; Zhuo, L.; Hammouri, M.; Wilson, R. Quantitative analysis of sugar solutions using infrared spectroscopy. Food Chem. 1992, 44, 299–304. [Google Scholar] [CrossRef]
- Rodriguez-Saona, L.E.; Fry, F.S.; McLaughlin, M.A.; Calvey, E.M. Rapid analysis of sugars in fruit juices by FT-NIR spectroscopy. Carbohydr. Res. 2001, 336, 63–74. [Google Scholar] [CrossRef] [PubMed]
- Cao, R.; Nonaka, A.; Komura, F.; Matsui, T. Application of diffusion ordered-1H-nuclear magnetic resonance spectroscopy to quantify sucrose in beverages. Food Chem. 2015, 171, 8–12. [Google Scholar] [CrossRef]
- Vargas, E.; Gamella, M.; Campuzano, S.; Guzmán-Vázquez de Prada, A.; Ruiz, M.; Reviejo, A.; Pingarrón, J. Development of an integrated electrochemical biosensor for sucrose and its implementation in a continuous flow system for the simultaneous monitoring of sucrose, fructose and glucose. Talanta 2013, 105, 93–100. [Google Scholar] [CrossRef] [PubMed]
- Majer-Baranyi, K.; Adányi, N.; Váradi, M. Investigation of a multienzyme based amperometric biosensor for determination of sucrose in fruit juices. Eur. Food Res. Technol. 2008, 228, 139–144. [Google Scholar] [CrossRef]
- Stredansky, M.; Redivo, L.; Magdolen, P.; Stredansky, A.; Navarini, L. Rapid sucrose monitoring in green coffee samples using multienzymatic biosensor. Food Chem. 2018, 254, 8–12. [Google Scholar] [CrossRef] [PubMed]
- Aksorn, J.; Teepoo, S. Development of the simultaneous colorimetric enzymatic detection of sucrose, fructose and glucose using a microfluidic paper-based analytical device. Talanta 2020, 207, 120302. [Google Scholar] [CrossRef] [PubMed]
- Trebbi, D.; McGrath, J.M. Fluorometric Sucrose Evaluation for Sugar Beet. J. Agric. Food Chem. 2004, 52, 6862–6867. [Google Scholar] [CrossRef]
- García de María, C.; Townsend, A. Sequential determination of glucose, fructose and sucrose by flow-injection analysis with immobilized enzyme reactors and spectrophotometric detection. Anal. Chim. Acta 1992, 261, 137–143. [Google Scholar] [CrossRef]
- Mandenius, C.F.; Bülow, L.; Danielsson, B.; Mosbach, K. Monitoring and control of enzymic sucrose hydrolysis using on-line biosensors. Appl. Microbiol. Biotechnol. 1985, 21, 135–142. [Google Scholar] [CrossRef]
- Maestre, E.; Katakis, I.; Domínguez, E. Amperometric flow-injection determination of sucrose with a mediated tri-enzyme electrode based on sucrose phosphorylase and electrocatalytic oxidation of NADH. Biosens. Bioelectron. 2001, 16, 61–68. [Google Scholar] [CrossRef]
- Kogure, M.; Mori, H.; Ariki, H.; Kojima, C.; Yamamoto, H. Determination of sucrose using sucrose phosphorylase in a flow-injection system. Anal. Chim. Acta 1997, 337, 107–111. [Google Scholar] [CrossRef]
- Della Pelle, F.; Scroccarello, A.; Scarano, S.; Compagnone, D. Silver nanoparticles-based plasmonic assay for the determination of sugar content in food matrices. Anal. Chim. Acta 2019, 1051, 129–137. [Google Scholar] [CrossRef]
- Aguila Rodriguez, G.; Arias Duque, N.P.; Gonzalez Sanchez, B.E.; Sandoval Gonzalez, O.O.; Giraldo Osorio, O.H.; Trujillo Romero, C.J.; Wilches Torres, M.A.; Flores Cuautle, J.D.J.A. Sugar Concentration Measurement System Using Radiofrequency Sensor. Sensors 2019, 19, 2354. [Google Scholar] [CrossRef] [PubMed]
- Saini, R.; Kumar, A.; Bhatt, G.; Kapoor, A.; Paliwal, A.; Tomar, M.; Gupta, V. Lossy Mode Resonance-Based Refractive Index Sensor for Sucrose Concentration Measurement. IEEE Sens. J. 2020, 20, 1217–1222. [Google Scholar] [CrossRef]
- Shekarchizadeh, H.; Ensafi, A.A.; Kadivar, M. Selective determination of sucrose based on electropolymerized molecularly imprinted polymer modified multiwall carbon nanotubes/glassy carbon electrode. Mater. Sci. Eng. C 2013, 33, 3553–3561. [Google Scholar] [CrossRef] [PubMed]
- Mono- and Oligosaccharides. In Handbook of Food Analytical Chemistry; John Wiley & Sons, Ltd.: Hoboken, NJ, USA, 2004. [CrossRef]
- Harvey, D.J. Derivatization of carbohydrates for analysis by chromatography; electrophoresis and mass spectrometry. J. Chromatogr. B 2011, 879, 1196–1225. [Google Scholar] [CrossRef]
- de Almeida, V.E.; de Araújo Gomes, A.; de Sousa Fernandes, D.D.; Goicoechea, H.C.; Galvão, R.K.H.; Araújo, M.C.U. Vis-NIR spectrometric determination of Brix and sucrose in sugar production samples using kernel partial least squares with interval selection based on the successive projections algorithm. Talanta 2018, 181, 38–43. [Google Scholar] [CrossRef]
- Xie, L.; Ye, X.; Liu, D.; Ying, Y. Quantification of glucose, fructose and sucrose in bayberry juice by NIR and PLS. Food Chem. 2009, 114, 1135–1140. [Google Scholar] [CrossRef]
- Huck, C.W. Advances of infrared spectroscopy in natural product research. Phytochem. Lett. 2015, 11, 384–393. [Google Scholar] [CrossRef]
- Pallua, J.D.; Pezzei, C.; Huck-Pezzei, V.; Schonbichler, S.A.; Bittner, L.K.; Bonn, G.K.; Saeed, A.; Majeed, S.; Farooq, A.; Najam-ul Haq, M.; et al. Advances of Infrared Spectroscopic Imaging and Mapping Technologies of Plant Material. Curr. Bioact. Compd. 2011, 7, 106–117. [Google Scholar] [CrossRef]
- Houhou, R.; Bocklitz, T. Trends in artificial intelligence, machine learning, and chemometrics applied to chemical data. Anal. Sci. Adv. 2021, 2, 128–141. [Google Scholar] [CrossRef]
- Guo, S.; Popp, J.; Bocklitz, T. Chemometric analysis in Raman spectroscopy from experimental design to machine learning-based modeling. Nat. Protoc. 2021, 16, 5426–5459. [Google Scholar] [CrossRef]
- Torrione, P.; Collins, L.; Morton, K. 5-Multivariate analysis, chemometrics, and machine learning in laser spectroscopy. In Laser Spectroscopy for Sensing; Baudelet, M., Ed.; Woodhead Publishing: Cambridge, UK, 2014; pp. 125–164. [Google Scholar] [CrossRef]
- Lager, I.; Looger, L.L.; Hilpert, M.; Lalonde, S.; Frommer, W.B. Conversion of a Putative Agrobacterium Sugar-binding Protein into a FRET Sensor with High Selectivity for Sucrose. J. Biol. Chem. 2006, 281, 30875–30883. [Google Scholar] [CrossRef]
- Sharma, V.; Surolia, A. Analyses of carbohydrate recognition by legume lectins: Size of the combining site loops and their primary specificity. J. Mol. Biol. 1997, 267, 433–445. [Google Scholar] [CrossRef]
- Casset, F.; Hamelryck, T.; Loris, R.; Brisson, J.R.; Tellier, C.; Dao-Thi, M.H.; Wyns, L.; Poortmans, F.; Pérez, S.; Imberty, A. NMR, Molecular Modeling, and Crystallographic Studies of Lentil Lectin-Sucrose Interaction. J. Biol. Chem. 1995, 270, 25619–25628. [Google Scholar] [CrossRef]
- Loris, R.; Imberty, A.; Beeckmans, S.; Van Driessche, E.; Read, J.S.; Bouckaert, J.; De Greve, H.; Buts, L.; Wyns, L. Crystal Structure of Pterocarpus angolensis Lectin in Complex with Glucose, Sucrose, and Turanose. J. Biol. Chem. 2003, 278, 16297–16303. [Google Scholar] [CrossRef] [PubMed]
- Wu, X.; Li, Z.; Chen, X.X.; Fossey, J.S.; James, T.D.; Jiang, Y.B. Selective sensing of saccharides using simple boronic acids and their aggregates. Chem. Soc. Rev. 2013, 42, 8032–8048. [Google Scholar] [CrossRef]
- Tromans, R.A.; Carter, T.S.; Chabanne, L.; Crump, M.P.; Li, H.; Matlock, J.V.; Orchard, M.G.; Davis, A.P. A biomimetic receptor for glucose. Nat. Chem. 2019, 11, 52–56. [Google Scholar] [CrossRef]
- Trollope, K.M.; van Wyk, N.; Kotjomela, M.A.; Volschenk, H. Sequence and structure-based prediction of fructosyltransferase activity for functional subclassification of fungal GH32 enzymes. Febs J. 2015, 282, 4782–4796. [Google Scholar] [CrossRef] [PubMed]
- Sainz-Polo, M.; Ramírez-Escudero, M.; Lafraya, A.; González, B.; Marín-Navarro, J.; Polaina, J.; Sanz-Aparicio, J. Three-dimensional Structure of Saccharomyces Invertase: Role of a non-catalytic domain in oligomerization and substrate specificity. J. Biol. Chem. 2013, 288, 9755–9766. [Google Scholar] [CrossRef] [PubMed]
- Lammens, W.; Le Roy, K.; Van Laere, A.; Rabijns, A.; Van den Ende, W. Crystal Structures of Arabidopsis thaliana Cell-Wall Invertase Mutants in Complex with Sucrose. J. Mol. Biol. 2008, 377, 378–385. [Google Scholar] [CrossRef] [PubMed]
- Mátrai, J.; Lammens, W.; Jonckheer, A.; Le Roy, K.; Rabijns, A.; Van den Ende, W.; De Maeyer, M. An alternate sucrose binding mode in the E203Q Arabidopsis invertase mutant: An X-ray crystallography and docking study. Proteins Struct. Funct. Bioinform. 2008, 71, 552–564. [Google Scholar] [CrossRef]
- Sturm, A. Invertases. Primary Structures, Functions, and Roles in Plant Development and Sucrose Partitioning. Plant Physiol. 1999, 121, 1–7. [Google Scholar] [CrossRef] [PubMed]
- Kulshrestha, S.; Tyagi, P.; Sindhi, V.; Yadavilli, K.S. Invertase and its applications—A brief review. J. Pharm. Res. 2013, 7, 792–797. [Google Scholar] [CrossRef]
- Goedl, C.; Sawangwan, T.; Wildberger, P.; Nidetzky, B. Sucrose phosphorylase: A powerful transglucosylation catalyst for synthesis of α-D-glucosides as industrial fine chemicals. Biocatal. Biotransform. 2010, 28, 10–21. [Google Scholar] [CrossRef]
- Sprogøe, D.; van den Broek, L.A.M.; Mirza, O.; Kastrup, J.S.; Voragen, A.G.J.; Gajhede, M.; Skov, L.K. Crystal Structure of Sucrose Phosphorylase from Bifidobacterium adolescentis. Biochemistry 2004, 43, 1156–1162. [Google Scholar] [CrossRef] [PubMed]
- Franceus, J.; Desmet, T. Sucrose Phosphorylase and Related Enzymes in Glycoside Hydrolase Family 13: Discovery, Application and Engineering. Int. J. Mol. Sci. 2020, 21, 2526. [Google Scholar] [CrossRef]
- Mirza, O.; Skov, L.K.; Sprogøe, D.; van den Broek, L.A.; Beldman, G.; Kastrup, J.S.; Gajhede, M. Structural Rearrangements of Sucrose Phosphorylase from Bifidobacterium adolescentis during Sucrose Conversion. J. Biol. Chem. 2006, 281, 35576–35584. [Google Scholar] [CrossRef]
- Singh, R.; Singh, A.; Sachan, S. Enzymes Used in the Food Industry: Friends or Foes? In Enzymes in Food Biotechnology; Kuddus, M., Ed.; Academic Press: Cambridge, MA, USA, 2019; pp. 827–843. [Google Scholar] [CrossRef]
- Bezrutczyk, M.; Hartwig, T.; Horschman, M.; Char, S.N.; Yang, J.; Yang, B.; Frommer, W.B.; Sosso, D. Impaired phloem loading in zmsweet13a,b,c sucrose transporter triple knock-out mutants in Zea mays. New Phytol. 2018, 218, 594–603. [Google Scholar] [CrossRef] [PubMed]
- Lin, I.W.; Sosso, D.; Chen, L.Q.; Gase, K.; Kim, S.G.; Kessler, D.; Klinkenberg, P.M.; Gorder, M.K.; Hou, B.H.; Qu, X.Q.; et al. Nectar secretion requires sucrose phosphate synthases and the sugar transporter SWEET9. Nature 2014, 508, 546–549. [Google Scholar] [CrossRef]
- Sharon, N.; Lis, H. Lectins. In Encyclopedia of Biological Chemistry, 2nd ed.; Lennarz, W.J., Lane, M.D., Eds.; Academic Press: Waltham, MA, USA, 2013; pp. 701–705. [Google Scholar] [CrossRef]
- Loris, R.; Hamelryck, T.; Bouckaert, J.; Wyns, L. Legume lectin structure. Biochim. Biophys. Acta (Bba) Protein Struct. Mol. Enzymol. 1998, 1383, 9–36. [Google Scholar] [CrossRef]
- Naithani, S.; Komath, S.S.; Nonomura, A.; Govindjee, G. Plant lectins and their many roles: Carbohydrate-binding and beyond. J. Plant Physiol. 2021, 266, 153531. [Google Scholar] [CrossRef]
- Davis, A. Synthetic Lectins. In Comprehensive Supramolecular Chemistry II; Atwood, J.L., Ed.; Elsevier: Oxford, UK, 2017; pp. 181–201. [Google Scholar] [CrossRef]
- Davis, A.P. Sticking to sugars. Nature 2010, 464, 169–170. [Google Scholar] [CrossRef]
- Ferrand, Y.; Crump, M.P.; Davis, A.P. A Synthetic Lectin Analog for Biomimetic Disaccharide Recognition. Science 2007, 318, 619–622. [Google Scholar] [CrossRef]
- Liu, W.; Tan, Y.; Jones, L.O.; Song, B.; Guo, Q.H.; Zhang, L.; Qiu, Y.; Feng, Y.; Chen, X.Y.; Schatz, G.C.; et al. PCage: Fluorescent Molecular Temples for Binding Sugars in Water. J. Am. Chem. Soc. 2021, 143, 15688–15700. [Google Scholar] [CrossRef] [PubMed]
- Amrhein, F.; Mazik, M. Compounds Combining a Macrocyclic Building Block and Flexible Side-Arms as Carbohydrate Receptors: Syntheses and Structure-Binding Activity Relationship Studies. Eur. J. Org. Chem. 2021, 2021, 6282–6303. [Google Scholar] [CrossRef]
- Yang, W.; He, H.; Drueckhammer, D.G. Computer-Guided Design in Molecular Recognition: Design and Synthesis of a Glucopyranose Receptor. Angew. Chem. Int. Ed. 2001, 40, 1714–1718. [Google Scholar] [CrossRef]
- Furikado, Y.; Nagahata, T.; Okamoto, T.; Sugaya, T.; Iwatsuki, S.; Inamo, M.; Takagi, H.D.; Odani, A.; Ishihara, K. Universal Reaction Mechanism of Boronic Acids with Diols in Aqueous Solution: Kinetics and the Basic Concept of a Conditional Formation Constant. Chem. A Eur. J. 2014, 20, 13194–13202. [Google Scholar] [CrossRef] [PubMed]
- Brooks, W.L.A.; Sumerlin, B.S. Synthesis and Applications of Boronic Acid-Containing Polymers: From Materials to Medicine. Chem. Rev. 2016, 116, 1375–1397. [Google Scholar] [CrossRef] [PubMed]
- Liu, Z.; He, H. Synthesis and Applications of Boronate Affinity Materials: From Class Selectivity to Biomimetic Specificity. Acc. Chem. Res. 2017, 50, 2185–2193. [Google Scholar] [CrossRef] [PubMed]
- Rowan, A.E.; Rowan, S.J.; Aida, T.; James, T.D.; Phillips, M.D.; Shinkai, S. Boronic Acids in Saccharide Recognition; Monographs in Supramolecular Chemistry; The Royal Society of Chemistry: Cambridge, UK, 2006; pp. 1–174. [Google Scholar] [CrossRef]
- Yamashina, M.; Akita, M.; Hasegawa, T.; Hayashi, S.; Yoshizawa, M. A polyaromatic nanocapsule as a sucrose receptor in water. Sci. Adv. 2017, 3, e1701126. [Google Scholar] [CrossRef] [PubMed]
- James, T.D.; Sandanayake, K.R.A.S.; Shinkai, S. A Glucose-Selective Molecular Fluorescence Sensor. Angew. Chem. Int. Ed. Engl. 1994, 33, 2207–2209. [Google Scholar] [CrossRef]
- Wang, F.; Lu, M.; Yuan, H.; Zhang, Y.; Ji, W.; Sun, C.; Peng, W. pM Level and Large Dynamic Range Glucose Detection Based on a Sandwich Type Plasmonic Fiber Sensor. J. Light. Technol. 2021, 39, 3882–3889. [Google Scholar] [CrossRef]
- Chen, Q.; Fu, Y.; Zhang, W.; Ye, S.; Zhang, H.; Xie, F.; Gong, L.; Wei, Z.; Jin, H.; Chen, J. Highly sensitive detection of glucose: A quantitative approach employing nanorods assembled plasmonic substrate. Talanta 2017, 165, 516–521. [Google Scholar] [CrossRef] [PubMed]
- Kajisa, T.; Sakata, T. Fundamental Properties of Phenylboronic-Acid-Coated Gate Field-Effect Transistor for Saccharide Sensing. ChemElectroChem 2014, 1, 1647–1655. [Google Scholar] [CrossRef]
- Tlili, C.; Badhulika, S.; Tran, T.T.; Lee, I.; Mulchandani, A. Affinity chemiresistor sensor for sugars. Talanta 2014, 128, 473–479. [Google Scholar] [CrossRef] [PubMed]
- Yang, K.A.; Barbu, M.; Halim, M.; Pallavi, P.; Kim, B.; Kolpashchikov, D.M.; Pecic, S.; Taylor, S.; Worgall, T.S.; Stojanovic, M.N. Recognition and sensing of low-epitope targets via ternary complexes with oligonucleotides and synthetic receptors. Nat. Chem. 2014, 6, 1003–1008. [Google Scholar] [CrossRef] [PubMed]
- Nakatsuka, N.; Yang, K.A.; Abendroth, J.M.; Cheung, K.M.; Xu, X.; Yang, H.; Zhao, C.; Zhu, B.; Rim, Y.S.; Yang, Y.; et al. Aptamer-field-effect transistors overcome Debye length limitations for small-molecule sensing. Science 2018, 362, 319–324. [Google Scholar] [CrossRef]
- Sookcharoenpinyo, B.; Klein, E.; Ferrand, Y.; Walker, D.B.; Brotherhood, P.R.; Ke, C.; Crump, M.P.; Davis, A.P. High-Affinity Disaccharide Binding by Tricyclic Synthetic Lectins. Angew. Chem. Int. Ed. 2012, 51, 4586–4590. [Google Scholar] [CrossRef]
- Yan, J.; Springsteen, G.; Deeter, S.; Wang, B. The relationship among pKa, pH, and binding constants in the interactions between boronic acids and diols—it is not as simple as it appears. Tetrahedron 2004, 60, 11205–11209. [Google Scholar] [CrossRef]
- Peters, J.A. Interactions between boric acid derivatives and saccharides in aqueous media: Structures and stabilities of resulting esters. Coord. Chem. Rev. 2014, 268, 1–22. [Google Scholar] [CrossRef]
- Stephenson-Brown, A.; Wang, H.C.; Iqbal, P.; Preece, J.A.; Long, Y.; Fossey, J.S.; James, T.D.; Mendes, P.M. Glucose selective Surface Plasmon Resonance-based bis-boronic acid sensor. Analyst 2013, 138, 7140–7145. [Google Scholar] [CrossRef]
- Bian, Z.; Liu, A.; Li, Y.; Fang, G.; Yao, Q.; Zhang, G.; Wu, Z. Boronic acid sensors with double recognition sites: A review. Analyst 2020, 145, 719–744. [Google Scholar] [CrossRef]
- Qian, S.; Liang, Y.; Ma, J.; Zhang, Y.; Zhao, J.; Peng, W. Boronic acid modified fiber optic SPR sensor and its application in saccharide detection. Sens. Actuators Chem. 2015, 220, 1217–1223. [Google Scholar] [CrossRef]
- Yuan, H.; Ji, W.; Chu, S.; Qian, S.; Wang, F.; Masson, J.F.; Han, X.; Peng, W. Fiber-optic surface plasmon resonance glucose sensor enhanced with phenylboronic acid modified Au nanoparticles. Biosens. Bioelectron. 2018, 117, 637–643. [Google Scholar] [CrossRef] [PubMed]
- Larkin, J.D.; Frimat, K.A.; Fyles, T.M.; Flower, S.E.; James, T.D. Boronic acid based photoinduced electron transfer (PET) fluorescence sensors for saccharides. New J. Chem. 2010, 34, 2922–2931. [Google Scholar] [CrossRef]
- Mou, Q.; Xue, X.; Ma, Y.; Banik, M.; Garcia, V.; Guo, W.; Wang, J.; Song, T.; Chen, L.Q.; Lu, Y. Efficient delivery of a DNA aptamer-based biosensor into plant cells for glucose sensing through thiol-mediated uptake. Sci. Adv. 2022, 8, eabo0902. [Google Scholar] [CrossRef]
- Sandanayake, K.R.A.S.; Nakashima, K.; Shinkai, S. Specific recognition of disaccharides by trans-3,3’-stilbenediboronic acid: Rigidification and fluoresecence enhancement of the stilbene skeleton upon formation of a sugar–stilbene macrocycle. J. Chem. Soc. Chem. Commun. 1994, 14, 1621–1622. [Google Scholar] [CrossRef]
- Zhang, X.t.; Wang, S.; Xing, G.w. Novel Boronlectins Based on Bispyridium Salt with a Flexible Linker: Discriminative Sensing of Lactose and Other Monosaccharides and Disaccharides in Aqueous Solution. Chem. Asian J. 2015, 10, 2594–2598. [Google Scholar] [CrossRef] [PubMed]
- Chi, L.; Zhao, J.; James, T.D. Chiral Mono Boronic Acid As Fluorescent Enantioselective Sensor for Mono α-Hydroxyl Carboxylic Acids. J. Org. Chem. 2008, 73, 4684–4687. [Google Scholar] [CrossRef]
- Egawa, Y.; Seki, T.; Takahashi, S.; Ichi Anzai, J. Electrochemical and optical sugar sensors based on phenylboronic acid and its derivatives. Mater. Sci. Eng. C 2011, 31, 1257–1264. [Google Scholar] [CrossRef]
- Williams, G.T.; Kedge, J.L.; Fossey, J.S. Molecular Boronic Acid-Based Saccharide Sensors. ACS Sens. 2021, 6, 1508–1528. [Google Scholar] [CrossRef]
- D’Hooge, F.; Elfeky, S.A.; Flower, S.E.; Pascu, S.I.; Jenkins, A.T.A.; Elsen, J.M.H.v.d.; James, T.D.; Fossey, J.S. Biotinylated boronic acid fluorophore conjugates: Quencher elimination strategy for imaging and saccharide detection. RSC Adv. 2012, 2, 3274–3280. [Google Scholar] [CrossRef]
- Pushina, M.; Penavic, A.; Farshbaf, S.; Anzenbacher, P. Fluorescent Sensor Array for Quantitative Determination of Saccharides. ACS Sens. 2021, 6, 4001–4008. [Google Scholar] [CrossRef] [PubMed]
- Seraj, S.; Rouhani, S.; Ranjbar, Z.; Esfahani, S.L. Fructose recognition using novel solid-state electro-optical nanosensor based on boronate-tagged fluorophore modified graphene oxide. Mater. Chem. Phys. 2021, 270, 124842. [Google Scholar] [CrossRef]
- Shoji, E.; Freund, M.S. Potentiometric Saccharide Detection Based on the pKa Changes of Poly(aniline boronic acid). J. Am. Chem. Soc. 2002, 124, 12486–12493. [Google Scholar] [CrossRef] [PubMed]
- Kong, K.V.; Lam, Z.; Lau, W.K.O.; Leong, W.K.; Olivo, M. A Transition Metal Carbonyl Probe for Use in a Highly Specific and Sensitive SERS-Based Assay for Glucose. J. Am. Chem. Soc. 2013, 135, 18028–18031. [Google Scholar] [CrossRef]
- Cieplak, M.; Kutner, W. Artificial Biosensors: How Can Molecular Imprinting Mimic Biorecognition? Trends Biotechnol. 2016, 34, 922–941. [Google Scholar] [CrossRef]
- Kajisa, T.; Sakata, T. Molecularly Imprinted Artificial Biointerface for an Enzyme-Free Glucose Transistor. ACS Appl. Mater. Interfaces 2018, 10, 34983–34990. [Google Scholar] [CrossRef]
- Okutucu, B.; Önal, S. Molecularly imprinted polymers for separation of various sugars from human urine. Talanta 2011, 87, 74–79. [Google Scholar] [CrossRef]
- Sakata, T.; Nishitani, S.; Kajisa, T. Molecularly imprinted polymer-based bioelectrical interfaces with intrinsic molecular charges. RSC Adv. 2020, 10, 16999–17013. [Google Scholar] [CrossRef]
- Kirk, C.; Jensen, M.; Kjaer, C.N.; Smedskjaer, M.M.; Larsen, K.L.; Wimmer, R.; Yu, D. Aqueous batch rebinding and selectivity studies on sucrose imprinted polymers. Biosens. Bioelectron. 2009, 25, 623–628. [Google Scholar] [CrossRef]
- An, J.Y.; Azizov, S.; Kumar, A.P.; Lee, Y.I. Quantitative Analysis of Artificial Sweeteners by Capillary Electrophoresis with a Dual-Capillary Design of Molecularly Imprinted Solid-Phase Extractor. Bull. Korean Chem. Soc. 2018, 39, 1315–1319. [Google Scholar] [CrossRef]
- Mugo, S.M.; Alberkant, J. Flexible molecularly imprinted electrochemical sensor for cortisol monitoring in sweat. Anal. Bioanal. Chem. 2020, 412, 1825–1833. [Google Scholar] [CrossRef] [PubMed]
- Doué, M.; Bichon, E.; Dervilly-Pinel, G.; Pichon, V.; Chapuis-Hugon, F.; Lesellier, E.; West, C.; Monteau, F.; Le Bizec, B. Molecularly imprinted polymer applied to the selective isolation of urinary steroid hormones: An efficient tool in the control of natural steroid hormones abuse in cattle. J. Chromatogr. A 2012, 1270, 51–61. [Google Scholar] [CrossRef] [PubMed]
- Culver, H.R.; Peppas, N.A. Protein-Imprinted Polymers: The Shape of Things to Come? Chem. Mater. 2017, 29, 5753–5761. [Google Scholar] [CrossRef] [PubMed]
- Sullivan, M.V.; Dennison, S.R.; Archontis, G.; Reddy, S.M.; Hayes, J.M. Toward Rational Design of Selective Molecularly Imprinted Polymers (MIPs) for Proteins: Computational and Experimental Studies of Acrylamide Based Polymers for Myoglobin. J. Phys. Chem. B 2019, 123, 5432–5443. [Google Scholar] [CrossRef] [PubMed]
- Selvolini, G.; Marrazza, G. MIP-Based Sensors: Promising New Tools for Cancer Biomarker Determination. Sensors 2017, 17, 718. [Google Scholar] [CrossRef] [PubMed]
- Zarycz, M.N.C.; Fonseca Guerra, C. NMR 1H-Shielding Constants of Hydrogen-Bond Donor Reflect Manifestation of the Pauli Principle. J. Phys. Chem. Lett. 2018, 9, 3720–3724. [Google Scholar] [CrossRef] [PubMed]
- Piletska, E.V.; Guerreiro, A.R.; Romero-Guerra, M.; Chianella, I.; Turner, A.P.; Piletsky, S.A. Design of molecular imprinted polymers compatible with aqueous environment. Anal. Chim. Acta 2008, 607, 54–60. [Google Scholar] [CrossRef] [PubMed]
- Park, R.; Jeon, S.; Jeong, J.; Park, S.Y.; Han, D.W.; Hong, S.W. Recent Advances of Point-of-Care Devices Integrated with Molecularly Imprinted Polymers-Based Biosensors: From Biomolecule Sensing Design to Intraoral Fluid Testing. Biosensors 2022, 12, 136. [Google Scholar] [CrossRef]


| Property | Value |
|---|---|
| Melting point (C) | 160–186 |
| Specific rotation ( in deg) | +66.53 |
| Solubility in water at 20 C (g/mL) | 2.00 |
| Heat of solution (kJ/mol) | 4.75 ± 0.26 |
| Dipole moment (C m) | 3.1 × 10 |
| Normal entropy (J mol K) | 360.5 |
| Technique | Sample | LOD | LOQ | Detection Range | Reference |
|---|---|---|---|---|---|
| Polarimetry | |||||
| Polarimetry | Iron sucrose raw material | 0.222 mM | 0.674 mM | 29.2 mM–204.5 mM | [32] |
| Polarimetry | Sucrose hydrolysis by INV in solution | 2.28 M–50.2 mM | [29] | ||
| Liquid chromatography | |||||
| HPLC-ELSD | Fruits | 0.788 mM | 2.658 mM | [33] | |
| HPLC-(C-CAD)-ELSD | Food samples | 33.0 M | 73.0 M–5.8 mM | [34] | |
| HPLC-CAD | Fruit beverages and dietary supplements | 0.35 M | 1.16 M | 2.92 M–292.14 M | [35] |
| HPLC-RI | Milk based formulae | 0.46 mM | 0.75 mM | 1.4 mM–29.1 mM | [36] |
| HPLC-RI | Food samples | 0.29 mM | [37] | ||
| HPLC-PAD | Fruits and vegeteables | 0.861 M | 2.86 M | [38] | |
| HPLC-PAD | Honeydew and nectar | 22.4 M | 74.7 M | 29.2 M–58.4 mM | [39] |
| HPLC-MS | Human urine | 50.0 nM | 0.149 M | [40] | |
| HPLC-PAD | Biomass | 3.5 nM | 11.3 nM | 64.2 nM–502.4 nM | [41] |
| HPLC-PAD | Raw sugar | 1.5 M | 3.0 M | 3.0 M–3.0 M | [42] |
| HPLC-RI | Leaf and fruit peel apple | 9.37 M | 31.3 M | 0.809 mM–16.1 mM | [43] |
| HPLC-MS | Intracellular extracts of cyanobacteria | 58.4 nM | 0.20 M | 0.14 M–29.2 M | [44] |
| UHPLC-HRMS-ESI | in vitro laboratory solution | 0.24 M | 0.84 M | [45] | |
| UHPLC-MS-ESI | Palm friut | 0.73 M | 3.09 M | 2.9 M–146.1 M | [46] |
| Size exclusion chromatography and ELSD | Lyophilized thrombin powder | 0.292 mM | 0.043 mM | [47] | |
| LC-MS-ESI | Radix Rehmanniae root | 7.0 nM | 19.7 nM | 4.43 nM–886.3 nM | [48] |
| HPLC-ELSD | Carbonate cola drinks and fruit juices | 0.262 mM | 0.292 mM–2.92 mM | [49] | |
| HPLC-ELSD | Jujube extract | 6.7 M | 23.3 M | 29.2 M–2.9 mM | [50] |
| Gas chromatography | |||||
| GC-MS | Aerosol particle, soil and sediment samples | 0.818 M | 3.5 M–350 M | [51] | |
| GC-FID | Tobacco samples | 0.26 M | 8.76 M–876.4 M | [52] | |
| GC-MS | Jujube extract | 0.84 M | 2.8 M | 3.0 M–3.0 mM | [50] |
| Capilar electrophoresis | |||||
| CE-DAD | Biomass | 0.20 mM–7.0 mM | [53] | ||
| CE-DAD | Honey samples | 64.2 M | 0.2 mM | 0.5 mM–3.4 mM | [54] |
| CE-DAD | Forensic, pharmaceutical, and beverage samples | 5.0 M | 15.0 M | 15.0 M - 700.0 M | [55] |
| CE-DAD | Wort samples | 97.9 M | 0.3 mM | 97.9 M–1.2 mM | [56] |
| CE-CL | 18.0 M | 50.0 M–10.0 mM | [57] | ||
| CE-Conductometry | High-energy drinks | 43.8 M | 0.15 mM | [58] | |
| CE-Amperometry | Honey, milk | 0.24 M | [59] | ||
| CE-Amperometry | Honey, milk, peach, banana | 0.42 M | [60] | ||
| CE-Amperometry | Honey | 0.6 M | 2.0 M–1.0 mM | [61] | |
| CE-Amperometry | Moutan cortex | 1.2 M | 5.0 M–2.0 mM | [62] | |
| Spectroscopy | |||||
| Raman | Commercial soft drinks | 2.92 M–43.82 M | [63] | ||
| Raman | Lemon-type soft drinks | 5.84 mM | 24.0 mM | 24.0 mM–350.0 mM | [64] |
| IR | Commercial soft drinks | 0.10 M–1.20 M | [65] | ||
| FT-NIR | Fruit juices | 58.42 mM–233.0 mM | [66] | ||
| DOSY-qNMR | Fruit juices and sports drink | 1.46 mM–58.42 mM | [67] | ||
| Natural receptors | |||||
| INV-FDH for amperometric detection | Condensed milk and infant food | 0.36 M | 1.2 M–3.0 mM | [68] | |
| INV-Mut/PO-GOx and amperometric detection | Fruit juices | 0.1 mM–2.5 mM | [69] | ||
| INV-Mut/PO-(FAD-GDH) biosensor and amperometric detection | Green coffe samples | 8.4 M | 10 M–1200 M | [70] | |
| PAD-INV-GOx and Colorimetric detection | Sugar juice plants | 0.90 mM | 1.0 mM–25 mM | [71] | |
| INV-GOx and Fluorimetric detection | Root beet extracts | 1 M–16 M | [72] | ||
| INV-HK-G6PDH-PGI and spectrophotometric detection | 20.0 M | 80.0 M–12.0 mM | [73] | ||
| INV-GOx-CAT thermistor biosensor | 0.1 mM–50.0 mM | [74] | |||
| SP-PGM-G6PDH and amperometric detection | Fruit juices | 1.0 mM | 1.0 mM–15.0 mM | [75] | |
| SP-PGM-G6PDH and and Fluorimetric detection | Soft drinks | 0.1 M | 0.1 M–200.0 M | [76] | |
| Genetically encoded FRET sensor FLIPsuc-901 mutants | Pure solutions of sucrose | 7 M–585 M | [14] | ||
| Miscellaneous | |||||
| AgNPs-colorimetric detection | Food samples | 0.1 mM–1.0 mM | [77] | ||
| RF(THz) | Aqueous sucrose solution | 0.438–2.921 ± 0.146 M | [78] | ||
| Lossy Mode Resonance-Based Refractive Index | 0.6 M–1.8 M | [79] | |||
| Molecular Imprinted Polymers | Sucrose in sugar beet juices | 3.0 mM | 0.01mM–10.0 mM | [80] | |
| Band (cm) | Band Assigment |
|---|---|
| 824 | CH out-of-plane deformation |
| 911 | CH out-of-plane wagging |
| 1052 | C–O stretching |
| 1119 | C–O stretching |
| 1255 | C–O–C antisymmetric stretching |
| 1445 | CH scissoring vibration |
| Substrate | Activity |
|---|---|
| Sucrose | 520 ± 20 |
| 1-ketose | 102 ± 11 |
| Nystose | 36 ± 1 |
| Raffinose | 187 ± 8 |
| Inulin | 2.5 ± 0.1 |
| Receptor | Analyte | LOD | Detection Range | Detector | References | |
|---|---|---|---|---|---|---|
| Natural receptors—FLIPs and Lectins | ||||||
| FLIPsuc-901 | Sucrose | 65.0 M | 7 M–585 M | Fluorescence | [14] | |
| FLIPsuc-41 | Sucrose | 3.7 M | Fluorescence | [90] | ||
| FLIPsuc-41 W283A | Sucrose | 88.0 M | Fluorescence | [90] | ||
| Lectins | Monosaccharides | 2.0 mM–10.0 mM | [94,95] | |||
| Synthetic receptors—Temple molecules | ||||||
| Temple receptor | Glucose | 54.9 M | NMR, ITC | [95] | ||
| Temple receptor | -D-Cellobiose | 1.0 mM | NMR, ITC, CD, Fluorescence | [114] | ||
| Temple receptor | D-Cellobiose | 1.7 mM | NMR, ITC, CD, Fluorescence | [114] | ||
| ML Nanocapsule | Sucrose | 909.0 M | NMR-NOESY | [122] | ||
| Synthetic receptors—Aryl Boronic Acids | ||||||
| PBA | Fructose | 228.8 M | Fluorescence | [94] | ||
| PBA | Glucose | 9.0 mM | Fluorescence | [94] | ||
| Computational designed tweezer ligand | Fructose | 10.0 mM | Fluorescence | [117] | ||
| Computational designed tweezer ligand | Glucose | 25.0 M | Fluorescence | [117] | ||
| Shinkai ligand | Glucose | 3.8 mM | Fluorescence | [123] | ||
| Sandwich type sensor | Glucose | 295.0 pM | 1.0 nM–1.0 M | Plasmonic fiber sensor | [124] | |
| Sandwich type sensor | Glucose | 10 nM | 10.0 nM–10.0 mM | SERS | [125] | |
| MPBA | Sucrose | 7.9 M | 50 M–40 mM | FET | [126] | |
| PBA-SWCNT | Sucrose | 2.5 mM | 1 mM–30 mM | Chemresistor | [127] | |
| Aptamers | ||||||
| Shinkai ligand + aptamer | Glucose | 1.7 M | 1.0 M–10.0 M | Fluosrescence | [128] | |
| Aptamer | Glucose | 10.0 mM | 10.0 pM–10.0 nM | FET | [129] | |
Publisher’s Note: MDPI stays neutral with regard to jurisdictional claims in published maps and institutional affiliations. |
© 2022 by the authors. Licensee MDPI, Basel, Switzerland. This article is an open access article distributed under the terms and conditions of the Creative Commons Attribution (CC BY) license (https://creativecommons.org/licenses/by/4.0/).
Share and Cite
Lara-Cruz, G.A.; Jaramillo-Botero, A. Molecular Level Sucrose Quantification: A Critical Review. Sensors 2022, 22, 9511. https://doi.org/10.3390/s22239511
Lara-Cruz GA, Jaramillo-Botero A. Molecular Level Sucrose Quantification: A Critical Review. Sensors. 2022; 22(23):9511. https://doi.org/10.3390/s22239511
Chicago/Turabian StyleLara-Cruz, Gustavo A., and Andres Jaramillo-Botero. 2022. "Molecular Level Sucrose Quantification: A Critical Review" Sensors 22, no. 23: 9511. https://doi.org/10.3390/s22239511
APA StyleLara-Cruz, G. A., & Jaramillo-Botero, A. (2022). Molecular Level Sucrose Quantification: A Critical Review. Sensors, 22(23), 9511. https://doi.org/10.3390/s22239511