
Effects of Apple Vinegar Addition on Aerobic Deterioration of Fermented High Moisture Maize Using Infrared Thermography as an Indicator

 ,
,  , , , and
Abstract
:1. Introduction
2. Materials and Methods
2.1. Silage Material
2.2. Laboratory Analysis
2.3. Infrared Thermal Camera Imaging
2.4. Statistical Analysis
3. Results and Discussion
3.1. 2nd Day of Aerobic Deterioration
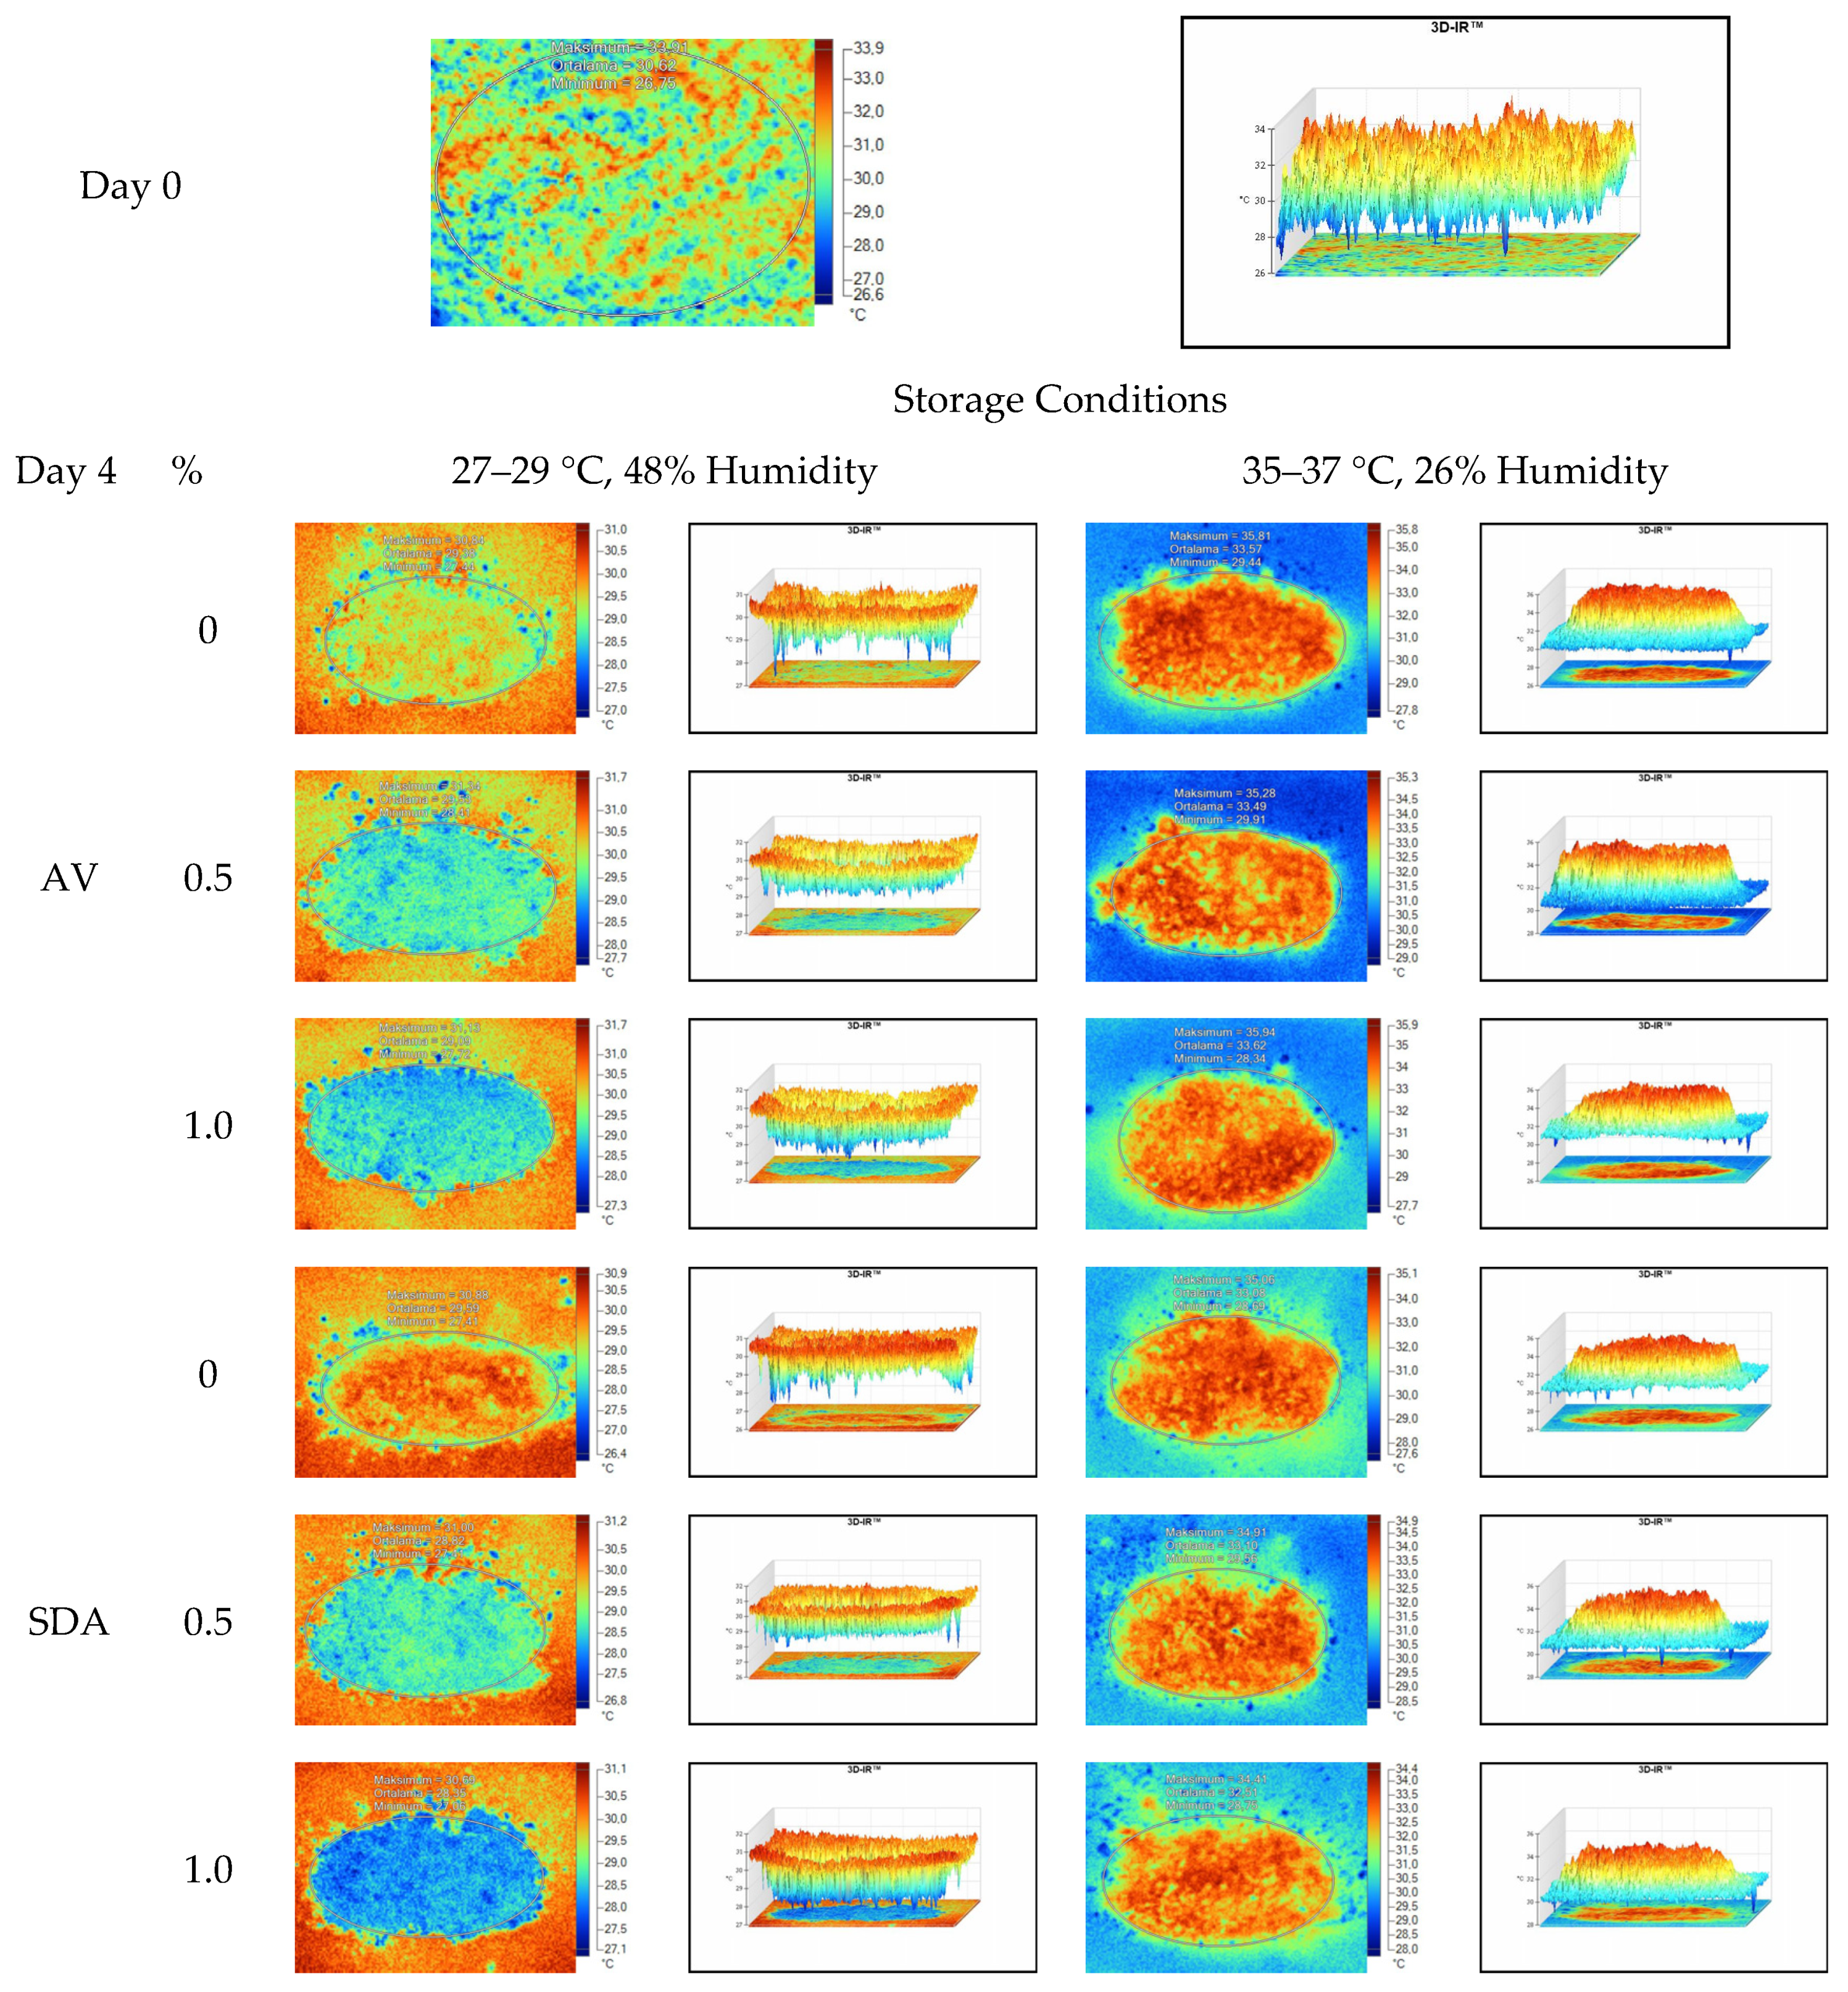
3.2. 4th Day of Aerobic Deterioration
3.3. 7th Day of Aerobic Deterioration
3.4. 12th Day of Aerobic Deterioration
3.5. Thermal Camera Imaging Results of Aerobic Stability
4. Conclusions
Author Contributions
Funding
Institutional Review Board Statement
Informed Consent Statement
Data Availability Statement
Acknowledgments
Conflicts of Interest
References
- Carvalho, B.F.; Sales, G.F.C.; Schwan, R.F.; Ávila, C.L.S. Criteria for lactic acid bacteria screening to enhance silage quality. J. Appl. Microbiol. 2020, 130, 341–355. [Google Scholar] [CrossRef]
- Guan, H.; Shuai, Y.; Yan, Y.; Ran, Q.; Wang, X.; Li, D.; Cai, Y.; Zhang, X. Microbial community and fermentation dynamics of corn silage prepared with heat-resistant lactic acid bacteria in a hot environment. Microorganisms 2020, 8, 719. [Google Scholar] [CrossRef] [PubMed]
- Borreani, G.; Tabacco, E.; Schmidt, R.J.; Holmes, B.J.; Muck, R.E. Silage review: Factors affecting dry matter and quality losses in silages. J. Dairy Sci. 2018, 101, 3952–3979. [Google Scholar] [CrossRef] [Green Version]
- Aslım, A.; Okuyucu, B.; Koç, F. Effects of Propionic Acid Additive on the Aerobic Stability Characteristics of Total Mixed Ration. Turk. J. Agric.-Food Sci. Technol. 2021, 9, 210–216. [Google Scholar] [CrossRef]
- Wardynski, F.A.; Rust, S.R.; Yokoyama, M.T. Effect of microbial inoculation of high-moisture corn on fermentation characteristics, aerobic stability, and cattle performance. J. Anim. Sci. 1993, 71, 2246–2252. [Google Scholar] [CrossRef] [PubMed] [Green Version]
- Dawson, T.E.; Rust, S.R.; Yokoyama, M.T. Improved fermentation and aerobic stability of ensiled, high moisture corn with the use of Propionibacterium acidipropionici. J. Dairy Sci. 1998, 81, 1015–1021. [Google Scholar] [CrossRef]
- Taylor, C.C.; Kung, L., Jr. The effect of Lactobacillus buchneri 40788 on the fermentation and aerobic stability of high moisture corn in laboratory silos. J. Dairy Sci. 2002, 85, 1526–1532. [Google Scholar] [CrossRef]
- Canibe, N.; Kristensen, N.B.; Jensen, B.B.; Vils, E. Impact of silage additives on aerobic stability and characteristics of high-moisture maize during exposure to air, and on fermented liquid feed. J. Appl. Microbiol. 2014, 116, 747–760. [Google Scholar] [CrossRef]
- Özelçam, H.; Daşıkan, H. Effect of carvacrol adding to corn silage on the aerobic stability. Ege Üniversitesi Ziraat Fakültesi Dergisi 2017, 54, 409–412. [Google Scholar] [CrossRef]
- Muck, R.E.; Nadeau, E.M.G.; McAllister, T.A.; Contreras-Govea, F.E.; Santos, M.C.; Kung, L., Jr. Silage review: Recent advances and future uses of silage additives. J. Dairy Sci. 2018, 101, 3980–4000. [Google Scholar] [CrossRef]
- Ousaaid, D.; Imtara, H.; Laaroussi, H.; Lyoussi, B.; Elarabi, I. An investigation of moroccan vinegars: Their physicochemical properties and antioxidant and antibacterial activities. J. Food Qual. 2021, 2021, 6618444. [Google Scholar] [CrossRef]
- Filya, I.; Sucu, E.; Karabulut, A. The effect of Propionibacterium acidipropionici, with or without Lactobacillus plantarum, on the fermentation and aerobic stability of wheat, sorghum and maize silages. J. Appl. Microbiol. 2004, 97, 818–826. [Google Scholar] [CrossRef]
- Junga, P.; Trávníček, P. Surface temperature of the exposed silo face as quick indicator of the decomposition process of maize silage. J. Cent. Eur. Agric. 2015, 16, 76–91. [Google Scholar] [CrossRef]
- Gálik, R.; Boďo, Š.; Staroňová, L. Using modern diagnostic methods for technological discipline assessment of maize silage. Acta Technol. Agric. 2 Nitra Slovaca Univ. Agric. Nitriae 2016, 19, 39–42. [Google Scholar] [CrossRef] [Green Version]
- McDonald, P.; Henderson, A.R.; Heron, S.J.E. The Biochemistry of Silage, 2nd ed.; Chalcombe Publications: Marlow, UK, 1991; p. 340. [Google Scholar]
- Muck, R.E.; Pitt, R.E.; Leibensperger, R.Y. A model of aerobic fungal growth in silage. 1. Microbial characteristics. Grass Forage Sci. 1991, 46, 283–299. [Google Scholar] [CrossRef]
- Pahlow, G.; Muck, R.E.; Driehuis, F.; Oude Elferink, S.J.W.H.; Spoelstra, S.F. Chapter 2: Microbiology of ensiling. In Silage Science and Technology; Buxton, D.R., Muck, R.E., Harrison, J.H., Eds.; American Society of Agronomy: Madison, WI, USA, 2003; Volume 42, pp. 31–93. [Google Scholar] [CrossRef]
- Santos, M.C.; Lock, A.L.; Mechor, G.D.; Kung, L., Jr. Effects of a spoilage yeast from silage on in vitro ruminal fermentation. J. Dairy Sci. 2014, 98, 2603–2610. [Google Scholar] [CrossRef] [PubMed] [Green Version]
- Hovinen, M.; Siivonen, J.; Taponen, S.; Hänninen, L.; Pastell, M.; Aisla, A.-M.; Pyörälä, S. Detection of clinical mastitis with the help of a thermal camera. J. Dairy Sci. 2008, 91, 4592–4598. [Google Scholar] [CrossRef]
- Gowen, A.A.; Tiwari, B.K.; Cullen, P.J.; McDonnell, K.; O’Donnell, C.P. Applications of thermal imaging in food quality and safety assessment. Trends Food Sci. Technol. 2010, 21, 190–200. [Google Scholar] [CrossRef]
- Addah, W.; Baah, J.; Okine, E.K.; McAllister, T.A. Use of thermal imaging and the in situ technique to assess the impact of an inoculant with feruloyl esterase activity on the aerobic stability and digestibility of barley silage. Can. J. Anim. Sci. 2012, 92, 381–394. [Google Scholar] [CrossRef]
- Talukder, S.; Kerrisk, K.L.; Ingenhoff, L.; Garcia, S.C.; Celi, P. Can digital infrared thermography help with prediction of ovulation in a pasture-based dairy. In Conference Proceedings, Current Topics in Dairy Production; The University of Sydney: Kiam, Australia, 2013; pp. 1–4. Available online: https://www.researchgate.net/publication/280734946_Can_digital_infrared_thermography_help_with_prediction_of_ovulation_in_a_pasture-based_dairy_system (accessed on 18 August 2020).
- Alsaaod, M.; Schaefer, A.L.; Büscher, W.; Steiner, A. The role of infrared thermography as a non-invasive tool for the detection of lameness in cattle. Sensors 2015, 15, 14513–14525. [Google Scholar] [CrossRef] [Green Version]
- Jackson, E.; Farrington, D.S.; Henderson, K. The Analysis of Agricultural Materials: A Manual of the Analytical Methods Used by the Agricultural Development and Advisory Service (ADAS); Reference Book: 427; Analytical Chemists’ Publications: London, UK, 1986; p. 248. [Google Scholar]
- Thomas, T.A. An automated procedure for the determination of soluble carboydrates in herbage. J. Sci. Food Agric. 1977, 28, 639–642. [Google Scholar] [CrossRef]
- Koc, F.; Coskuntuna, L. The comparison of the two different methods on the determination of organic acids in silage fodders. J. Anim. Prod. 2003, 44, 37–46. Available online: https://dergipark.org.tr/en/pub/hayuretim/issue/7626/99907 (accessed on 18 April 2021).
- Statistica. Statistica for the Windows Operating System; Stat Soft, Inc.: Tulsa, OK, USA, 1999. [Google Scholar]
- Demirel, M.; Cengiz, F.; Çelik, S.; Erdoğan, S. A study on degradability in rumen and silage quality of mixture of corn and hungarian vetch grown in Van ecological conditions. Yuz. Yil Univ. J. Agric. Sci. 2001, 11, 69–78. Available online: https://dergipark.org.tr/en/pub/yyutbd/issue/22001/236224 (accessed on 13 December 2021).
- Filya, I. The effect of Lactobacillus buchneri and Lactobacillus plantarum on the fermentation, aerobic stability, and ruminal degradability of low dry matter corn and sorghum silages. J. Dairy Sci. 2003, 86, 3575–3581. [Google Scholar] [CrossRef] [Green Version]
- Alçiçek, A.; Özkan, K. Silo yemlerinde fiziksel ve kimyasal yöntemlerle silaj kalitesinin saptanması [Determination of silage quality in silo feeds by physical and chemical methods]. In Proceedings of the Türkiye, I. Silaj Kongresi, Bursa, Turkey, 16–19 September 1997; pp. 241–246. (In Turkish). [Google Scholar]
- Ashbell, G.; Pahlow, G.; Dinter, B.; Weinberg, Z.G. Dynamics of orange peel fermentation during ensilage. J. Appl. Bacteriol. 1987, 63, 275–279. [Google Scholar] [CrossRef]
- Uriarte-Archundia, M.E. A Study of the Chemical and Microbial Changes in Whole-Plant Corn Silage during Exposure to Air: Effects of Stage of Maturity, Packing Density, Sealing Technique, and a Biological Additive. Ph.D. Thesis, Kansas State University, Manhattan, KS, USA, 2001; p. 110. [Google Scholar]
- Koc, F.; Coskuntuna, L.; Ozduven, M.L.; Coskuntuna, A.; Samlı, H.E. The effects of temperature on the silage microbiology and aerobic stability of corn and vetch-grain silages. Acta Agric. Scand. Sect. A Anim. Sci. 2009, 59, 239–246. [Google Scholar] [CrossRef]
- Wilkinson, J.M.; Davies, D.R. The aerobic stability of silage: Key finding and recent developments. Grass Forage Sci. 2012, 68, 1–19. [Google Scholar] [CrossRef]
- Teller, R.S.; Schmidt, R.J.; Whitlow, L.W.; Kung, L., Jr. Effect of physical damage to ears of corn before harvest and treatment with various additives on the concentration of mycotoxins, silage fermentation, and aerobic stability of corn silage. J. Dairy Sci. 2012, 95, 1428–1436. [Google Scholar] [CrossRef] [PubMed] [Green Version]
- Nadeau, E.M.G.; Buxton, D.R.; Russell, J.R.; Allison, M.J.; Young, J.W. Enzyme, bacterial inoculant, and formic acid effects on silage composition of orchardgrass and alfalfa. J. Dairy Sci. 2000, 83, 1487–1502. [Google Scholar] [CrossRef]
- Da Silva, T.C.; Smith, M.L.; Barnard, A.M.; Kung, L., Jr. The effect of a chemical additive on the fermentation and aerobic stability of high-moisture corn. J. Dairy Sci. 2015, 98, 8904–8912. [Google Scholar] [CrossRef]
- Yuan, X.; Wen, A.; Desta, S.T.; Wang, J.; Shao, T. Effects of sodium diacetate on the fermentation profile, chemical composition and aerobic stability of alfalfa silage. Asian-Australas. J. Anim. Sci. 2017, 30, 804–810. [Google Scholar] [CrossRef] [Green Version]
- Reeves, J.B., III; Blosser, T.H.; Colenbrander, V.F. Near infrared reflectance spectroscopy for analyzing undried silage. J. Dairy Sci. 1989, 72, 79–88. [Google Scholar] [CrossRef]
- Deswysen, A.G.; Dutilleul, P.; Godfrin, J.P.; Ellis, W.C. Nycterohemeral eating and ruminating patterns in heifers fed grass or corn silage: Analysis by finite Fourier transform. J. Anim. Sci. 1993, 71, 2739–2747. [Google Scholar] [CrossRef]
- Phillip, L.E.; Hidalgo, V. Voluntary feed intake, acid-base balance and partitioning of urinary nitrogen in lambs fed corn silage with added sodium bicarbonate or sodium sesquicarbonate. J. Anim. Sci. 1989, 67, 2116–2122. [Google Scholar] [CrossRef] [Green Version]
- Erdoğan, A.; Koç, F. Evaluation of the changes in microbial composition in farm conditions during aerobic stability using thermal camera imaging technique. J. Anim. Prod. 2020, 61, 9–16. [Google Scholar] [CrossRef]
- Koc, F.; Ozduven, M.L.; Demirci, A.S.; Samli, H.E. Evaluation of the changes in microbial composition of corn silage under farm conditions during aerobic stability using thermal camera imaging technique. KSU J. Agric. Nat. 2018, 21, 167–174. [Google Scholar] [CrossRef]
- Kaya, Ö.; Polat, C. Determination of silage fermentation characteristics and feed value of some corn varieties cultivars as first and second crop in Tekirdag ecological conditions. J. Tekirdag Agric. Fac. 2010, 7, 129–136. [Google Scholar]
- Koc, F.; Agma Okur, A.; Okur, E. The effects of sodium diacetate and sodium benzoat addition on the aerobic stability characteristics of high moisture corn grain. Ege Üniversitesi Ziraat Fakültesi Dergisi 2020, 57, 289–301. [Google Scholar] [CrossRef]
- Borreani, G.; Tabacco, E. The relationship of silage temperature with the microbiological status of the face of corn silage bunkers. J. Dairy Sci. 2010, 93, 2620–2629. [Google Scholar] [CrossRef] [PubMed]
- Zaninelli, M.; Redaelli, V.; Tirloni, E.; Bernardi, C.; Dell’Orto, V.; Savoini, G. First results of a detection sensor for the monitoring of laying hens reared in a commercial organic egg production farm based on the use of infrared technology. Sensors 2016, 16, 1757. [Google Scholar] [CrossRef] [Green Version]
- Unal, O.; Koc, F.; Agma Okur, A.; Okur, E.; Ozduven, M.L. Using thermal imaging camera technique to evaluation of the aerobic stability of corn and wheat silage. Alınteri J. Agric. Sci. 2018, 33, 55–63. [Google Scholar] [CrossRef]


| Parameters * | Analysis Results |
|---|---|
| pH | 3.900 |
| DM, % FM | 62.021 |
| NH3-N g/kg DM | 1.289 |
| LA, g/kg DM | 9.200 |
| WSC, g/kg DM | 11.418 |
| LAB, cfu/g DM | 2.712 |
| Yeast, cfu/g DM | 2.723 |
| Mould, cfu/g DM | 0 |
| Additive | Usage % | Storage Temperature * | pH | DM% | NH3-N g/kg DM | LA g/kg DM | WSC g/kg DM | LAB log10 cfu/g | Yeast log10 cfu/g | Mould log10 cfu/g |
|---|---|---|---|---|---|---|---|---|---|---|
| AV | 0 | 27–29 °C | 3.850 c | 59.550 b | 1.577 ab | 9.760 defg | 9.870 g | 4.303 bc | 0.000 g | 2.527 f |
| 35–37 °C | 3.900 c | 63.890 a | 1.380 cde | 13.600 ab | 19.857 b | 2.933 e | 4.517 e | 2.847 de | ||
| 0.5 | 27–29 °C | 3.900 c | 60.550 b | 1.263 e | 9.470 efg | 17.440 de | 4.533 ab | 4.660 d | 2.220 h | |
| 35–37 °C | 3.900 c | 60.310 b | 1.520 abc | 11.473 bcdef | 15.370 f | 3.180 e | 4.467 e | 3.093 b | ||
| 1.0 | 27–29 °C | 3.900 c | 61.233 b | 1.570 ab | 8.810 g | 19.613 bc | 4.610 a | 0.000 g | 2.363 g | |
| 35–37 °C | 3.900 c | 59.913 b | 1.613 ab | 11.790 bcde | 18.043 d | 4.053 cd | 4.250 f | 2.823 e | ||
| SDA | 0 | 27–29 °C | 3.850 c | 60.140 b | 1.330 de | 9.280 fg | 10.610 g | 4.407 ab | 4.830 c | 2.993 bcd |
| 35–37 °C | 3.900 c | 58.760 c | 1.687 a | 14.690 a | 17.530 d | 2.920 e | 4.780 c | 3.310 a | ||
| 0.5 | 27–29 °C | 4.007 b | 60.673 b | 1.470 bcd | 10.753 cdefg | 18.977 c | 4.460 ab | 4.777 c | 3.030 bc | |
| 35–37 °C | 4.010 b | 59.240 b | 1.447 bcd | 12.287 bc | 16.667 e | 2.227 f | 4.903 b | 2.890 cde | ||
| 1.0 | 27–29 °C | 4.007 b | 59.587 b | 1.390 cde | 12.047 bcd | 15.420 f | 3.933 d | 0.000 g | 3.000 bcd | |
| 35–37 °C | 4.200 a | 59.870 b | 1.540 abc | 9.560 efg | 20.750 a | 3.050 e | 5.070 a | 2.913 cde | ||
| SEM | 0.017 | 0.260 | 0.024 | 0.347 | 0.561 | 0.133 | 0.345 | 0.052 | ||
| p values | ||||||||||
| Additive | 0.000 | 0.003 | 0.749 | 0.157 | 0.801 | 0.000 | 0.000 | 0.000 | ||
| Usage | 0.000 | 0.568 | 0.036 | 0.062 | 0.000 | 0.000 | 0.000 | 0.001 | ||
| Temperature | 0.000 | 0.910 | 0.004 | 0.000 | 0.000 | 0.000 | 0.000 | 0.000 | ||
| Additive × Usage | 0.000 | 0.125 | 0.041 | 0.762 | 0.000 | 0.000 | 0.000 | 0.073 | ||
| Additive × Temperature | 0.011 | 0.023 | 0.052 | 0.099 | 0.001 | 0.000 | 0.000 | 0.000 | ||
| Usage × Temperature | 0.012 | 0.032 | 0.890 | 0.001 | 0.000 | 0.000 | 0.000 | 0.037 | ||
| Additive × Usage × Temperature | 0.003 | 0.002 | 0.000 | 0.007 | 0.000 | 0.021 | 0.000 | 0.000 | ||
| Additive | Usage % | Storage Temperature * | pH | DM % | NH3-N g/kg DM | LA g/kg DM | WSC g/kg DM | LAB log10 cfu/g | Yeast log10 cfu/g | Mould log10 cfu/g |
|---|---|---|---|---|---|---|---|---|---|---|
| AV | 0 | 27–29 °C | 4.100 d | 63.457 e | 1.410 e | 9.867 d | 9.550 e | 4.400 c | 4.743 de | 2.850 a |
| 35–37 °C | 4.150 d | 61.183 f | 1.040 g | 11.737 c | 8.000 g | 3.793 d | 6.143 a | 0.000 c | ||
| 0.5 | 27–29 °C | 4.350 b | 63.080 de | 1.430 de | 6.800 i | 6.357 h | 5.313 a | 5.167 c | 2.350 b | |
| 35–37 °C | 4.200 c | 65.380 bc | 1.267 f | 9.250 e | 8.900 f | 4.800 b | 5.800 b | 0.000 c | ||
| 1.0 | 27–29 °C | 4.100 d | 63.383 de | 1.547 bc | 9.227 e | 18.767 a | 5.210 a | 5.157 c | 0.000 c | |
| 35–37 °C | 3.900 g | 65.457 bc | 1.580 b | 7.710 h | 12.300 c | 3.760 d | 3.950 f | 0.000 c | ||
| SDA | 0 | 27–29 °C | 4.650 a | 62.853 de | 1.357 e | 8.477 f | 4.807 i | 2.813 e | 3.047 g | 0.000 c |
| 35–37 °C | 4.100 d | 67.137 a | 1.387 e | 12.417 b | 14.060 b | 2.947 e | 4.700 de | 0.000 c | ||
| 0.5 | 27–29 °C | 3.950 f | 63.907 cd | 1.540 bc | 13.417 a | 14.197 b | 3.883 d | 4.987 cd | 0.000 c | |
| 35–37 °C | 4.000 f | 62.050 ef | 1.727 a | 8.687 f | 10.910 d | 2.607 ef | 2.700 h | 0.000 c | ||
| 1.0 | 27–29 °C | 4.100 d | 63.733 d | 1.240 f | 9.327 e | 8.897 f | 2.310 f | 4.530 e | 0.000 c | |
| 35–37 °C | 4.000 f | 66.463 ab | 1.490 cd | 8.037 g | 11.100 d | 2.680 e | 2.770 h | 0.000 c | ||
| SEM | 0.033 | 0.311 | 0.030 | 0.322 | 0.619 | 0.172 | 0.186 | 0.165 | ||
| p values | ||||||||||
| Additive | 1.000 | 0.025 | 0.000 | 0.000 | 0.884 | 0.000 | 0.000 | 0.000 | ||
| Usage | 0.000 | 0.005 | 0.000 | 0.000 | 0.000 | 0.000 | 0.000 | 0.000 | ||
| Temperature | 0.000 | 0.000 | 0.683 | 0.018 | 0.000 | 0.000 | 0.000 | 0.000 | ||
| Additive × Usage | 0.000 | 0.000 | 0.000 | 0.000 | 0.000 | 0.000 | 0.000 | 0.000 | ||
| Additive × Temperature | 0.000 | 0.094 | 0.000 | 0.000 | 0.000 | 0.000 | 0.000 | 0.000 | ||
| Usage × Temperature | 0.000 | 0.018 | 0.000 | 0.000 | 0.000 | 0.002 | 0.000 | 0.000 | ||
| Additive × Usage × Temperature | 0.000 | 0.000 | 0.029 | 0.000 | 0.000 | 0.000 | 0.000 | 0.000 | ||
| Additive | Usage % | Storage Temperature * | pH | DM % | NH3-N g/kg DM | LA g/kg DM | WSC g/kg DM | LAB log10 cfu/g | Yeast log10 cfu/g | Mould log10 cfu/g |
|---|---|---|---|---|---|---|---|---|---|---|
| AV | 0 | 27–29 °C | 6.000 c | 72.757 a | 1.837 b | 1.720 g | 16.097 b | 5.560 ab | 5.140 c | 3.180 a |
| 35–37 °C | 3.900 g | 63.910 d | 1.607 d | 8.420 f | 9.107 e | 0.000 j | 3.780 de | 0.000 d | ||
| 0.5 | 27–29 °C | 6.500 ab | 63.203 d | 1.617 d | 1.680 g | 7.737 f | 2.980 h | 5.690 b | 2.280 b | |
| 35–37 °C | 3.900 g | 61.950 ef | 1.420 g | 9.097 e | 7.470 f | 3.337 g | 3.680 e | 0.000 d | ||
| 1.0 | 27–29 °C | 6.450 b | 65.393 c | 1.477 f | 1.147 h | 6.800 g | 5.500 b | 5.010 c | 2.660 ab | |
| 35–37 °C | 3.900 g | 63.140 de | 1.557 e | 8.480 f | 8.937 e | 4.193 d | 4.027 d | 0.000 d | ||
| SDA | 0 | 27–29 °C | 6.550 a | 65.670 bc | 1.897 a | 9.917 c | 18.207 a | 5.627 a | 6.160 a | 1.460 c |
| 35–37 °C | 3.950 fg | 66.810 b | 1.527 e | 9.337 d | 11.077 d | 2.770 i | 3.920 de | 0.000 d | ||
| 0.5 | 27–29 °C | 5.250 d | 61.683 f | 1.697 c | 8.380 f | 5.480 h | 4.930 c | 5.840 b | 2.440 ab | |
| 35–37 °C | 4.000 f | 62.223 ef | 1.540 e | 13.740 a | 12.800 c | 3.407 fg | 3.930 de | 0.000 d | ||
| 1.0 | 27–29 °C | 4.250 e | 59.837 g | 1.817 b | 10.267 b | 7.617 f | 3.927 e | 3.883 de | 2.480 ab | |
| 35–37 °C | 4.300 e | 66.463 bc | 1.527 e | 9.367 d | 8.737 e | 3.470 f | 4.023 d | 0.000 d | ||
| SEM | 0.186 | 0.553 | 0.025 | 0.640 | 0.628 | 0.256 | 0.150 | 0.221 | ||
| p values | ||||||||||
| Additive | 0.000 | 0.000 | 0.000 | 0.000 | 0.000 | 0.000 | 0.212 | 0.050 | ||
| Usage | 0.000 | 0.000 | 0.000 | 0.000 | 0.000 | 0.000 | 0.000 | 0.741 | ||
| Temperature | 0.000 | 0.007 | 0.000 | 0.000 | 0.000 | 0.000 | 0.000 | 0.000 | ||
| Additive × Usage | 0.000 | 0.043 | 0.000 | 0.000 | 0.000 | 0.000 | 0.000 | 0.027 | ||
| Additive × Temperature | 0.000 | 0.000 | 0.000 | 0.000 | 0.000 | 0.000 | 0.316 | 0.050 | ||
| Usage × Temperature | 0.000 | 0.000 | 0.000 | 0.000 | 0.000 | 0.000 | 0.000 | 0.741 | ||
| Additive × Usage × Temperature | 0.000 | 0.000 | 0.000 | 0.000 | 0.000 | 0.000 | 0.000 | 0.027 | ||
| Additive | Usage % | Storage Temperature * | pH | DM % | NH3-N g/kg DM | LA g/kg DM | WSC g/kg DM | LAB log10 cfu/g | Yeast log10 cfu/g | Mould log10 cfu/g |
|---|---|---|---|---|---|---|---|---|---|---|
| AV | 0 | 27–29 °C | 6.900 b | 71.577 a | 2.693 a | 0.757 e | 16.517 d | 0.000 i | 3.377 f | 0.000 |
| 35–37 °C | 3.950 d | 67.417 abc | 0.987 ef | 6.677 d | 55.230 b | 3.547 b | 5.670 b | 0.000 | ||
| 0.5 | 27–29 °C | 7.800 a | 57.083 d | 2.600 a | 0.370 e | 17.827 d | 2.613 f | 6.330 a | 0.000 | |
| 35–37 °C | 3.900 d | 66.283 bc | 1.323 d | 9.750 b | 9.100 e | 2.840 e | 4.280 cd | 0.000 | ||
| 1.0 | 27–29 °C | 7.450 ab | 60.637 d | 2.883 a | 0.303 e | 18.177 d | 2.483 f | 6.100 a | 0.000 | |
| 35–37 °C | 3.900 d | 69.970 ab | 1.237 de | 11.407 a | 67.757 a | 3.477 b | 4.390 cd | 0.000 | ||
| SDA | 0 | 27–29 °C | 6.950 b | 70.547 ab | 2.807 a | 1.060 e | 7.747 e | 2.103 h | 6.367 a | 0.000 |
| 35–37 °C | 3.900 d | 66.610 bc | 1.363 cd | 7.930 c | 46.140 c | 3.297 cd | 3.797 e | 0.000 | ||
| 0.5 | 27–29 °C | 7.200 ab | 67.990 abc | 2.250 b | 0.837 e | 15.760 d | 3.410 bc | 3.710 e | 0.000 | |
| 35–37 °C | 3.900 d | 66.907 bc | 1.433 cd | 6.520 d | 68.083 a | 4.550 a | 4.320 cd | 0.000 | ||
| 1.0 | 27–29 °C | 6.200 c | 65.157 c | 0.890 f | 9.020 b | 19.190 d | 2.273 g | 4.607 c | 0.000 | |
| 35–37 °C | 4.050 d | 65.157 c | 1.677 c | 6.840 d | 55.610 b | 3.240 d | 4.247 d | 0.000 | ||
| SEM | 0.278 | 0.732 | 0.124 | 0.679 | 3.800 | 0.180 | 0.174 | - | ||
| p values | ||||||||||
| Additive | 0.041 | 0.050 | 0.002 | 0.012 | 0.000 | 0.000 | 0.000 | - | ||
| Usage | 0.138 | 0.000 | 0.002 | 0.000 | 0.000 | 0.000 | 0.063 | - | ||
| Temperature | 0.000 | 0.051 | 0.000 | 0.000 | 0.000 | 0.000 | 0.000 | - | ||
| Additive × Usage | 0.249 | 0.003 | 0.000 | 0.000 | 0.000 | 0.000 | 0.000 | - | ||
| Additive × Temperature | 0.023 | 0.000 | 0.000 | 0.000 | 0.000 | 0.000 | 0.029 | - | ||
| Usage × Temperature | 0.065 | 0.000 | 0.000 | 0.000 | 0.000 | 0.000 | 0.000 | - | ||
| Additive × Usage × Temperature | 0.085 | 0.017 | 0.000 | 0.000 | 0.000 | 0.000 | 0.000 | - | ||
| Aerobic Stability | Additive | % | Storage Temperature * | Thermal Camera Imaging Measurements, °C | |||
|---|---|---|---|---|---|---|---|
| Mean | Min | Max | Std. Dev. | ||||
| Day 0 | - | - | - | 30.62 | 26.75 | 33.91 | 0.94 |
| Day 2 | AV | 0 | 27.370 °C | 27.280 de | 25.280 b | 29.845 d | 0.420 c |
| 36.187 °C | 33.945 ab | 28.345 a | 36.330 ab | 1.205 a | |||
| 0.5 | 27.370 °C | 26.945 de | 24.595 b | 29.515 d | 0.490 c | ||
| 36.187 °C | 34.360 a | 27.935 a | 36.925 a | 1.225 a | |||
| 1.0 | 27.370 °C | 26.865 de | 24.720 b | 29.640 d | 0.475 c | ||
| 36.187 °C | 33.740 ab | 28.220 a | 36.530 ab | 1.225 a | |||
| SDA | 0 | 27.370 °C | 27.435 d | 25.610 b | 29.375 d | 0.435 c | |
| 36.187 °C | 33.555 ab | 28.750 a | 36.595 ab | 1.225 a | |||
| 0.5 | 27.370 °C | 27.110 de | 25.530 b | 29.280 d | 0.450 c | ||
| 36.187 °C | 33.100 bc | 28.280 a | 35.580 bc | 1.070 ab | |||
| 1.0 | 27.370 °C | 26.430 e | 24.690 b | 29.330 d | 0.490 c | ||
| 36.187 °C | 32.420 c | 27.955 a | 34.985 c | 0.940 b | |||
| SEM | 0.689 | 0.358 | 0.705 | 0.075 | |||
| p values | |||||||
| Additive | 0.007 | 0.378 | 0.005 | 0.080 | |||
| Usage | 0.010 | 0.313 | 0.206 | 0.650 | |||
| Temperature | 0.000 | 0.000 | 0.000 | 0.000 | |||
| Additive × Usage | 0.188 | 0.594 | 0.172 | 0.263 | |||
| Additive × Temperature | 0.011 | 0.697 | 0.158 | 0.093 | |||
| Usage × Temperature | 0.694 | 0.896 | 0.340 | 0.140 | |||
| Additive × Usage × Temperature | 0.538 | 0.911 | 0.077 | 0.291 | |||
| Aerobic Stability | Additive | % | Storage Temperature * | Thermal Camera Imaging Measurements, °C | |||
|---|---|---|---|---|---|---|---|
| Mean | Min | Max | Std. Dev. | ||||
| Day 0 | - | - | - | 30.62 | 26.75 | 33.91 | 0.94 |
| Day 4 | AV | 0 | 27.468 °C | 29.530 bc | 27.470 cd | 31.000 c | 0.365 d |
| 35.222 °C | 33.575 a | 29.345 a | 35.655 a | 1.115 a | |||
| 0.5 | 27.468 °C | 29.535 bc | 27.925 cd | 31.250 c | 0.380 d | ||
| 35.222 °C | 33.515 a | 29.565 a | 35.390 ab | 0.940 b | |||
| 1.0 | 27.468 °C | 29.090 cd | 27.265 cd | 30.955 c | 0.415 d | ||
| 35.222 °C | 33.055 a | 28.170 bc | 35.265 ab | 1.050 ab | |||
| SDA | 0 | 27.468 °C | 29.995 b | 27.375 cd | 31.300 c | 0.490 d | |
| 35.222 °C | 33.525 a | 28.955 ab | 35.450 ab | 0.965 b | |||
| 0.5 | 27.468 °C | 28.775 cd | 27.345 cd | 31.000 c | 0.475 d | ||
| 35.222 °C | 32.745 a | 29.185 a | 34.660 b | 0.785 c | |||
| 1.0 | 27.468 °C | 28.425 d | 27.060 d | 30.595 c | 0.420 d | ||
| 35.222 °C | 32.705 a | 29.110 a | 34.595 b | 0.700 c | |||
| SEM | 0.427 | 0.197 | 0.442 | 0.058 | |||
| p values | |||||||
| Additive | 0.042 | 0.479 | 0.078 | 0.018 | |||
| Usage | 0.003 | 0.030 | 0.086 | 0.026 | |||
| Temperature | 0.000 | 0.000 | 0.000 | 0.000 | |||
| Additive × Usage | 0.064 | 0.131 | 0.328 | 0.055 | |||
| Additive × Temperature | 0.826 | 0.302 | 0.218 | 0.000 | |||
| Usage × Temperature | 0.688 | 0.762 | 0.487 | 0.034 | |||
| Additive × Usage × Temperature | 0.565 | 0.224 | 0.967 | 0.702 | |||
| Aerobic Stability | Additive | % | Storage Temperature * | Thermal Camera Imaging Measurements, °C | |||
|---|---|---|---|---|---|---|---|
| Mean | Min | Max | Std. Dev. | ||||
| Day 0 | - | - | - | 30.62 | 26.75 | 33.91 | 0.94 |
| Day 7 | AV | 0 | 28.060 °C | 30.665 def | 27.780 bc | 32.345 cde | 0.685 cde |
| 35.971 °C | 34.290 a | 29.565 a | 36.265 a | 1.155 ab | |||
| 0.5 | 28.060 °C | 31.535 cde | 27.875 bc | 33.580 bcd | 0.880 bcd | ||
| 35.971 °C | 33.800 a | 29.235 ab | 35.890 a | 1.050 ab | |||
| 1.0 | 28.060 °C | 30.520 def | 27.505 c | 32.515 cde | 0.565 de | ||
| 35.971 °C | 32.670 abc | 28.050 bc | 35.110 ab | 1.105 ab | |||
| SDA | 0 | 28.060 °C | 29.265 f | 27.250 c | 31.375 e | 0.535 e | |
| 35.971 °C | 32.895 abc | 29.080 ab | 35.015 ab | 0.970 abc | |||
| 0.5 | 28.060 °C | 31.925 bcd | 28.485 abc | 34.440 abc | 0.925 bc | ||
| 35.971 °C | 33.430 ab | 28.440 abc | 36.075 a | 1.295 a | |||
| 1.0 | 28.060 °C | 30.115 ef | 27.425 c | 32.205 de | 0.690 cde | ||
| 35.971 °C | 33.280 abc | 29.075 ab | 35.450 ab | 0.995 abc | |||
| SEM | 0.340 | 0.180 | 0.369 | 0.052 | |||
| p values | |||||||
| Additive | 0.178 | 0.867 | 0.622 | 0.933 | |||
| Usage | 0.032 | 0.262 | 0.033 | 0.023 | |||
| Temperature | 0.000 | 0.000 | 0.000 | 0.000 | |||
| Additive × Usage | 0.113 | 0.306 | 0.235 | 0.131 | |||
| Additive × Temperature | 0.887 | 0.867 | 0.895 | 0.844 | |||
| Usage × Temperature | 0.098 | 0.204 | 0.189 | 0.416 | |||
| Additive × Usage × Temperature | 0.499 | 0.160 | 0.767 | 0.344 | |||
| Aerobic Stability | Additive | % | Storage Temperature * | Thermal Camera Imaging Measurements, °C | |||
|---|---|---|---|---|---|---|---|
| Mean | Min | Max | Std. Dev. | ||||
| Day 0 | - | - | - | 30.62 | 26.75 | 33.91 | 0.94 |
| Day 12 | AV | 0 | 27.567 °C | 28.770 c | 26.840 bc | 30.360 c | 0.415 d |
| 36.295 °C | 32.610 a | 28.875 a | 34.685 a | 0.815 abc | |||
| 0.5 | 27.567 °C | 27.645 c | 25.925 c | 29.720 c | 0.470 d | ||
| 36.295 °C | 33.310 a | 29.190 a | 35.250 a | 0.945 a | |||
| 1.0 | 27.567 °C | 27.710 c | 26.170 bc | 30.000 c | 0.455 d | ||
| 36.295 °C | 32.790 a | 28.955 a | 35.050 a | 0.855 abc | |||
| SDA | 0 | 27.567 °C | 30.010 b | 26.125 bc | 32.285 b | 0.840 abc | |
| 36.295 °C | 32.895 a | 29.185 a | 35.565 a | 0.925 a | |||
| 0.5 | 27.567 °C | 29.925 b | 26.905 bc | 32.080 b | 0.695 bc | ||
| 36.295 °C | 32.810 a | 28.920 a | 34.940 a | 0.890 ab | |||
| 1.0 | 27.567 °C | 30.260 b | 27.170 b | 32.045 b | 0.665 c | ||
| 36.295 °C | 33.325 a | 29.880 a | 35.315 a | 0.830 abc | |||
| SEM | 0.445 | 0.297 | 0.460 | 0.040 | |||
| p values | |||||||
| Additive | 0.000 | 0.086 | 0.000 | 0.001 | |||
| Usage | 0.844 | 0.394 | 0.705 | 0.458 | |||
| Temperature | 0.000 | 0.000 | 0.000 | 0.000 | |||
| Additive × Usage | 0.304 | 0.095 | 0.777 | 0.095 | |||
| Additive × Temperature | 0.001 | 0.805 | 0.001 | 0.002 | |||
| Usage × Temperature | 0.219 | 0.919 | 0.724 | 0.574 | |||
| Additive × Usage × Temperature | 0.246 | 0.105 | 0.345 | 0.898 | |||
Publisher’s Note: MDPI stays neutral with regard to jurisdictional claims in published maps and institutional affiliations. |
© 2022 by the authors. Licensee MDPI, Basel, Switzerland. This article is an open access article distributed under the terms and conditions of the Creative Commons Attribution (CC BY) license (https://creativecommons.org/licenses/by/4.0/).
Share and Cite
Agma Okur, A.; Gozluklu, K.; Okur, E.; Okuyucu, B.; Koc, F.; Ozduven, M.L. Effects of Apple Vinegar Addition on Aerobic Deterioration of Fermented High Moisture Maize Using Infrared Thermography as an Indicator. Sensors 2022, 22, 771. https://doi.org/10.3390/s22030771
Agma Okur A, Gozluklu K, Okur E, Okuyucu B, Koc F, Ozduven ML. Effects of Apple Vinegar Addition on Aerobic Deterioration of Fermented High Moisture Maize Using Infrared Thermography as an Indicator. Sensors. 2022; 22(3):771. https://doi.org/10.3390/s22030771
Chicago/Turabian StyleAgma Okur, Aylin, Kerem Gozluklu, Ersen Okur, Berrin Okuyucu, Fisun Koc, and Mehmet Levent Ozduven. 2022. "Effects of Apple Vinegar Addition on Aerobic Deterioration of Fermented High Moisture Maize Using Infrared Thermography as an Indicator" Sensors 22, no. 3: 771. https://doi.org/10.3390/s22030771
APA StyleAgma Okur, A., Gozluklu, K., Okur, E., Okuyucu, B., Koc, F., & Ozduven, M. L. (2022). Effects of Apple Vinegar Addition on Aerobic Deterioration of Fermented High Moisture Maize Using Infrared Thermography as an Indicator. Sensors, 22(3), 771. https://doi.org/10.3390/s22030771