
Computer Aided Written Character Feature Extraction in Progressive Supranuclear Palsy and Parkinson’s Disease

 , ,
, ,  , , , and
Abstract
1. Introduction
Contribution
- In clinical practice, the LAST has been so far evaluated only on the basis of observations and manually performed, simplified measurements. In our approach, the analysis is fully automatic. The results are compared with expert performances.
- In prior studies, a traditional sheet of paper and a pencil were replaced with a tablet and stylus, yielding a set of dynamic features and increasing the amount of information extracted from handwriting. In this study, a first fully automatic approach to the traditional paper–pencil LAST is introduced. No dynamic features are extracted, however.
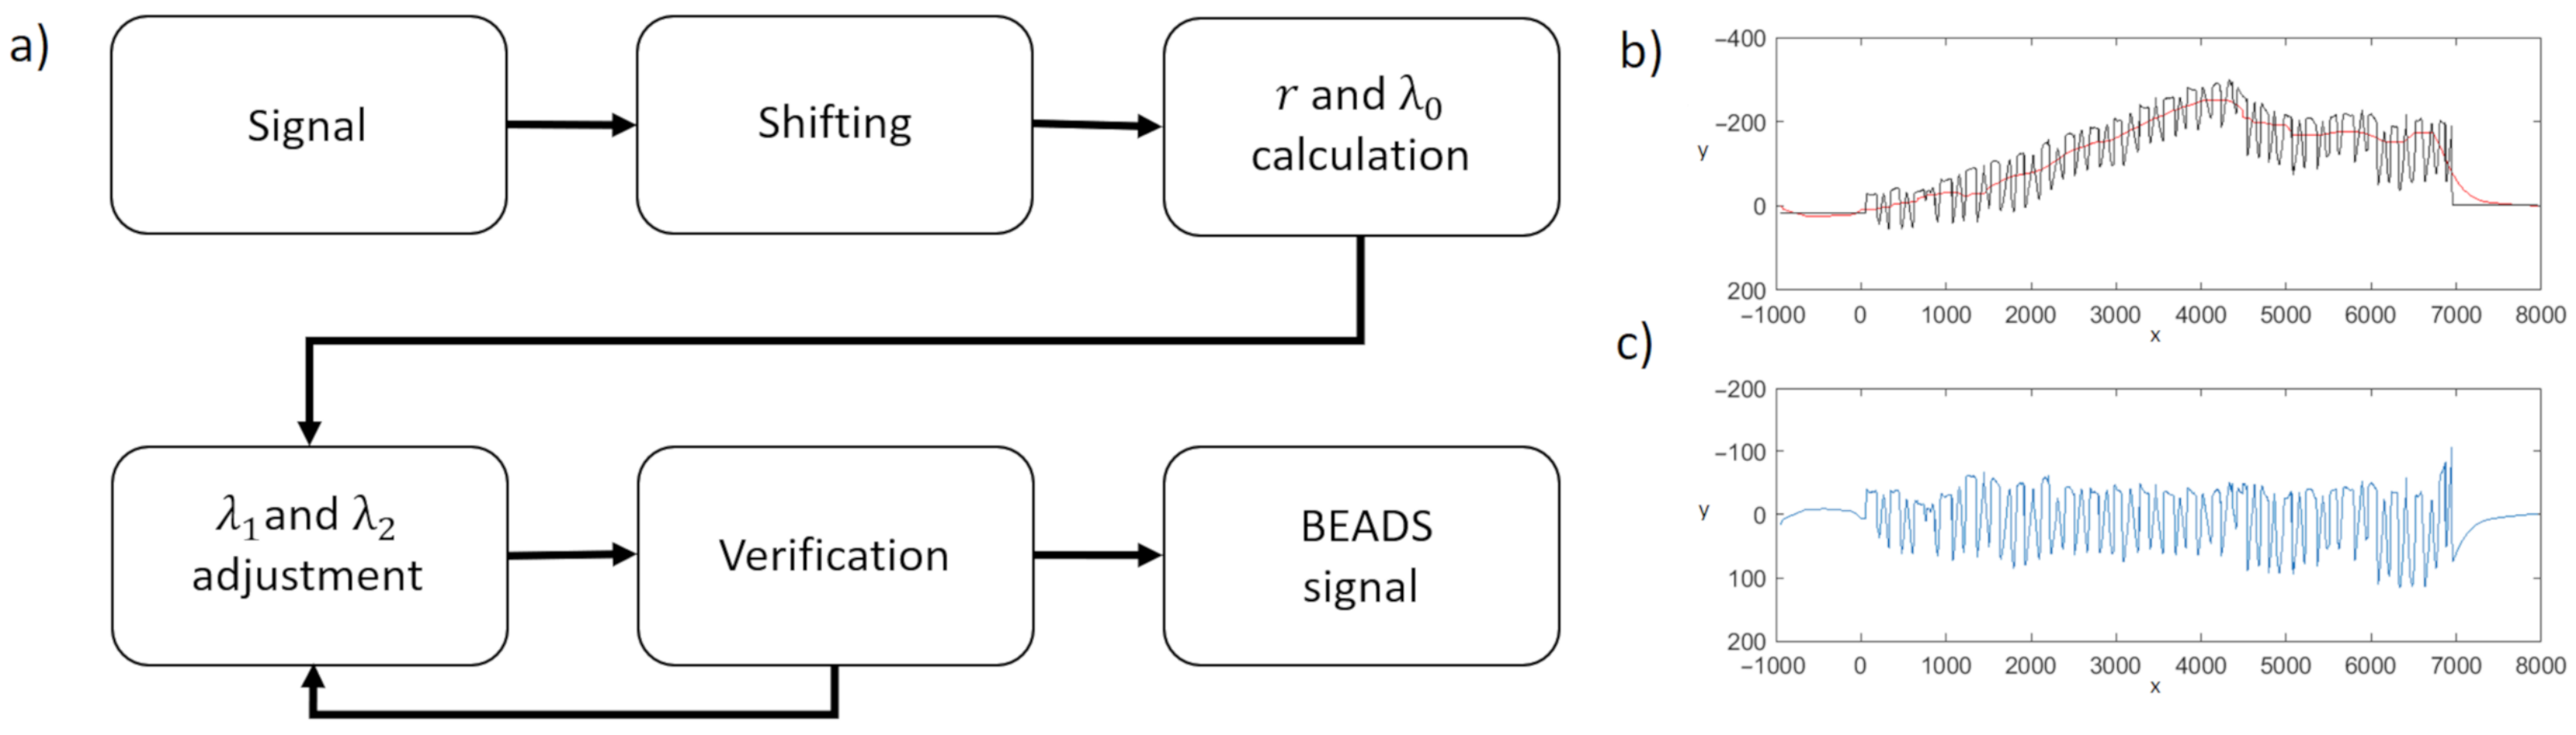
- The baseline of the LAST series is calculated using the BEADS (Bias Elimination Algorithm for Deep Sequencing) algorithm—a recent baseline estimation approach—which has (to date) not been used in the area of computer-aided diagnosis of neurodegenerative diseases.
- In contrast to the previous approaches, in this study, the characters in the LAST series are analyzed separately and not only as one continuous drawing.
- The NW coefficient (an index based on the Needelman–Wunsch algorithm) is introduced to evaluate the correctness of the character order in the series. It can be applied to both automatic and manual evaluation.
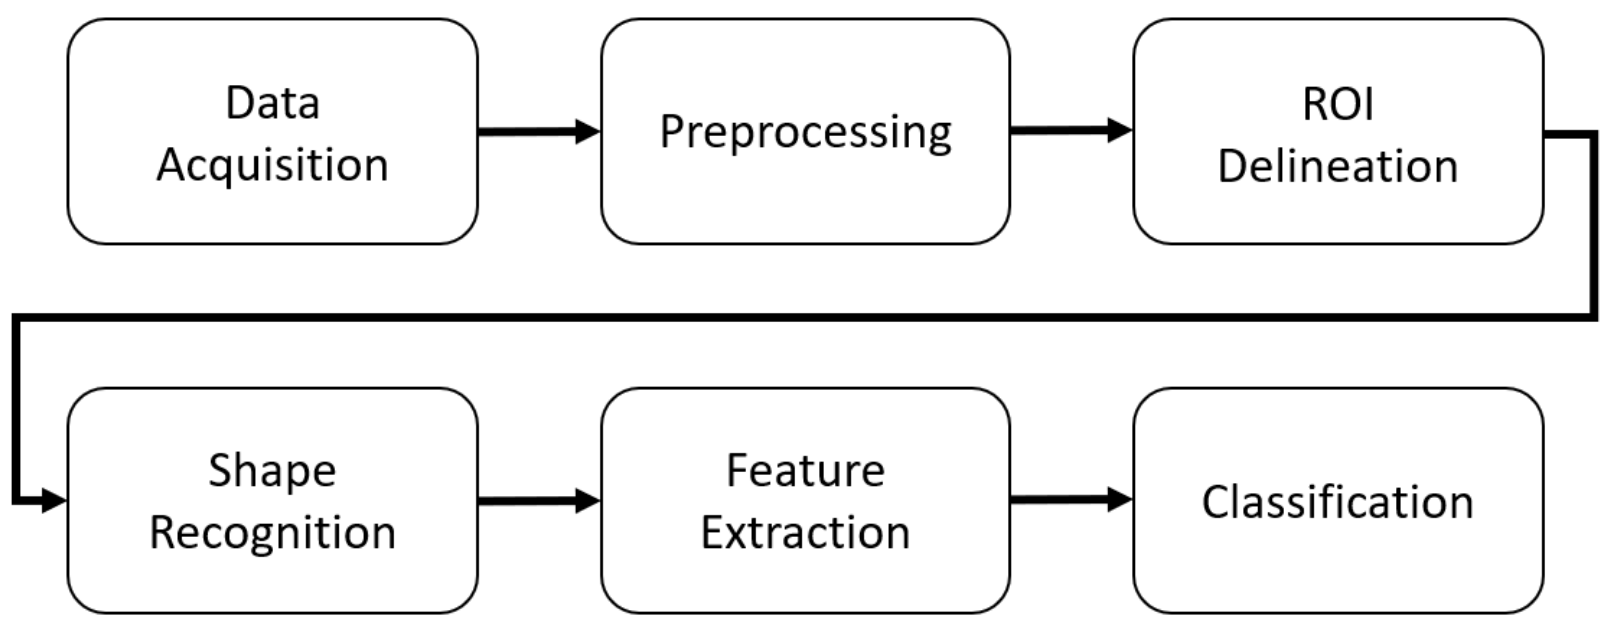
2. Methods
2.1. Data Acquisition
2.2. Preprocessing
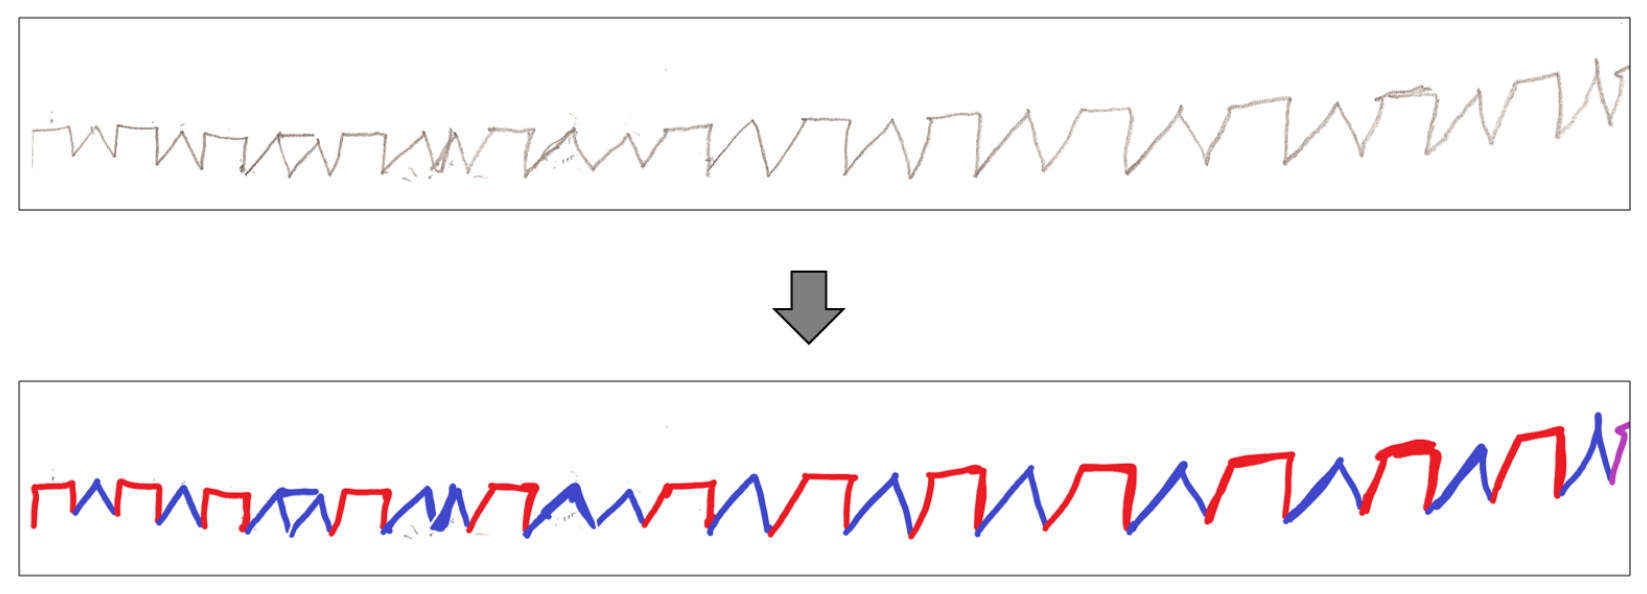
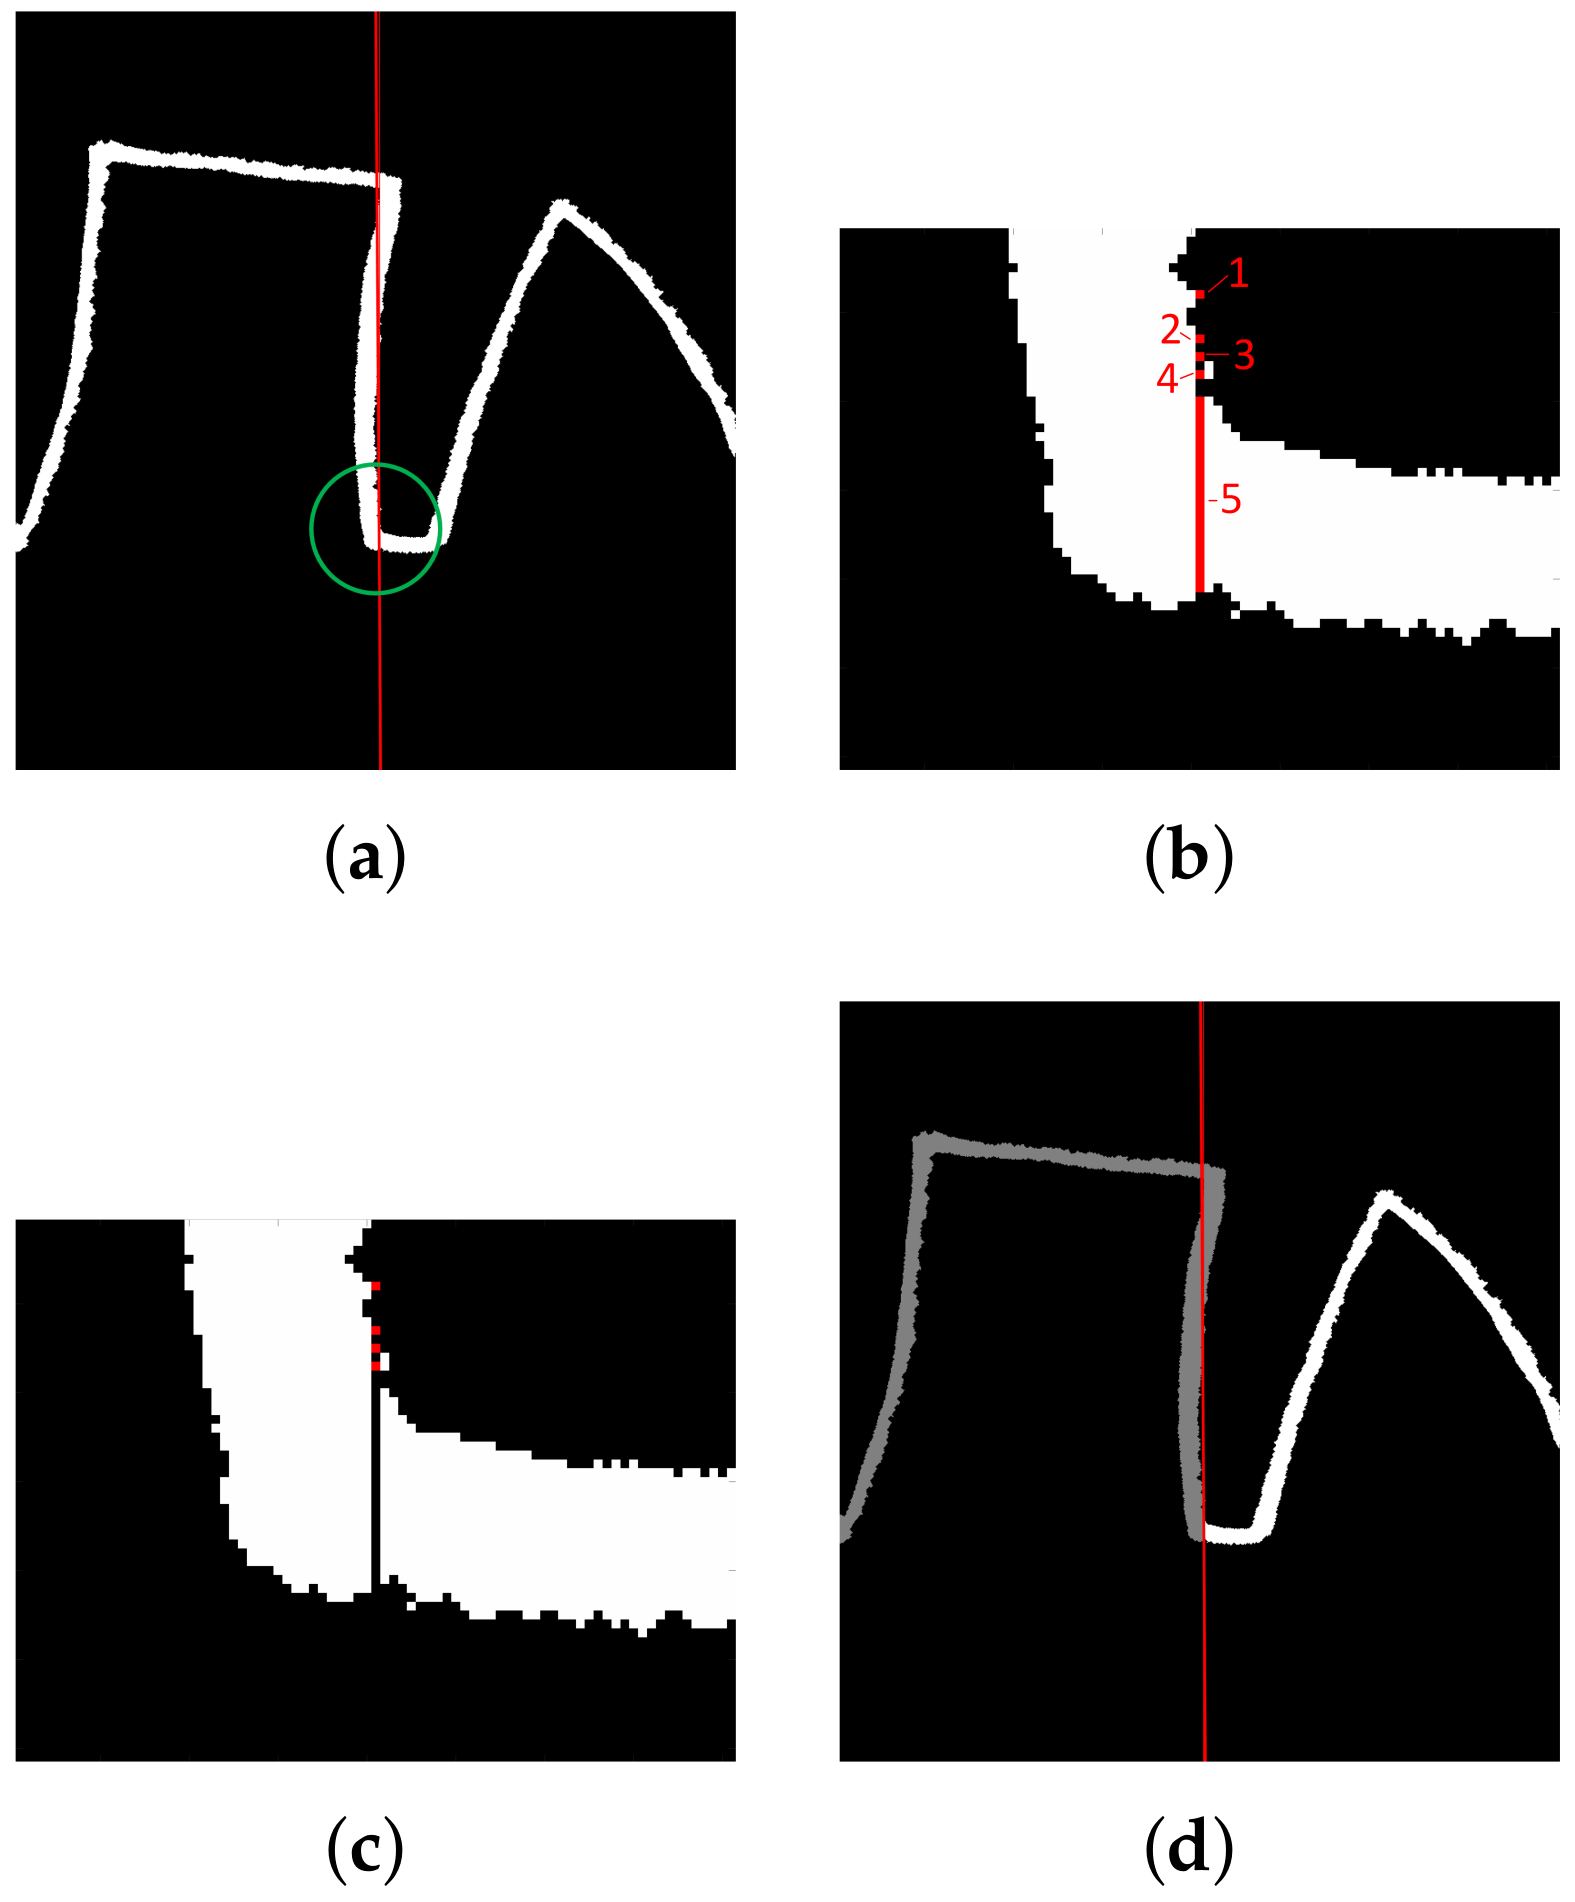
2.3. Character Separations (ROI Delineation)
2.4. Character Recognition
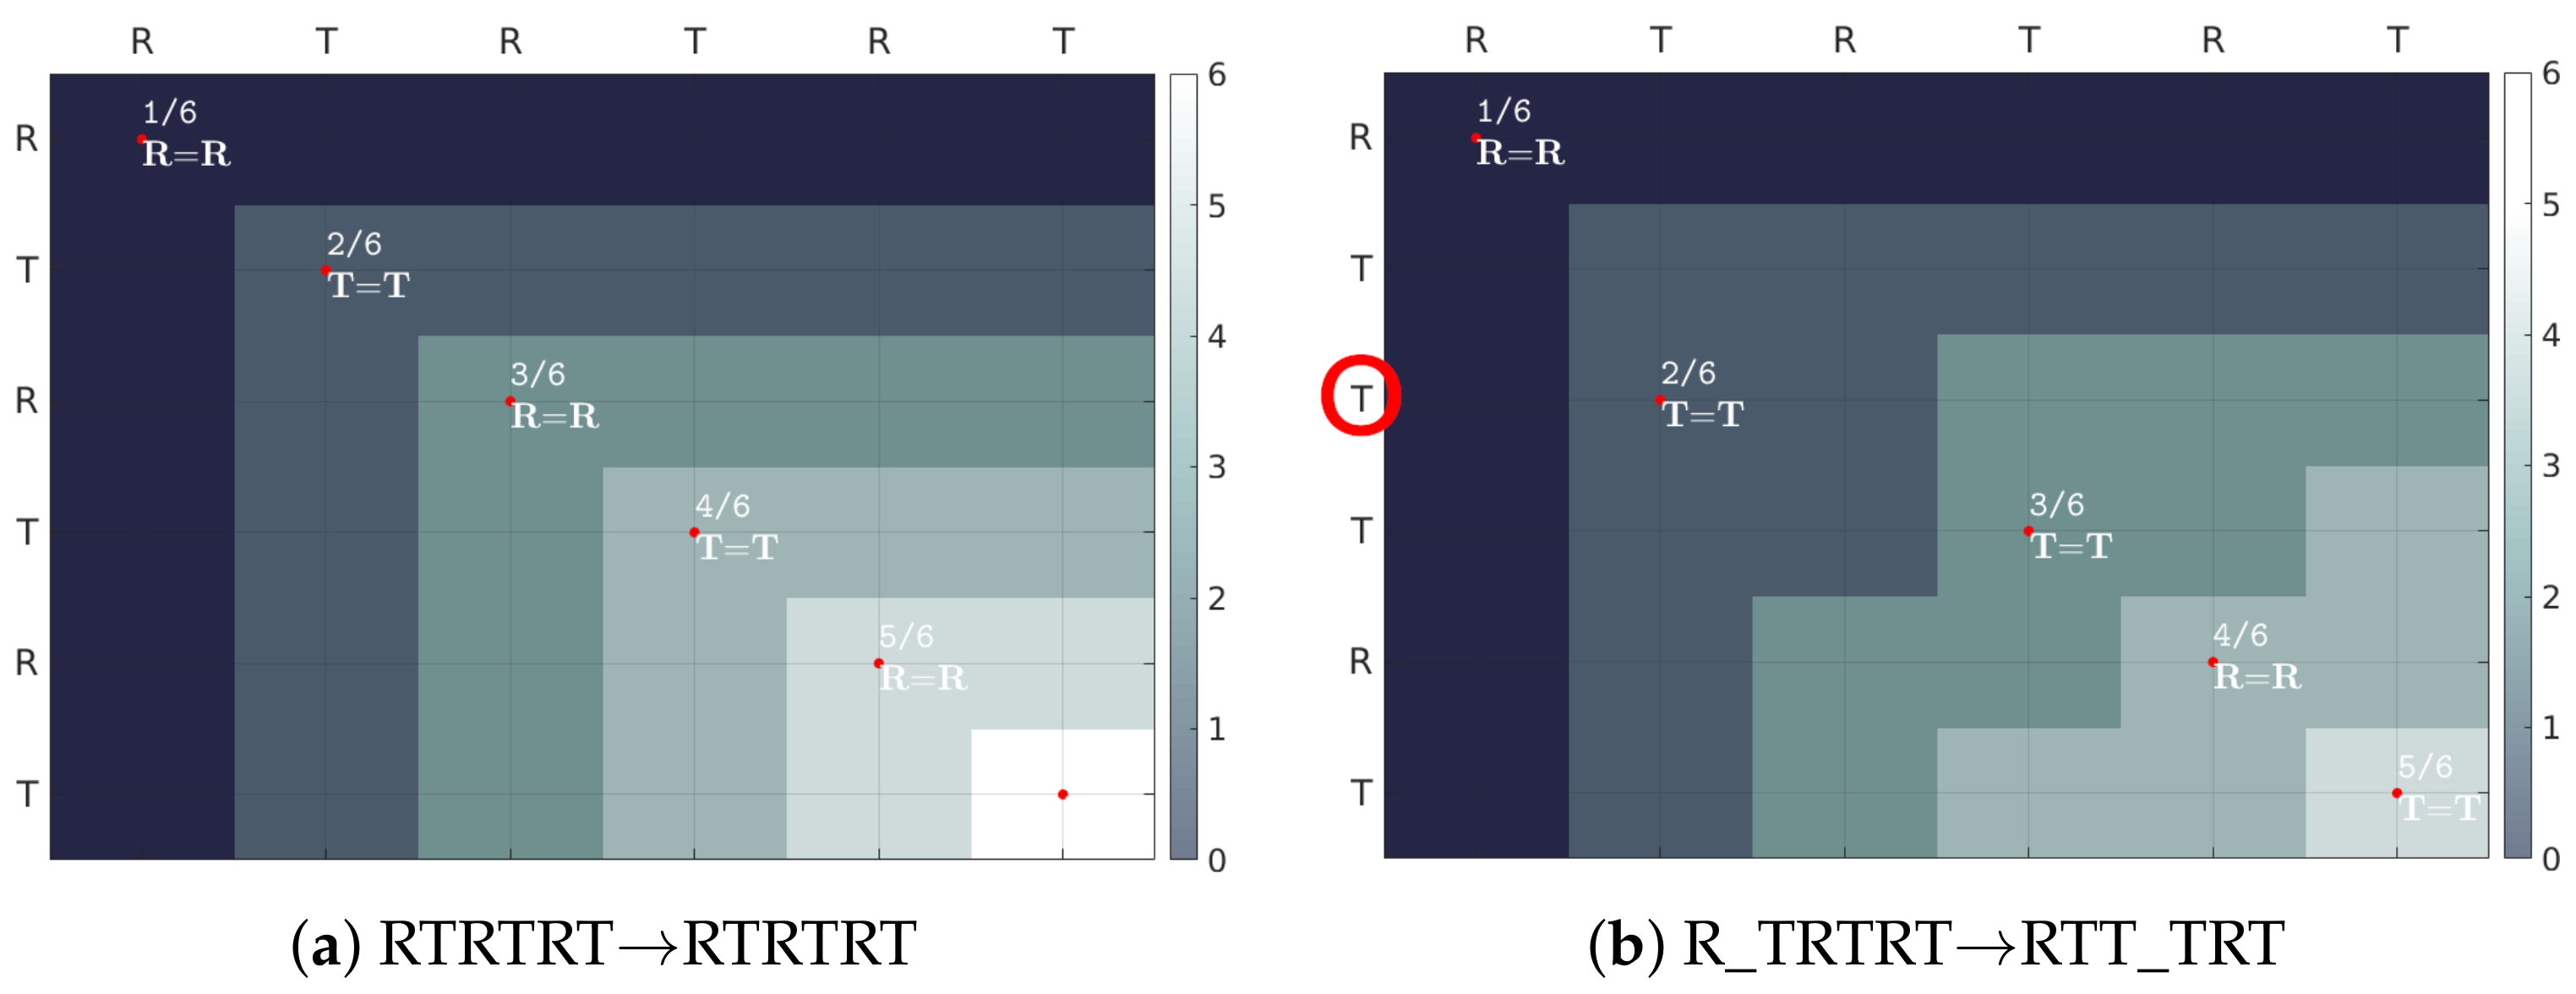
- First and last indices of both sequences are always matched. However, they may be additionally matched to some other samples as well;
- The mapping must be monotonically increasing (samples cannot be reorganized);
- Every sample must be matched (samples cannot be omitted);
- Matching yielding smallest distance is selected in an iterative procedure involving comparison of every sample of both sequences.
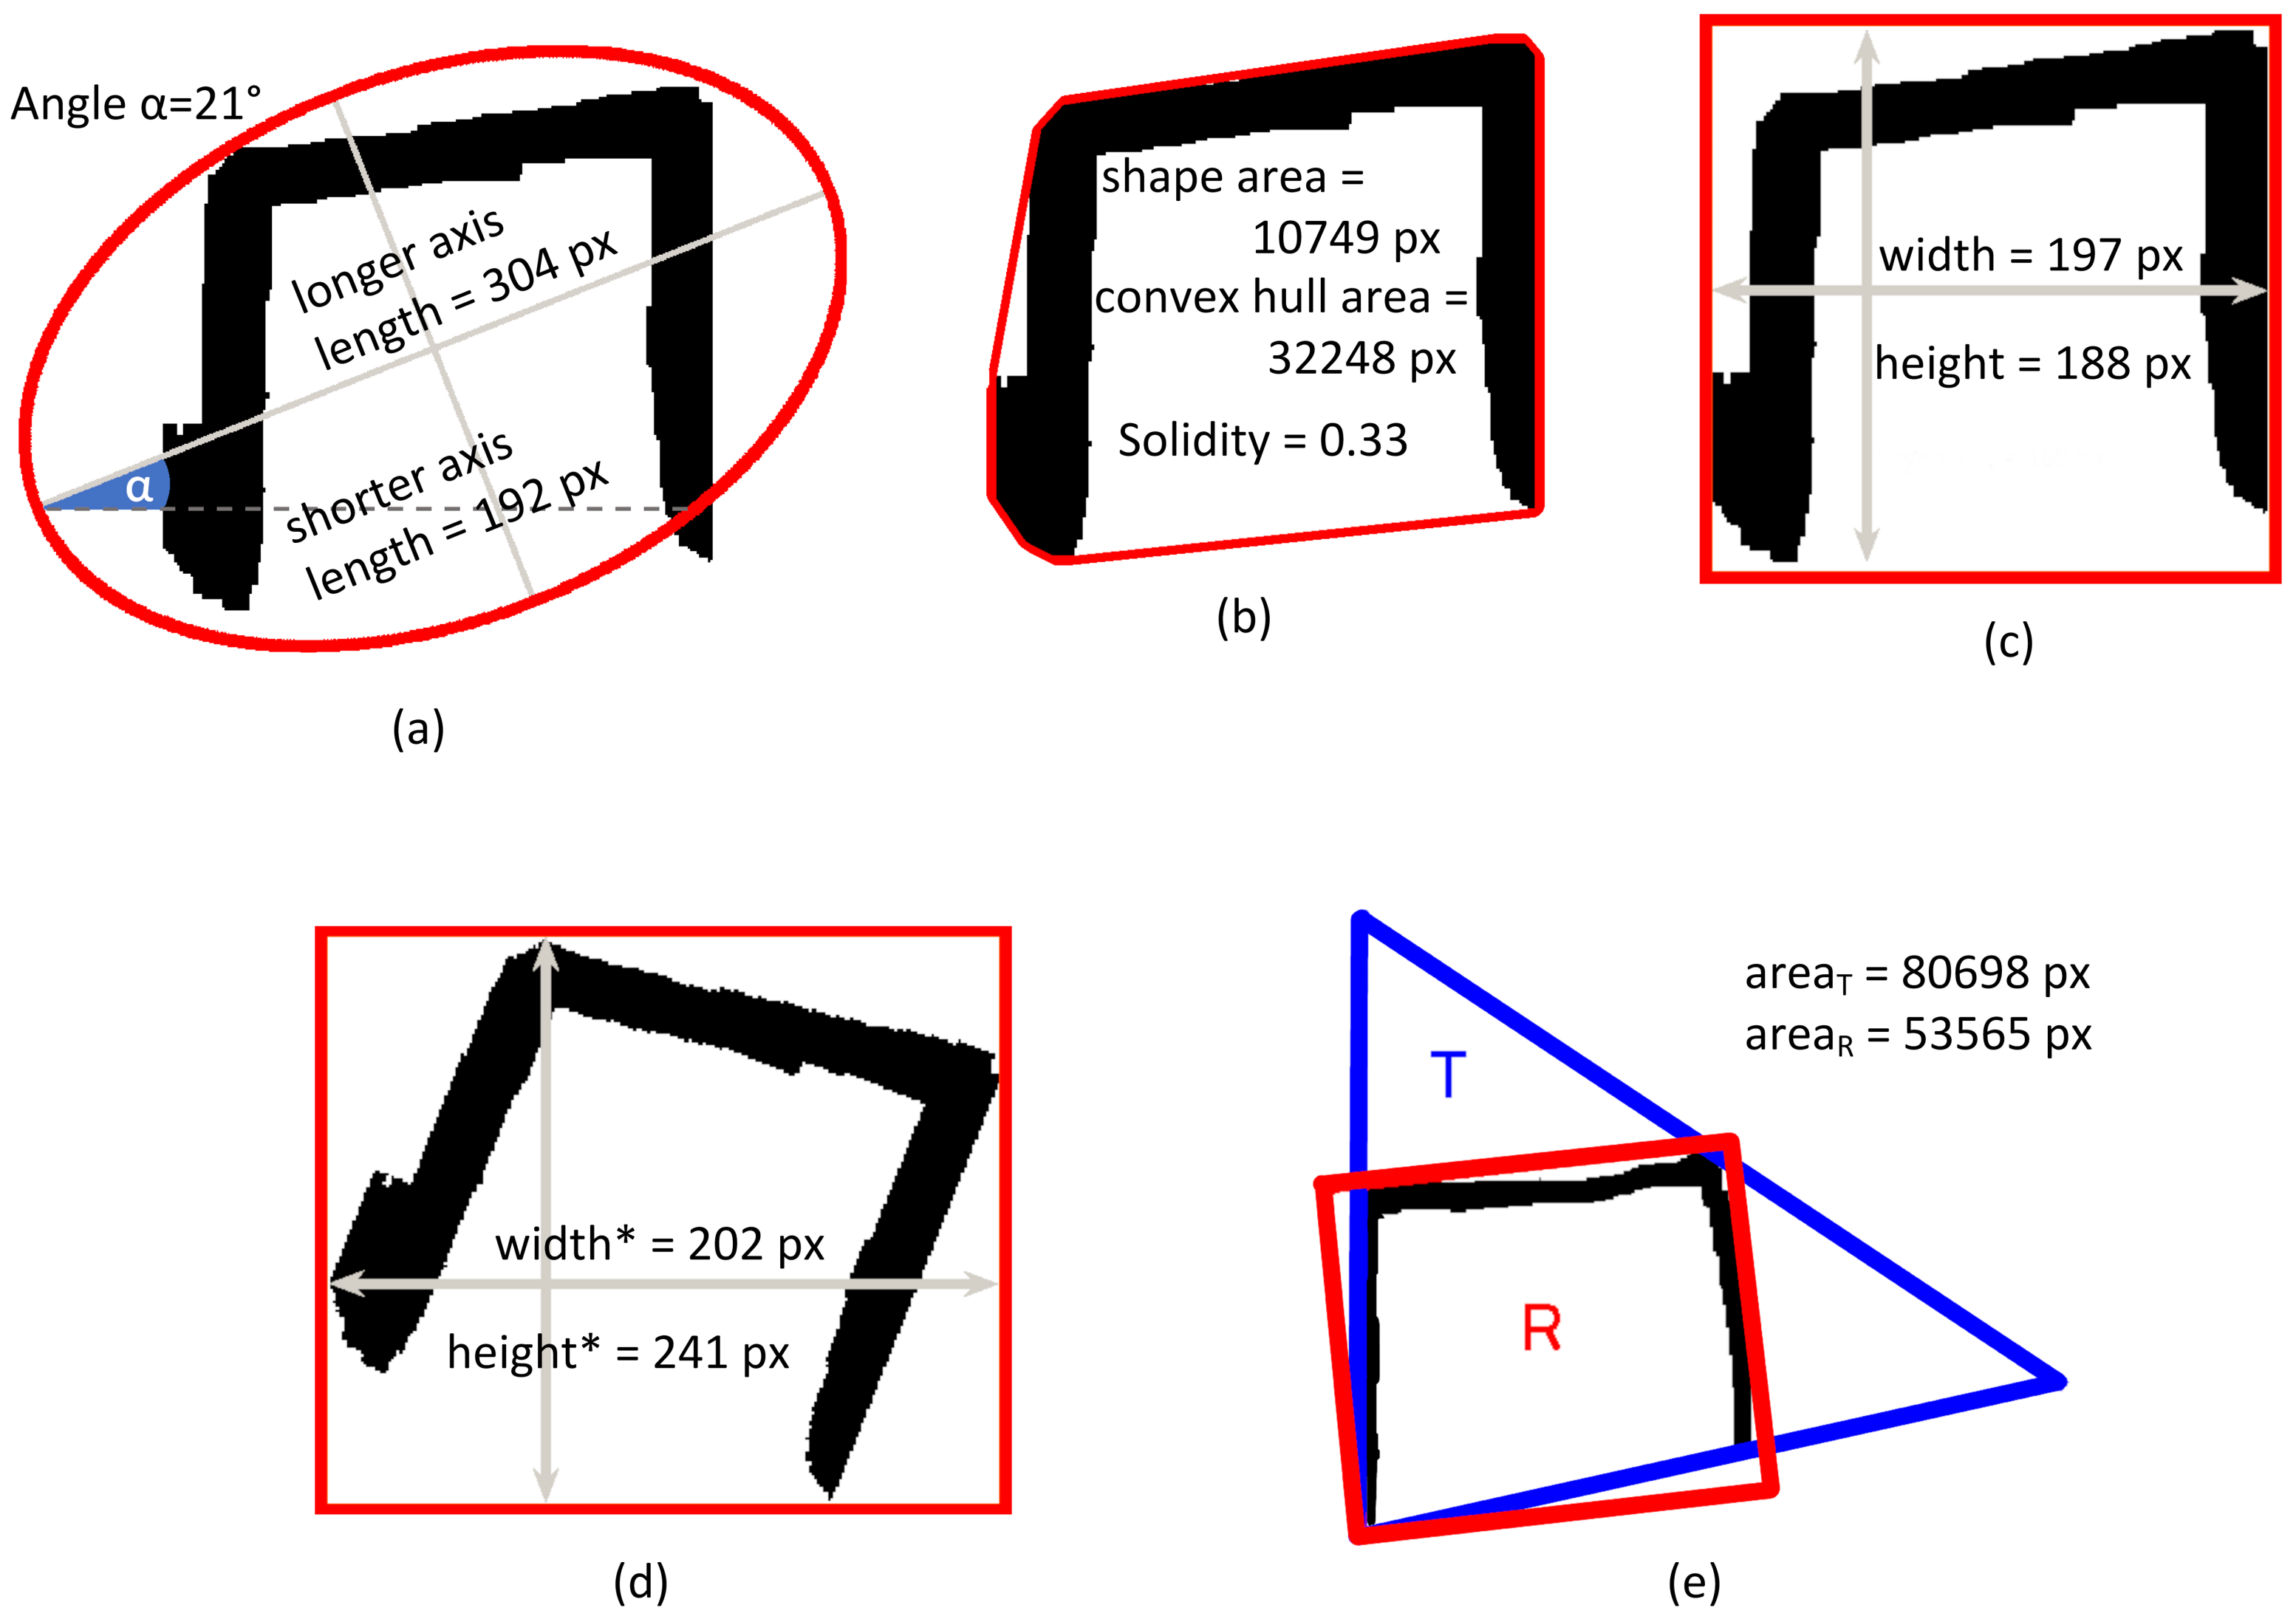
- In the image, if the ratio of the area of the smallest triangle T circumscribing the character and the sum of the areas of the smallest rectangle R and the smallest triangle circumscribing the character () is smaller than 0.55, then the character is considered as a triangle model;
- In the image, the examined character may be considered a rectangle (triangle) model if (1) the area of the minimum enclosing rectangle (triangle) is smaller than the area of the minimum enclosing triangle (rectangle) and (2) the corresponding IF rectangle (IF triangle) ratio is smaller than 0.55 (see Table A1 in Appendix A for definitions and the methods). The 0.55 threshold was selected experimentally based on 10 individual examined shapes of each kind to allow for slightly deformed models and reject significantly malformed shapes.
- In the image, if the character contains a horizontal line longer than 0.25 of the total character width according to the Hough transform [37], then the character is considered as a rectangle model (the 0.25 threshold was selected experimentally based on the analysis of the ten individual shapes of each kind to allow for regular and slightly deformed templates).
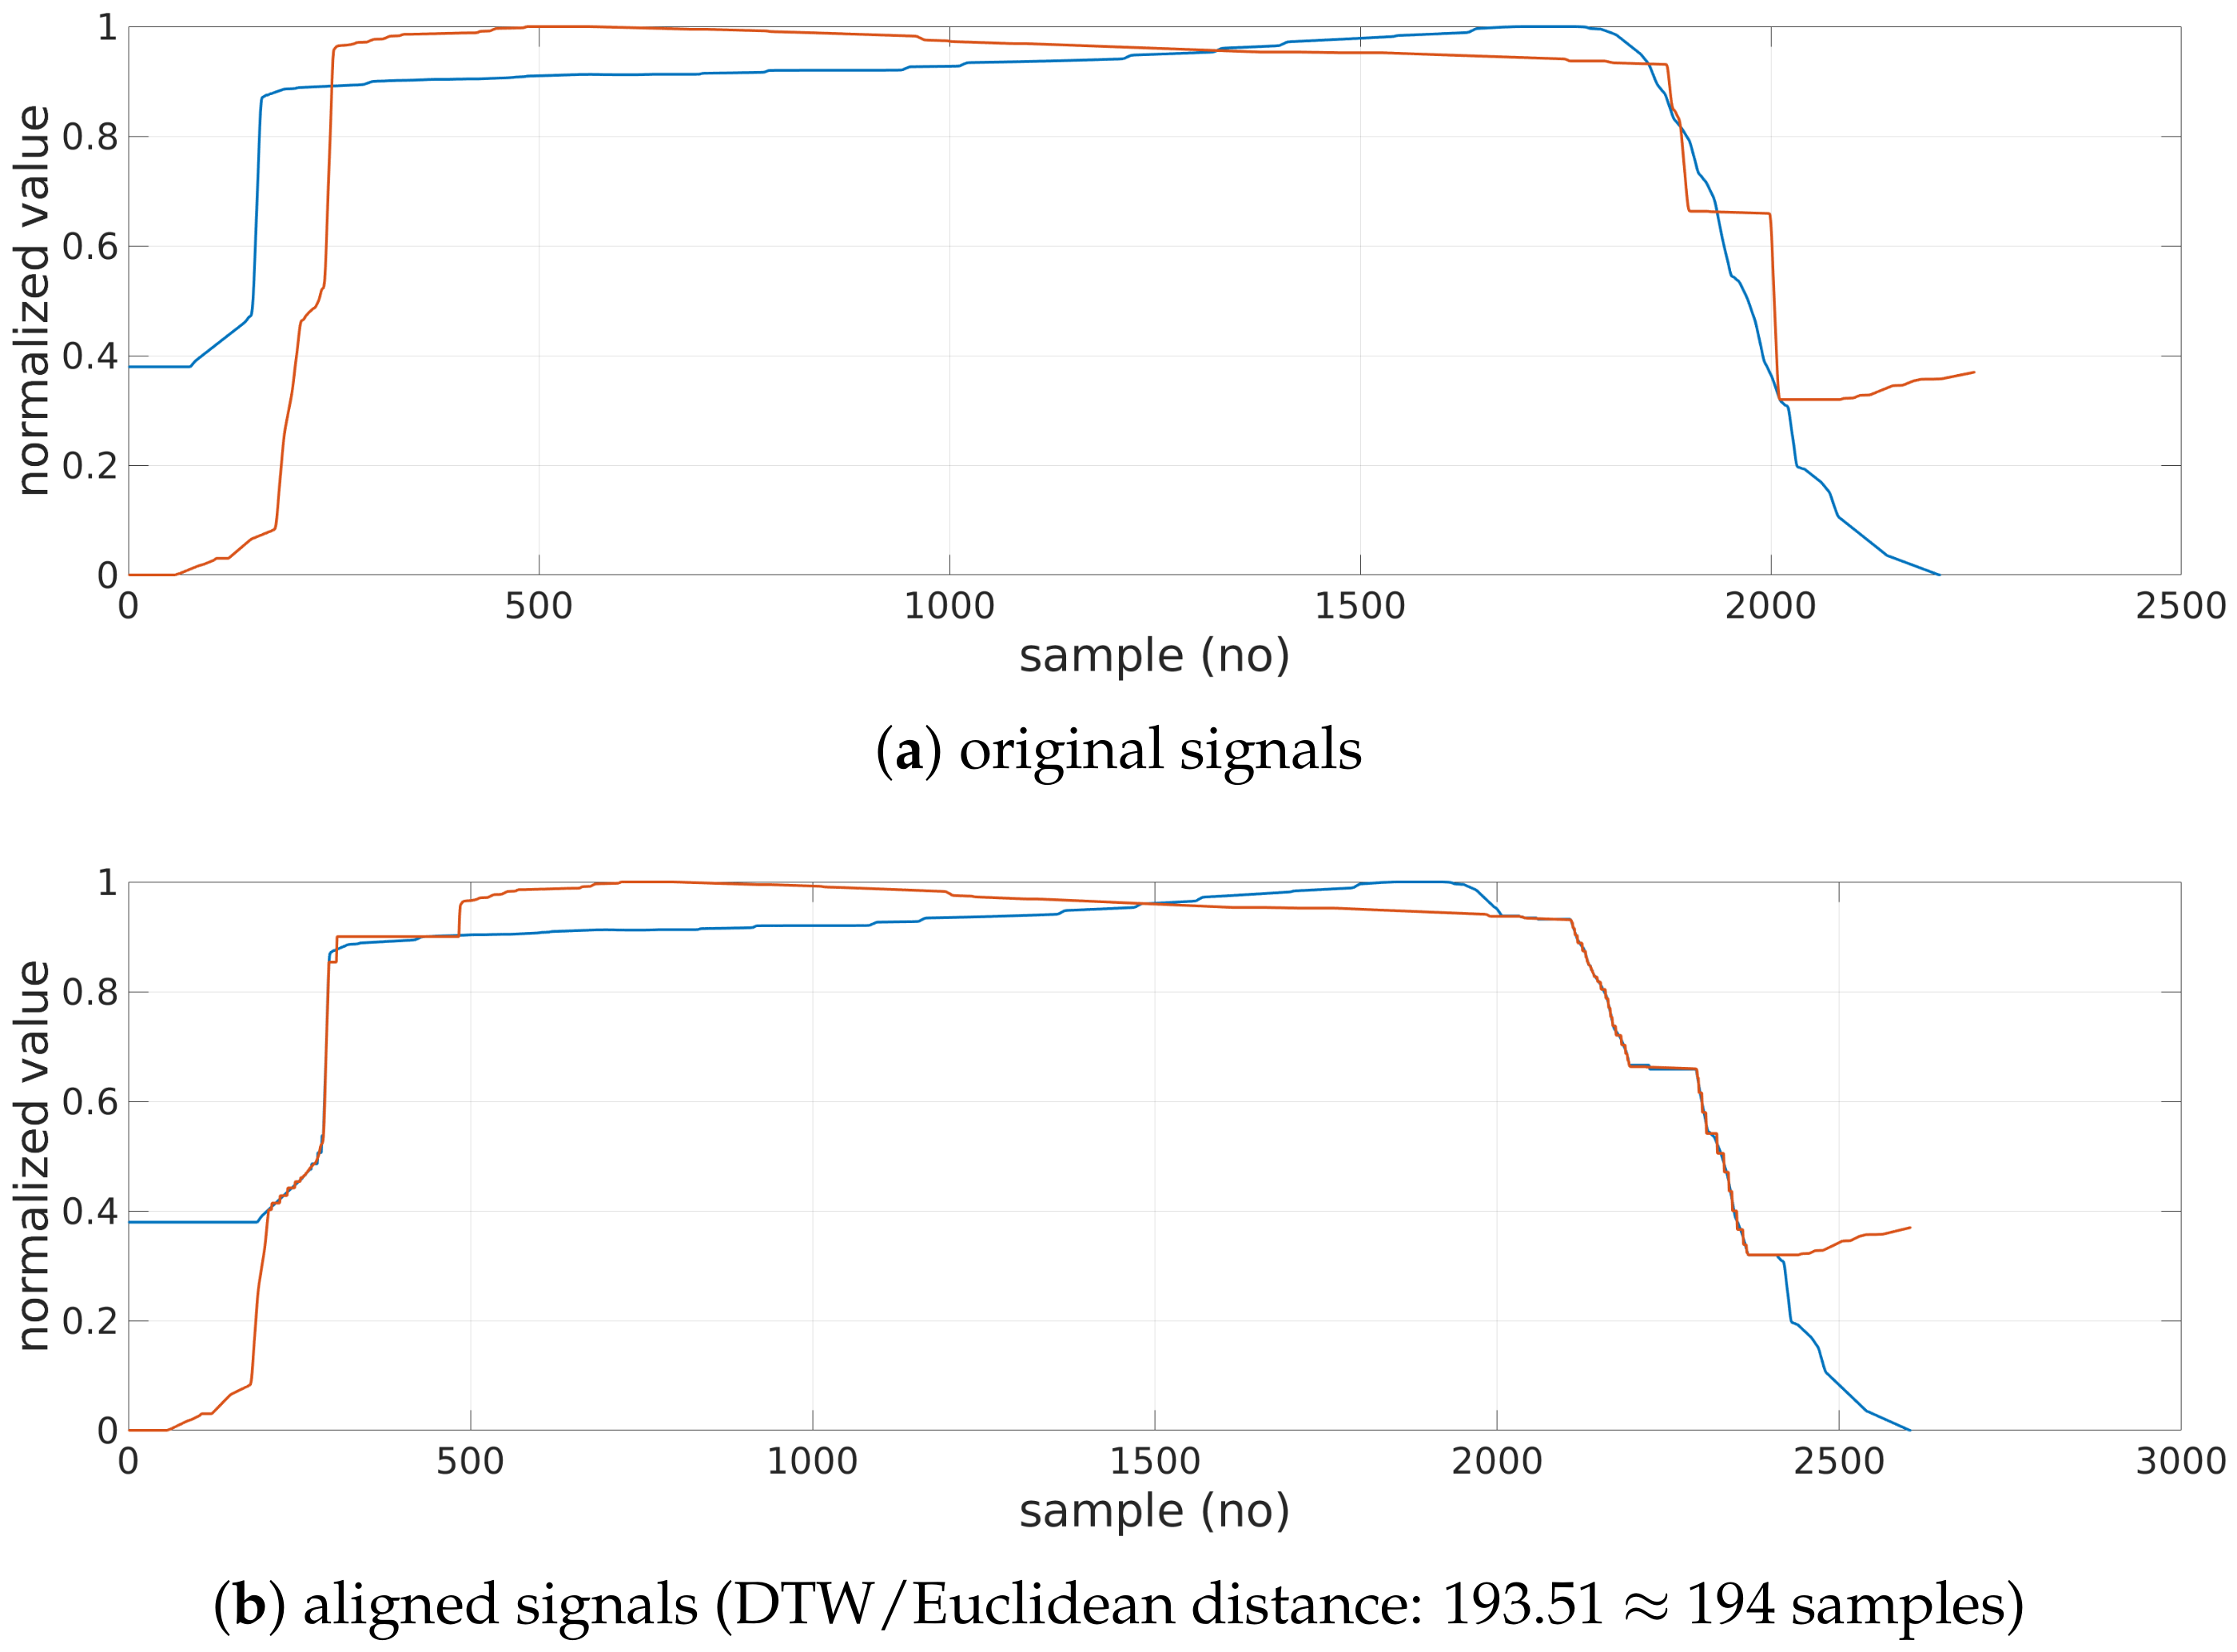
- In the normalized signal, the ratio of the number of the samples with the value (amplitude) higher than the 80% of the maximum value of the signal (Figure 5) and the total number of samples exceeds 66% then the character is considered as a rectangle model, whereas if it is lower than 33%, then the character is considered triangle model (cf. Histogram feature definition and comment in Table A2, Appendix A);
2.5. Feature Extraction
NW Coefficient
2.6. Classification
3. Experiments and Results
3.1. Character Separation
3.2. Shape Recognition
3.3. Feature Extraction
3.3.1. Rectangles
3.3.2. Triangles
3.3.3. NW Coefficient
3.4. Performance
3.5. Classifiers
4. Discussion
5. Conclusions
Author Contributions
Funding
Institutional Review Board Statement
Informed Consent Statement
Data Availability Statement
Conflicts of Interest
Appendix A. Luria’s Alternating Series Test Features
Appendix A.1. Image-Based Features


| Name | Definition | Notes | Unit | Normalization |
|---|---|---|---|---|
| Width | The width of the bounding box of the character | See Figure A1c | – | Y |
| Height | The height of the bounding box of the character | See Figure A1c | – | Y |
| Area | The number of pixels of the character | Number of black pixels in the object in Figure A1b | – | Y |
| Convex hull | The number of pixels of the smallest convex polygon containing all the points of the character | See Figure A1b | – | Y |
| Solidity | The ratio of the pixels belonging to the character and the total number of pixels in the convex hull | Does not change after normalization; See Figure A1b | – | N |
| Longer axis | The normalized length of the longer (major) axis of the ellipse having the same normalized second central moment as the character | See Figure A1a | – | Y |
| Shorter axis | The normalized length of the shorter (minor) axis of the ellipse having the same normalized second central moment as the character | See Figure A1a | – | Y |
| Angle | The inclination of the major axis of the ellipse having the same normalized second central moment as the character | See Figure A1a | [] | N |
| Eccentricity | The measure of how much the ellipse deviates from being circular; | – | N | |
| Width | The width of the bounding box the character after the rotation by the -Angle degrees (straightening) | See Figure A1d | – | Y |
| Height | The height of the bounding box after the rotation by the -Angle degrees | See Figure A1d | – | Y |
| IF rectangle | The ratio of the area (interior pixels) of the smallest rectangle enclosing the character and the sum of the areas of the smallest rectangle and the smallest triangle circumscribing the character; the enclosing rectangle with the smallest area is found using Freeman approach [52] | , where and denote quantities shown in Figure A1e; rectangle enclosing another rectangle should feature smaller area than enclosing triangle; as observed, regular triangles yield values close to 33% | – | N |
| IF triangle | The ratio of the area (interior pixels) of the triangle enclosing the character and the sum of the areas of the smallest rectangle and the smallest triangle enclosing the character; the enclosing triangle with the smallest area is found using O’Rourke approach [53] | , where and denote quantities shown in Figure A1e; triangle enclosing another triangle should feature smaller area than the circumscribing rectangle; as observed, regular rectangles yield values close to 33% | – | N |
| Width ratio | The ratio of the sum of the widths of all characters representing one shape (rectangles or triangles) to the series’s whole length | Only patient-part of the series is considered | – | N |
Appendix A.2. Signal-Based Features
| Name | Definition | Notes | Unit |
|---|---|---|---|
| Histogram | The ratio of the number of the samples with the amplitude higher than the 80% of the maximum value of the signal to the total number of samples | See Figure 5; , where C is a set of all samples, and , and is a maximum signal value; in the ideal rectangle, the amplitude of most samples is equal to the maximum signal value (hence Histogram parameter is close to 100%), whereas in the ideal triangle, the amplitude values are uniformly distributed (hence Histogram parameter value is close to 20%); 80%, as well as 66% and 33% thresholds employed in Section 2.4 were determined experimentally for ten randomly selected rectangles and triangles drawn by patients in the control group | – |
| Variability | The standard deviation of number samples in the ten bins of the histogram | See Figure 5; width of each bin is set to a 10th of maximum signal value; each sample is assigned to exactly one bin of histogram | – |
| DTW model | The Dynamic Time Warping distance from the artificial (perfect) rectangle/triangle model closest to the character | Euclidean distance to the nearest template shape selected during DTW-based character recognition procedure as described in Section 2.4 | no of samples |
| Signal length | The number of signal samples representing the character normalized to the first template character length | First shape of matching class (rectangle or triangle) written by the examiner is used as a template for normalization of patient-drawn shapes | – |
Appendix B. Statistical Evaluation of Features
| Feature | p | CON | PD | PSP | |||
|---|---|---|---|---|---|---|---|
| MED | IQR | MED | IQR | MED | IQR | ||
| MED Width [%] | <0.001 | 107.29 | 29.43 | 88.31 | 28.77 | 113.05 | 70.07 |
| STD Width [%] | 0.078 | 15.00 | 7.18 | 14.41 | 10.39 | 19.64 | 11.01 |
| MED Height [%] | <0.001 | 114.18 | 39.82 | 98.20 | 28.89 | 131.78 | 62.03 |
| STD Height [%] | 0.038 | 11.38 | 6.51 | 11.52 | 5.21 | 15.73 | 7.24 |
| MED Area [%] | <0.001 | 131.46 | 73.81 | 65.49 | 38.43 | 121.45 | 111.03 |
| STD Area [%] | 0.001 | 22.62 | 15.02 | 17.32 | 8.05 | 27.29 | 29.17 |
| MED Width * [%] | 0.001 | 118.99 | 33.39 | 103.83 | 29.16 | 135.89 | 54.99 |
| STD Width * [%] | 0.042 | 16.33 | 5.11 | 15.06 | 7.37 | 21.14 | 14.83 |
| MED Height * [%] | <0.001 | 115.50 | 38.04 | 84.78 | 33.63 | 124.99 | 56.91 |
| STD Height * [%] | 0.008 | 16.06 | 10.11 | 16.40 | 8.43 | 22.08 | 13.70 |
| MED Long axis [%] | <0.001 | 102.34 | 30.89 | 84.60 | 25.98 | 117.63 | 57.44 |
| STD Long axis [%] | 0.025 | 12.63 | 6.53 | 13.69 | 4.66 | 18.53 | 9.70 |
| MED Short axis [%] | <0.001 | 109.11 | 37.56 | 84.19 | 29.09 | 118.37 | 45.40 |
| STD Short axis [%] | <0.001 | 13.09 | 7.76 | 13.75 | 8.46 | 23.61 | 7.72 |
| MED Angle | 0.068 | 10.27 | 19.99 | 22.22 | 29.99 | 14.74 | 54.93 |
| STD Angle | 0.057 | 16.10 | 26.57 | 23.02 | 23.14 | 26.27 | 28.42 |
| MED Solidity [%] | 0.028 | 114.43 | 59.77 | 91.72 | 51.68 | 73.43 | 52.88 |
| STD Solidity [%] | 0.557 | 21.03 | 10.78 | 22.59 | 16.90 | 19.60 | 24.96 |
| MED Eccentricity | 0.190 | 0.69 | 0.14 | 0.74 | 0.11 | 0.71 | 0.17 |
| STD Eccentricity | 0.113 | 0.11 | 0.06 | 0.12 | 0.06 | 0.14 | 0.07 |
| MED Convex hull [%] | <0.001 | 109.82 | 77.79 | 74.16 | 38.46 | 135.68 | 144.07 |
| STD Convex hull [%] | 0.002 | 23.36 | 14.55 | 18.25 | 13.93 | 35.96 | 34.23 |
| MED Histogram [%] | 0.001 | 73.14 | 8.62 | 64.99 | 11.39 | 67.58 | 12.73 |
| STD Histogram [%] | 0.005 | 10.34 | 5.96 | 12.63 | 6.78 | 15.35 | 7.18 |
| MED Variability [%] | 0.014 | 43.07 | 6.72 | 45.43 | 6.60 | 42.36 | 10.44 |
| STD Variability [%] | <0.001 | 7.43 | 2.72 | 9.95 | 3.96 | 9.97 | 4.26 |
| MED DTW model | 0.001 | 94.88 | 28.10 | 112.91 | 31.92 | 125.51 | 39.20 |
| STD DTW model | 0.120 | 69.64 | 25.86 | 77.19 | 38.22 | 81.98 | 30.07 |
| MED Signal length [%] | <0.001 | 108.69 | 29.08 | 88.07 | 29.61 | 110.72 | 37.50 |
| STD Signal length [%] | 0.024 | 15.19 | 6.77 | 15.61 | 9.45 | 20.42 | 18.57 |
| MED IF rectangle [%] | <0.001 | 59.61 | 2.90 | 57.08 | 5.59 | 58.41 | 4.79 |
| STD IF rectangle [%] | 0.013 | 2.85 | 1.38 | 3.43 | 2.75 | 3.81 | 1.21 |
| MED IF triangle [%] | <0.001 | 40.39 | 2.90 | 42.92 | 5.59 | 41.59 | 4.79 |
| STD IF triangle [%] | 0.013 | 2.85 | 1.38 | 3.43 | 2.75 | 3.81 | 1.21 |
| Width ratio [%] | 0.001 | 52.51 | 5.44 | 56.13 | 13.07 | 58.98 | 7.54 |
| Feature | p | CON | PD | PSP | |||
|---|---|---|---|---|---|---|---|
| MED | IQR | MED | IQR | MED | IQR | ||
| MED Width [%] | <0.001 | 93.20 | 36.04 | 69.26 | 30.14 | 70.28 | 56.56 |
| STD Width [%] | 0.443 | 15.49 | 6.19 | 16.46 | 10.08 | 18.36 | 12.94 |
| MED Height [%] | <0.001 | 111.90 | 33.91 | 85.53 | 30.74 | 110.82 | 58.44 |
| STD Height [%] | <0.001 | 11.27 | 6.88 | 11.76 | 4.98 | 18.38 | 7.34 |
| MED Area [%] | <0.001 | 102.16 | 59.33 | 48.61 | 33.09 | 74.46 | 79.46 |
| STD Area [%] | 0.001 | 19.98 | 14.73 | 13.04 | 8.47 | 22.78 | 31.16 |
| MED Width * [%] | 0.002 | 105.21 | 36.55 | 92.67 | 29.64 | 101.21 | 63.56 |
| STD Width * [%] | 0.002 | 12.94 | 5.69 | 12.98 | 7.81 | 19.43 | 11.17 |
| MED Height * [%] | <0.001 | 94.00 | 37.87 | 67.12 | 26.59 | 63.97 | 41.15 |
| STD Height * [%] | 0.327 | 14.33 | 6.39 | 14.47 | 7.94 | 15.25 | 7.05 |
| MED Long axis [%] | <0.001 | 83.81 | 29.50 | 68.18 | 23.17 | 82.94 | 39.59 |
| STD Long axis [%] | 0.003 | 10.98 | 3.93 | 11.53 | 7.07 | 16.48 | 10.94 |
| MED Short axis [%] | <0.001 | 82.38 | 35.37 | 57.60 | 22.56 | 57.44 | 53.17 |
| STD Short axis [%] | 0.012 | 12.92 | 4.48 | 12.84 | 5.40 | 15.86 | 7.55 |
| MED Angle | 0.002 | 34.81 | 38.62 | 45.90 | 23.03 | 62.22 | 16.18 |
| STD Angle | 0.045 | 27.16 | 25.30 | 30.29 | 32.69 | 42.67 | 40.45 |
| MED Solidity [%] | 0.706 | 138.21 | 77.97 | 128.58 | 77.68 | 171.15 | 129.25 |
| STD Solidity [%] | 0.004 | 29.29 | 20.34 | 34.95 | 22.49 | 51.27 | 53.71 |
| MED Eccentricity | <0.001 | 0.74 | 0.09 | 0.81 | 0.11 | 0.85 | 0.13 |
| STD Eccentricity | 0.813 | 0.11 | 0.05 | 0.11 | 0.05 | 0.11 | 0.06 |
| MED Convex hull [%] | <0.001 | 62.55 | 52.56 | 39.52 | 22.20 | 50.91 | 66.62 |
| STD Convex hull [%] | 0.034 | 14.10 | 5.86 | 12.04 | 10.34 | 17.60 | 11.88 |
| MED Histogram [%] | 0.169 | 26.25 | 2.90 | 26.26 | 4.08 | 24.03 | 8.04 |
| STD Histogram [%] | 0.023 | 6.35 | 5.46 | 9.34 | 5.12 | 9.25 | 6.24 |
| MED Variability [%] | 0.056 | 66.01 | 3.33 | 63.87 | 5.78 | 64.53 | 3.44 |
| STD Variability [%] | <0.001 | 7.84 | 2.89 | 9.40 | 5.02 | 10.64 | 5.90 |
| MED DTW model | <0.001 | 101.30 | 35.54 | 124.08 | 42.38 | 167.62 | 78.85 |
| STD DTW model | 0.004 | 75.61 | 28.09 | 69.44 | 52.04 | 103.59 | 47.32 |
| MED Signal length [%] | <0.001 | 86.04 | 40.74 | 65.86 | 25.03 | 59.16 | 50.94 |
| STD Signal length [%] | 0.815 | 16.30 | 7.21 | 16.34 | 11.32 | 17.69 | 9.83 |
| MED IF rectangle [%] | 0.343 | 38.16 | 1.88 | 38.92 | 2.64 | 38.98 | 2.41 |
| STD IF rectangle [%] | 0.074 | 1.75 | 0.99 | 2.11 | 2.16 | 2.29 | 1.63 |
| MED IF triangle [%] | 0.343 | 61.84 | 1.88 | 61.08 | 2.64 | 61.02 | 2.41 |
| STD IF triangle [%] | 0.074 | 1.75 | 0.99 | 2.11 | 2.16 | 2.29 | 1.63 |
| Width ratio [%] | 0.001 | 47.49 | 5.44 | 43.49 | 13.07 | 41.02 | 7.54 |
| Feature | p | CON | PD | PSP | |||
|---|---|---|---|---|---|---|---|
| MED | IQR | MED | IQR | MED | IQR | ||
| NW coefficient [%] | <0.001 | 100.00 | 2.20 | 94.74 | 15.56 | 96.55 | 10.00 |
References
- Höglinger, G.U.; Kassubek, J.; Csoti, I.; Ehret, R.; Herbst, H.; Wellach, I.; Winkler, J.; Jost, W.H. Differentiation of atypical Parkinson syndromes. J. Neural Transm. 2017, 124, 997–1004. [Google Scholar] [CrossRef]
- Blesa, J.; Lanciego, J.L.; Obeso, J.A. Parkinson’s disease: Cell vulnerability and disease progression. Front. Neuroanat. 2015, 9, 125. [Google Scholar] [CrossRef] [PubMed]
- Dąbrowska, M.; Schinwelski, M.; Sitek, E.J.; Muraszko-Klaudel, A.; Brockhuis, B.; Jamrozik, Z.; Sławek, J. The role of neuroimaging in the diagnosis of the atypical parkinsonian syndromes in clinical practice. Neurol. I Neurochir. Pol. 2015, 49, 421–431. [Google Scholar] [CrossRef] [PubMed]
- Kobylecki, C.; Jones, M.; Thompson, J.C.; Richardson, A.M.; Neary, D.; Mann, D.M.; Snowden, J.S.; Gerhard, A. Cognitive–behavioural features of progressive supranuclear palsy syndrome overlap with frontotemporal dementia. J. Neurol. 2015, 262, 916–922. [Google Scholar] [CrossRef] [PubMed]
- Sitek, E.J.; Konkel, A.; Dąbrowska, M.; Sławek, J. Utility of Frontal Assessment Battery in detection of neuropsychological dysfunction in Richardson variant of progressive supranuclear palsy. Neurol. I Neurochir. Pol. 2015, 49, 36–40. [Google Scholar] [CrossRef]
- Lee, A.; Gilbert, R.M. Epidemiology of Parkinson disease. Neurol. Clin. 2016, 34, 955–965. [Google Scholar] [CrossRef]
- Gerstenecker, A.; Mast, B.; Duff, K.; Ferman, T.J.; Litvan, I.; Group, E.P.S. Executive dysfunction is the primary cognitive impairment in progressive supranuclear palsy. Arch. Clin. Neuropsychol. 2012, 28, 104–113. [Google Scholar] [CrossRef]
- Bartels, A.L.; Leenders, K.L. Parkinson’s disease: The syndrome, the pathogenesis and pathophysiology. Cortex 2009, 45, 915–921. [Google Scholar] [CrossRef]
- Jankovic, J. Progressive Supranuclear Palsy; Technical Report; Baylor College of Medicine, Department of Neurology: Houston, TX, USA, 2021; Available online: https://www.bcm.edu/healthcare/specialties/neurology/parkinsons-disease-and-movement-disorders/progressive-supranuclear-palsy (accessed on 4 January 2022).
- Amboni, M.; Ricciardi, C.; Picillo, M.; Santis, C.D.; Ricciardelli, G.; Abate, F.; Tepedino, M.F.; D’Addio, G.; Cesarelli, G.; Volpe, G.; et al. Gait analysis may distinguish progressive supranuclear palsy and Parkinson disease since the earliest stages. Sci. Rep. 2021, 11, 9297. [Google Scholar] [CrossRef]
- Sachin, S.; Shukla, G.; Goyal, V.; Singh, S.P.; Aggarwal, V.; Behari, M. Clinical speech impairment in Parkinson’s disease, progressive supranuclear palsy, and multiple system atrophy. Neurol. India 2008, 56, 122–126. [Google Scholar]
- Rusz, J.; Bonnet, C.; Klempir, J.; Tykalová, T.; Baborova, E.; Novotny, M.; Rulseh, A.; Ruzicka, E. Speech disorders reflect differing pathophysiology in Parkinson’s disease, progressive supranuclear palsy and multiple system atrophy. J. Neurol. 2015, 262, 992–1001. [Google Scholar] [CrossRef]
- Di Fabio, R.P.; Zampieri, C.; Tuite, P. Gaze control and foot kinematics during stair climbing: Characteristics leading to fall risk in progressive supranuclear palsy. Phys. Ther. 2008, 88, 240–250. [Google Scholar] [CrossRef]
- Marx, S.; Respondek, G.; Stamelou, M.; Dowiasch, S.; Stoll, J.; Bremmer, F.; Oertel, W.H.; Höglinger, G.U.; Einhauser, W. Validation of mobile eye-tracking as novel and efficient means for differentiating progressive supranuclear palsy from Parkinson’s disease. Front. Behav. Neurosci. 2012, 6, 88. [Google Scholar] [CrossRef]
- Tseng, P.H.; Cameron, I.G.M.; Munoz, D.P.; Itti, L. Eye-Tracking Method and System for Screening Human Diseases, 2014. U.S. Patent 8,808,195, 19 August 2014. [Google Scholar]
- Bhat, S.; Acharya, U.R.; Hagiwara, Y.; Dadmehr, N.; Adeli, H. Parkinson’s disease: Cause factors, measurable indicators, and early diagnosis. Comput. Biol. Med. 2018, 102, 234–241. [Google Scholar] [CrossRef]
- Cilia, N.D.; Stefano, C.D.; Fontanella, F.; Freca, A.S.D. An Experimental Protocol to Support Cognitive Impairment Diagnosis by using Handwriting Analysis. Procedia Comput. Sci. 2018, 141, 466–471. [Google Scholar] [CrossRef]
- Sitek, E.J.; Barczak, A.; Kluj-Kozłowska, K.; Kozłowski, M.; Narożańska, E.; Konkel, A.; Dąbrowska, M.; Barcikowska, M.; Sławek, J. Writing in Richardson variant of progressive supranuclear palsy in comparison to progressive non-fluent aphasia. Neurol. I Neurochir. Pol. 2015, 49, 217–222. [Google Scholar] [CrossRef]
- Ardila, A.; Surloff, C. Dysexecutive agraphia: A major executive dysfunction sign. Int. J. Neurosci. 2006, 116, 653–663. [Google Scholar] [CrossRef]
- Netšunajev, A.; Nõmm, S.; Toomela, A.; Medijainen, K.; Taba, P. Sentence Writing Test for Parkinson Disease Modeling: Comparing Predictive Ability of Classifiers. In Intelligent Information and Database Systems; Springer International Publishing: Berlin/Heidelberg, Germany, 2020; pp. 345–357. [Google Scholar] [CrossRef]
- Harciarek, M.; Sitek, E.J.; Barczak, A. Dementias and the frontal lobes. In Executive Functions in Health and Disease; Elsevier: Amsterdam, The Netherlands, 2017; pp. 445–486. [Google Scholar] [CrossRef]
- De Lucia, N.; Grossi, D.; Trojano, L. The genesis of graphic perseverations in Alzheimer’s Disease and Vascular Dementia. Clin. Neuropsychol. 2015, 29, 924–937. [Google Scholar] [CrossRef]
- Luria, A.R. Higher Cortical Functions in Man; Springer: New York, NY, USA, 1980. [Google Scholar] [CrossRef]
- Lezak, M.D.; Howieson, D.B.; Bigler, E.D.; Tranel, D. Neuropsychological Assessment; Oxford University Press: London, UK, 2012. [Google Scholar]
- Chan, R.C.; Shum, D.; Toulopoulou, T.; Chen, E.Y. Assessment of executive functions: Review of instruments and identification of critical issues. Arch. Clin. Neuropsychol. 2008, 23, 201–216. [Google Scholar] [CrossRef]
- Moreira, H.S.; Costa, A.S.; Castro, S.L.; Lima, C.F.; Vicente, S.G. Assessing executive dysfunction in neurodegenerative disorders: A critical review of brief neuropsychological tools. Front. Aging Neurosci. 2017, 9, 369. [Google Scholar] [CrossRef]
- Sitek, E.J.; Wieczorek, D.; Konkel, A.; Dabrowska, M.; Slawek, J. The pattern of verbal, visuospatial and procedural learning in Richardson variant of progressive supranuclear palsy in comparison to Parkinson’s disease. Psychiatr. Pol. 2017, 51, 647–659. [Google Scholar] [CrossRef]
- Nomm, S.; Toomela, A.; Kozhenkina, J.; Toomsoo, T. Quantitative analysis in the digital Luria’s alternating series tests. In Proceedings of the 2016 14th International Conference on Control, Automation, Robotics and Vision (ICARCV), Phuket, Thailand, 13–15 November 2016; pp. 1–6. [Google Scholar] [CrossRef]
- Bellman, R.; Kalaba, R. On adaptive control processes. IRE Trans. Autom. Control 1958, 4, 1–9. [Google Scholar] [CrossRef]
- Impedovo, D.; Pirlo, G. Dynamic Handwriting Analysis for the Assessment of Neurodegenerative Diseases: A Pattern Recognition Perspective. IEEE Rev. Biomed. Eng. 2019, 12, 209–220. [Google Scholar] [CrossRef]
- Dentamaro, V.; Impedovo, D.; Pirlo, G. An Analysis of Tasks and Features for Neuro-Degenerative Disease Assessment by Handwriting. In Pattern Recognition. ICPR International Workshops and Challenges; Springer International Publishing: Berlin/Heidelberg, Germany, 2021; pp. 536–545. [Google Scholar] [CrossRef]
- Stepien, P.; Kawa, J.; Wieczorek, D.; Dabrowska, M.; Slawek, J.; Sitek, E.J. Computer Aided Feature Extraction in the Paper Version of Luria’s Alternating Series Test in Progressive Supranuclear Palsy. In Proceedings of the International Conference on Information Technologies in Biomedicine, Kamien Slaski, Poland, 18–20 June 2018; Springer: Berlin/Heidelberg, Germany, 2018; pp. 561–570. [Google Scholar]
- Lam, L.; Lee, S.W.; Suen, C.Y. Thinning Methodologies-A Comprehensive Survey. IEEE Trans. Pattern Anal. Mach. Intell. 1992, 14, 869–885. [Google Scholar] [CrossRef]
- Ning, X.; Selesnick, I.W.; Duval, L. Chromatogram baseline estimation and denoising using sparsity (BEADS). Chemom. Intell. Lab. Syst. 2014, 139, 156–167. [Google Scholar] [CrossRef]
- Kawa, J.; Stepień, P.; Kapko, W.; Niedziela, A.; Derejczyk, J. Leg movement tracking in automatic video-based one-leg stance evaluation. Comput. Med. Imaging Graph. 2018, 65, 191–199. [Google Scholar] [CrossRef]
- Sakoe, H.; Chiba, S. Dynamic programming algorithm optimization for spoken word recognition. IEEE Trans. Acoust. Speech Signal Process. 1978, 26, 43–49. [Google Scholar] [CrossRef]
- Hough, P.V.C. Method and means for recognizing complex patterns, 1962. U.S. Patent 3,069,654, 18 December 1962. [Google Scholar]
- Needleman, S.B.; Wunsch, C.D. A general method applicable to the search for similarities in the amino acid sequence of two proteins. J. Mol. Biol. 1970, 48, 443–453. [Google Scholar] [CrossRef]
- Dietterich, T.G. Error-Correcting Output Codes: A General Method for Improving Multiclass Inductive Learning Programs. In The Mathematics of Generalization; CRC Press: Boca Raton, FL, USA, 1995; pp. 395–407. [Google Scholar] [CrossRef]
- Boser, B.E.; Guyon, I.M.; Vapnik, V.N. A training algorithm for optimal margin classifiers. In Proceedings of the Fifth Annual Workshop on Computational Learning Theory—COLT’92, Pittsburgh, PA, USA, 27–29 July 1992; ACM Press: New York, NY, USA, 1992. [Google Scholar] [CrossRef]
- Cortes, C.; Vapnik, V. Support-vector networks. Mach. Learn. 1995, 20, 273–297. [Google Scholar] [CrossRef]
- Escalera, S.; Pujol, O.; Radeva, P. Separability of ternary codes for sparse designs of error-correcting output codes. Pattern Recognit. Lett. 2009, 30, 285–297. [Google Scholar] [CrossRef]
- Litvan, I.; Agid, Y.; Calne, D.; Campbell, G.; Dubois, B.; Duvoisin, R.; Goetz, C.; Golbe, L.I.; Grafman, J.; Growdon, J.; et al. Clinical research criteria for the diagnosis of progressive supranuclear palsy (Steele-Richardson-Olszewski syndrome): Report of the NINDS-SPSP international workshop. Neurology 1996, 47, 1–9. [Google Scholar] [CrossRef]
- Hughes, A.J.; Daniel, S.E.; Kilford, L.; Lees, A.J. Accuracy of clinical diagnosis of idiopathic Parkinson’s disease: A clinico-pathological study of 100 cases. J. Neurol. Neurosurg. Psychiatry 1992, 55, 181–184. [Google Scholar] [CrossRef]
- Choi, S.S.; Cha, S.H.; Tappert, C.C. A survey of binary similarity and distance measures. J. Syst. Cybern. Inform. 2010, 8, 43–48. [Google Scholar]
- Salvatore, C.; Cerasa, A.; Castiglioni, I.; Gallivanone, F.; Augimeri, A.; Lopez, M.; Arabia, G.; Morelli, M.; Gilardi, M.; Quattrone, A. Machine learning on brain MRI data for differential diagnosis of Parkinson’s disease and Progressive Supranuclear Palsy. J. Neurosci. Methods 2014, 222, 230–237. [Google Scholar] [CrossRef]
- Cherubini, A.; Morelli, M.; Nistico, R.; Salsone, M.; Arabia, G.; Vasta, R.; Augimeri, A.; Caligiuri, M.E.; Quattrone, A. Magnetic resonance support vector machine discriminates between Parkinson disease and progressive supranuclear palsy. Mov. Disord. 2014, 29, 266–269. [Google Scholar] [CrossRef]
- Nigro, S.; Arabia, G.; Antonini, A.; Weis, L.; Marcante, A.; Tessitore, A.; Cirillo, M.; Tedeschi, G.; Zanigni, S.; Calandra-Buonaura, G.; et al. Magnetic Resonance Parkinsonism Index: Diagnostic accuracy of a fully automated algorithm in comparison with the manual measurement in a large Italian multicentre study in patients with progressive supranuclear palsy. Eur. Radiol. 2017, 27, 2665–2675. [Google Scholar] [CrossRef]
- Talai, A.S.; Ismail, Z.; Sedlacik, J.; Boelmans, K.; Forkert, N.D. Improved Automatic Morphology-Based Classification of Parkinson’s Disease and Progressive Supranuclear Palsy. Clin. Neuroradiol. 2018, 29, 605–614. [Google Scholar] [CrossRef]
- Janarthanan, V.; Nadhamuni, K.; Rajakumar, S.; Padmanaban, E.; Amirthalingam, U.; Achantani, Y. Accuracy of Magnetic Resonance Parkinsonism Index in Differentiating Progressive Supranuclear Palsy from Parkinson’s Disease among South Indian Population: A Retrospective Case Control Study. Indian J. Radiol. Imaging 2021, 31, 596–600. [Google Scholar] [CrossRef]
- Goldberg, E. Varieties of Perseveration: A Comparison of Two Taxonomies; Taylor & Francis: Abingdon, UK, 1986. [Google Scholar]
- Freeman, H.; Shapira, R. Determining the minimum-area encasing rectangle for an arbitrary closed curve. Commun. ACM 1975, 18, 409–413. [Google Scholar] [CrossRef]
- O’Rourke, J.; Aggarwal, A.; Maddila, S.; Baldwin, M. An optimal algorithm for finding minimal enclosing triangles. J. Algorithms 1986, 7, 258–269. [Google Scholar] [CrossRef]


| Group | Shape | DICE [%] | STD |
|---|---|---|---|
| PSP | R | 83.45 | 27.47 |
| T | 81.13 | 28.67 | |
| PD | R | 82.95 | 26.34 |
| T | 86.76 | 25.18 | |
| CON | R | 91.37 | 24.91 |
| T | 89.24 | 24.65 |
| Method | Rectangles | Triangles | Both Shapes |
|---|---|---|---|
| Manually-labeled | 61.9 (64.8) | 66.7 (68.6) | 69.5 (70.5) |
| Automatic | 62.9 (65.7) | 61.0 (61.9) | 65.7 (66.7) |
Publisher’s Note: MDPI stays neutral with regard to jurisdictional claims in published maps and institutional affiliations. |
© 2022 by the authors. Licensee MDPI, Basel, Switzerland. This article is an open access article distributed under the terms and conditions of the Creative Commons Attribution (CC BY) license (https://creativecommons.org/licenses/by/4.0/).
Share and Cite
Stępień, P.; Kawa, J.; Sitek, E.J.; Wieczorek, D.; Sikorski, R.; Dąbrowska, M.; Sławek, J.; Pietka, E. Computer Aided Written Character Feature Extraction in Progressive Supranuclear Palsy and Parkinson’s Disease. Sensors 2022, 22, 1688. https://doi.org/10.3390/s22041688
Stępień P, Kawa J, Sitek EJ, Wieczorek D, Sikorski R, Dąbrowska M, Sławek J, Pietka E. Computer Aided Written Character Feature Extraction in Progressive Supranuclear Palsy and Parkinson’s Disease. Sensors. 2022; 22(4):1688. https://doi.org/10.3390/s22041688
Chicago/Turabian StyleStępień, Paula, Jacek Kawa, Emilia J. Sitek, Dariusz Wieczorek, Rafał Sikorski, Magda Dąbrowska, Jarosław Sławek, and Ewa Pietka. 2022. "Computer Aided Written Character Feature Extraction in Progressive Supranuclear Palsy and Parkinson’s Disease" Sensors 22, no. 4: 1688. https://doi.org/10.3390/s22041688
APA StyleStępień, P., Kawa, J., Sitek, E. J., Wieczorek, D., Sikorski, R., Dąbrowska, M., Sławek, J., & Pietka, E. (2022). Computer Aided Written Character Feature Extraction in Progressive Supranuclear Palsy and Parkinson’s Disease. Sensors, 22(4), 1688. https://doi.org/10.3390/s22041688