Article

Evaluation of Plant Stress Monitoring Capabilities Using a Portable Spectrometer and Blue-Red Grow Light

1
Naval Research Laboratory, Remote Sensing Division, 4555 Overlook Ave. SW, Washington, DC 20375, USA
2
Department of Earth and Environmental Science, Vanderbilt University, 5726 Stevenson Center, Nashville, TN 37240, USA
3
Space Science and Engineering Center, University of Wisconsin—Madison, 1225 W Dayton St., Madison, WI 53706, USA
4
Department of Geography, Florida State University, 113 Collegiate Loop, Tallahassee, FL 32306, USA
*
Author to whom correspondence should be addressed.
Sensors 2022, 22(9), 3411; https://doi.org/10.3390/s22093411
Submission received: 24 March 2022 / Revised: 11 April 2022 / Accepted: 21 April 2022 / Published: 29 April 2022
(This article belongs to the Section Smart Agriculture)

Abstract

:
Remote sensing offers a non-destructive method to detect plant physiological response to the environment by measuring chlorophyll fluorescence (CF). Most methods to estimate CF require relatively complex retrieval, spectral fitting, or modelling methods. An investigation was undertaken to evaluate measurements of CF using a relatively straightforward technique to detect and monitor plant stress with a spectroradiometer and blue-red light emitting diode (LED). CF spectral response of tomato plants treated with a photosystem inhibitor were assessed and compared to traditional reflectance-based indices: normalized difference vegetation index (NDVI) and photochemical reflectance index (PRI). The blue-red LEDs provided input irradiance and a “window” in the CF emission range of plants (~650 to 850 nm) sufficient to capture distinctive “two-peak” spectra and to distinguish plant health from day to day of the experiment, while within day differences were noisy. CF-based metrics calculated from CF spectra clearly captured signs of vegetation stress earlier than reflectance-based indices and by visual inspection. This CF monitoring technique is a flexible and scalable option for collecting plant function data, especially for indicating early signs of stress. The technique can be applied to a single plant or larger canopies using LED in dark conditions by an individual, or a manned or unmanned vehicle for agricultural or military purposes.

1. Introduction

Spectrometer measurements of chlorophyll fluorescence (CF) capture photosynthetic activity and plant function information, have been shown related to gross primary production (GPP) and carbon uptake, and can capture signals of plant stress, e.g., [1,2,3]. CF is a physiological process undergone by plants to dissipate excess energy from photosynthesis to protect tissues by emitting radiation mostly in the red and far-red region of the spectrum (approximately 650 to 850 nm) and, as a by-product of photosynthesis, provides a mechanistic link to plant function [4,5]. Thus, CF offers opportunities to assess vegetation status at leaf, plant, canopy, ecosystem, and global levels across spatial and temporal scales, e.g., [6,7,8,9,10,11,12,13,14,15,16,17,18,19,20,21,22,23].
Two predominant categories of CF measurement techniques are active and passive techniques. Widely used active techniques employ lasers, light emitting diode (LED) illumination, or lamps to excite chlorophyll and instruments, such as cameras or spectrometers, to record CF promptly or delayed and include techniques, such as pulse-amplitude-modulation (PAM) [4,7,12,16,24,25,26,27,28,29,30,31,32,33,34,35]. By activating photosynthesis with a light of a known, narrow wavelength, the PAM technique allows measurements of several aspects of photosynthetic activity in ambient light conditions in great detail. Such active techniques, however, are restricted mainly to leaf level and have intricate protocols to follow for experiment design and are not easily scaled up. The other category is measuring CF in ambient conditions, mostly in sunlight. In contrast to PAM, CF measured with the so-called passive techniques can be made at leaf to ecosystem scales using spectrometers mounted on the laboratory bench, towers, drones, or on satellites. In addition to allowing data collection at multiple scales, passive CF measurements have also been shown to scale effectively to larger levels, such as globally, and are more generalizable because the light activating photosynthesis is usually sunlight, unlike the active technique [23,28,36,37,38,39,40,41].
CF can be challenging to measure because the CF signal is small compared to the amount of sunlight, or potentially alternative light, the plant requires to drive photosynthesis. For this reason, most methods to examine CF have remained complex, time intensive, require extensive knowledge of the instrument and illumination source specifications, uncertainties, protocols, and results are difficult to interpret. For example, current passive CF measurement methods include retrievals under sunlight requiring one of several algorithms to exploit the oxygen absorption bands that coincide with the CF emission spectrum centered at approximately 687 and 761 nm. The retrieved CF values are used for estimates or as model inputs to estimate the CF spectra, e.g., [22,42,43,44,45,46]. Another option is to use an actinic light source having a “window” coincident with the CF spectrum can allow CF to be captured with a spectroradiometer. In many cases, a filter is placed within a chamber, such as within the source chamber for a leaf clip, to block incoming light in the CF wavelength range and then record the plant CF spectra in that “window”. This filtering and measurement process can be tedious, require expensive components, and, in the case of using the leaf clip, restrict measurements to leaf scale similar to the PAM method [42,47,48,49,50]. Therefore, despite advantages over active techniques, passive measurements of CF have remained complex.
With the goal of identifying a potentially more straightforward CF-based technique to detect plant stress, an initial investigation was carried out to address the following: (1) what level of sensitivity to plant stress can be measured using a spectrometer and blue-red light emitting diode grow light, and (2) are CF spectra or CF metrics derived from these spectra indicative of stress earlier than visual inspection or traditional vegetation indices? Specifically, an Analytical Spectral Devices (ASD)/Malvern FieldSpec® HandHeld 2™ Spectroradiometer (HH2) with a blue-red grow light emitting diode lamp (MiracleLED 2.2 Watt; LED) was used to make repeated measurements of a target plant treated with a photosystem inhibiting poison. The ability to detect CF, the sensitivity of the CF region of the spectra, and metrics derived from the CF region were tested and metrics were compared to measurements of the normalized vegetation index (NDVI) and the photochemical reflectance index (PRI), which are often used to assess vegetation function.

2. Materials and Methods

Healthy, similar-sized tomato plants (Solanum lycopersicum), chosen for applicability for follow up studies, were placed in two chambers (target and control) of a dark tent in the laboratory (Figure 1a). On Day 1 of the experiment, a dose of a photosystem II (PSII) inhibitor, an algicide/herbicide called 3-(3′,4′-dichlorophenyl)-1,1-dimethylurea (DCMU) mixed with 300 mL water was applied to the soil of the target plant. DCMU blocks the electron flow from photosystem II (PSII) during photosynthesis, thus inducing stress when plants cannot effectively convert incoming energy to useful forms for carrying out proper functioning. For this reason, DCMU makes an efficient weed killer, for instance. The large application amount relative to what might be used for weed control in a natural setting was chosen to illicit an intentional stress response due to photosynthetic system shutdown in order to test the capability to detect and track [51]. In this scenario, CF would be expected to rise dramatically in the beginning stages because the energy supplied by incoming illumination would be blocked from entering PSII and a greater amount of excess energy would be given off as CF. After this initial increase, a decline in function results in a decline in CF.
The HH2 was mounted on a standard tripod above the target tomato plant canopy in the dark tent enabling a field of view of approximately 29 cm diameter (Figure 1a). An LED was positioned in each chamber using flexible bulb holders from a single lamp base to provide incoming photosynthetically active radiation (PAR; ~400–680 nm), one illuminating the target tomato plant and one illuminating the control. The LED emits light only in the blue and red regions, leaving a “window” in the upper red and far-red regions where plants emit CF as a by-product of photosynthesis (Figure 1b). Using a timer, the LEDs were turned on at 7:00 a.m. CDST each day and turned off at 7:00 p.m. CDST each evening, during which the HH2 was set to record a spectral measurement every 30 min. Figure 1c shows examples CF spectra on Day 1 of the experiment and the typical two-peak feature of a CF spectrum are distinguishable. For reference, an incoming (LED) spectrum (measured using a Spectralon® white reference panel (WR)) is overplotted to illustrate the CF and LED spectra are clearly distinguishable from one another. However, it should be noted that the magnitude of the LED spectrum is lower when illuminating the plant than when illuminating the WR (albedo of ~1, while the plant albedo ~0.4).
Once daily, a Spectralon® white reference panel (WR) was placed above the target plant canopy and an irradiance measurement of the LED was made. In addition, a measurement of the target and control plant and the WR were made under an ASD/Malvern Illuminator Reflectance Lamp (IRL, 70 W stable quartz-tungsten-halogen calibrated light source, ASD/Malvern, Boulder, CO, USA). The spectra under IRL were used to calculate daily normalized difference vegetation index (NDVI) and photochemical reflectance index (PRI) measurements. The daily reflectance of the control plant did not change throughout the experiment (not shown).
The CF portion (650–800 nm region) was extracted from each observation made between 8:00 a.m. CDST and 6:00 p.m. CDST. The first and last 1–2 measurements of the day were omitted to avoid erroneous measurements due to mismatch of the lamp timer and HH2 internal clock/auto-timer setting or any drift in either timer. A daily average CF spectrum and standard deviation at each wavelength was calculated. The resulting CF spectra were smoothed (central-moving average, window = 5). In addition to the full CF spectrum, CF values at 685 nm and 740 nm were extracted (Fred, Ffar, respectively) and then the Fred/Ffar ratio calculated [21,51,52,53].
Daily NDVI [54] was calculated by calculating reflectance from the target plant spectrum and the IRL reference spectrum taken once each day and using:
NDVI = R 800 R 680 R 800 + R 680
and PRI [55] as
PRI = R 531 R 570 R 531 + R 570
where R λ is the reflectance and λ is the indicated wavelength in nm. To examine the relative capabilities of the measurements to capture the dynamics of photosynthetic function, we also calculated the proportion of maximum NDVI, PRI, Fred, and Ffar as a time series.
Custom programs to read, write, and batch process the spectra from their proprietary format as well as specifically process and make figures from the experiment were written in Interactive Data Language (IDL; L3Harris Geospatial, Boulder, CO, USA).

3. Results

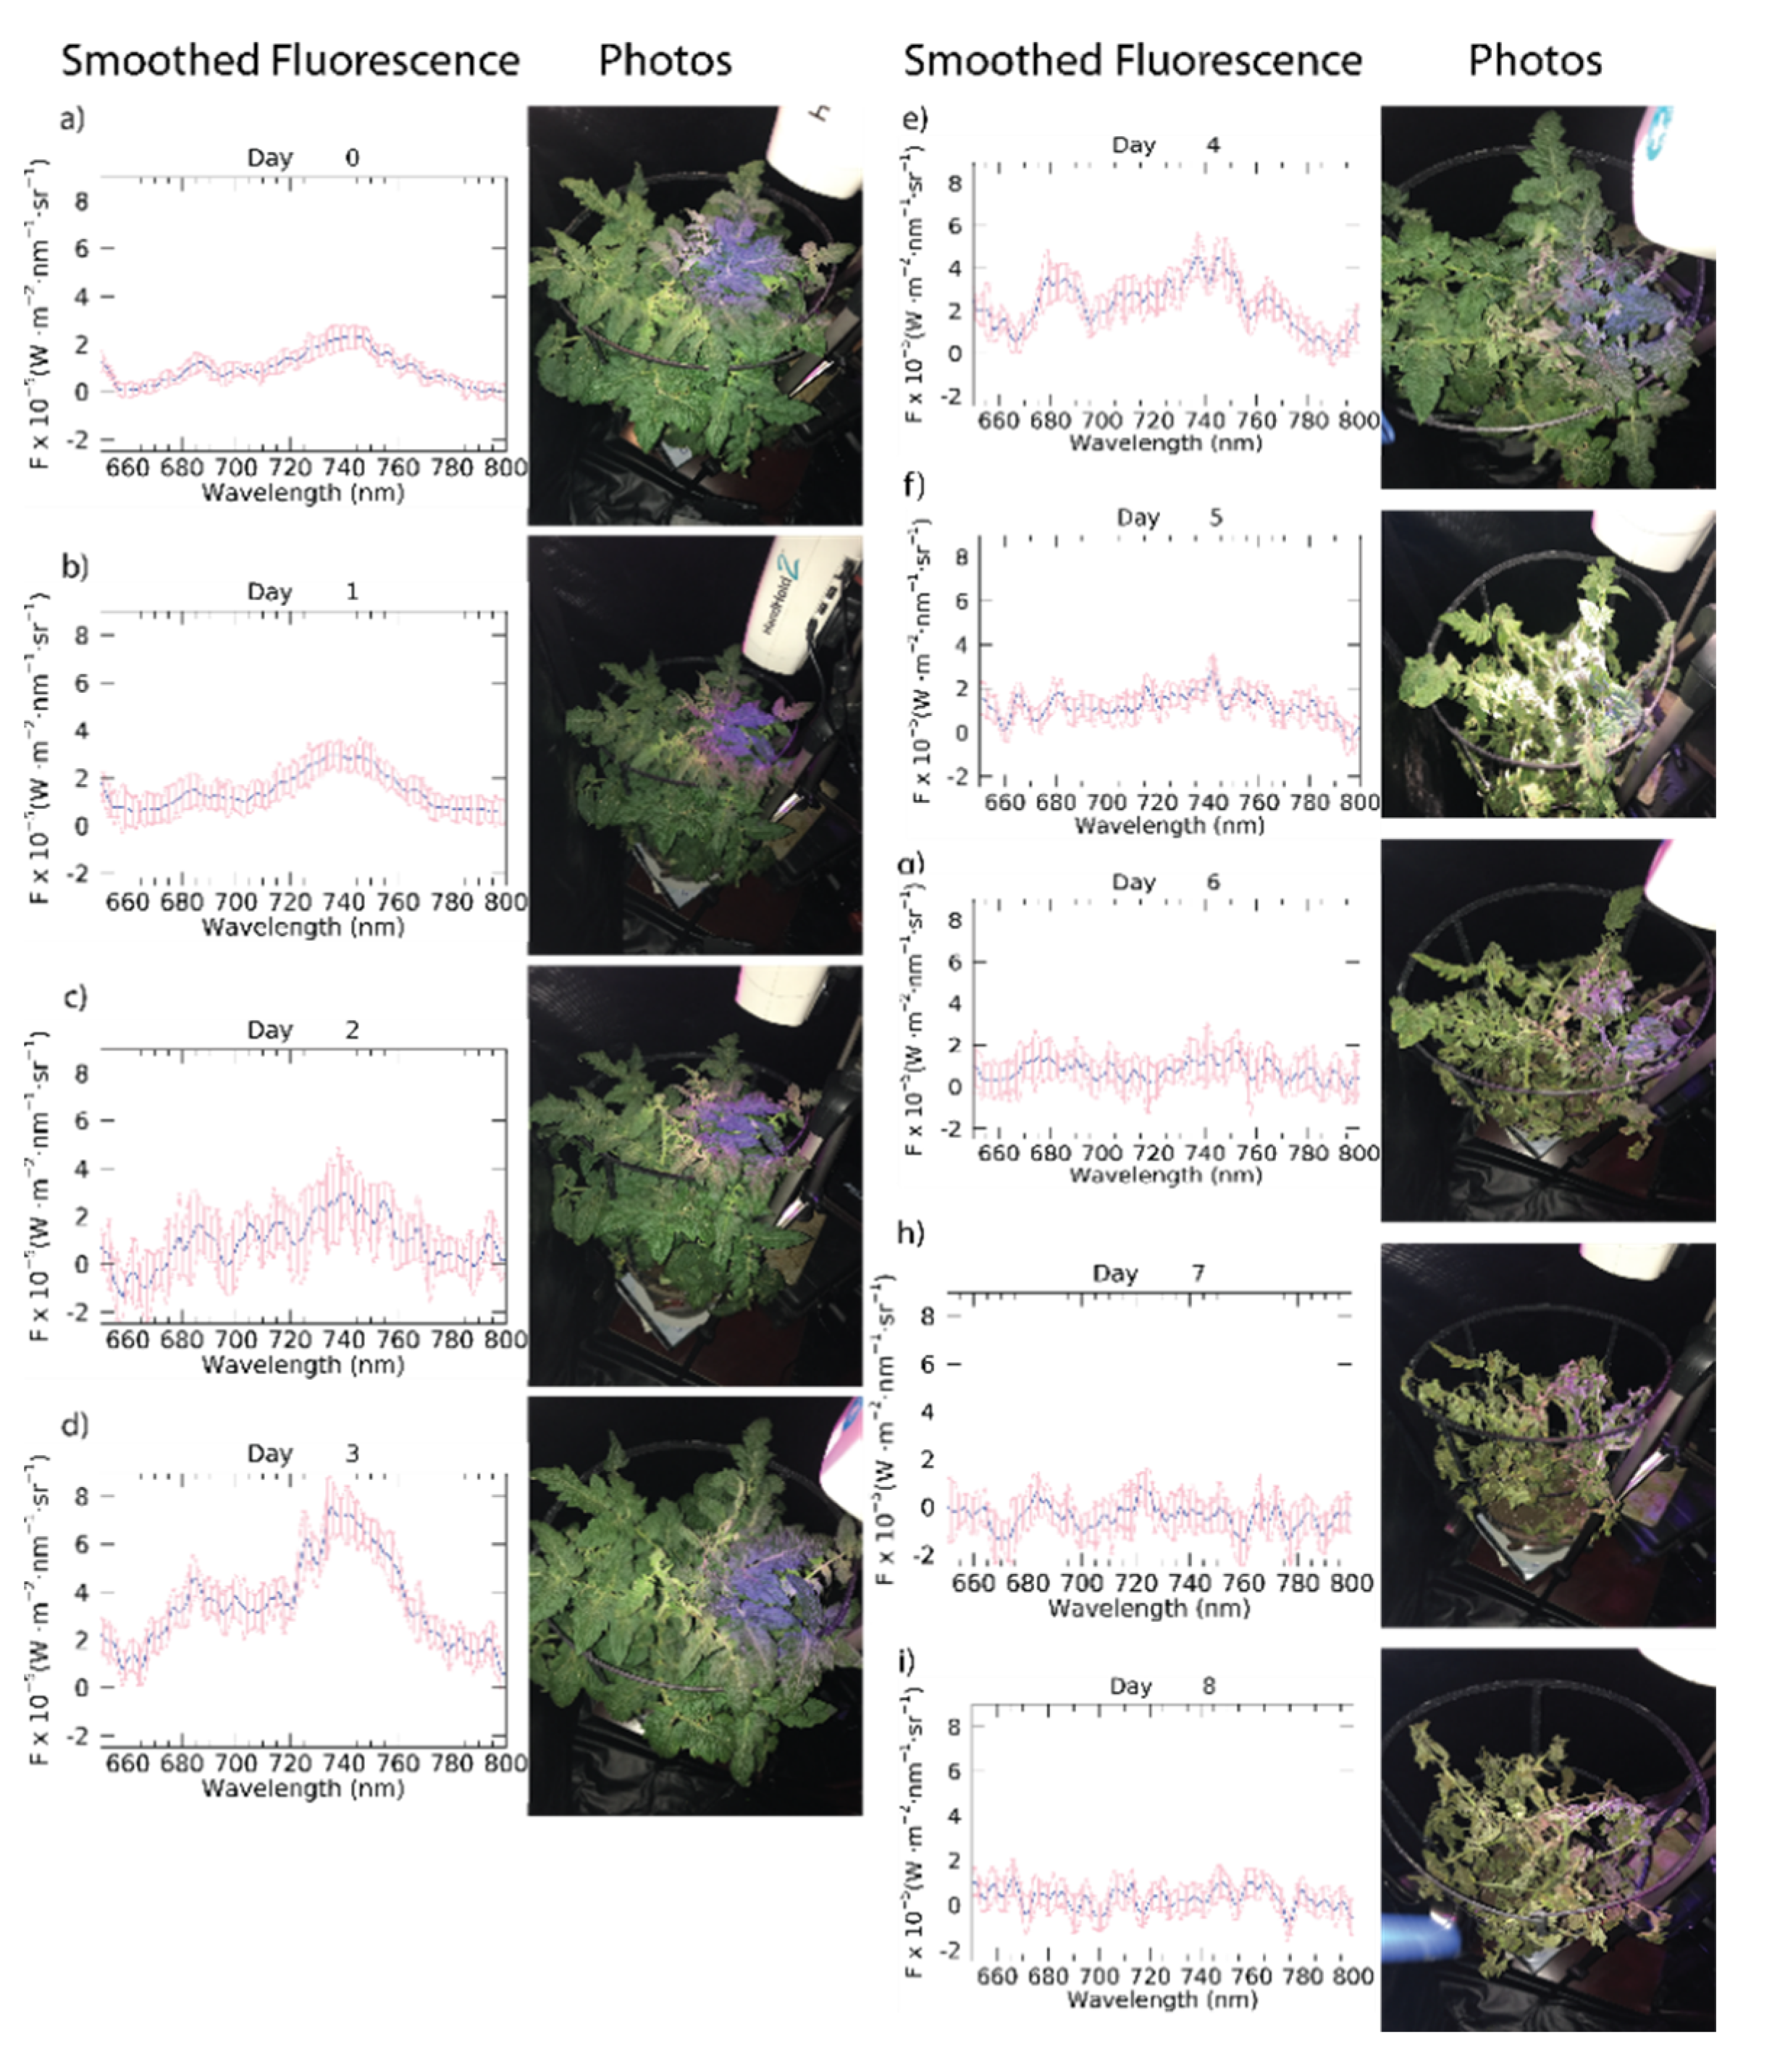
Days 0 and 1 show the near and far-red peaks expected for the fluorescence range, which become less distinguishable on Days 2–4 as the variability for each increase (Figure 2a and Figure A1a–e). While the plant canopy is visibly unchanged from Day 0 to Day 3 (Figure 2a and Figure A1a–d), the red peak increases by Day 3 compared to Day 0 by approximately 4 times, while the far-red peak increases by 3.5 times, likely due to the increase in CF corresponding to photosynthetic inhibition. After the Day 3 peak in the fluorescence values, both peaks are decreased by Day 4, when the first signs of leaf discoloration and some wilting appear in the canopy, yet CF is still elevated compared to before DCMU application (Figure 2c and Figure A1e). By Day 5 of the experiment, the two peaks of fluorescence are indistinguishable, eventually reducing to noise around zero by Day 7 (Figure A1f–h) and most leaves on Day 5 show some withering, discoloration, spots, or slightly less green at a minimum and some portions of soil began to show through the canopy when viewed from above continuing to degrade through Day 8, the final day of measurements, the recorded CF spectra and photos show little to no green vegetation being measured by the HH2 (Figure 2d and Figure A1a–i).
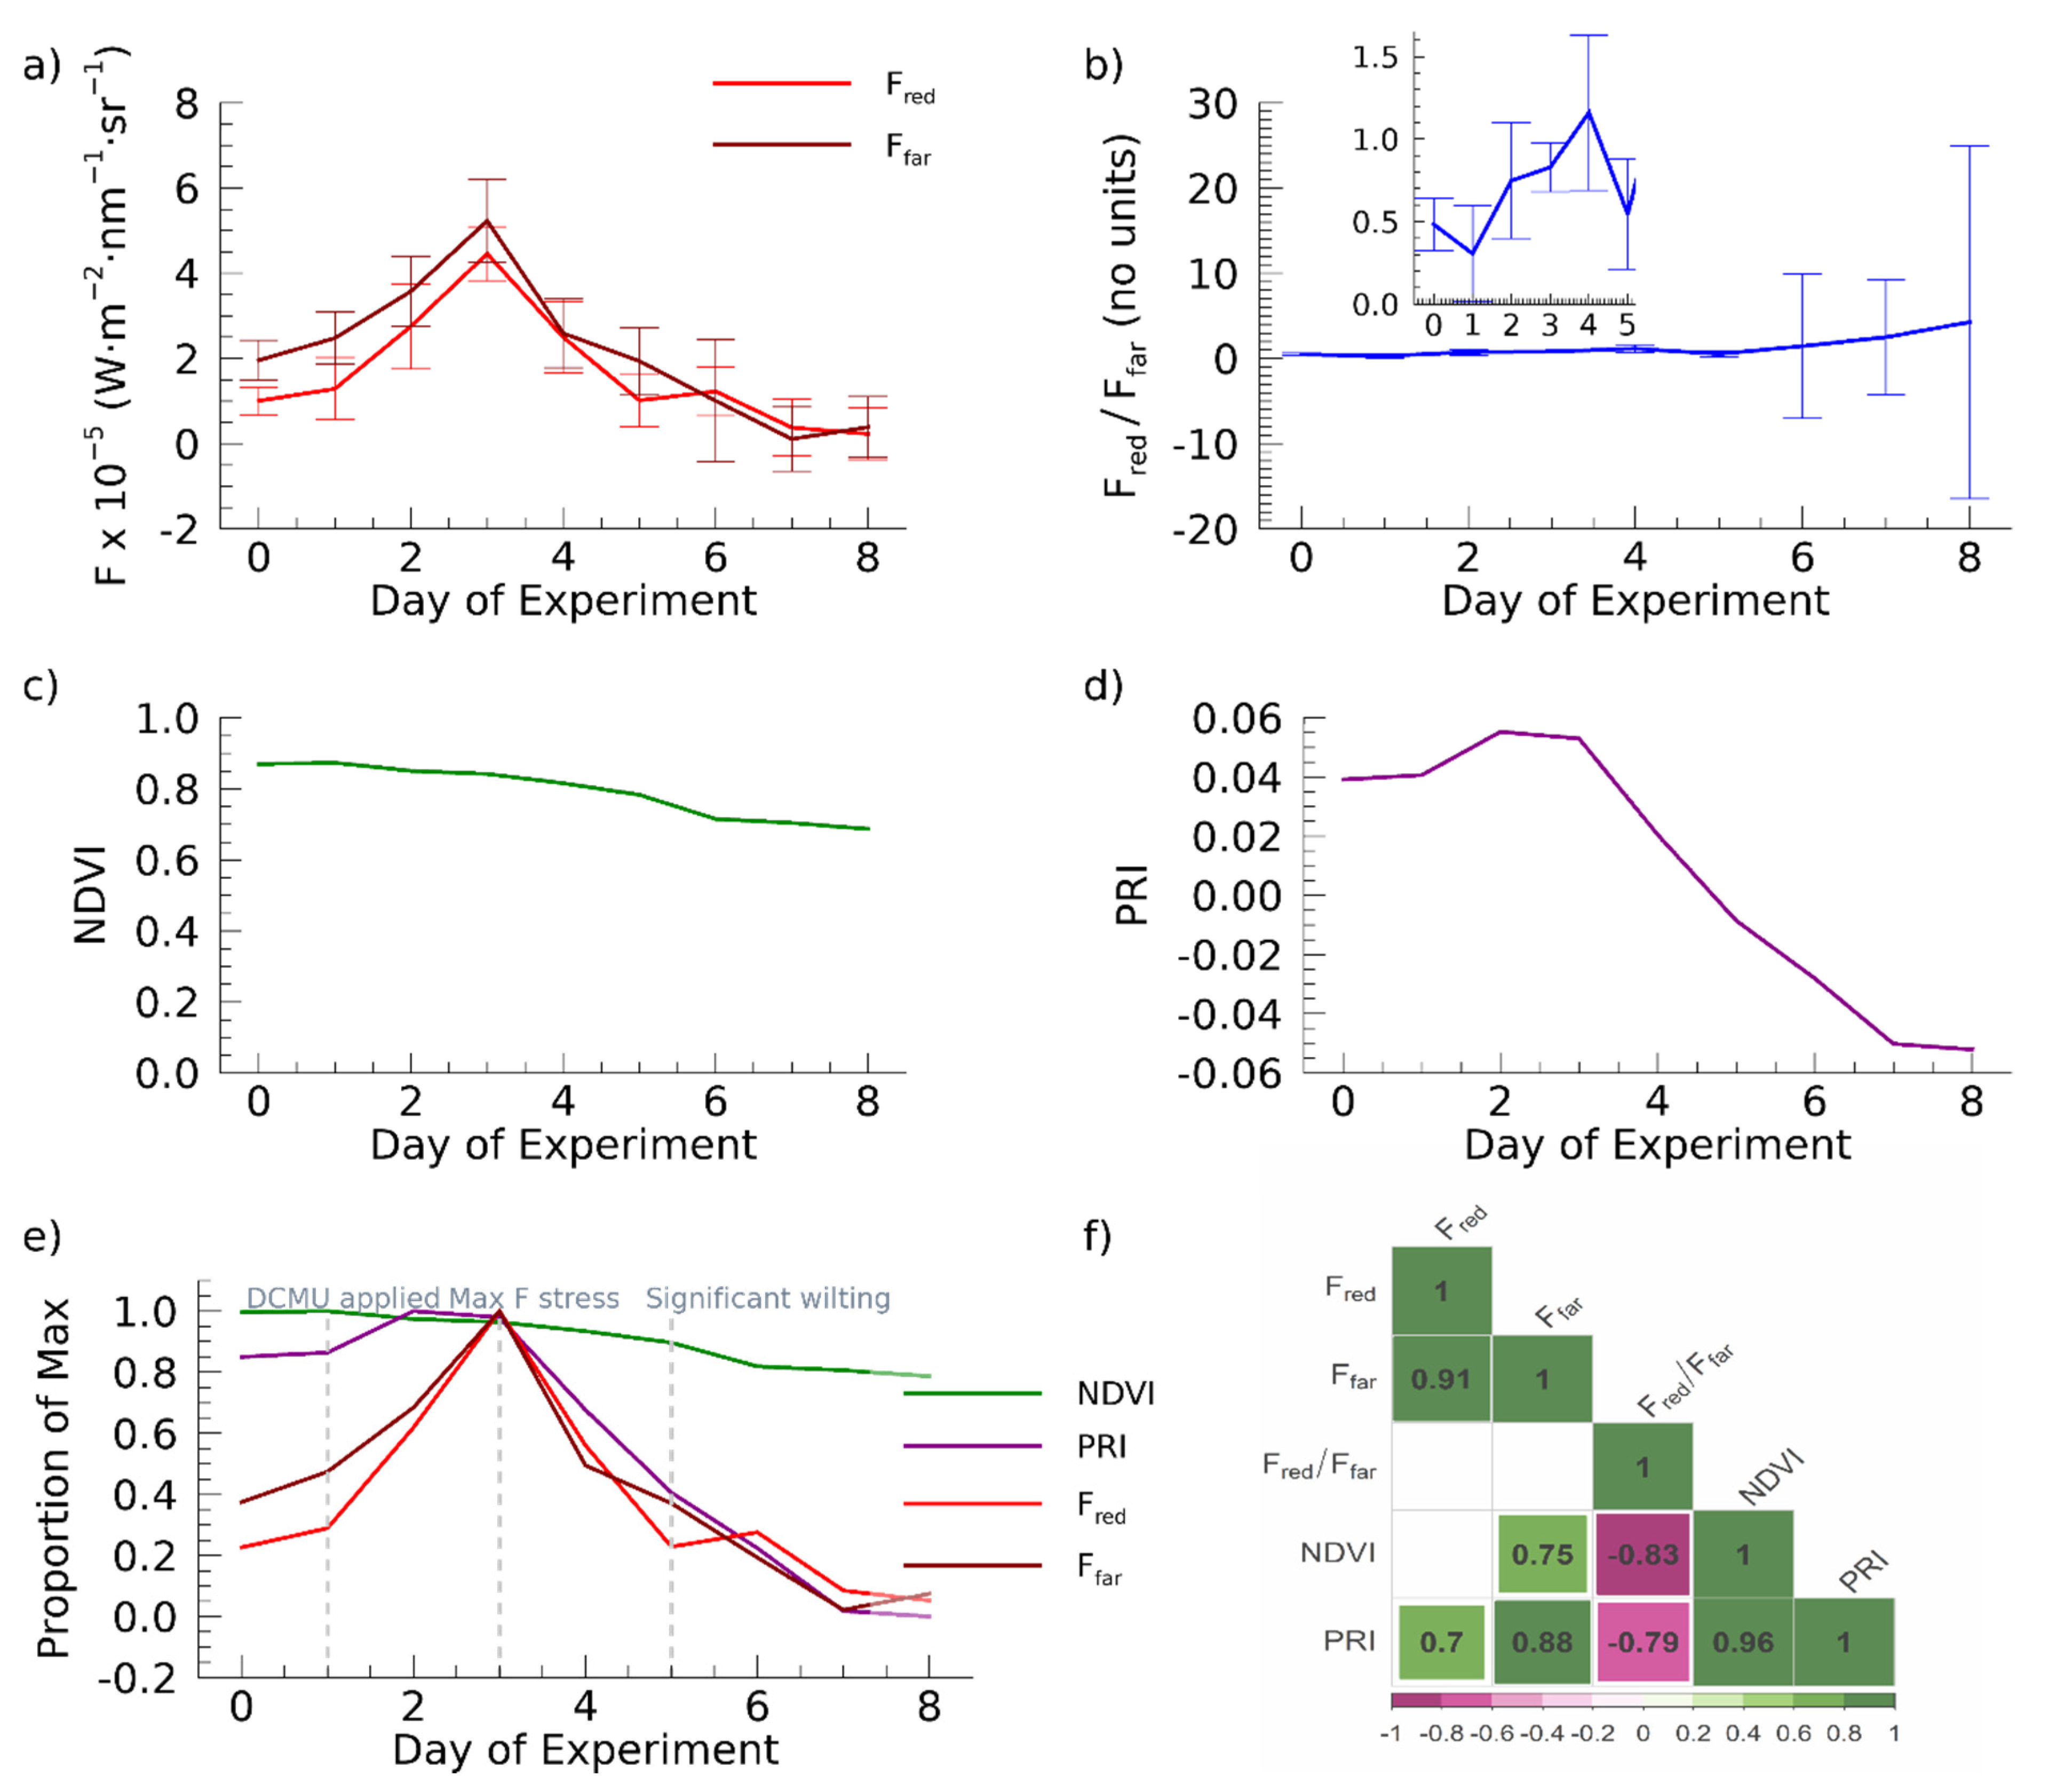
From Day 0–3, Fred and Ffar increase dramatically (333% and 166%, respectively, Figure 3a) going from approximately 0.2 and 0.3 of maximum to 1.0 (maximum values) in this time period, while PRI increased from 0.8 of maximum to 1.0, an increase of 35%, only subtly capturing photosynthetic response (Figure 3d,e). On Days 3–5, Fred and Ffar decline close to Day 2 levels (183% and 32% of Day 0 values, respectively) reaching approximately 0.2 and 0.3 of maximum (Figure 3a,e) and PRI performs more similarly going from maximum (reached on Day 2) to 0.4 of maximum, indicating the pigment changes occurring in the plant leaves. Day 5 and beyond Fred and Ffar are below the Day 0 values for Fred and Ffar, reaching values on Day 8 of 84% and 80% decrease from Day 0, while PRI reaches a value of −0.05 by Day 8 capturing pigment changes and structural changes ion with structural changes in the plant, e.g., [1,13] (Figure 3d,e).
Fred/Ffar increases to a maximum value of 1.2 on Day 4, when Fred surpasses the value of Ffar, then declines (Figure 3b inset shows Day 0–Day 5 detail) which highlights the capability of the instrument to record CF signals that increase when PSII is initially blocked and excess energy dissipation as CF increases, capturing initial stress reactions. The Fred/Ffar (Figure 3b) shows variability so large after Day 5 (due to increasingly low values of Fred and Ffar compared to instrument noise) that the trend over the first five days is obscured by the scale of the graph. The decrease in signal for the Ffar region of the spectrum results in dramatic increase in noise and extreme variability in Fred/Ffar on Days 6–8.
In contrast, NDVI decreases throughout the experiment from approximately 0.87 to 0.69 at an average of 0.03 per day (a total decrease of only 21%, and approximately 0.8 of maximum value) and does not capture dynamic changes during photosystem inhibition and does not show a response to the DCMU poisoning of the plant prior to visible signs of stress on the plant on Day 4 (Figure 3c,e). Additionally, the value of 0.67 for NDVI at the end of the experiment indicates NDVI does not fully capture the reduced functioning of the plant (Figure 3c).
A comparison of the daily NDVI, PRI, Fred, and Ffar using the proportion of maximum of each (Figure 3e) highlights the relative degree to which these metrics capture changes in the response of the plants to stress. In this manner we show the large changes in PRI, Fred, and Ffar as compared to the change in NDVI. Figure 3e also illustrates the difference in timing of the maximum values, which is the beginning of the experiment for NDVI, Day 2 for PRI, and Day 3 for Fred and Ffar, further supporting that NDVI does not respond clearly to the initial stress, PRI has a potential moderate response, but Fred and Ffar capture both the increase in dissipated energy during the subsequent onset of stress and the decline in function. Pearson correlations (r values) among the metrics are shown in Figure 3f for comparison, especially between the CF metrics and RIs (NDVI and PRI). No significant correlation exists between Fred and NDVI, Fred and Fred/Ffar, as well as Ffar and Fred/Ffar. However, a positive relationship exists between PRI and Ffar (r = 0.88, p < 0.01) for PRI and Fred (r = 0.7, p < 0.05) as well as for NDVI and Ffar (r = 0.75, p < 0.05). The Fred/Ffar is negatively correlated with both NDVI (r = −0.83, p < 0.01) and PRI (r = −0.79, p < 0.05). Fred and Ffar are highly positively correlated and are likely autocorrelated which mathematically explains the lack of relationship to their ratio (Fred/Ffar). PRI and NDVI are also strongly positively correlated (r = 0.96, p < 0.01).

4. Discussion

An overarching goal of this study was to confirm that CF at canopy level could be detected and monitored with a relatively straightforward measurement technique. The general expectation that the increase in CF emission that would coincide with photosystem inhibition would manifest in an increase in the far-red peak of the spectra was confirmed. While individual measurements were too noisy to discriminate half-hourly or hourly decreases in plant function, likely due to the combination of an uncalibrated illumination source (LED) and dynamic and complex response of fluorescence, it was found that smoothed signals on a daily basis yielded CF information that could be used for daily plant function information, especially for indication of stress. Based on the results, CF measurements with this technique promise to evaluate more precisely the function and the stress than NDVI and PRI, which are both reflectance-based indices (RI). CF spectra and CF metrics, especially Fred and Ffar, capture the initial photosynthesis stress response and the decline of plant function to a greater degree than PRI and NDVI highlighting the capability of CF to better monitor dynamics of plant status.
Because CF originates from photosynthetic machinery of plants, it was anticipated that if distinct CF signals were captured and distinguishable, the CF spectra and CF metrics would detect stress earlier and be more sensitive in monitoring it than RIs. NDVI is the most used vegetation index and is often referred to as a “greenness index” due to its widespread use to track large scale seasonality. NDVI is calculated from reflectance in the red and near-infrared portion of the spectrum, is sensitive to changes in biomass and leaf area index (LAI), is a good indicator of absorbed photosynthetically active radiation (APAR) of a canopy and mainly captures structural changes (biomass and LAI) seasonally [1,13,55]. However, the structural changes in the target plant lagged behind the functional response, i.e., conversion of short wavelength energy from the PAR range to longer wavelength emission byproduct of the photosystem in the CF range.
PRI is significantly positively correlated with both Fred and Ffar, while NDVI is only significantly correlated with Ffar. While NDVI and PRI can explain a good deal of variation in CF, RI sensitivity to plant function is lower than measurements of CF. PRI is also an RI, but unlike NDVI, has been shown to detect changes in photosynthetic activity on two timescales: (1) diurnally capturing responses of the xanthophyll cycle to changing illumination and (2) pH of thylakoid lumen and seasonally capturing changes in the chlorophyll-carotenoid ratios, i.e., pigment content of leaves. PRI has also been shown to correlate with light-use efficiency (LUE) of some vegetation [1,13,56,57,58,59]. In this experiment, CF response was more sensitive to the plant stress than either NDVI or PRI, but the decline in PRI over the last days of the experiment showed the changes in leaf pigment present were detectible with the PRI and was more sensitive to changes in the canopy than NDVI. This is consistent with several studies showing PRI as a good indicator of plant function, albeit the precise responses are still being studied for temporal and spatial interpretation in some ecosystems, e.g., [13,59].
The comparison of the portions of the CF spectrum, Fred and Ffar, and their ratio, Fred/Ffar, revealed dynamic responses to plant stress and show promise to make distinctions regarding physiology of the target plant. The shape of CF peaks for a plant at room temperature depend on leaf chlorophyll-a concentration, structure, and constituents, and the optical properties of the leaf determine the penetration depth of incident light and remission of CF from these depths [7,21,51,60,61,62,63,64]. As was the case in this investigation, studies show the Fred region suffers from reabsorption of CF photons to a greater degree than the Ffar region, explaining the lower peak of Fred than Ffar, e.g., [3,65]. Additionally, Fred increased at a relatively higher rate than Ffar in response to DCMU poisoning, which was expected from this particular herbicide. DCMU as a photosystem inhibitor most affects PSII; thus, it is expected that the PSII inhibition of photosynthesis would manifest as a dramatic increase in Fred, which is the case in this study [28,62,66]. While there is a PSI and PSII contribution to both Fred and Ffar, Fred is produced dominantly by PSII and is more variable compared to Ffar. Furthermore, in healthy leaves, Fred is close to or less than Ffar, but in stressed leaves, Fred increases and Ffar decreases [5,60,67]. It is for the reasons mentioned that the red peak (Fred) and far-red peak (Ffar) and the red-far-red ratio (Fred/Ffar) are metrics that have been utilized to detect stressed vegetation and estimate plant functioning status, and all three were indicative of changing function of the target plant in this experiment [53,62,68,69,70].
In this study, we demonstrate that a system using the HH2 and blue-red LED grow lamp to detect and monitor measure plant canopy level function, especially in the context of stress, has potential in a variety of applications. The capability to capture distinct signals of plant canopy stress earlier than traditional reflectance-based indices, NDVI and PRI, plus the capability to scale from small to larger canopies holds promise for both research and applications in the lab or field, at night for instance. Recently, two larger scale studies have employed LEDs with spectroscopy at night to study fluorescence responses, one in a forested area examined steady state responses of canopy and understory in a scots pine forest [71] and another used tractor mounted spectrometer and LEDs to measure fluorescence and compare to aerial net primary production among varieties of soybean, both rainfed and irrigated [72]. In the study of soybeans, the authors also show that the Fred/Ffar revealed differences in plant function among cultivars, while traditional RI’s did not. Our results support findings in these studies, albeit on a smaller scale, such that might be found in a laboratory or greenhouse. Taken together, the results of this study show the potential of the HH2 sensor to provide robust plant function information with this technique.

5. Conclusions

This work presents a process to measure CF using relatively straightforward methods and interpretation compared to other approaches aiming to capture fluorescence responses. Additionally, the technique can be applied to a single plant or larger canopies using LED, in dark conditions. The ability to collect data at leaf, plant, and canopy levels reliably and scale between these levels effectively with measurable uncertainties could also be applied, for instance, using manned or unmanned vehicles in agricultural or military applications. This scaling cannot be accomplished as easily or at all with other photosynthesis measurement techniques, such as pulse amplitude modulated fluorimetry (PAM). These procedures can be effectively employed as-is or with modifications in vegetation research and applications in multiple ways. For instance, plant function on multiple timescales could be further investigated by employing calibration for LEDs and examining timescales where signals would be statistically significantly different. In addition, CF measurements with our technique could be used in conjunction with PRI and NDVI measurements to inform plant studies along multiple timescales, i.e., CF is sensitive on the finer scale to track photosynthetic function and PRI on longer timescales to inform changes in leaf pigment, and add NDVI for seasonal structure changes. Therefore, the HH2 and LED system presented has broad appeal to multiple vegetation research areas.

Author Contributions

Conceptualization, T.M.; methodology, T.M., R.B., M.L.S.P.J. and J.R.; data curation and analysis T.M., R.B., J.R. and S.P.; writing—original draft preparation, T.M.; writing—review and editing, T.M., R.B., S.P., M.L.S.P.J. and J.R. All authors have read and agreed to the published version of the manuscript.

Funding

This work was supported by the Goetz Instrument Loan Program (2015) through ASD (Analytical Spectral Devices), as well as a partnership between the São Paulo Research Foundation (Fundação de Amparo A Pesquisa do Estado de São Paulo, FAPESP), Vanderbilt University, Nashville, TN, USA and Universidade Estadual Paulista (UNESP), Rio Claro, Brazil (FAPESP #2013/50421-2 and 20599-00-5).

Institutional Review Board Statement

Not applicable.

Informed Consent Statement

Not applicable.

Data Availability Statement

All data and code are freely available. Location and access provided upon request to the primary author.

Conflicts of Interest

The authors declare no conflict of interest.

Appendix A

Daily fluorescence spectra, images and visual descriptions of experiment.
Figure A1. Daily average smoothed fluorescence and photographs of target tomato plant for all days of experiment (Days 0 to 8 spectra and photographs labelled (ai), respectively).
Sensors 22 03411 g0a1

References

  1. Campbell, P.K.E.; Huemmrich, K.F.; Middleton, E.M.; Ward, L.A.; Julitta, T.; Daughtry, C.S.T.; Burkart, A.; Russ, A.L.; Kustas, W.P. Diurnal and Seasonal Variations in Chlorophyll Fluorescence Associated with Photosynthesis at Leaf and Canopy Scales. Remote Sens. 2019, 11, 488. [Google Scholar] [CrossRef] [Green Version]
  2. Meroni, M.; Picchi, V.; Rossini, M.; Cogliati, S.; Panigada, C.; Nali, C.; Lorenzini, G.; Colombo, R. Leaf level early assessment of ozone injuries by passive fluorescence and photochemical reflectance index. Int. J. Remote Sens. 2008, 29, 5409–5422. [Google Scholar] [CrossRef]
  3. Meroni, M.; Rossini, M.; Picchi, V.; Panigada, C.; Cogliati, S.; Nali, C.; Colombo, R. Assessing Steady-state Fluorescence and PRI from Hyperspectral Proximal Sensing as Early Indicators of Plant Stress: The Case of Ozone Exposure. Sensors 2008, 8, 1740–1754. [Google Scholar] [CrossRef] [PubMed] [Green Version]
  4. Baker, N.R. Chlorophyll fluorescence: A probe of photosynthesis in vivo. Annu. Rev. Plant Biol. 2008, 59, 89–113. [Google Scholar] [CrossRef] [PubMed] [Green Version]
  5. Genty, B.; Briantais, J.-M.; Baker, N.R. The relationship between the quantum yield of photosynthetic electron transport and quenching of chlorophyll fluorescence. Biochim. Biophys. Acta 1989, 990, 87–92. [Google Scholar] [CrossRef]
  6. Gitelson, A.A.; Gritz, Y.; Merzlyak, M.N. Relationships between leaf chlorophyll content and spectral reflectance and algorithms for non-destructive chlorophyll assessment in higher plant leaves. J. Plant Physiol. 2003, 160, 271–282. [Google Scholar] [CrossRef]
  7. Porcar-Castell, A.; Tyystjärvi, E.; Atherton, J.; van der Tol, C.; Flexas, J.; Pfündel, E.E.; Moreno, J.; Frankenberg, C.; Berry, J.A. Linking chlorophyll a fluorescence to photosynthesis for remote sensing applications: Mechanisms and challenges. J. Exp. Bot. 2014, 65, 4065–4095. [Google Scholar] [CrossRef]
  8. Hao, D.; Asrar, G.R.; Zeng, Y.; Yang, X.; Li, X.; Xiao, J.; Guan, K.; Wen, J.; Xiao, Q.; Berry, J.A.; et al. Potential of hotspot solar-induced chlorophyll fluorescence for better tracking terrestrial photosynthesis. Glob. Chang. Biol. 2021, 27, 2144–2158. [Google Scholar] [CrossRef]
  9. Dechant, B.; Ryu, Y.; Badgley, G.; Zeng, Y.; Berry, J.A.; Zhang, Y.; Goulas, Y.; Li, Z.; Zhang, Q.; Kang, M.; et al. Canopy structure explains the relationship between photosynthesis and sun-induced chlorophyll fluorescence in crops. Remote Sens. Environ. 2020, 241, 111733. [Google Scholar] [CrossRef] [Green Version]
  10. Maguire, A.J.; Eitel, J.U.H.; Griffin, K.L.; Magney, T.S.; Long, R.A.; Vierling, L.A.; Schmiege, S.C.; Jennewein, J.S.; Weygint, W.A.; Boelman, N.T.; et al. On the Functional Relationship Between Fluorescence and Photochemical Yields in Complex Evergreen Needleleaf Canopies. Geophys. Res. Lett. 2020, 47, e2020GL087858. [Google Scholar] [CrossRef]
  11. Li, X.; Xiao, J.; He, B.; Arain, M.A.; Beringer, J.; Desai, A.R.; Emmel, C.; Hollinger, D.Y.; Krasnova, A.; Mammarella, I.; et al. Solar-induced chlorophyll fluorescence is strongly correlated with terrestrial photosynthesis for a wide variety of biomes: First global analysis based on OCO-2 and flux tower observations. Glob. Chang. Biol. 2018, 24, 3990–4008. [Google Scholar] [CrossRef] [PubMed]
  12. Magney, T.; Frankenberg, C.; Fisher, J.B.; Sun, Y.; North, G.B.; Davis, T.S.; Kornfeld, A.; Siebke, K. Connecting active to passive fluorescence with photosynthesis: A method for evaluating remote sensing measurements of Chl fluorescence. New Phytol. 2017, 215, 1594–1608. [Google Scholar] [CrossRef] [PubMed] [Green Version]
  13. Springer, K.R.; Wang, R.; Gamon, J.A. Parallel Seasonal Patterns of Photosynthesis, Fluorescence, and Reflectance Indices in Boreal Trees. Remote Sens. 2017, 9, 691. [Google Scholar] [CrossRef] [Green Version]
  14. Wagle, P.; Zhang, Y.; Jin, C.; Xiao, X. Comparison of solar-induced chlorophyll fluorescence, light-use efficiency, and process-based GPP models in maize. Ecol. Appl. 2016, 26, 1211–1222. [Google Scholar] [CrossRef] [PubMed] [Green Version]
  15. Raji, S.N.; Aparna, G.N.; Mohanan, C.N.; Subhash, N. Proximal Remote Sensing of Herbicide and Drought Stress in Field Grown Colocasia and Sweet Potato Plants by Sunlight-Induced Chlorophyll Fluorescence Imaging. J. Indian Soc. Remote Sens. 2016, 45, 463–475. [Google Scholar] [CrossRef]
  16. Cendrero-Mateo, M.P.; Moran, M.S.; Papuga, S.; Thorp, K.; Alonso, L.; Moreno, J.; Ponce-Campos, G.; Rascher, U.; Wang, G. Plant chlorophyll fluorescence: Active and passive measurements at canopy and leaf scales with different nitrogen treatments. J. Exp. Bot. 2015, 67, 275–286. [Google Scholar] [CrossRef] [PubMed] [Green Version]
  17. Julitta, T. Optical proximal sensing for vegetation monitoring, in Department of Earth and Environmental Sciences. Ph.D. Thesis, University of Milano-Bicocca, Milan, Italy, 2015; p. 136. [Google Scholar]
  18. Guanter, L.; Zhang, Y.; Jung, M.; Joiner, J.; Voigt, M.; Berry, J.A.; Frankenberg, C.; Huete, A.R.; Zarco-Tejada, P.; Lee, J.-E.; et al. Global and time-resolved monitoring of crop photosynthesis with chlorophyll fluorescence. Proc. Natl. Acad. Sci. USA 2014, 111, E1327–E1333. [Google Scholar] [CrossRef] [Green Version]
  19. Zarco-Tejada, P.; Catalina, A.; González, M.; Martín, P. Relationships between net photosynthesis and steady-state chlorophyll fluorescence retrieved from airborne hyperspectral imagery. Remote Sens. Environ. 2013, 136, 247–258. [Google Scholar] [CrossRef] [Green Version]
  20. Zarco-Tejada, P.; González-Dugo, V.; Berni, J. A. Fluorescence, temperature and narrow-band indices acquired from a UAV platform for water stress detection using a micro-hyperspectral imager and a thermal camera. Remote Sens. Environ. 2012, 117, 322–337. [Google Scholar] [CrossRef]
  21. Lichtenthaler, H.K.; Miehé, J.A. Fluorescence imaging as a diagnostic tool for plant stress. Trends Plant Sci. 1997, 2, 316–320. [Google Scholar] [CrossRef]
  22. Moya, G.G.; Goulas, Y. Remotely sensed blue and red fluorescence emission for monitoring vegetation. ISPRS J. Photogramm. Remote Sens. 1992, 47, 27. [Google Scholar] [CrossRef]
  23. Krause, G.H.; Weis, E. Chlorophyll fluorescence as a tool in plant physiology. Photosynth. Res. 1984, 5, 139–157. [Google Scholar] [CrossRef] [PubMed]
  24. da Silva Junior, C.A.; Teodoro, P.E.; Delgado, R.C.; Teodoro, L.P.R.; Lima, M.; de Andréa Pantaleão, A.; Baio, F.H.R.; De Azevedo, G.B.; de Oliveira Sousa Azevedo, G.T.; Capristo-Silva, G.F.; et al. Persistent fire foci in all biomes undermine the Paris Agreement in Brazil. Sci. Rep. 2020, 10, 16246. [Google Scholar] [CrossRef] [PubMed]
  25. Chen, X.; Mo, X.; Hu, S.; Liu, S. Relationship between fluorescence yield and photochemical yield under water stress and intermediate light conditions. J. Exp. Bot. 2018, 70, 301–313. [Google Scholar] [CrossRef]
  26. Flexas, J.; Escalona, J.M.; Evain, S.; Gulías, J.; Moya, I.; Osmond, C.B.; Medrano, H. Steady-state chlorophyll fluorescence (Fs) measurements as a tool to follow variations of net CO2 assimilation and stomatal conductance during water-stress in C3 plants. Physiol. Plant. 2002, 114, 231–240. [Google Scholar] [CrossRef] [Green Version]
  27. Fabrice Franck, P.J.; Popovic, R. Resolution of the Photosystem I and Photosystem II contributions to chlorophyll fluorescence of intact leaves at room temperature. Biochim. Biophys. Acta 2002, 1556, 239–246. [Google Scholar] [CrossRef] [Green Version]
  28. Meroni, M.; Rossini, M.; Guanter, L.; Alonso, L.; Rascher, U.; Colombo, R.; Moreno, J. Remote sensing of solar-induced chlorophyll fluorescence: Review of methods and applications. Remote Sens. Environ. 2009, 113, 2037–2051. [Google Scholar] [CrossRef]
  29. Malenovský, Z.; Mishra, K.B.; Zemek, F.; Rascher, U.; Nedbal, L. Scientific and technical challenges in remote sensing of plant canopy reflectance and fluorescence. J. Exp. Bot. 2009, 60, 2987–3004. [Google Scholar] [CrossRef] [Green Version]
  30. Maxwell, K.; Johnson, G.N. Chlorophyll Fluorescence-a practical guide. J. Exp. Bot. 2000, 51, 659–668. [Google Scholar] [CrossRef]
  31. Krause, G.H.; Weis, E. Chlorophyll fluorescence and photosynthesis:The Basics. Ann. Rev. Plant Physiol. Plant Mol. Biol. 1991, 42, 313–349. [Google Scholar] [CrossRef]
  32. Schreiber, U.; Groberman, L.; Vidaver, W. Portable, solid-state fluorometer for the measurement of chlorophyll fluorescence induction in plants. Rev. Sci. Instrum. 1975, 46, 538–542. [Google Scholar] [CrossRef]
  33. Dąbrowski, P.; Baczewska-Dąbrowska, A.H.; Bussotti, F.; Pollastrini, M.; Piekut, K.; Kowalik, W.; Wróbel, J.; Kalaji, H.M. Photosynthetic efficiency of Microcystis ssp. under salt stress. Environ. Exp. Bot. 2021, 186, 104459. [Google Scholar] [CrossRef]
  34. Pogrzeba, M.; Rusinowski, S.; Sitko, K.; Krzyżak, J.; Skalska, A.; Małkowski, E.; Ciszek, D.; Werle, S.; Mccalmont, J.; Mos, M.; et al. Relationships between soil parameters and physiological status of Miscanthus x giganteus cultivated on soil contaminated with trace elements under NPK fertilisation vs. microbial inoculation. Environ. Pollut. 2017, 225, 163–174. [Google Scholar] [CrossRef] [PubMed]
  35. Kalaji, H.M.; Schansker, G.; Ladle, R.J.; Goltsev, V.; Bosa, K.; Allakhverdiev, S.I.; Brestic, M.; Bussotti, F.; Calatayud, A.; Dąbrowski, P.; et al. Frequently asked questions about in vivo chlorophyll fluorescence: Practical issues. Photosynth. Res. 2014, 122, 121–158. [Google Scholar] [CrossRef] [PubMed] [Green Version]
  36. Damm, A.; Elbers, J.; Erler, A.; Gioli, B.; Hamdi, K.; Hutjes, R.; Kosvancova, M.; Meroni, M.; Miglietta, F.; Moersch, A.; et al. Remote sensing of sun-induced fluorescence to improve modeling of diurnal courses of gross primary production (GPP). Glob. Chang. Biol. 2010, 16, 171–186. [Google Scholar] [CrossRef]
  37. Guanter, L.; Alonso, L.; Gómez-Chova, L.; Amorós-López, J.; Vila, J.; Moreno, J. Estimation of solar-induced vegetation fluorescence from space measurements. Geophys. Res. Lett. 2007, 34. [Google Scholar] [CrossRef]
  38. Govindjee. Chlorophyll a fluorescence: A bit of basics and history. In Chlorophyll a Fluorescence: A Signature of Photosynthesis; Papageorgiou, G.C., Ed.; Springer: Dordrecht, The Netherlands, 2004; pp. 1–42. [Google Scholar]
  39. Zarco-Tejada, P.J.; Miller, J.R.; Mohammed, G.H.; Noland, T.L.; Sampson, P.H. Estimation of chlorophyll fluorescence under natural illumination from hyperspectral data. Int. J. Appl. Earth Obs. Geoinf. 2001, 3, 321–327. [Google Scholar] [CrossRef] [Green Version]
  40. Stefan Maier, K.P.G. Sun-Induced Fluorescence—A New Tool for Precision Farming; John Wiley & Sons, Inc.: Hoboken, NJ, USA, 2001. [Google Scholar]
  41. Govindjee Sixty-three years since Kautsky: Chlorophyll a Fluorescence. Aust. J. Plant Physiol. 1995, 22, 131–160.
  42. Alonso, L.; Gómez-Chova, L.; Vila-Frances, J.; Amoros-Lopez, J.; Guanter, L.; Calpe, J.; Moreno, J. Improved Fraunhofer Line Discrimination Method for Vegetation Fluorescence Quantification. IEEE Geosci. Remote Sens. Lett. 2008, 5, 620–624. [Google Scholar] [CrossRef]
  43. Plascyk, J.A. The MK II Fraunhofer Line Discriminator (FLD-II) for Airborne and Orbital Remote Sensing of Solar-Stimulated Luminescense. Opt. Eng. 1975, 14, 144339. [Google Scholar] [CrossRef]
  44. Plascyk, J.A.; Gabriel, F.C. The Fraunhofer Line Discriminator MKII-An Airborne Instrument for Precise and Standardized Ecological Luminescence Measurement. IEEE Trans. Instrum. Meas. 1975, 24, 306–313. [Google Scholar] [CrossRef]
  45. Liu, X.; Liu, L.; Zhang, S.; Zhou, X. New Spectral Fitting Method for Full-Spectrum Solar-Induced Chlorophyll Fluorescence Retrieval Based on Principal Components Analysis. Remote Sens. 2015, 7, 10626–10645. [Google Scholar] [CrossRef] [Green Version]
  46. Meroni, M.; Busetto, L.; Colombo, R.; Guanter, L.; Moreno, J.; Verhoef, W. Performance of Spectral Fitting Methods for vegetation fluorescence quantification. Remote Sens. Environ. 2010, 114, 363–374. [Google Scholar] [CrossRef]
  47. van Leeuwen, M.; Kremens, R.L.; van Aardt, J. Tracking diurnal variation in photosynthetic down-regulation using low cost spectroscopic instrumentation. Sensors 2015, 15, 10616–10630. [Google Scholar] [CrossRef] [Green Version]
  48. Zhang, Y.-J.; Zhao, C.-J.; Liu, L.-Y.; Wang, J.-H.; Wang, R.-C. Chlorophyll Fluorescence Detected Passively by Difference Reflectance Spectra of Wheat (Triticum aestivum L.) Leaf. J. Integr. Plant Biol. 2005, 47, 1228–1235. [Google Scholar] [CrossRef]
  49. Evans, J. The Dependence of Quantum Yield on Wavelength and Growth Irradiance. Funct. Plant Biol. 1987, 14, 69–79. [Google Scholar] [CrossRef]
  50. Van Wittenberghe, S.; Alonso, L.; Verrelst, J.; Hermans, I.; Valcke, R.; Veroustraete, F.; Moreno, J.; Samson, R. A field study on solar-induced chlorophyll fluorescence and pigment parameters along a vertical canopy gradient of four tree species in an urban environment. Sci. Total Environ. 2014, 466–467, 185–194. [Google Scholar] [CrossRef]
  51. Rossini, M.; Nedbal, L.; Guanter, L.; Ač, A.; Alonso, L.; Burkart, A.; Cogliati, S.; Colombo, R.; Damm, A.; Drusch, M.; et al. Red and far red Sun-induced chlorophyll fluorescence as a measure of plant photosynthesis. Geophys. Res. Lett. 2015, 42, 1632–1639. [Google Scholar] [CrossRef] [Green Version]
  52. Buschmann, C. Variability and application of the chlorophyll fluorescence emission ratio red/far-red of leaves. Photosynth. Res. 2007, 92, 261–271. [Google Scholar] [CrossRef]
  53. Campbell, P.E.; Middleton, E.; Corp, L.; Kim, M. Contribution of chlorophyll fluorescence to the apparent vegetation reflectance. Sci. Total Environ. 2008, 404, 433–439. [Google Scholar] [CrossRef]
  54. Tucker, C.J. Red and photographic infrared linear combinations for monitoring vegetation. Remote Sens. Environ. 1979, 8, 127–150. [Google Scholar] [CrossRef] [Green Version]
  55. Gamon, J.A.; Peñuelas, J.; Field, C.B. A narrow-waveband spectral index that tracks diurnal changes in photosynthetic efficiency. Remote Sens. Environ. 1992, 41, 35–44. [Google Scholar] [CrossRef]
  56. Gitelson, A.A.; Gamon, J.A.; Solovchenko, A. Multiple drivers of seasonal change in PRI: Implications for photosynthesis 2. Stand level. Remote Sens. Environ. 2017, 190, 198–206. [Google Scholar] [CrossRef] [Green Version]
  57. Gamon, J.A.; Huemmrich, K.F.; Wong, C.Y.S.; Ensminger, I.; Garrity, S.; Hollinger, D.Y.; Noormets, A.; Peñuelas, J. A remotely sensed pigment index reveals photosynthetic phenology in evergreen conifers. Proc. Natl. Acad. Sci. USA 2016, 113, 13087–13092. [Google Scholar] [CrossRef] [Green Version]
  58. Zarco-Tejada, P.J.; Gonzalez-Dugo, V.; Williams, L.E.; Suárez, L.; Berni, J.A.J.; Goldhamer, D.; Fereres, E. A PRI-based water stress index combining structural and chlorophyll effects: Assessment using diurnal narrow-band airborne imagery and the CWSI thermal index. Remote Sens. Environ. 2013, 138, 38–50. [Google Scholar] [CrossRef]
  59. Zarco-Tejada, P.; Morales, A.; Testi, L.; Villalobos, F. Spatio-temporal patterns of chlorophyll fluorescence and physiological and structural indices acquired from hyperspectral imagery as compared with carbon fluxes measured with eddy covariance. Remote Sens. Environ. 2013, 133, 102–115. [Google Scholar] [CrossRef]
  60. Yves Goulas, A.F.; Daumard, F.; Champagne, S.; Ounis, A.; Marloie, O.; Moya, I. Gross Primary Production of a Wheat Canopy Relates Stronger to Far Red Than to Red Solar-Induced Chlorophyll Fluorescence. Remote Sens. 2017, 9, 97. [Google Scholar] [CrossRef] [Green Version]
  61. Wieneke, S.; Ahrends, H.; Damm, A.; Pinto, F.; Stadler, A.; Rossini, M.; Rascher, U. Airborne based spectroscopy of red and far-red sun-induced chlorophyll fluorescence: Implications for improved estimates of gross primary productivity. Remote Sens. Environ. 2016, 184, 654–667. [Google Scholar] [CrossRef] [Green Version]
  62. Rossini, M.; Meroni, M.; Celesti, M.; Cogliati, S.; Julitta, T.; Panigada, C.; Rascher, U.; Van Der Tol, C.; Colombo, R. Analysis of Red and Far-Red Sun-Induced Chlorophyll Fluorescence and Their Ratio in Different Canopies Based on Observed and Modeled Data. Remote Sens. 2016, 8, 412. [Google Scholar] [CrossRef] [Green Version]
  63. Zarco-Tejada, P.J.; Miller, J.R.; Mohammed, G.H.; Noland, T.L.; Sampson, P.H. Vegetation stress detection through chlorophyll a + b estimation and fluorescence effects on hyperspectral imagery. J. Environ. Qual. 2002, 31, 1433–1441. [Google Scholar] [CrossRef]
  64. Zarco-Tejada, P.J.; Miller, J.R.; Mohammed, G.H.; Noland, T.L.; Sampson, P.H. Chlorophyll Fluorescence Effects on Vegetation Apparent Reflectance: I. Leaf-Level Measurements and Model Simulation. Remote Sens. Environ. 2000, 74, 596–608. [Google Scholar] [CrossRef]
  65. Meroni, M.; Colombo, R. Leaf level detection of solar induced chlorophyll fluorescence by means of a subnanometer resolution spectroradiometer. Remote Sens. Environ. 2006, 103, 438–448. [Google Scholar] [CrossRef]
  66. Rossini, M.; Panigada, C.; Cilia, C.; Meroni, M.; Busetto, L.; Cogliati, S.; Amaducci, S.; Colombo, R. Discriminating Irrigated and Rainfed Maize with Diurnal Fluorescence and Canopy Temperature Airborne Maps. ISPRS Int. J. Geo-Inf. 2015, 4, 626–646. [Google Scholar] [CrossRef] [Green Version]
  67. Palombi, L.; Cecchi, G.; Lognoli, D.; Raimondi, V.; Toci, G.; Agati, G. A retrieval algorithm to evaluate the Photosystem I and Photosystem II spectral contributions to leaf chlorophyll fluorescence at physiological temperatures. Photosynth. Res. 2011, 108, 225–239. [Google Scholar] [CrossRef]
  68. Grossmann, K.; Frankenberg, C.; Magney, T.; Hurlock, S.C.; Seibt, U.; Stutz, J. PhotoSpec: A new instrument to measure spatially distributed red and far-red Solar-Induced Chlorophyll Fluorescence. Remote Sens. Environ. 2018, 216, 311–327. [Google Scholar] [CrossRef] [Green Version]
  69. McMurtrey, J.; Middleton, E.; Corp, L.; Campbell, P.; Butcher, L.; Daughtry, C. Optical reflectance and fluorescence for detecting nitrogen needs in Zea mays L. In Proceedings of the 2003 IEEE International Geoscience and Remote Sensing Symposium, Toulouse, France, 21–25 July 2003. [Google Scholar]
  70. Middleton, E.M.; Chappelle, E.W.; Cannon, T.A.; Adamse, P.; Britz, S.J. Initial Assessment of Physiological Response to UV-B Irradiation Using Fluorescence Measurements. J. Plant Physiol. 1996, 148, 69–77. [Google Scholar] [CrossRef]
  71. Atherton, J.; Liu, W.; Porcar-Castell, A. Nocturnal Light Emitting Diode Induced Fluorescence (LEDIF): A new technique to measure the chlorophyll a fluorescence emission spectral distribution of plant canopies in situ. Remote Sens. Environ. 2019, 231, 111137. [Google Scholar] [CrossRef]
  72. Romero, J.M.; Otero, A.; Lagorio, M.G.; Berger, A.G.; Cordon, G.B. Canopy active fluorescence spectrum tracks ANPP changes upon irrigation treatments in soybean crop. Remote Sens. Environ. 2021, 263, 112525. [Google Scholar] [CrossRef]
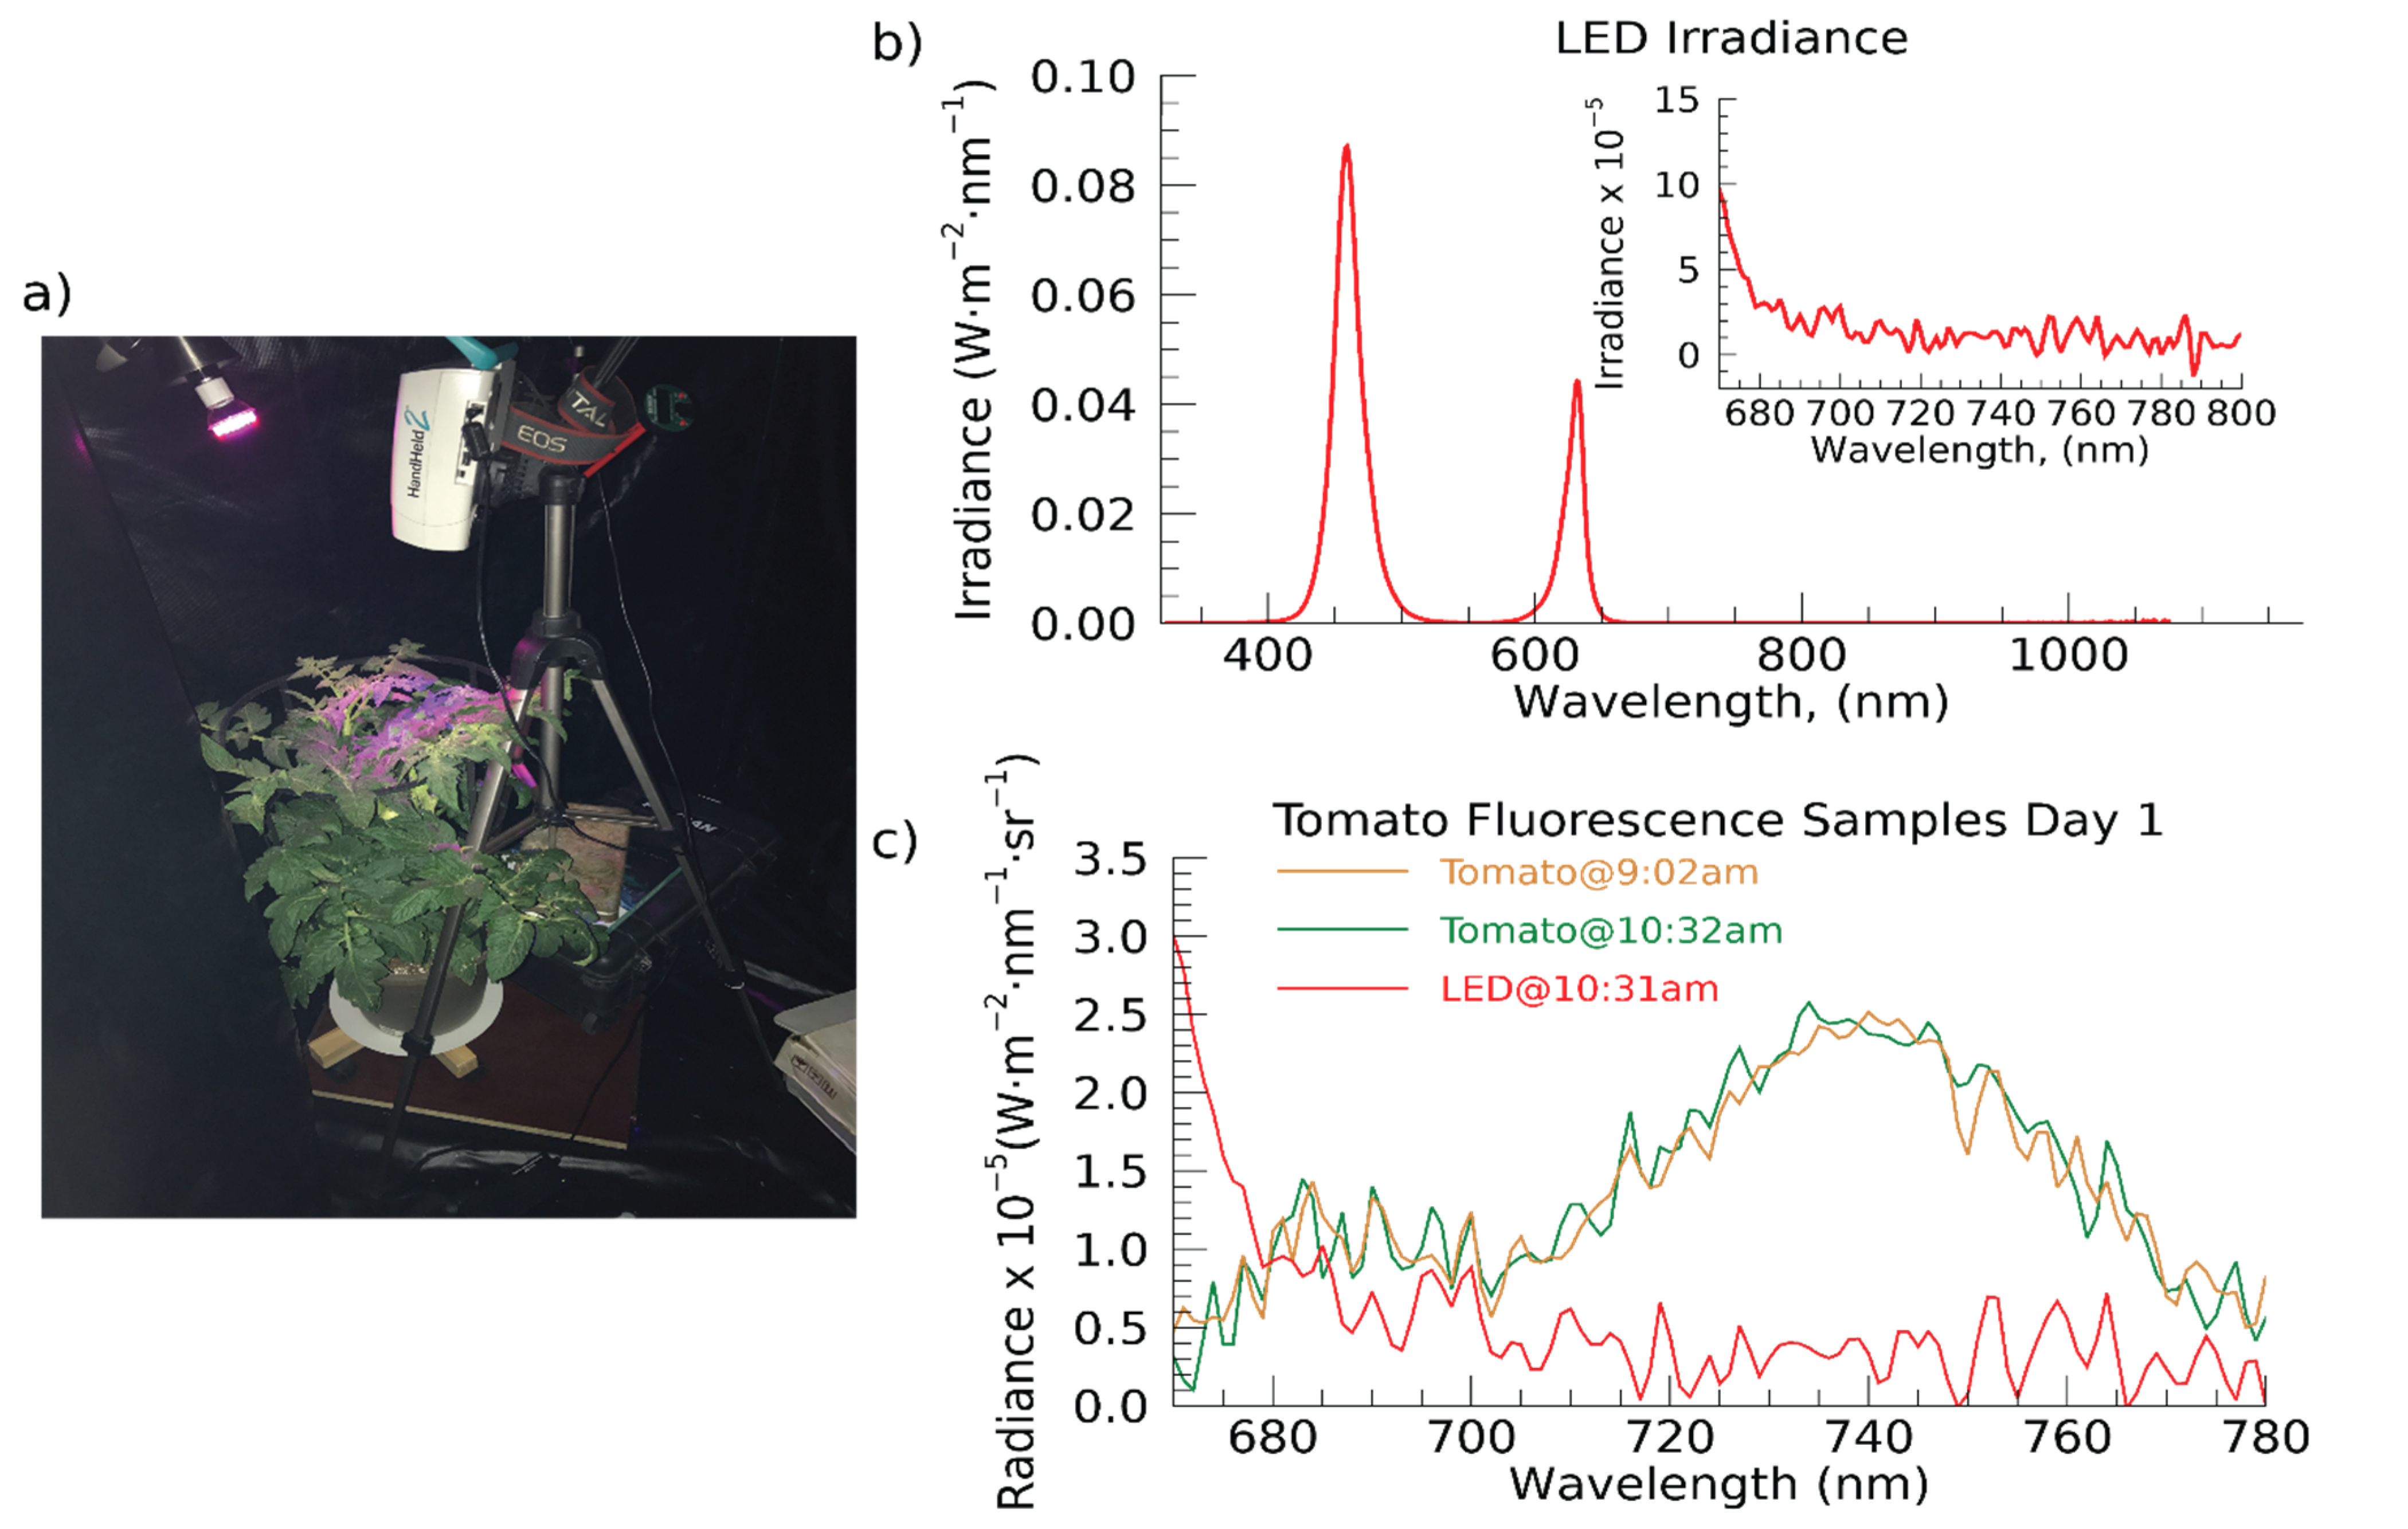
Figure 1. (a) The experimental instrument setup included the handheld ASD/Malvern HandHeld-2 Pro spectroradiometer (Boulder, CO, USA; HH2) and a blue-red LED grow light. A full spectrum lamp is added here for the purposes of a clear photo only. (b) Plot of blue-red light emitting diode grow light (MiracleLED™ 2.2 Watt; LED) spectrum, measured by recording the spectrum of the blue-red LED incident on a Spectralon® white reference panel (Boulder, CO, USA; WR). Inset: zoom in to a portion of the fluorescence range from 670–800 nm. (c) Two sample spectra of the tomato plant within the fluorescence range (approximately 670 nm–780 nm with the spectrum of the WR measurement of the LED for reference.
Sensors 22 03411 g001
Figure 2. CF spectra, images and descriptions of selected days of experiment: (a) Day 0, (b) Day 3, (c) Day 4, (d) Day 8. Left column: Daily average smoothed fluorescence (Fsm), blue lines indicate Fsm spectra, shaded pink region indicates standard deviation for the day. Middle column: photographs of tomato plant each day. Right column: description of visual inspection of plant for each day. Daily fluorescence spectra, pictures and visual descriptions are included in Appendix A.
Sensors 22 03411 g002
Figure 3. Results of plant stress experiments. CF metrics, NDVI and PRI measurement time series for the experiment. (a) Daily mean, Fred and Ffar, (b) Daily mean Fred/Ffar, Inset plot of the first five days of the experiment highlighting the trend of increasing Fred/Ffar, (c) The normalized difference vegetation index (NDVI) taken one time daily for the experiment. (d) The photochemical reflectance index taken one time daily for the experiment (e) Fred, Ffar, NDVI, and PRI plotted as the proportion of maximum over the course of the experiment. (f) Pearson Correlations among the mean values. Only significant correlations (p-values < 0.05) are shown along the lower right half. Blank areas in the lower right half indicate insignificant correlations (p-values > 0.05). Error bars indicate the standard deviation for each day.
Sensors 22 03411 g003
Publisher’s Note: MDPI stays neutral with regard to jurisdictional claims in published maps and institutional affiliations.