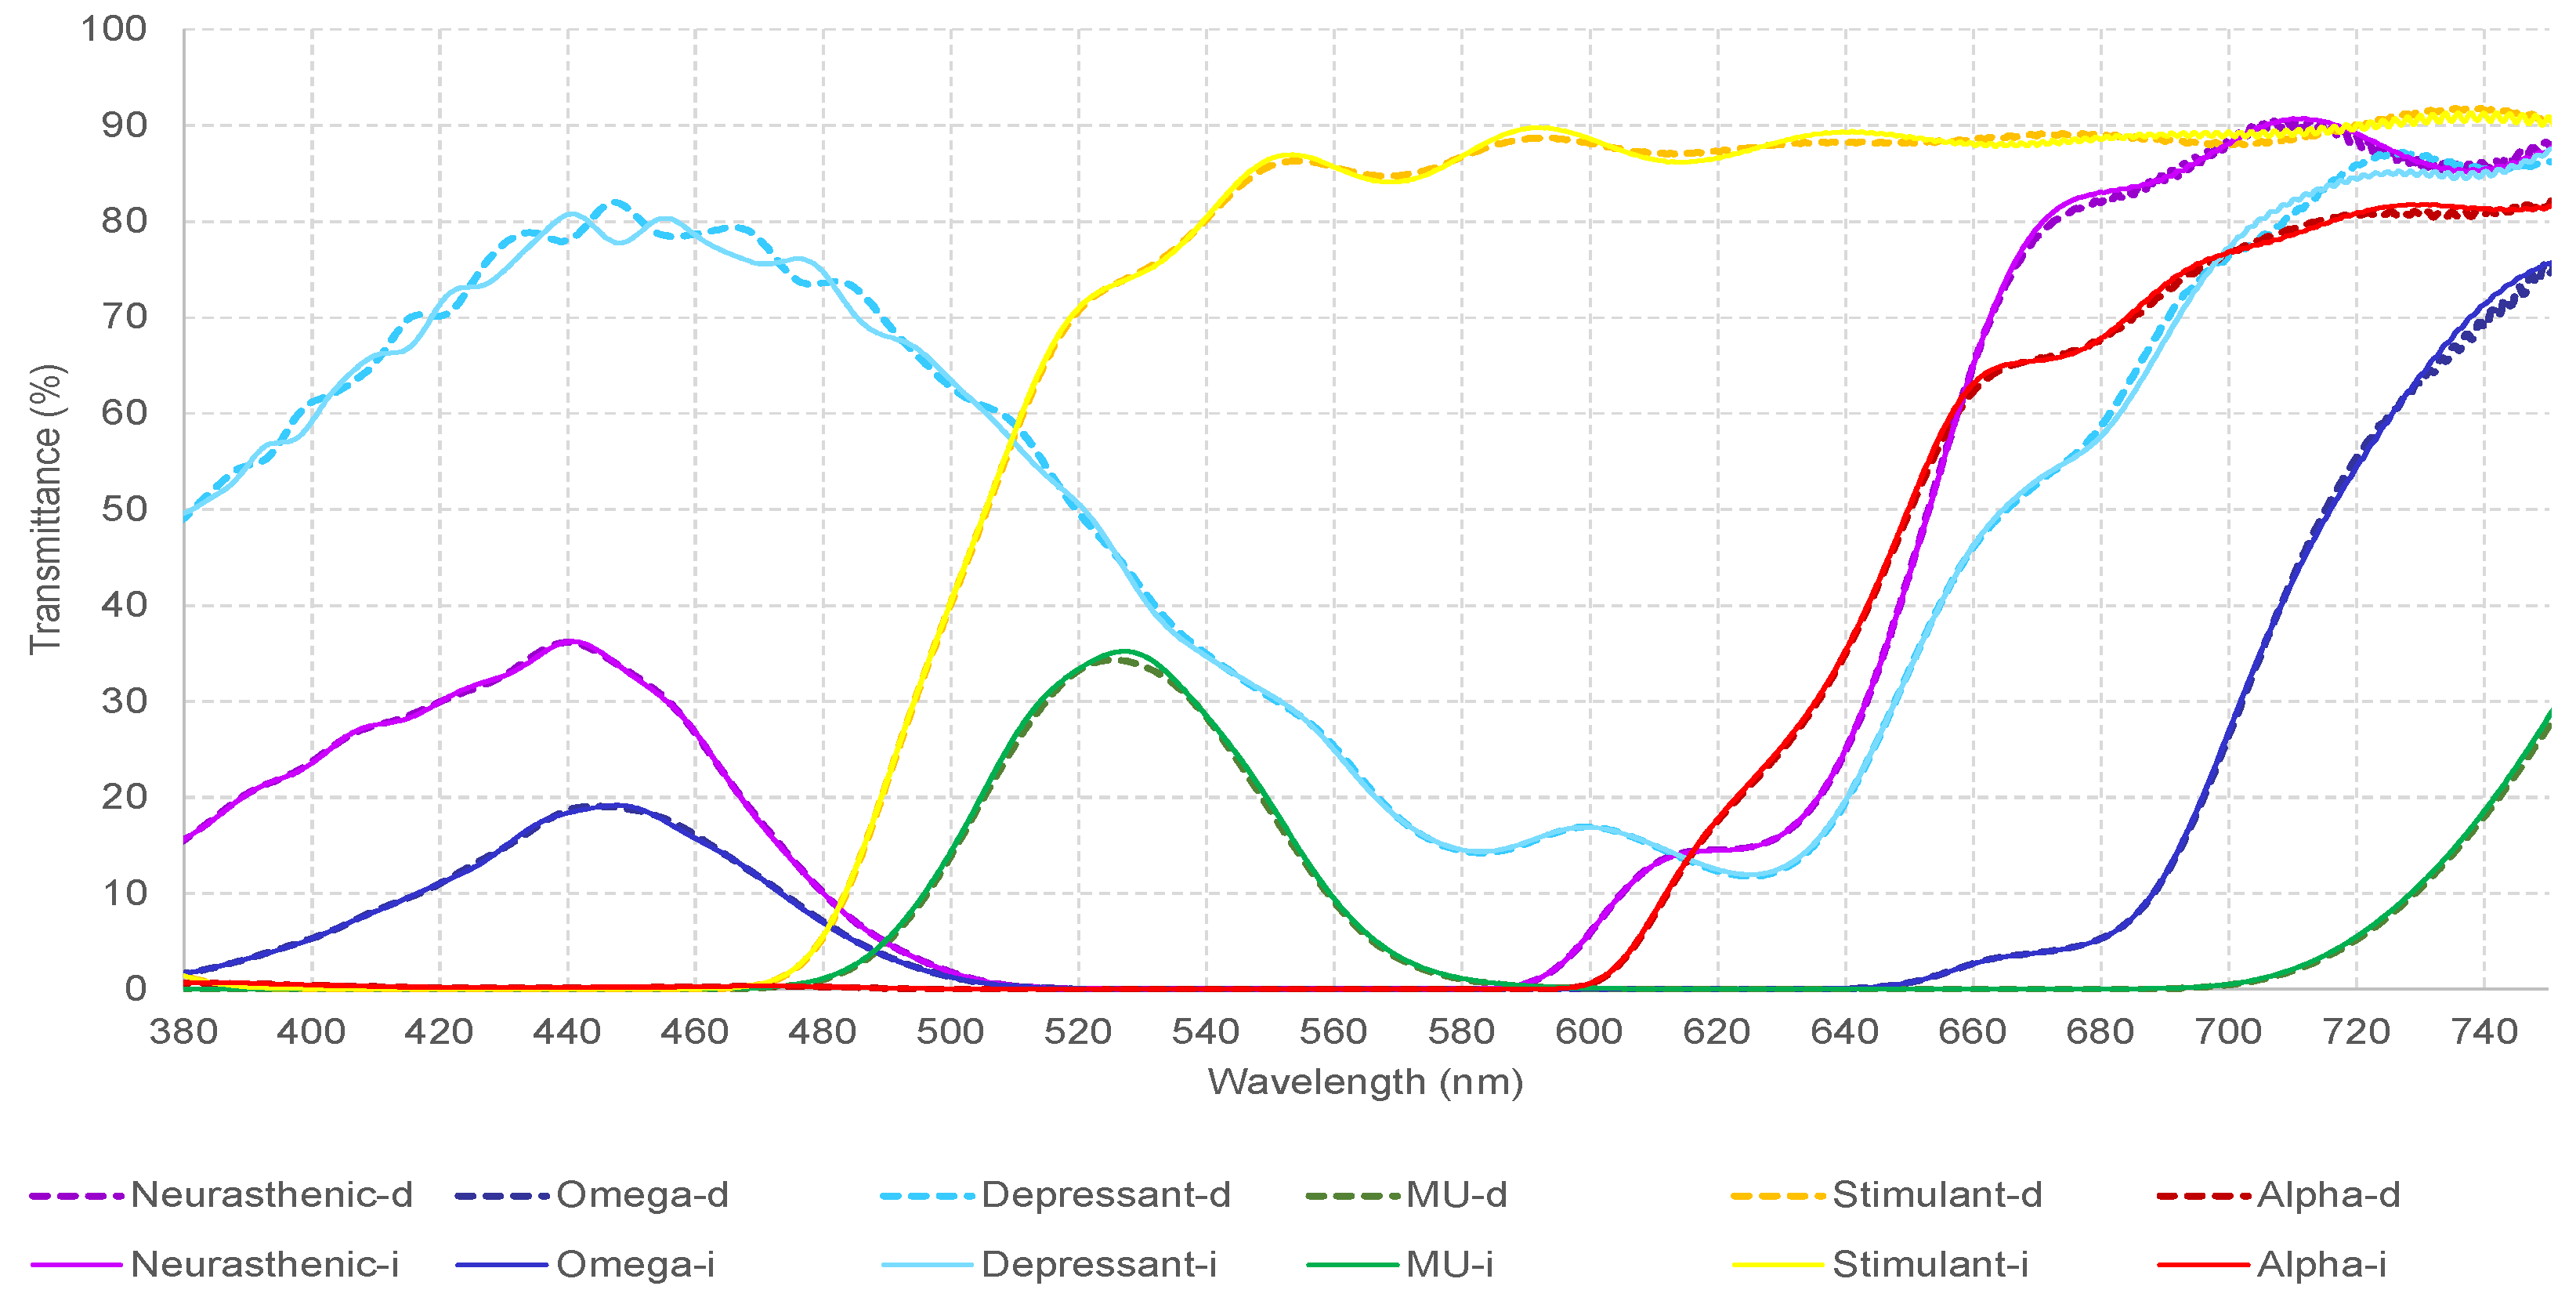
This was an observational non-invasive study which analyzed and compared the VEPs of twelve participants at baseline and under the effect of six different monochromatic filters. Filters were chosen to represent the visible light spectrum, going from red to violet color, 440.5–731 nm, and light transmittance from 19 to 89.17%. Phototherapy, which consists of the combination of these wavelengths, has been empirically used by visual health professionals as a complementary treatment for patients with strabismus, amblyopia, and other visual conditions [
13,
14]. There are no VEP studies in the literature that report the effect of these monochromatic filters which were designed to treat patients with strabismus and amblyopia, on neural activity, to propose posteriorly, successful treatments based on solid scientific evidence. However, what we know from quantitative electroencephalography studies, is that light stimulation and phototherapy which employs a combination of two or more of these wavelengths (mu-alpha, omega-neurasthenic, alpha-omega etc), can modulate the alpha-wave, interhemispheric connections, anteroposterior gradient, and brain coherence [
26,
27]. Likewise, a pilot study on healthy participants showed that functional connectivity patterns on brain networks measured with fMRI, are light-dependent [
28]. Therefore, we expect to see the effect of these monochromatic filters on the visual pathway, which connects the eyes to the cortex and modulates neural activity. Visually-normal participants are essential to understand how a chosen variable can modify their cortical response, to apply it afterwards, to other categories of individuals, such as patients with visual problems. To determine if the gathered data were only specific and unique to visually-normal individuals, two patients with accommodative esotropia were included in this analysis, as it is considered to present less cortical-visual adaptations when compared to other types of strabismus. Research on the VEPs of the amblyopic and fellow eye are reported in the literature [
18,
19], but this is the first time that a study has analyzed the effect of these specific monochromatic filters which have been designed and used to treat patients with visual dysfunctions. Through our research, we aimed to shed light on whether changes in the neural activity are attributable to the specific wavelength, transmittance, or a combination of both. Considering that VEPs measure the functionality and the integrity of the visual pathway, and the visual system is the vector that connects eyes to the brain, knowing how to modulate it can be a powerful tool for visual health professionals. Therefore, by analyzing the effect of each individual filter, to understand the specific potential hidden behind its wavelength and transmittance, successful treatments for patients with visual dysfunctions can be proposed.
The discussion of our results will be conducted in two phases.
In phase one, the VEPs of two patients with accommodative esotropia and two visually-normal participants, at baseline and under the effect of monochromatic filters were analyzed and compared according to their neurophysiological significance, emphasizing the medical aspect. Firstly, we analyzed the neural activation expressed by the N75, P100, VEP amplitude, and LAT DIFF LT-RT. Secondly, we looked for differences and similarities among them, considering that we did not find other electrophysiological data on the effect of monochromatic filters in patients with strabismus and amblyopia. From our analysis, a common pattern among the four participants was found: a decrease in the VEP amplitude of both eyes under the effect of the neurasthenic filter (violet). Likewise, mu (green color) was the filter with the second-highest impact on the axonal activation of the visual pathway, followed by omega (dark blue), alpha (red), depressant (light blue), and stimulant (yellow). While the neurasthenic, mu, and omega filters always cause a decrease in the VEP amplitude value, the depressant and alpha filters can increase or decrease its value. Additionally, a decrease in the VEP amplitude under the effect of monochromatic filters was recorded in 91.7% of the cases compared to its baseline value. Changes greater than 30%, which are considered neurologically important, were found on 58.3% of the recorded data. The VEP amplitude represents the activity of neuronal populations. A larger amplitude means more activated axons, which results in more connections between neurons (synapsis), which in turn defines the neural networks and cortical plasticity [
32]. Neuroplasticity is the variability of the size and type of neuronal networks using long-term potentiation or depression. The process of neuroplasticity allows the remodeling of the brain. As represented by facts, in these four participants, violet-blue-green filters acted like inhibitors, causing depression of neuronal networks [
33]. A global decrease in functional connectivity in most networks was found after a minute of green and blue light exposure through a fMRI study [
28], which leads us to the same conclusion, namely, that these ranges of wavelengths can modify brain networks which are arranged to perform better on tasks associated with specific cognitive demands. An increment on the LAT DIFF LT-RT was observed in 58.3% of the cases, against 37.5% that presented a decrease in its value. Only 4.2% did not show any changes. From the total, 66.7% of the data showed a difference > 2 ms between the left and right eye recording, which is considered abnormal in the field of neurophysiology. Differences of >2 ms between eyes are considered the norm. Higher differences signify that an eye is conducting faster/slower than the other one. Our findings suggest that when including monochromatic filters in the treatment program of SA patients, we could modulate the way eyes transmit visual information to the V1. This signifies that the visual stimulus reaches the 17 Brodmann area at different times, which makes us hypothesize that this could affect the integration of information at cortical level. When analyzing the N75 and P100 latency, a change greater than 30% from the baseline value is considered neurologically significant. An increment was observed in 91.7% of the cases for the N75 of the right eye, against 70.8% for the left eye. A decrease in its value was found in 8.3% of the cases for the right eye, against 29.2% for the left eye. Additionally, 75% of the cases presented an increment in the P100 latency, whereas 25% showed a decrease of it. Despite the increase and decrease in the N75 and P100 latency, changes greater than 30% were only presented in few cases (20.8% for N75 and only 4.2% for P100). In the field of neurophysiology, the latency value represents the transmission speed of the visual stimulus, which means that the generation of an impulse can happen in a shorter or longer time, resulting in a slower or faster visual pathway. Transmission refers to the myelinated state of the axons. The higher the peak value, the slower the conduction is and vice versa. Under the effect of these monochromatic filters, there is a slowness on the conduction of the visual information to the occipital cortex. Filters affected mostly the N75 latency, which represents the time the information reaches the thalamus, considered a subcortical area. Minor changes were provoked to the P100 latency, being representative of the permeability of the striated visual cortex. What we can deduct from these results is that the way to modulate the neural activity when using the visual system as a vector is by activating the visual (striate cortex) and non-visual pathway as well, which reaches the subcortical areas of the brain. Our results are in concordance with what we know about the stimulation of the brain through the monochromatic light, where human exposure to light has been demonstrated to impact both visual and non-visual components, and the use of different wavelengths affects the retinal functions, circadian rhythms, metabolic processes, sleep, mood, and growth [
34,
35].
In phase two, to determine the impact of monochromatic filters on the VEPs parameters of all twelve participants, the Friedman and the Wilcoxon signed-rank tests were performed.
The main difficulty we found in comparing our data to previous studies is the lack of research in this topic. It is the first time that the effect of these monochromatic filters, which have been widely used as a complementary treatment for patients with visual dysfunctions such as strabismus, amblyopia, convergence-accommodative problems, etc., on the VEPs of participants, has been analyzed. However, we found similar studies that allowed us to compare our data and draw logical conclusions. In previous research in visually-normal participants, three monochromatic filters (red, yellow, and blue) with similar wavelengths but different transmission to ours, were used [
25]. The main difference was that the lens transmission in their research was a constant (each lens had a mean transmission of 39%), while in our, a variable (from 19 to 89.17%). Nevertheless, our results are in concordance with theirs, as in both studies, an increase in the N75 and P100 latencies was recorded when filters were in place (the obtained values were higher than baseline). In addition, variabilities were reported on the VEP amplitude with the addition of spectral filters, stronger under the blue filter condition. We reported similar results under the effect of omega, neurasthenic, and mu filter, (violet-blue-green color), compared to the baseline value. Based on the neurophysiology of the visual system, when the neural activity becomes more synchronized or desynchronized, an increase or decrease in the VEP amplitude is normally expected. What we know from previous research in TBI patients is that the modification of incident light may increase synchronization between neurons [
1], the prescription of colored lenses in children with visual stress, increases the VEP amplitude [
2], and fMRI evidence has shown reduced cortical hyper-activation in migraine patients under the effect of ophthalmic tints [
4]. Likewise, in our population which was composed of visually-normal and strabismic patients, the violet-blue-green filters decreased the VEP amplitude, while the red-yellow filters had a weaker effect on the recorded values. These results can be attributable to the specific wavelength (for red-yellow colors), transmittance (blue-violet colors) and the combination of both (green color). More specifically, the omega (446.5 nm/19.00%) and depressant (445 nm/79.57%) filters differ significantly in terms of transmittance, which suggest that their activity can be transmittance-dependent. The same principle applies for the neurasthenic (440.5 nm/36.02%) and omega (446.5 nm/19.00%) filter. However, when the mu (526.5 nm/34.76 %) is compared to neurasthenic and omega filters, they differences are reflected on both, wavelength, and transmittance, which suggests that its effect can be the result of the combination of both. alpha (731 nm/81.80%) and stimulant (592/89.17%) filters on the other hand differ significantly in terms of wavelengths but show similar transmittance. Therefore, their influence on the neural activity can be mostly wavelength-dependent. As a general conclusion, we could say that the impact of blue-violet filters on the neural activity of participants is more related to their transmittance, for yellow-red colors it can be wavelength-dependent, while for the green color, it is mostly a combination of both. In another study, when ophthalmic tinted lenses (blue-purple, green-turquoise, blue-turquoise) of different transmittances (16–43%) were prescribed to patients with visual stress [
2], patients with symptoms of headache and migraine presented a larger VEP amplitude when compared to the baseline value and the obtained results were mostly attributed to the transmittance than the wavelength per se. On the other hand, when the transmittance of the filter was maintained constant (39%), the effect of spectral filters was primarily attributable to luminance and in some cases, specific spectral effects [
25]. When we compared our data to previous research, some points of convergence and others of divergence were found. These conclusions were expected, as in all above-mentioned studies, different wavelengths, transmittances, and samples were used. However, researchers agree that monochromatic filters can affect the neural activity and this modulation can be due to the wavelength, transmittance, or the combination of both. As researchers and clinicians, we know that the main goal of conducting research, is to understand, integrate, and apply the new information in the clinical practice. As mentioned above, the VEPs changed with filters in place. However, some parameters were more affected than others. In this present study, important neurological and significant statistical changes were found for the VEP amplitude, N75 latency of the right eye, P100 latency, and the N75 of the left eye. As known, the N75 latency presents the time needed for the visual stimulus to reach the thalamus, whereas the P100 latency shows the time the visual stimulus reaches the occipital cortex, Brodmann area 17. Therefore, the speed at which the visual stimulus reaches the striate cortex or the subcortical areas can be clinically modified by stimulating the visual and non-visual pathway, being this one, the bridge that connects the visual system to the thalamus, the integrating center of all senses, but for smell [
36]. The simultaneous integration of different sensory modalities during the first years of the child’s development, is crucial for brain plasticity, and can easily be disrupted by visual dysfunctions [
37]. Consequently, the use of monochromatic filters in patients with strabismus and amblyopia could be a good ally to revert what was disrupted by abnormalities of the visual system. In addition, we focused on analyzing the chromatic filters with the greatest effect on the VEPs as well.
Table 9 reflects a generalized impact of the neurasthenic (violet color) followed by omega (blue color) filter, on all parameters of the VEPs. What is interesting here is the fact that both filters have a similar wavelength but differ significantly in terms of transmittance. Therefore, their effect should be transmittance-dependent. Previous research has shown the positive effects of the monochromatic blue light on cognitive performance and sleep patterns, a reason why it has been frequently used to modulate brain networks [
38,
39]. We strongly believe that both filters should be integrated as a complementary tool in the visual therapy program of patients with visual dysfunctions, taking into consideration that green-blue colors enhance interhemispheric connections and the brain coherence of patients with strabismus and amblyopia [
26,
27]. On the other hand, the green color (mu filter), proved to be another strong ally to alter the VEPs of our participants, having a comparable effect to omega and neurasthenic filters. In the field of phototherapy, the green color is considered to bring the visual system to balance [
14], and research on the response to violet, blue, and green monochromatic light has reported satisfactory results at cortical and subcortical levels, after the process of exposure to these wavelengths [
40]. Based on the above, that neuroimaging studies have demonstrated the positive effect of exposure to violet-blue-green monochromatic light, our VEPs confirm that visual pathways respond mostly to these range of wavelengths. Last, yellow-red colors showed a weaker effect on the VEPs of all participants. Their impact was mostly wavelength-dependent. The yellow color decreased the VEP amplitude, while the red color influenced the N75 and P100 latency. Even though they belong to a similar color spectrum, they differ significantly in their activity. Therefore, the differences could be mainly wavelength-related, and less transmittance-dependent. What we know about the combination of yellow-red colors used in visual therapy is that, even under the light stimulation, alpha-wave continued being distributed in different cortical lobes, and there was a lack of brain coherence in most patients, even after the treatment [
26,
27]. What could be considered a limitation to our study is the lack of a larger sample of patients with strabismus and amblyopia. The monochromatic filters we used have been especially employed to treat patients with strabismus, amblyopia, binocular dysfunctions, etc. When used in a therapy session, a combination of two or more filters is proposed to the patient, and very little research exists on their impact on the brain of strabismic and amblyopic patients. It is the first time that the effect of separate filters is measured, to understand why these specific combinations are good for some patients but not for others. In our previous studies using qEEG [
26,
27], we saw that phototherapy indeed modulated the brain of our patients, but with different results, especially in children and adults. Considering that strabismus is a cortical phenomenon and not just an aesthetic problem, present since childhood and affecting the quality of life of our children, understanding how monochromatic filters can be used to change their brain in a specific way so the treatment could be efficient and lasting over time should be the goal of every visual health professional. Therefore, analyzing these filters in two different samples such as strabismic and visually-normal children from 6 (the VEPs are more consistent) to 15 years old (brain networks become similar to adults), could be crucial for the future use of monochromatic filters. The biggest problem with children is their visual attention, as they easily become distracted. Considering that we used six different filters and a baseline recording, the time needed for the study is longer than they can bear. Consequently, most studies are performed in adults, and before working with children, our next step would be to repeat these measurements in strabismic adult patients and compare the data with the results we obtained in this phase. The challenge of working with patients with strabismus and amblyopia is the variability of types of strabismus, such as associated and dissociated strabismus, constant and intermittent, unilateral, alternate, each one followed by a variability of cortical-visual adaptations. Therefore, it is a necessity that more research is carried out in this field, to provide new electrophysiological data on strabismic children and adults, to compare it posteriorly to the normative population. This knowledge would open a new panorama on how to modulate the brain of these patients using different chromatic filters, to disrupt sensory and motor adaptations provoked by these visual dysfunctions.

 ,
, 


