
Wireless, Material-Integrated Sensors for Strain and Temperature Measurement in Glass Fibre Reinforced Composites

Abstract
:1. Introduction
1.1. Conducted Work
1.2. Structure of This Paper
1.3. Fabrication Monitoring
1.3.1. Infusion
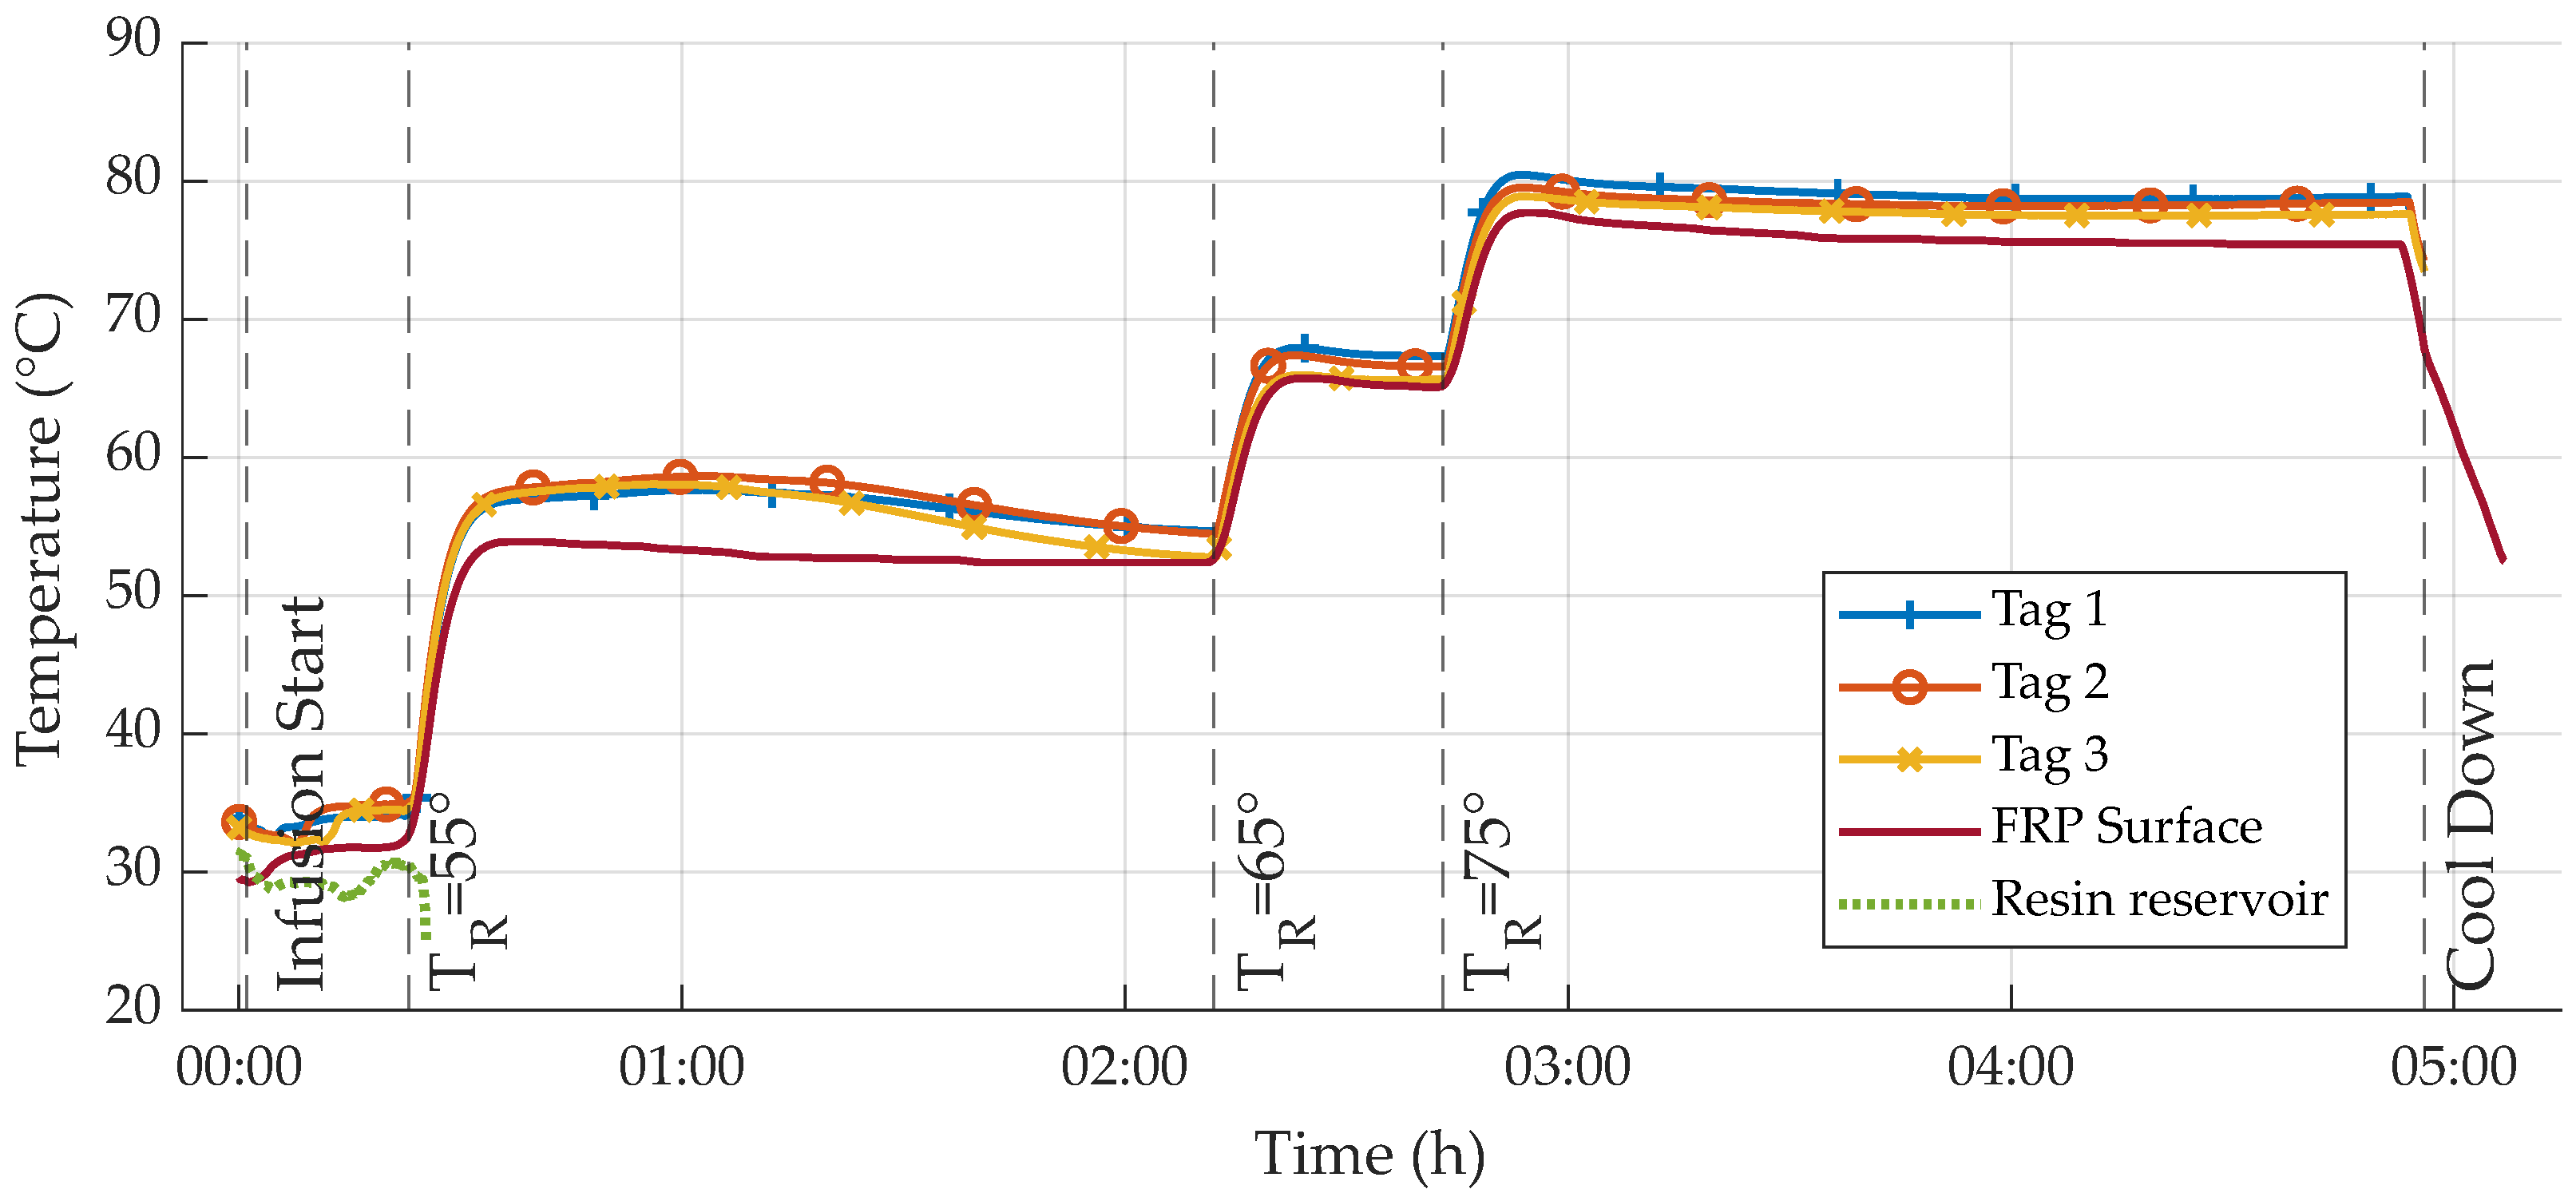
1.3.2. Curing
1.3.3. State of the Art—Fabrication Monitoring
1.4. Load Monitoring
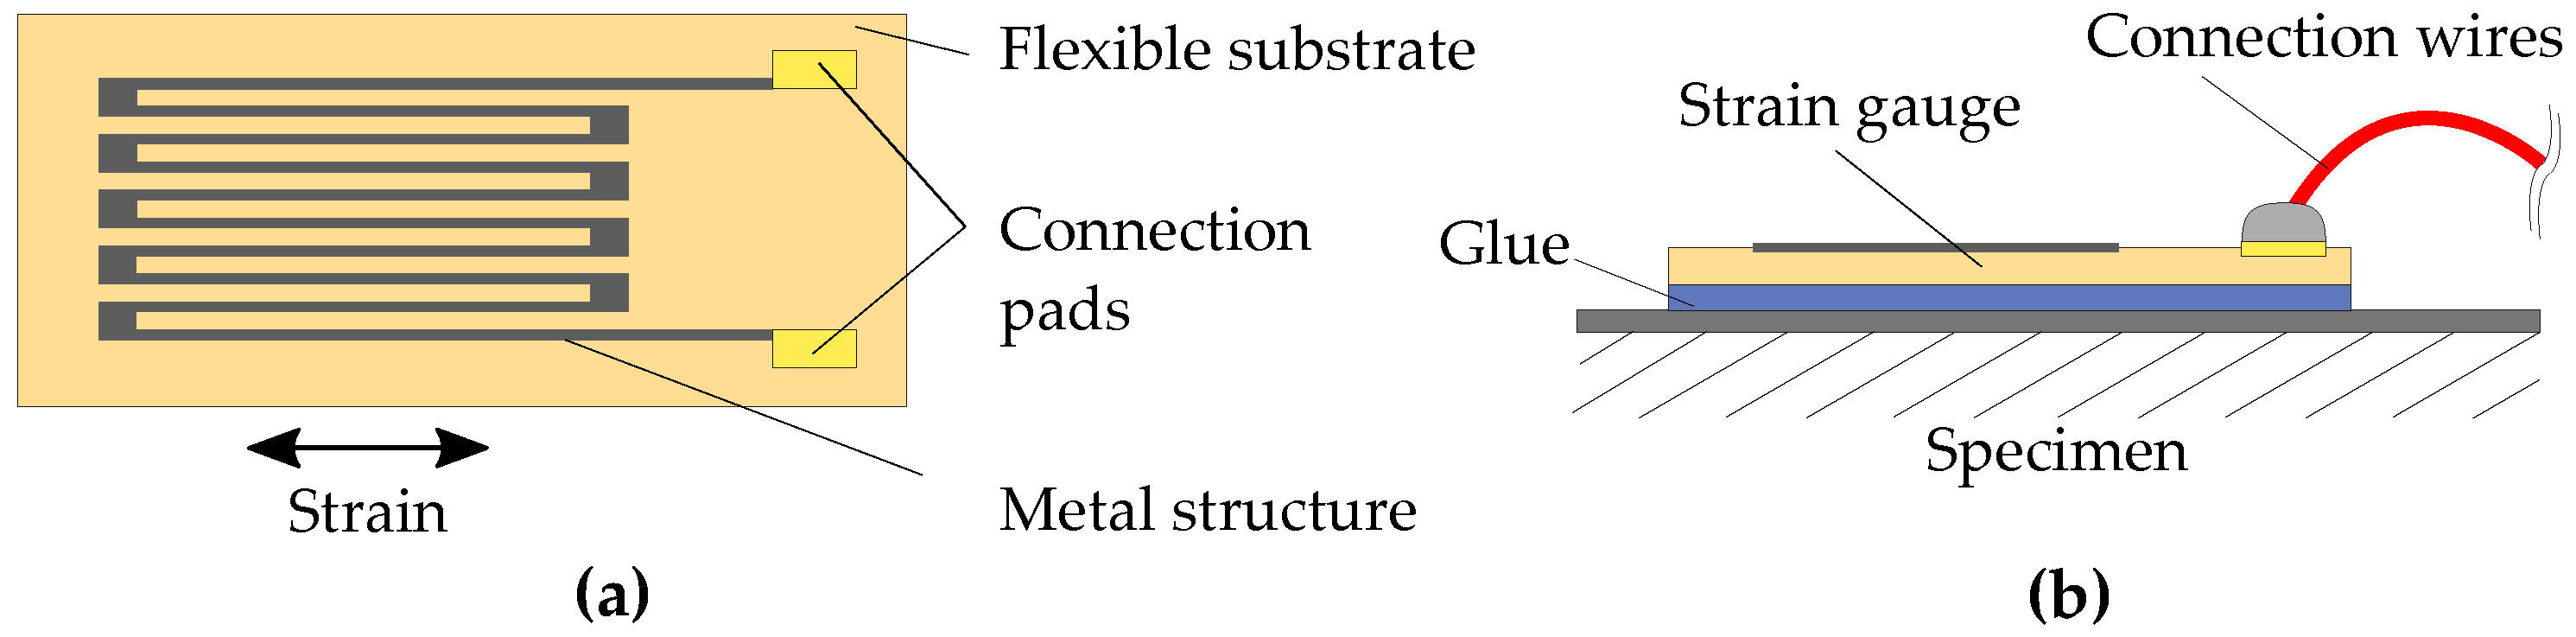
1.4.1. Strain Gauges
1.4.2. Fiber-Bragg-Gratings
1.5. Problems with Wired Sensors for Component and Fabrication Monitoring
- During FRP production, the integration of sensors and wires is a complicated and therefore time-consuming process, especially for sensitive sensor elements, and usually has to be done manually, resulting in high costs [8]. Apart from the sensors themselves, wire presence thoroughly complicates the setup of the vacuum seals, as the wires need to be lead though the vacuum seal while still ensuring air tightness. Though this is possible, it is expensive and also prone to errors, potentially compromising vacuum buildup and thereby quality of the infusion process. Additionally, wires can negatively affect the flow front during infusion by creating flow channels along their length.
- Apart from fabrication-related aspects, wires of integrated sensors also need to be taken special care of during the FRP’s lifetime, as they are very sensitive, especially in comparison with the FRP material itself. This is mainly due to the general arrangement of protruding wires and the surrounding matrix where the wires exit the FRP, that is very likely to create shear stress to the wires, possibly leading to breakage. This is compounded by the difference in the two materials’ Young’s modulus and different thermal expansion coefficients. Once a wire is broken, the sensor system is often rendered useless, as exchange of the integrated sensor is mostly either impossible or economically unreasonable.
- Regarding the fatiguing behavior of wired, sensor-integrated FRP samples, ref. [33] observed that failure often occurred at the positions where the wires exited the matrix, supporting the conclusion that wire presence can degrade the fatigue behavior of FRP.
1.6. Solution: Wireless Sensors for FRP Integration
- Sensoric antennas: the first and most widely used concept makes direct use of the antenna itself, i.e., it employs the antenna as a sensing element [34,35]. This is possible, as the antenna is subjected to the immediate environment of the sensor and is therefore influenced by it (e.g., changes in resonance frequency due to temperature). This allows for very simple sensor design and therefore low production cost, which is the greatest advantage of sensoric antenna systems. The greatest drawback of sensoric antenna systems is the high susceptibility of the measured entity to exterior influences. As sensitivity of the antenna to external influences is actually part of the system concept, cross-sensitivities of the antenna can degrade system performance [35]. For simple measurement task though, sensoric antennas can be applicable. Regarding usage of sensoric antennas for SHM, ref. [35] comprehensively reviews different concepts and applications.
- Dedicated sensing element: the second principle also uses an antenna, but only for energy supply and communication, while sensoric data are gathered via a dedicated sensing element. In order for this to work, further circuitry is necessary in the sensor, which does the actual measurement acquisition, power control and communication. If designed with sufficiently low power consumption, basically all conventional measurement electronics could theoretically be used on a sensor tag, allowing for much more complex sensing functions.
Wireless Sensors—State of the Art
2. Sensor Design and Fabrication
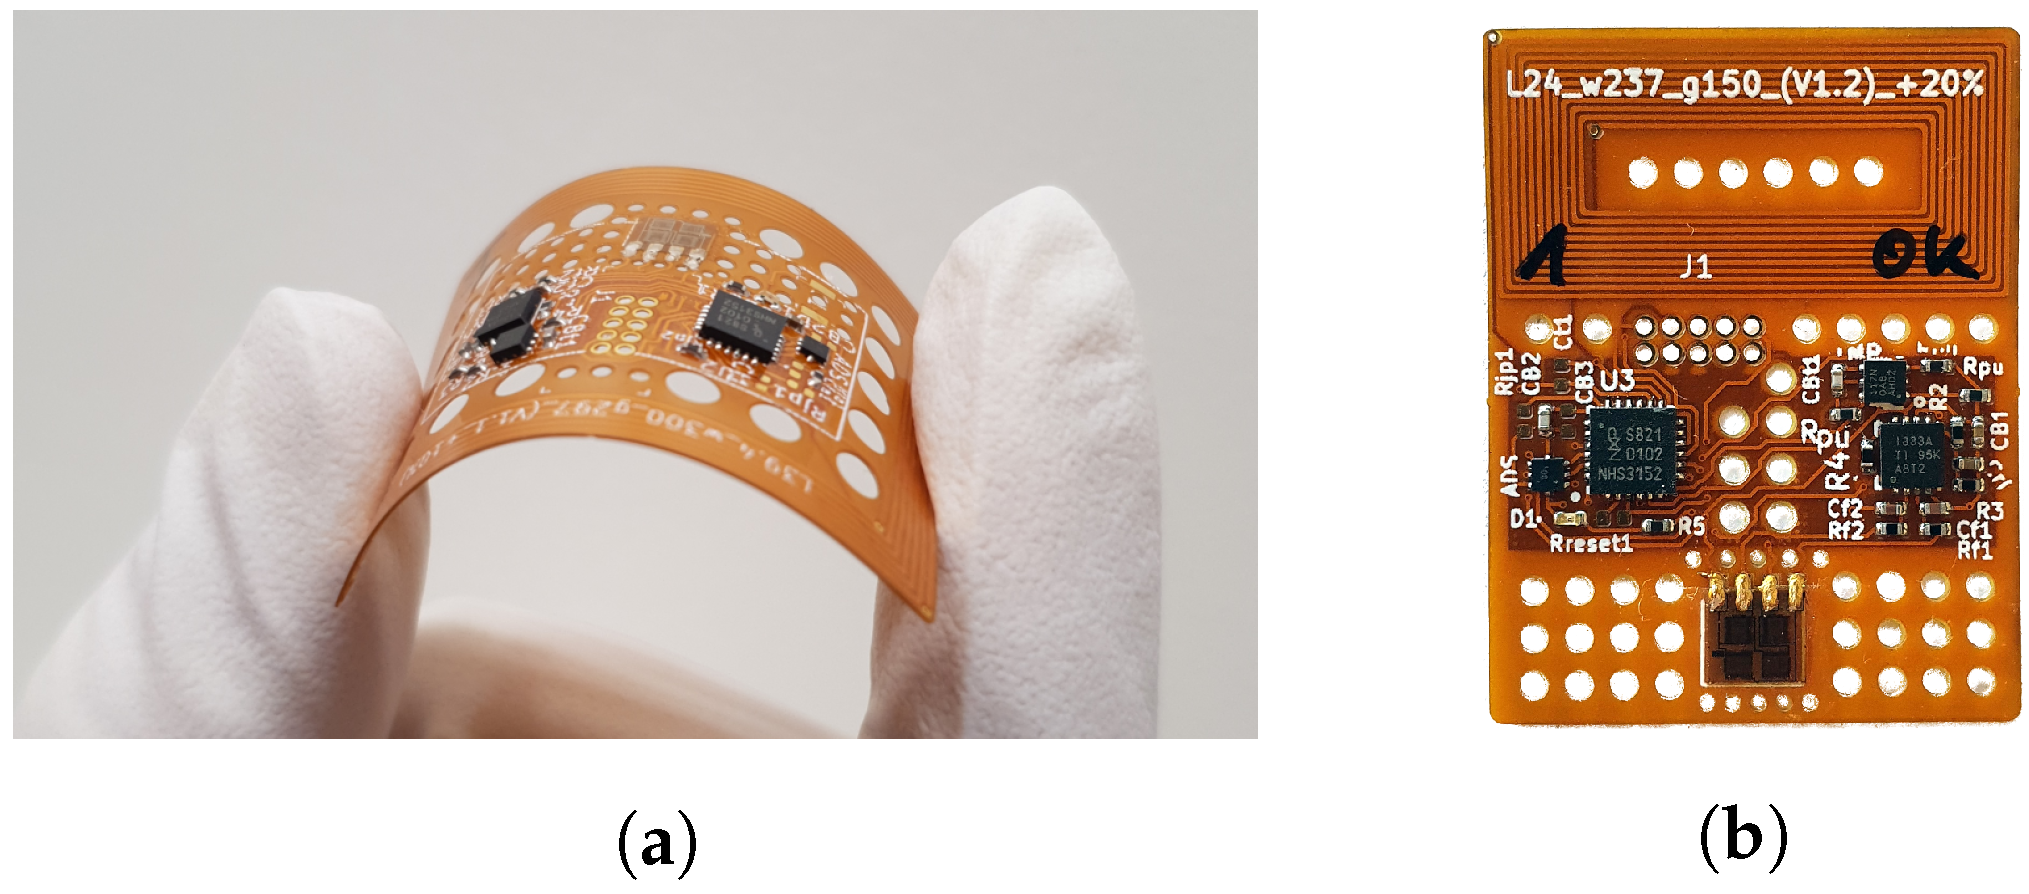
2.1. Sensor Tag Concept
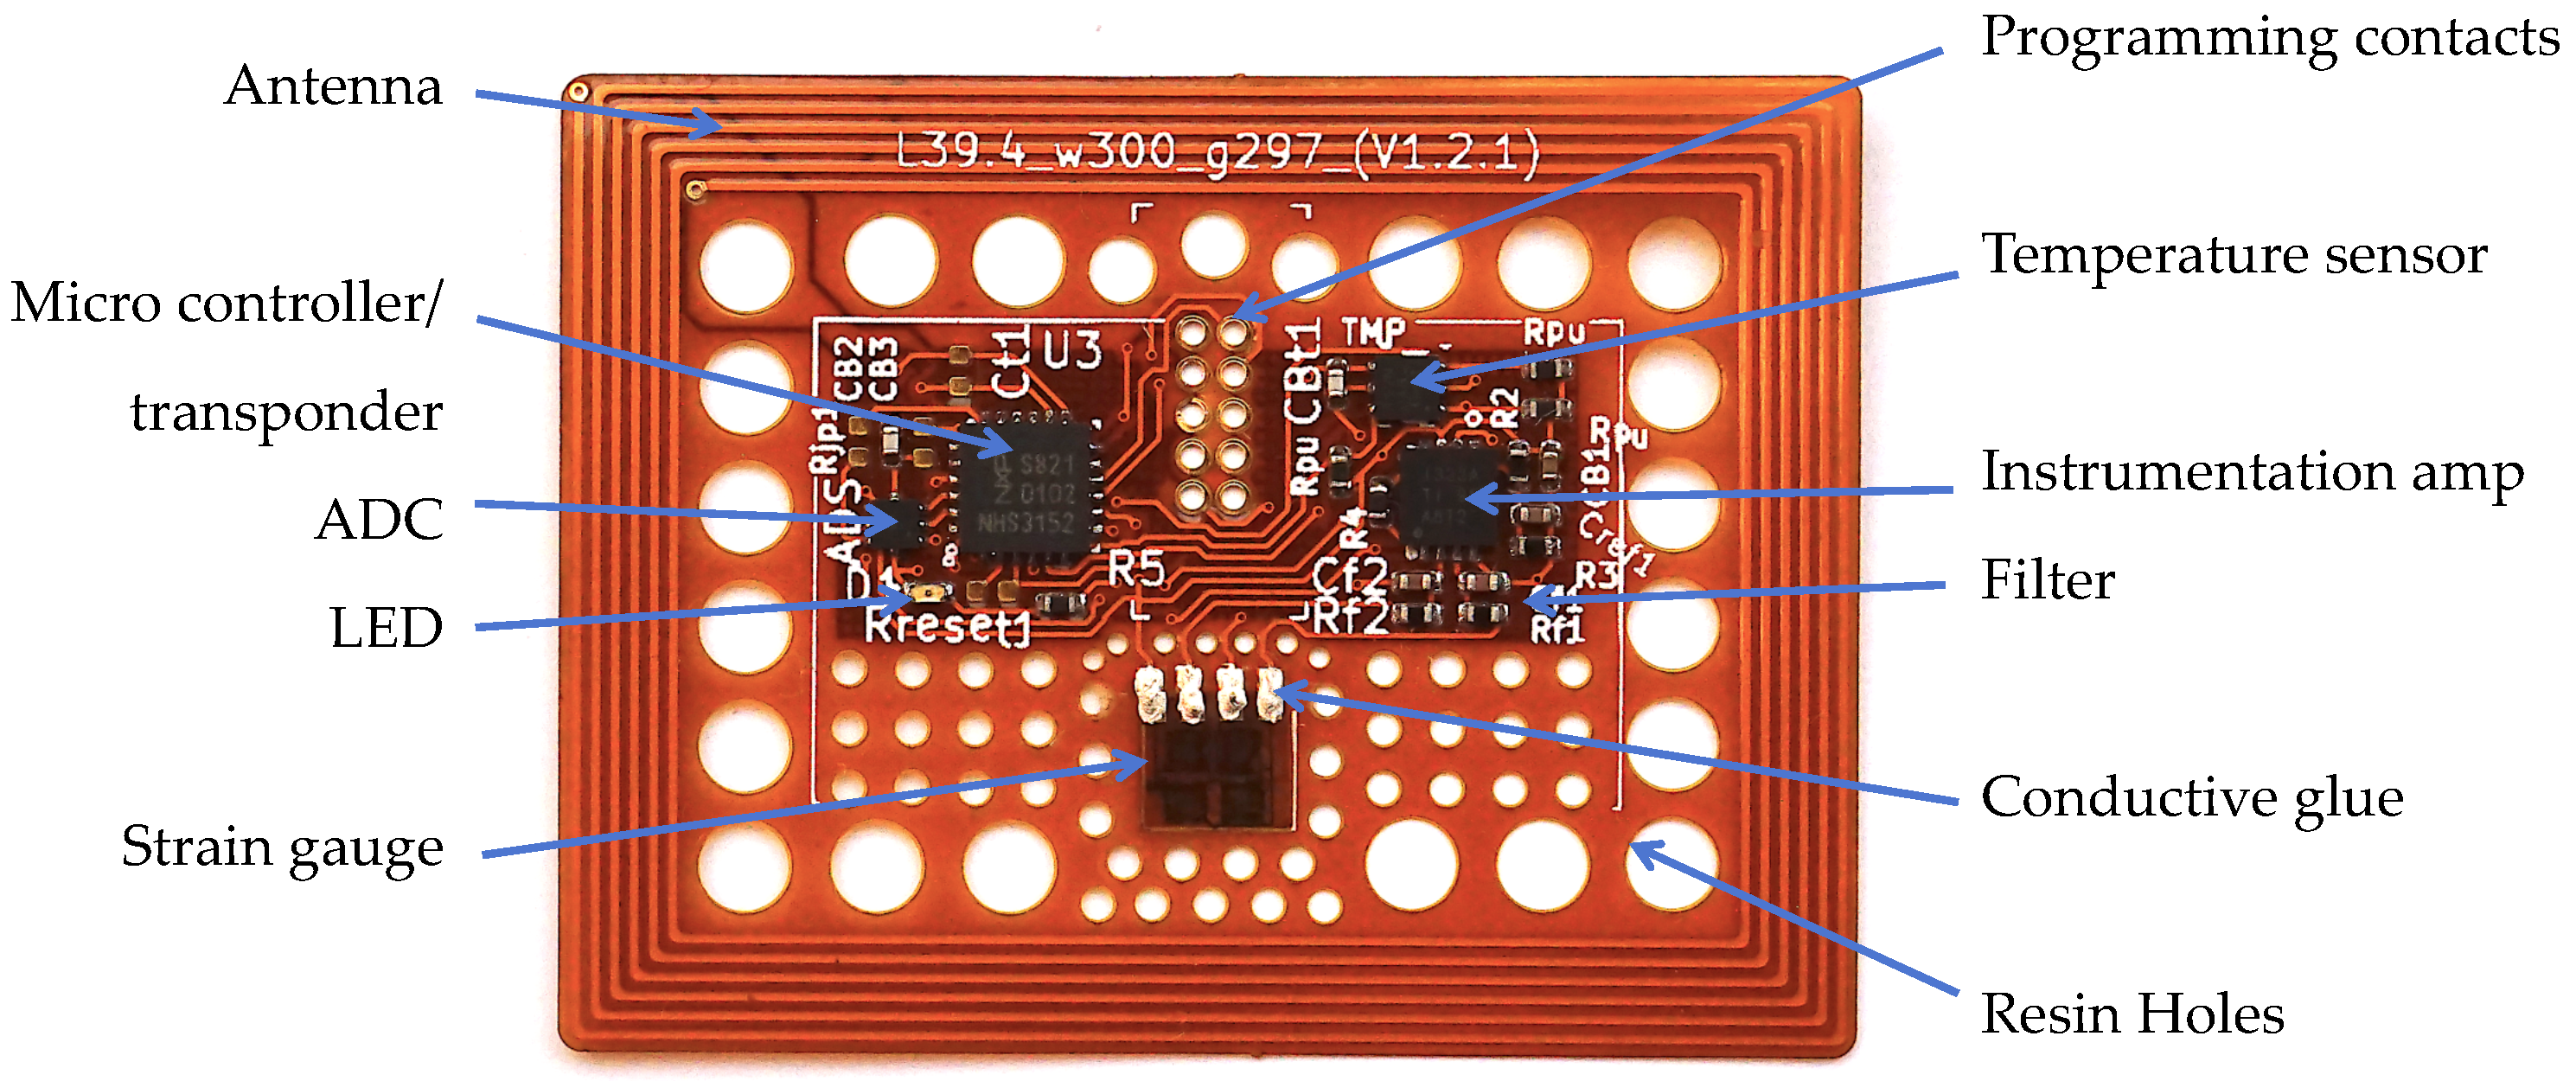
2.2. RFID-Transponder and Micro Controller
Sensor Elements
- Completely wireless and battery-less principle: no wires complicating vacuum setup and later-on part handling, long lifetime
- Sensor usage throughout the whole FRP part life cycle.
- High precision, material-integrated temperature measurement, therefore giving higher information depth than surface based measurements, facilitating FRP production process monitoring and optimization.
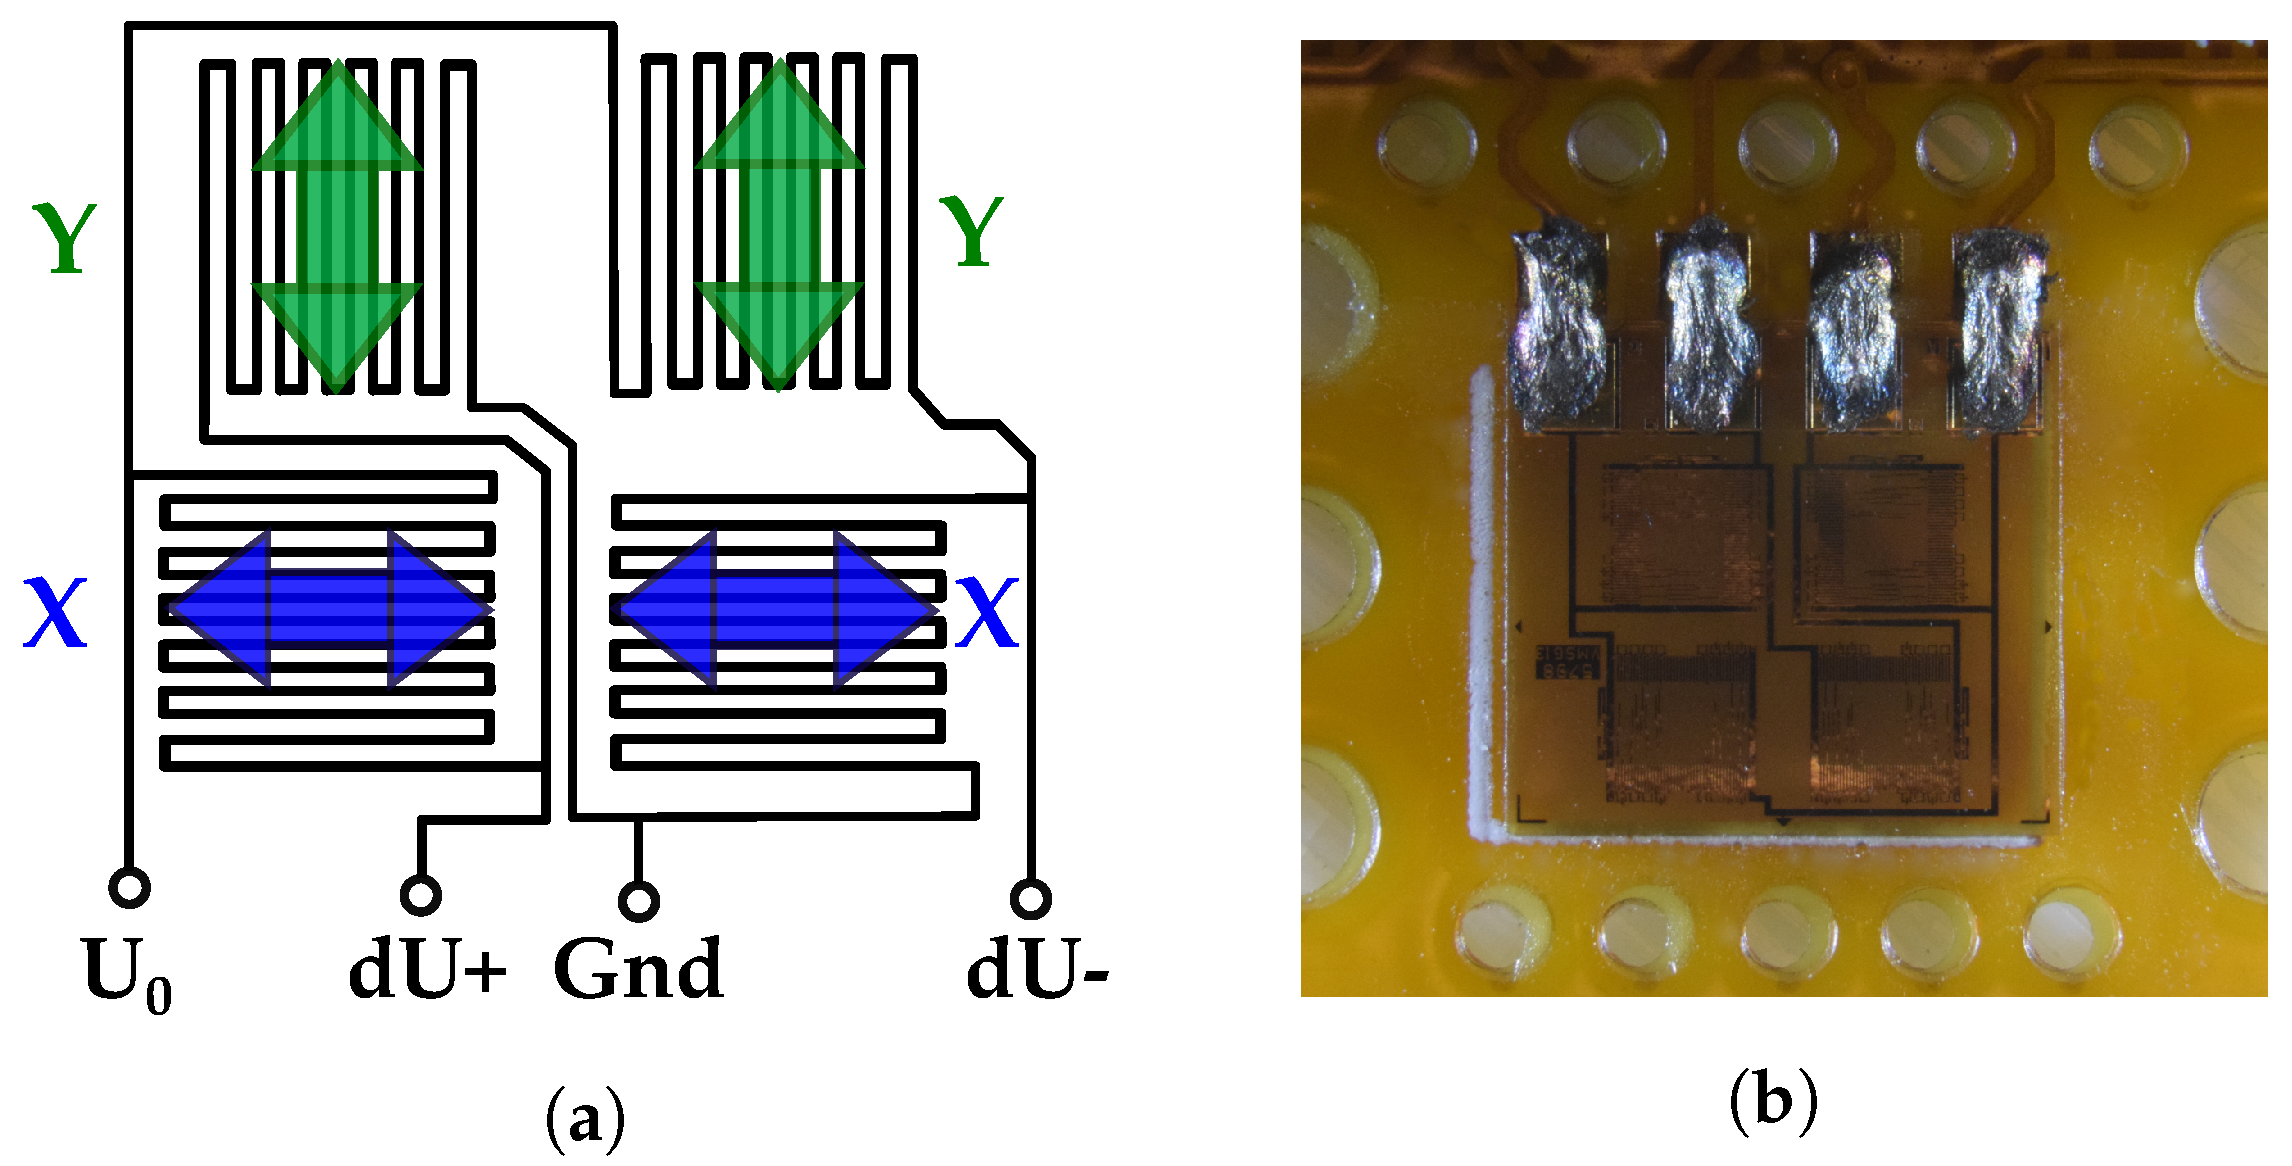
- Biaxial, temperature-compensated strain measurement for FRP load measurement and structural health monitoring.
- Additional advantages of material-integrated “intelligence”: material integrated storage for part identification, maintenance or measurement data
- “Sensor tag” concept facilitates automated sensor placement during FRP production.
2.3. Sensor Fabrication
2.3.1. Sensor Substrate
2.3.2. Antenna
2.3.3. Assembly
3. Experiments with the Sensor
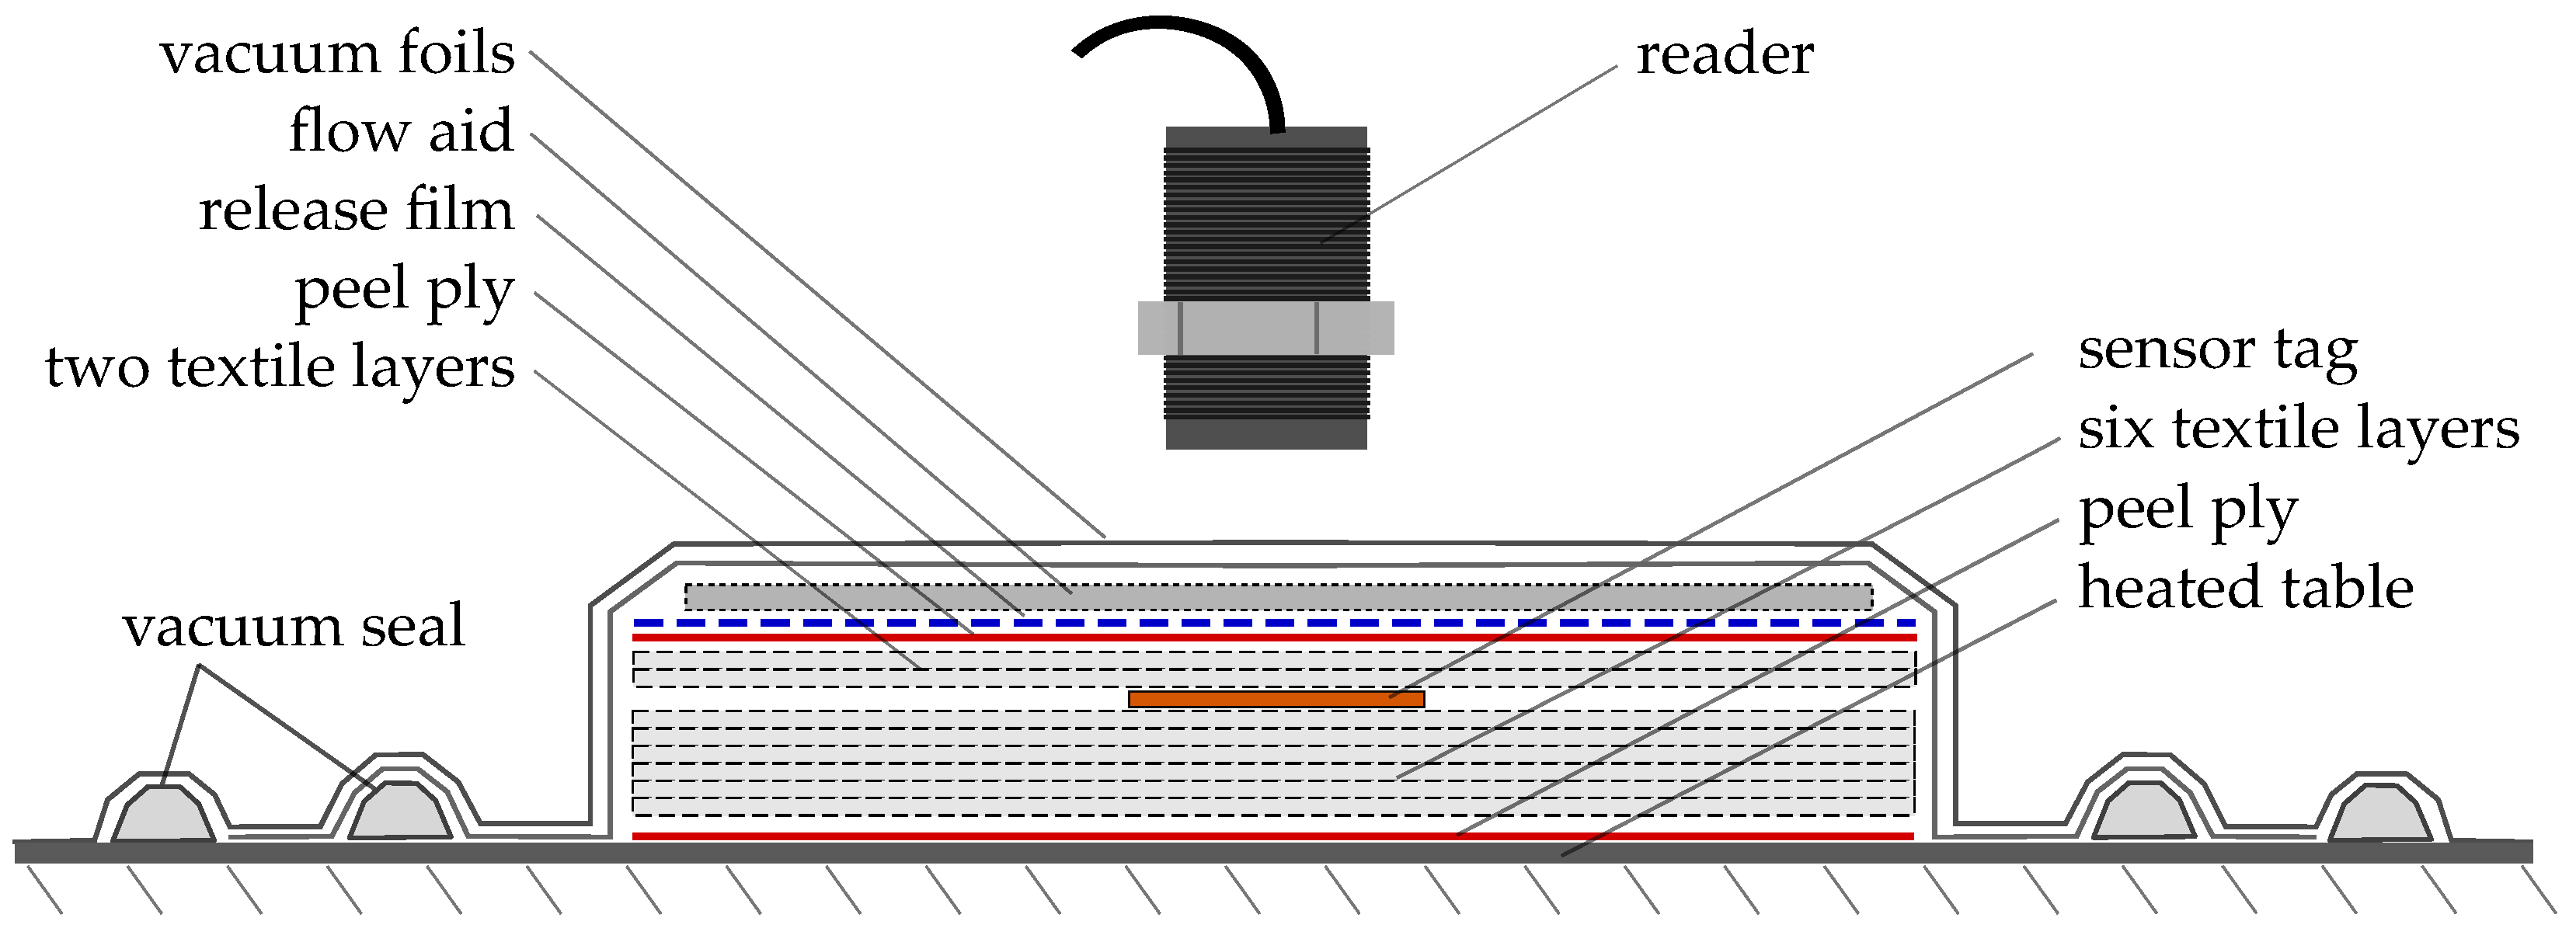
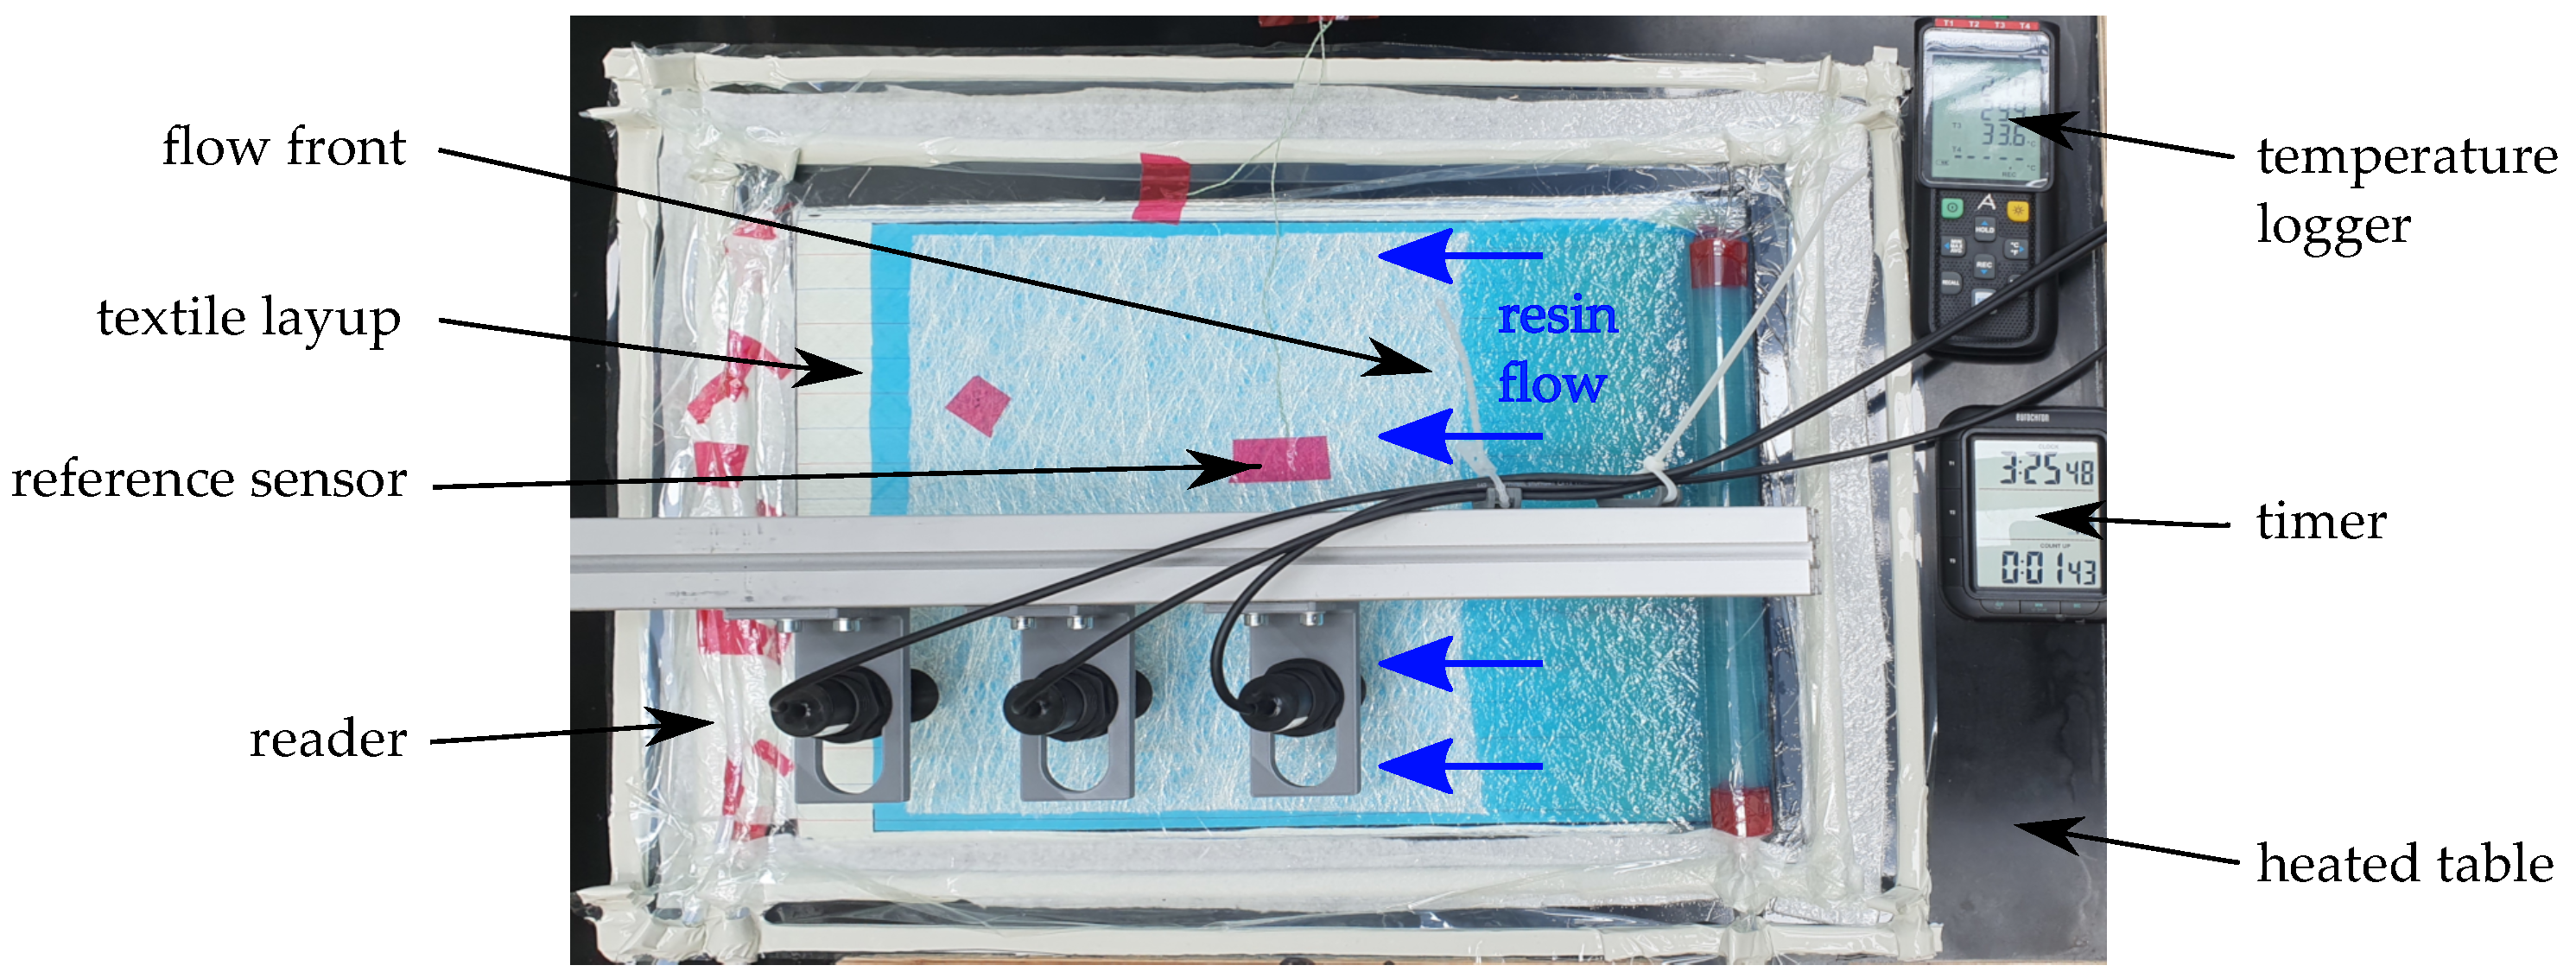
3.1. Fabrication Monitoring Setup
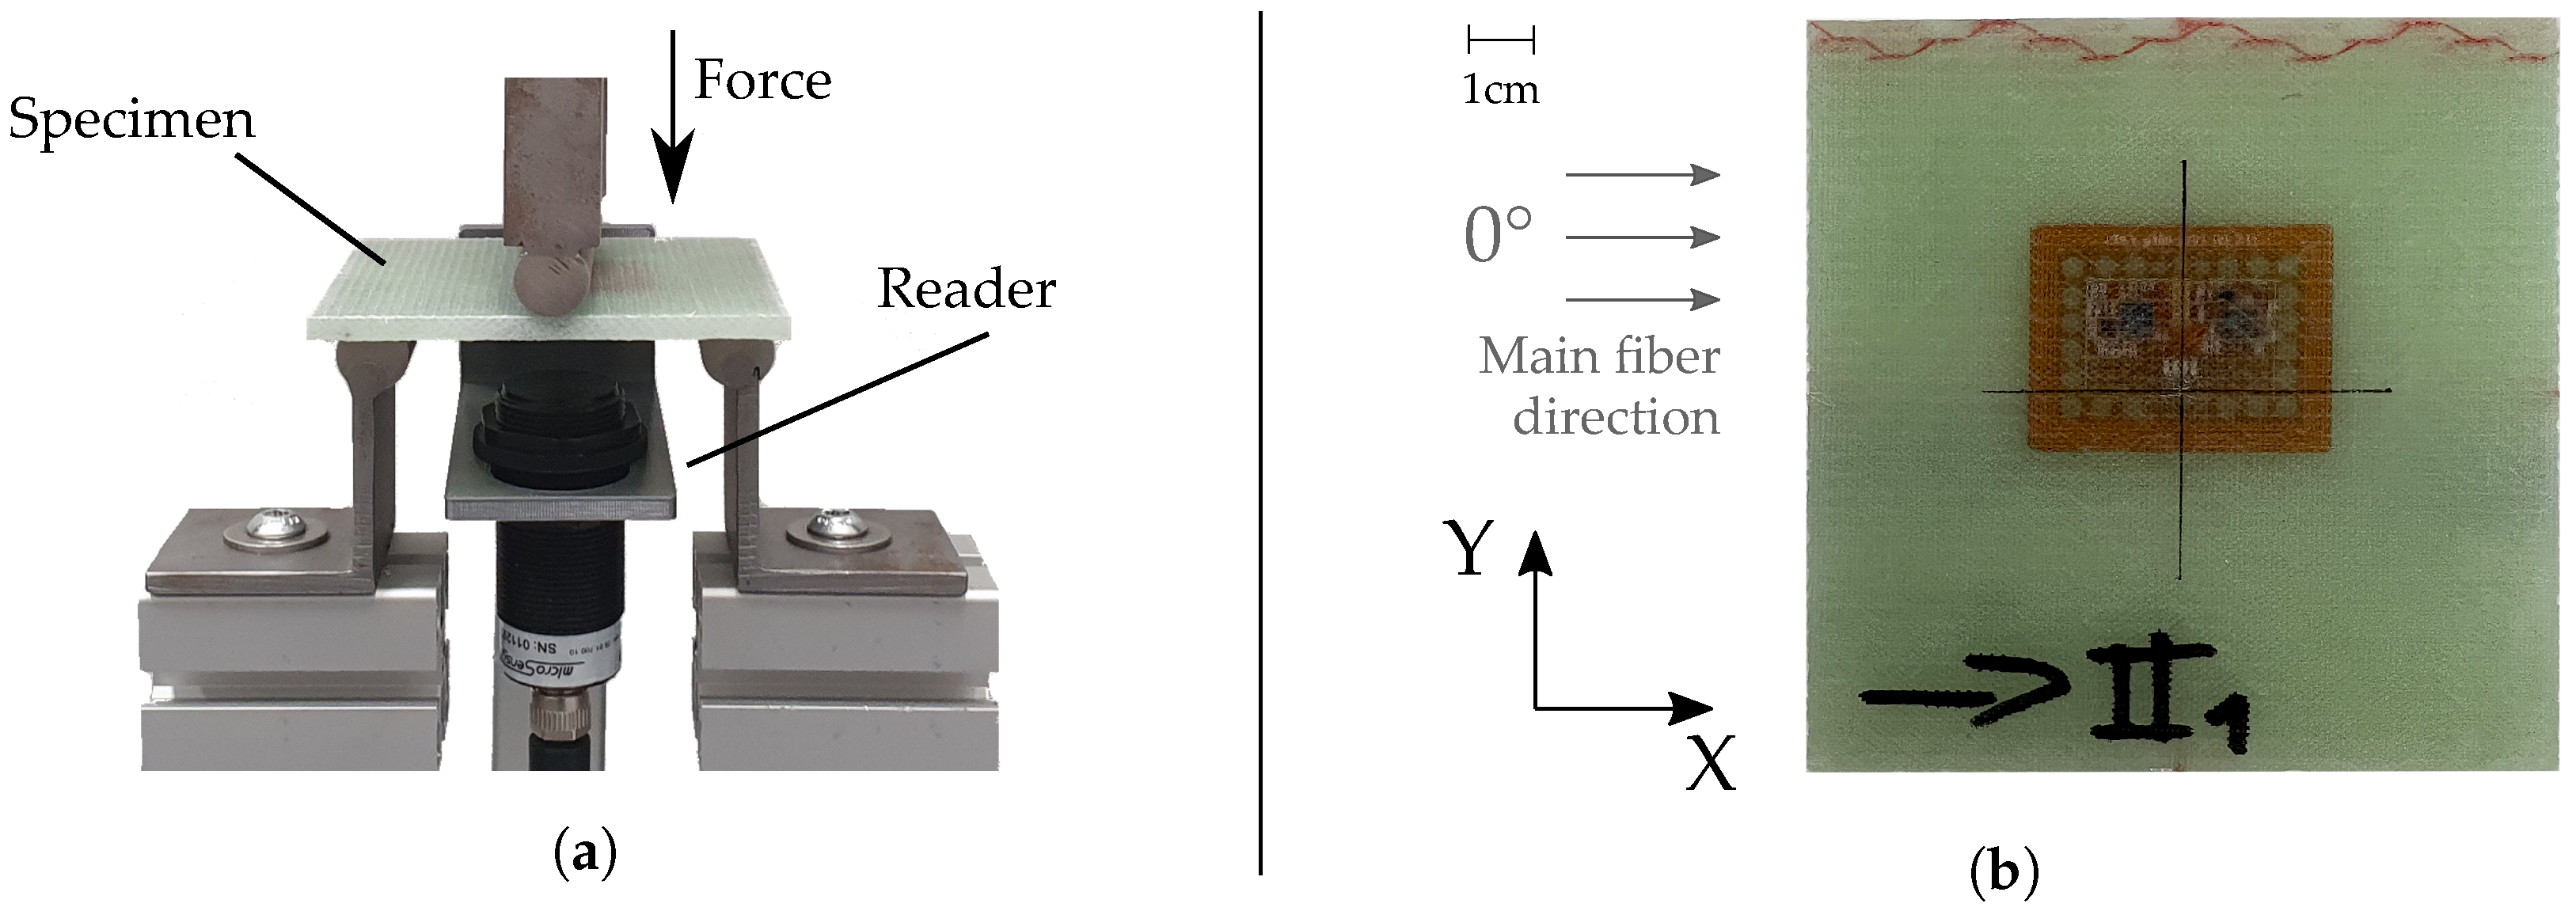
3.2. Strain Sensor Characterization Setup
3.3. Reading Distance Experiment
4. Characterization and Results
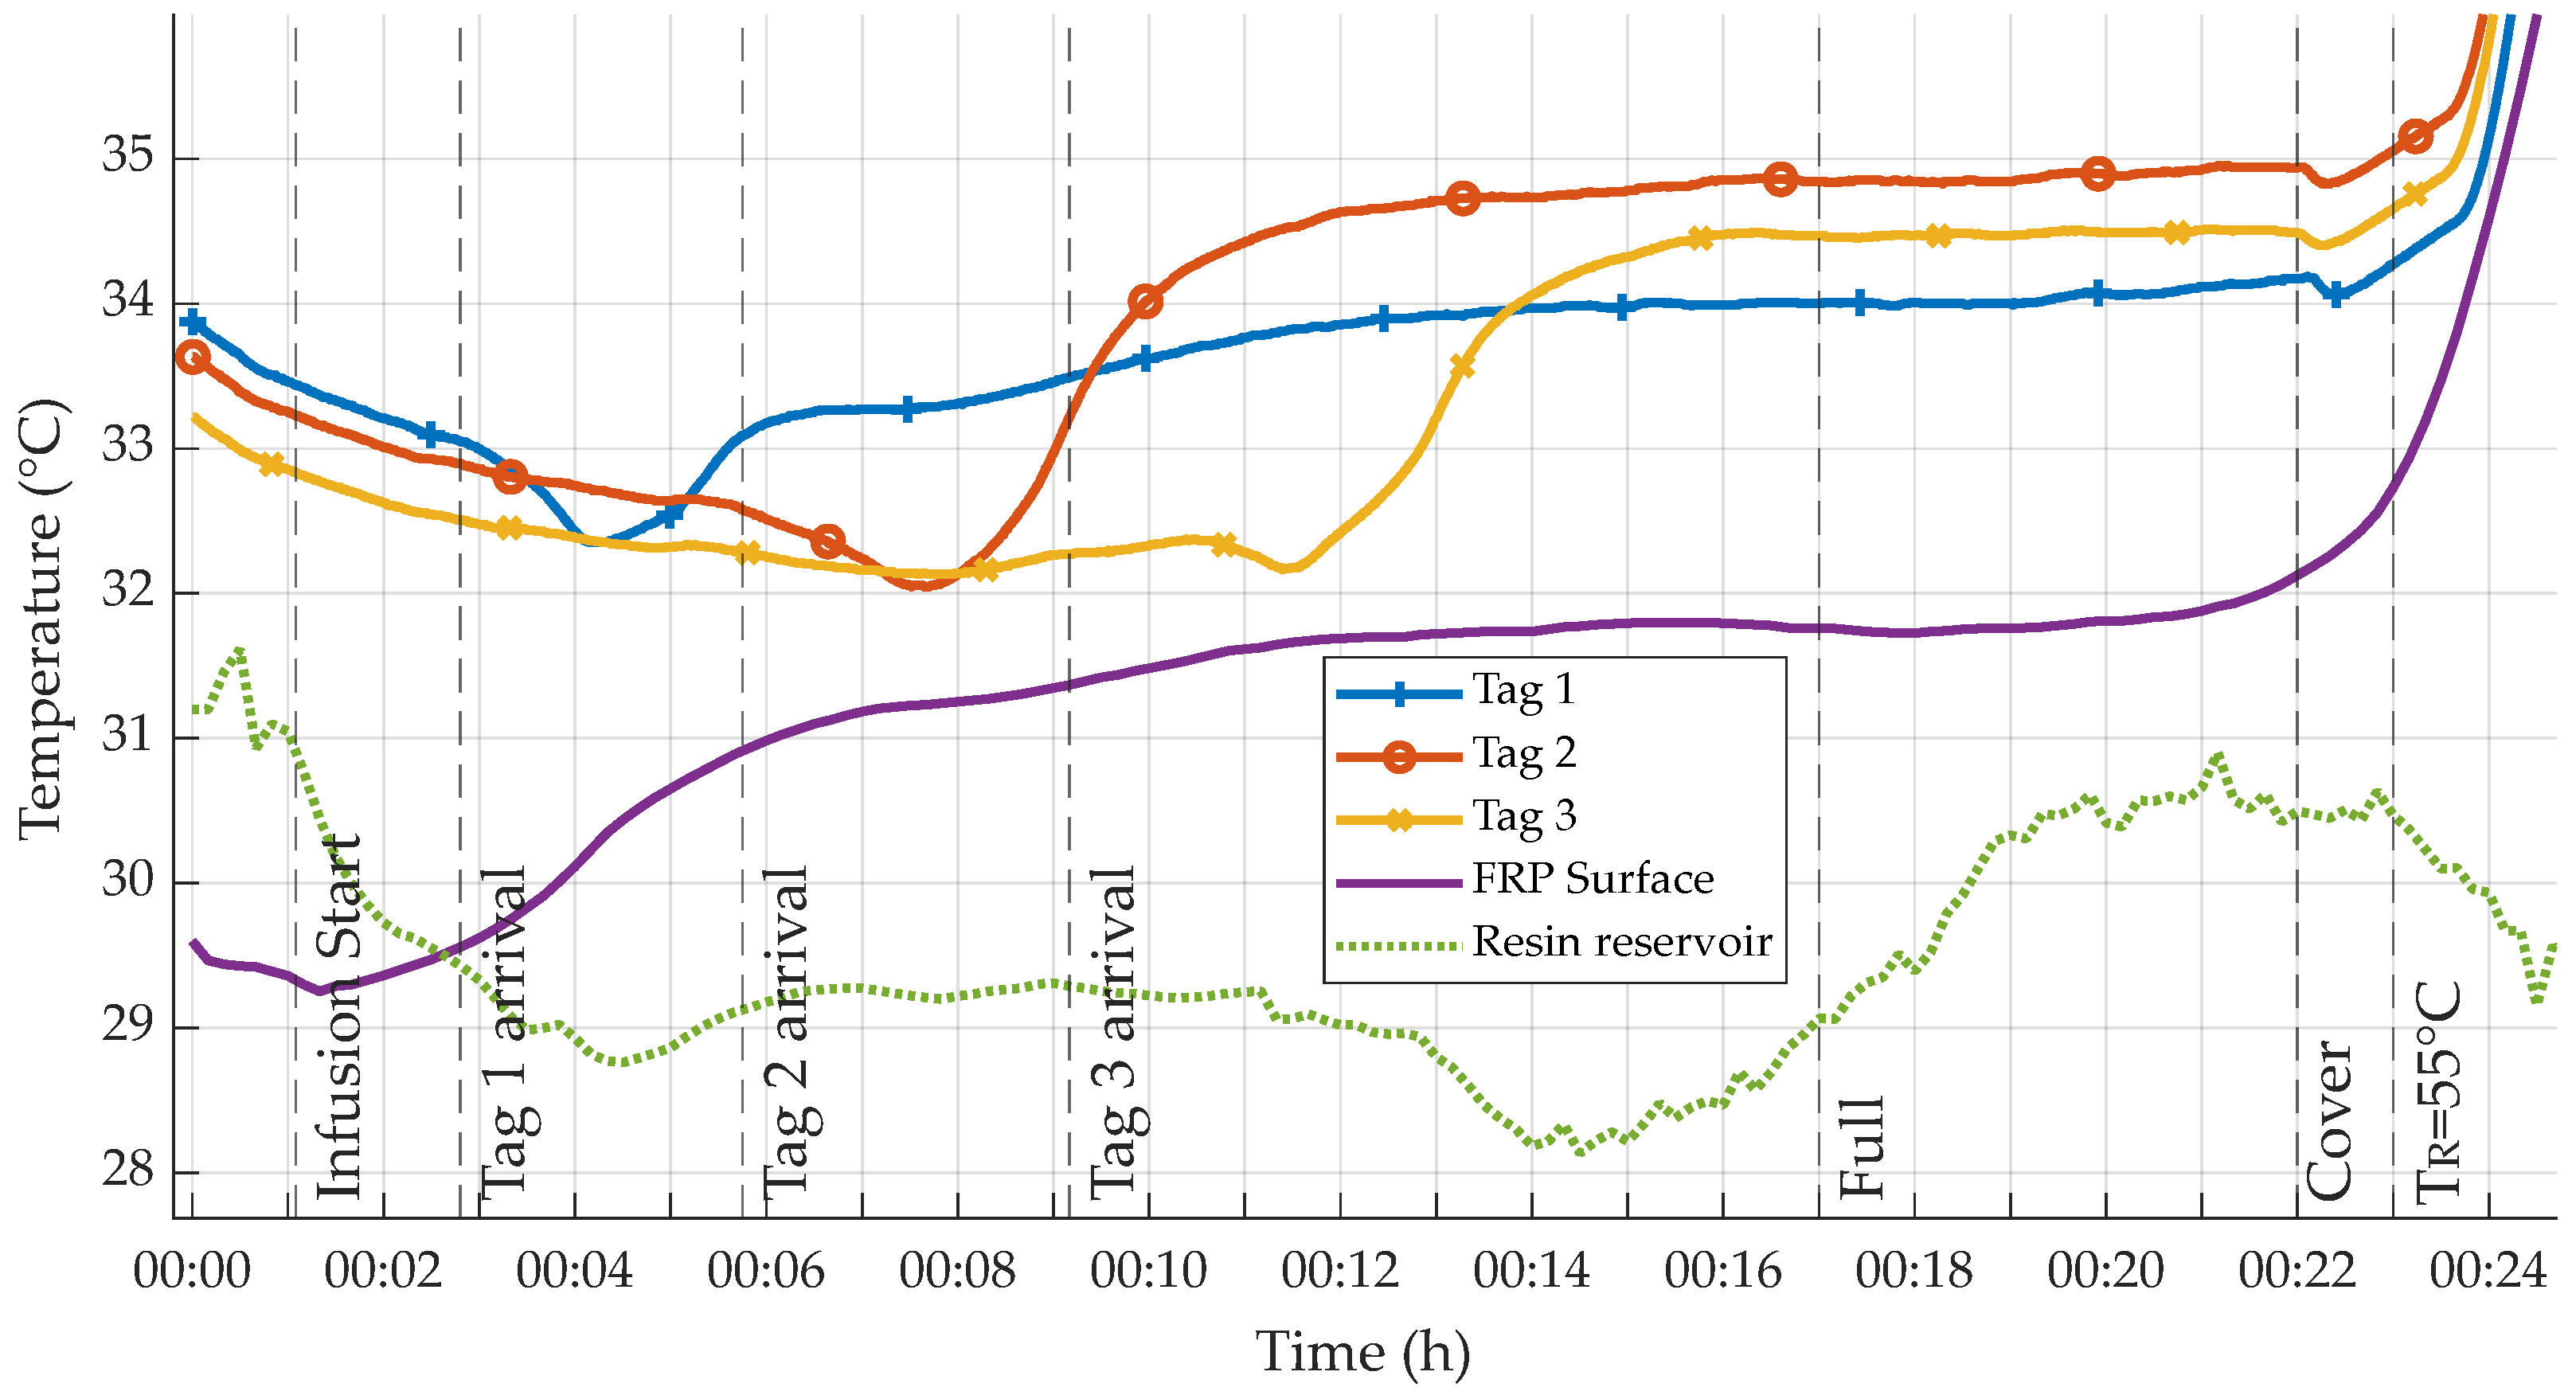
4.1. Fabrication Monitoring Results
4.2. Strain Sensor Characterization Results
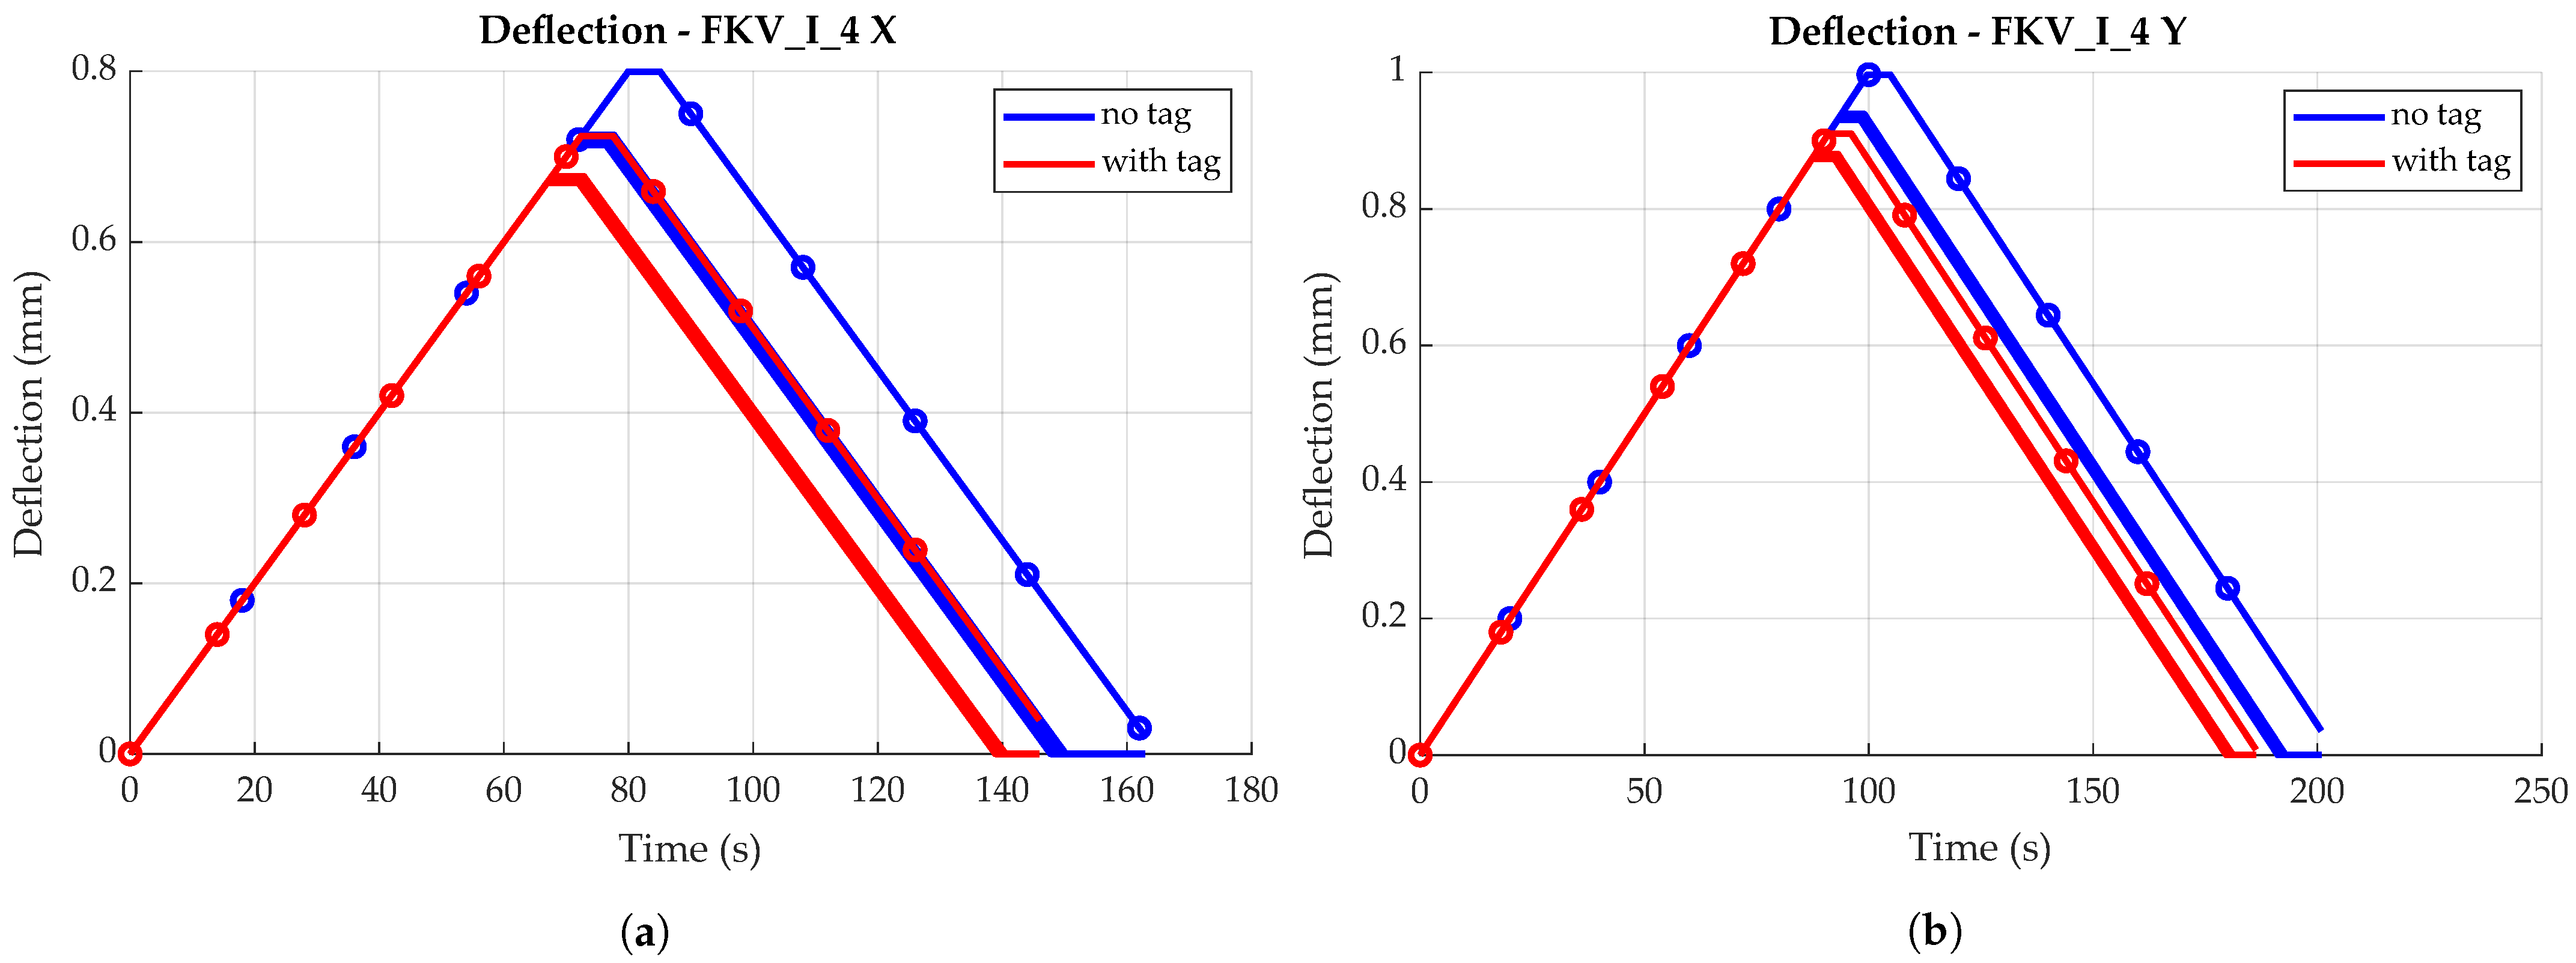
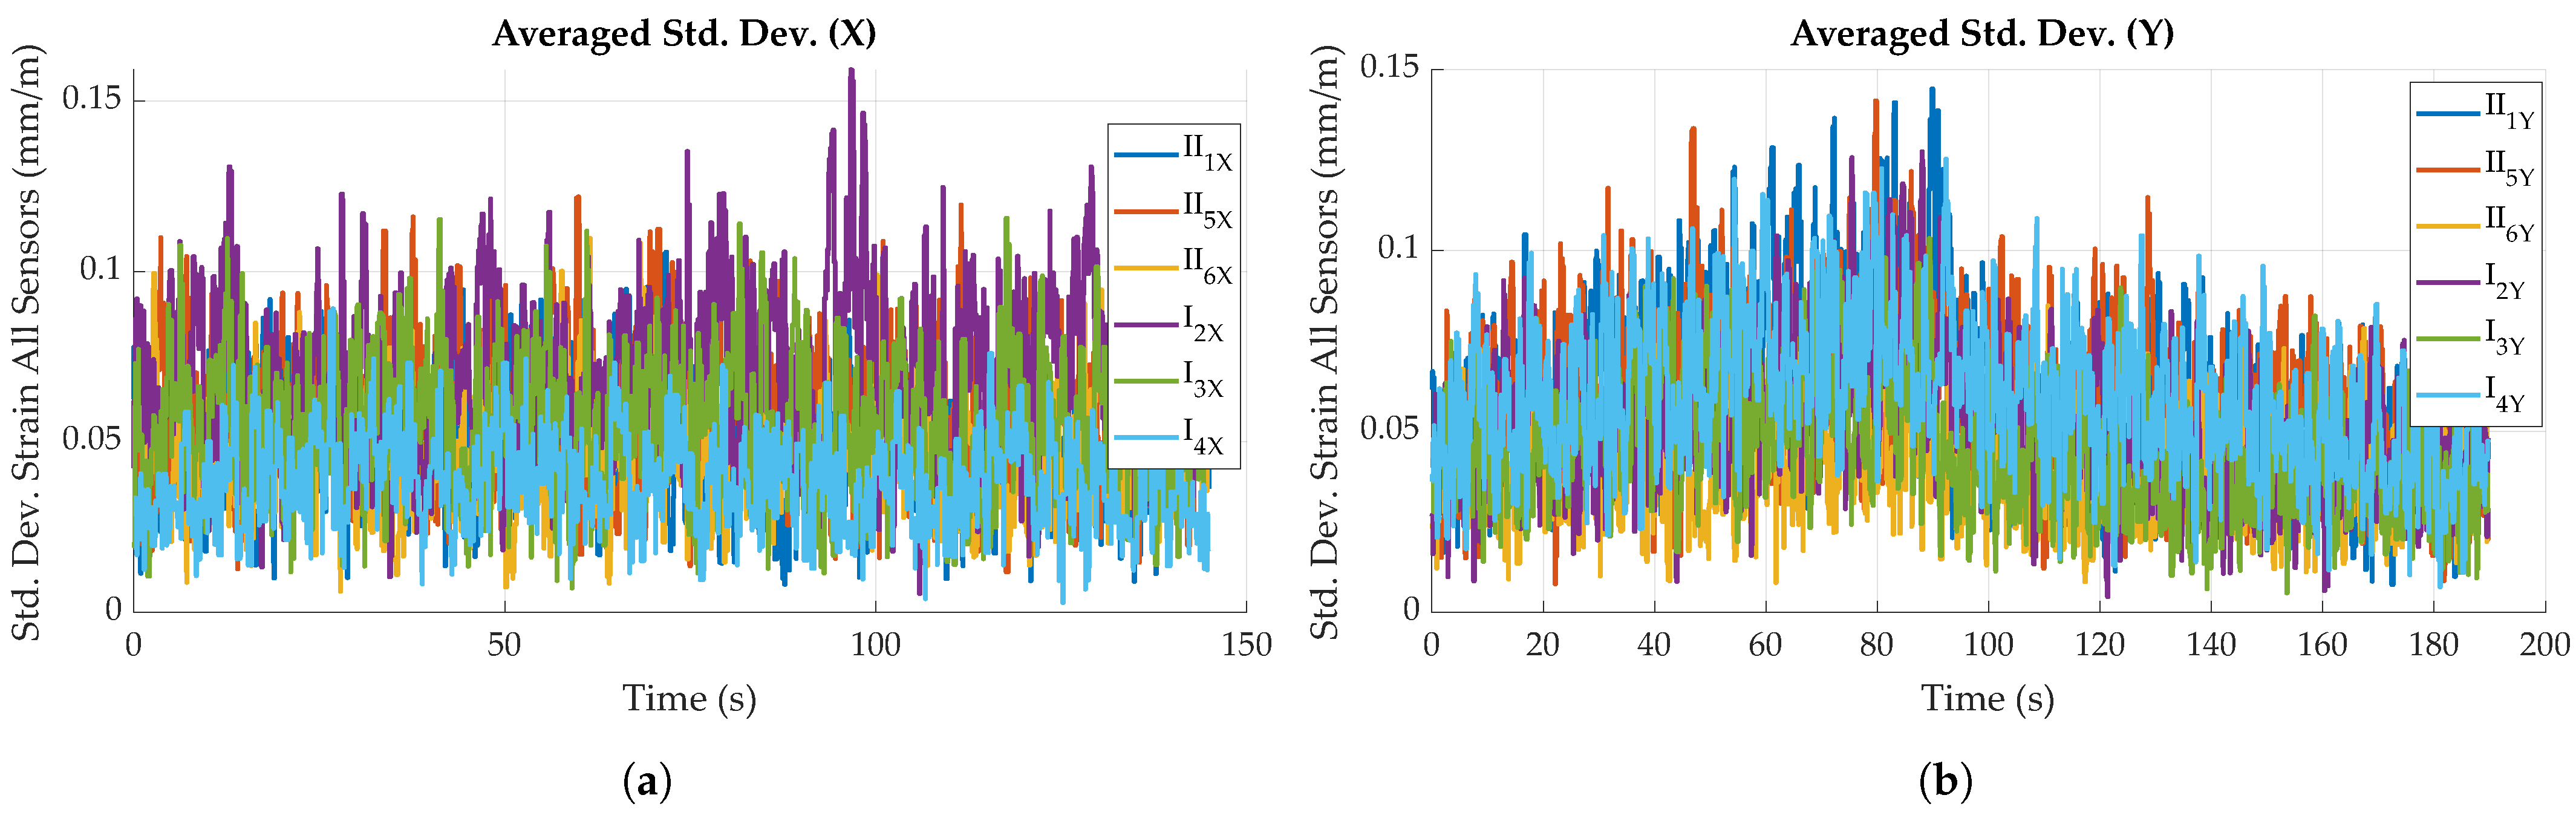
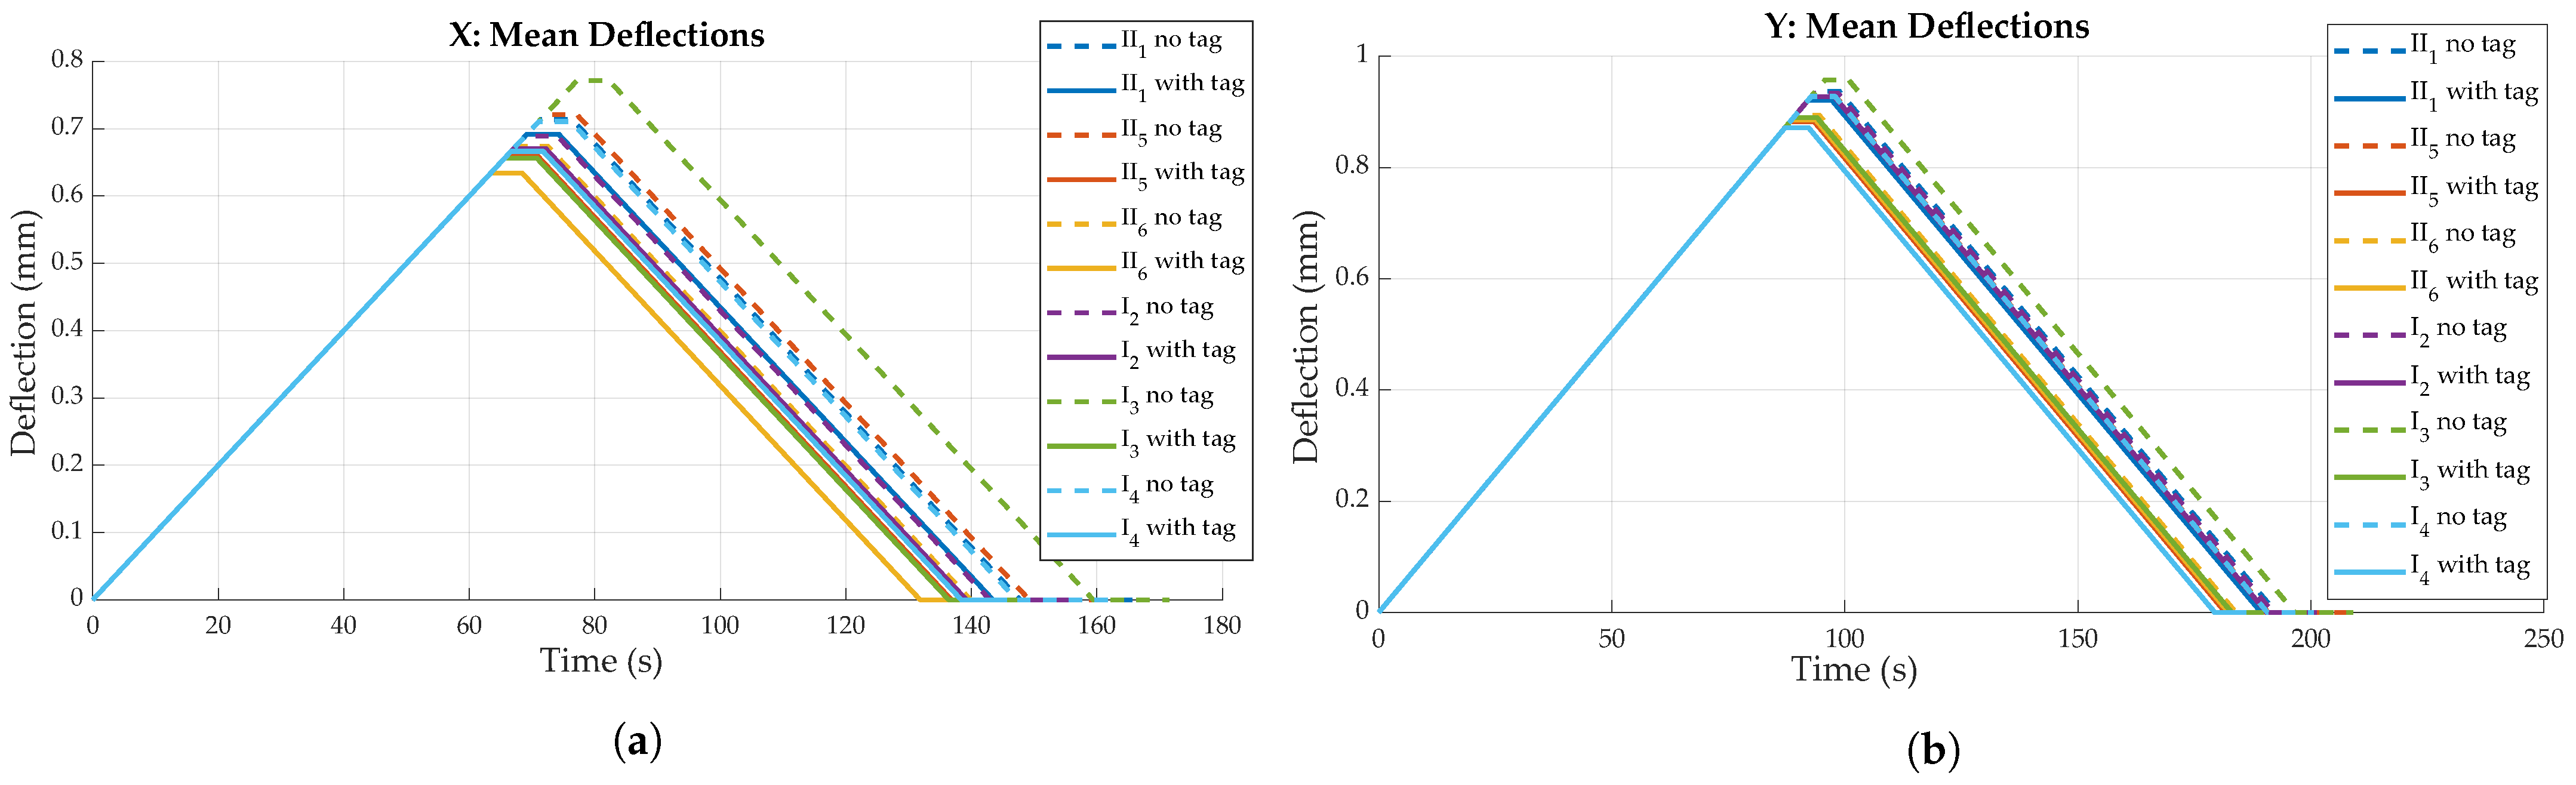
4.2.1. Deflection and Strain Measurements
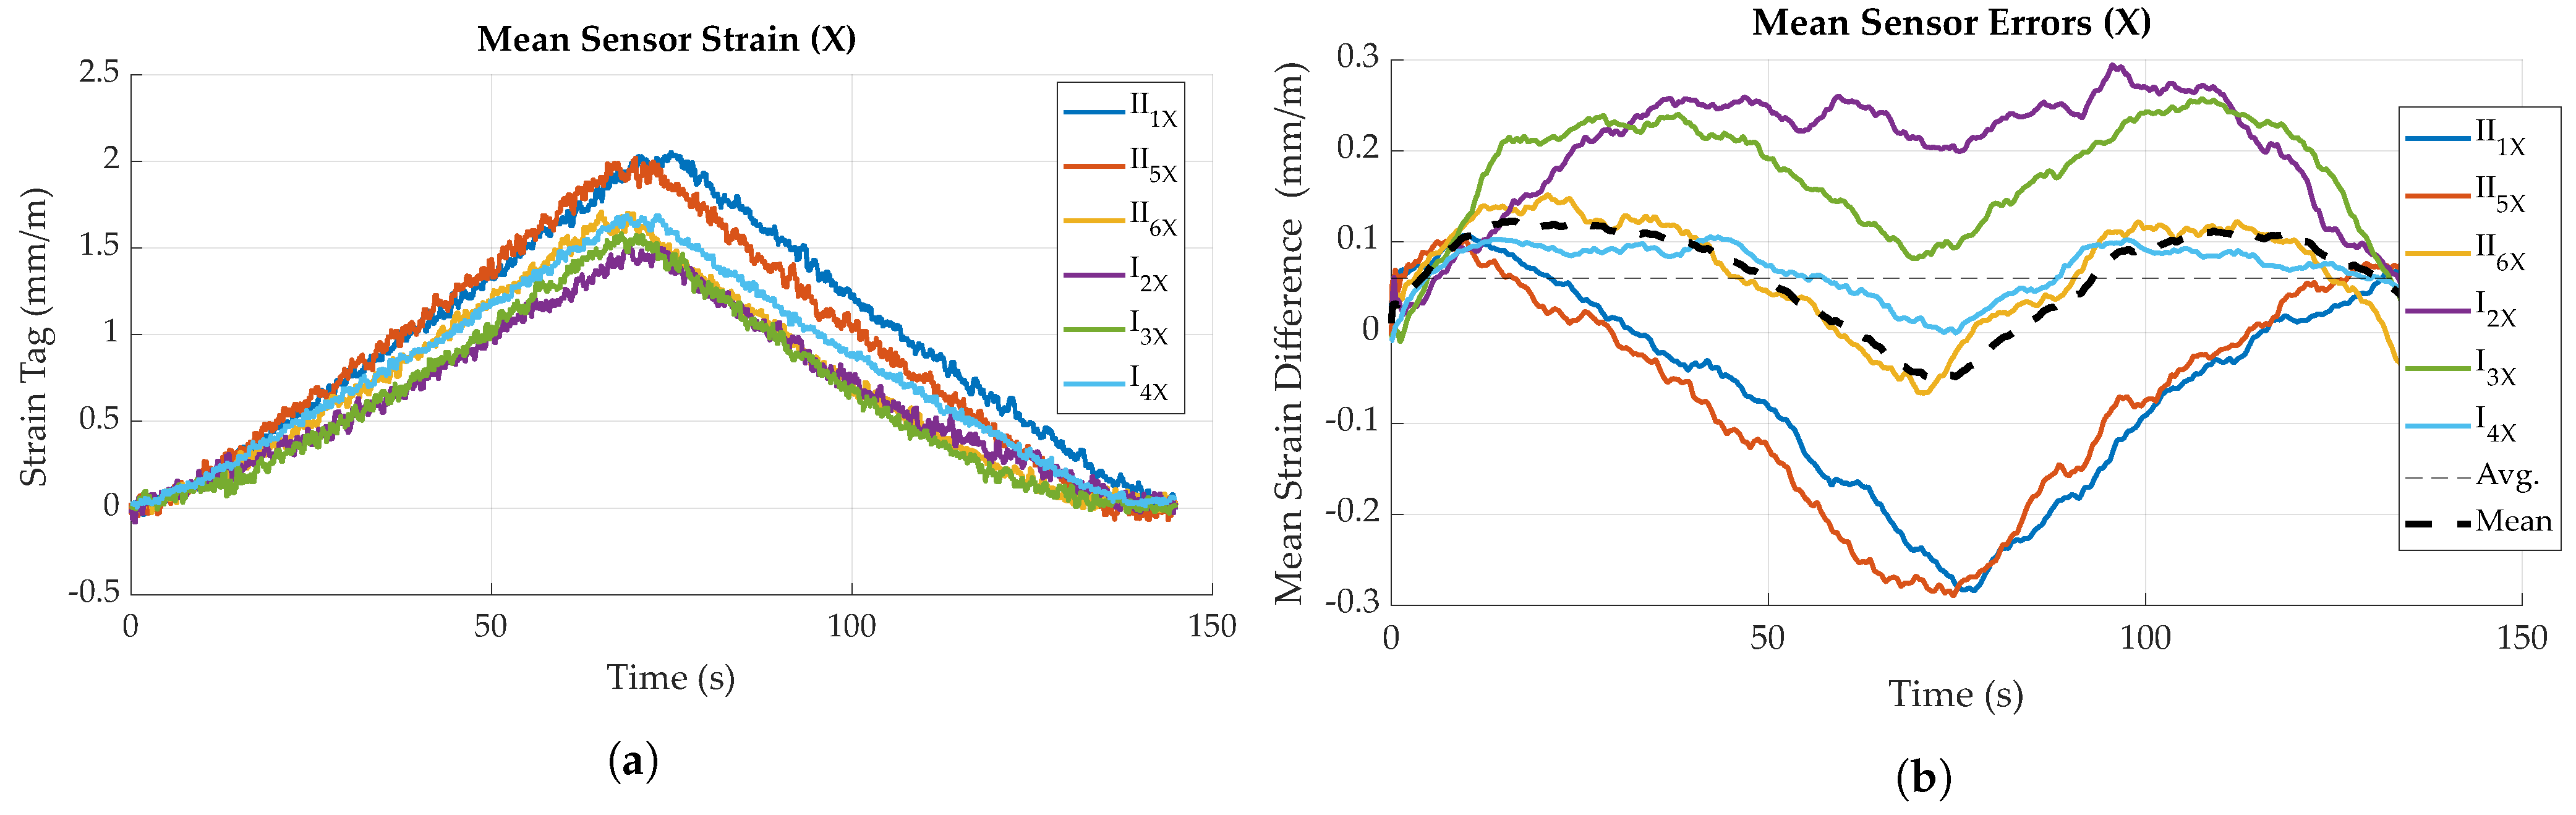
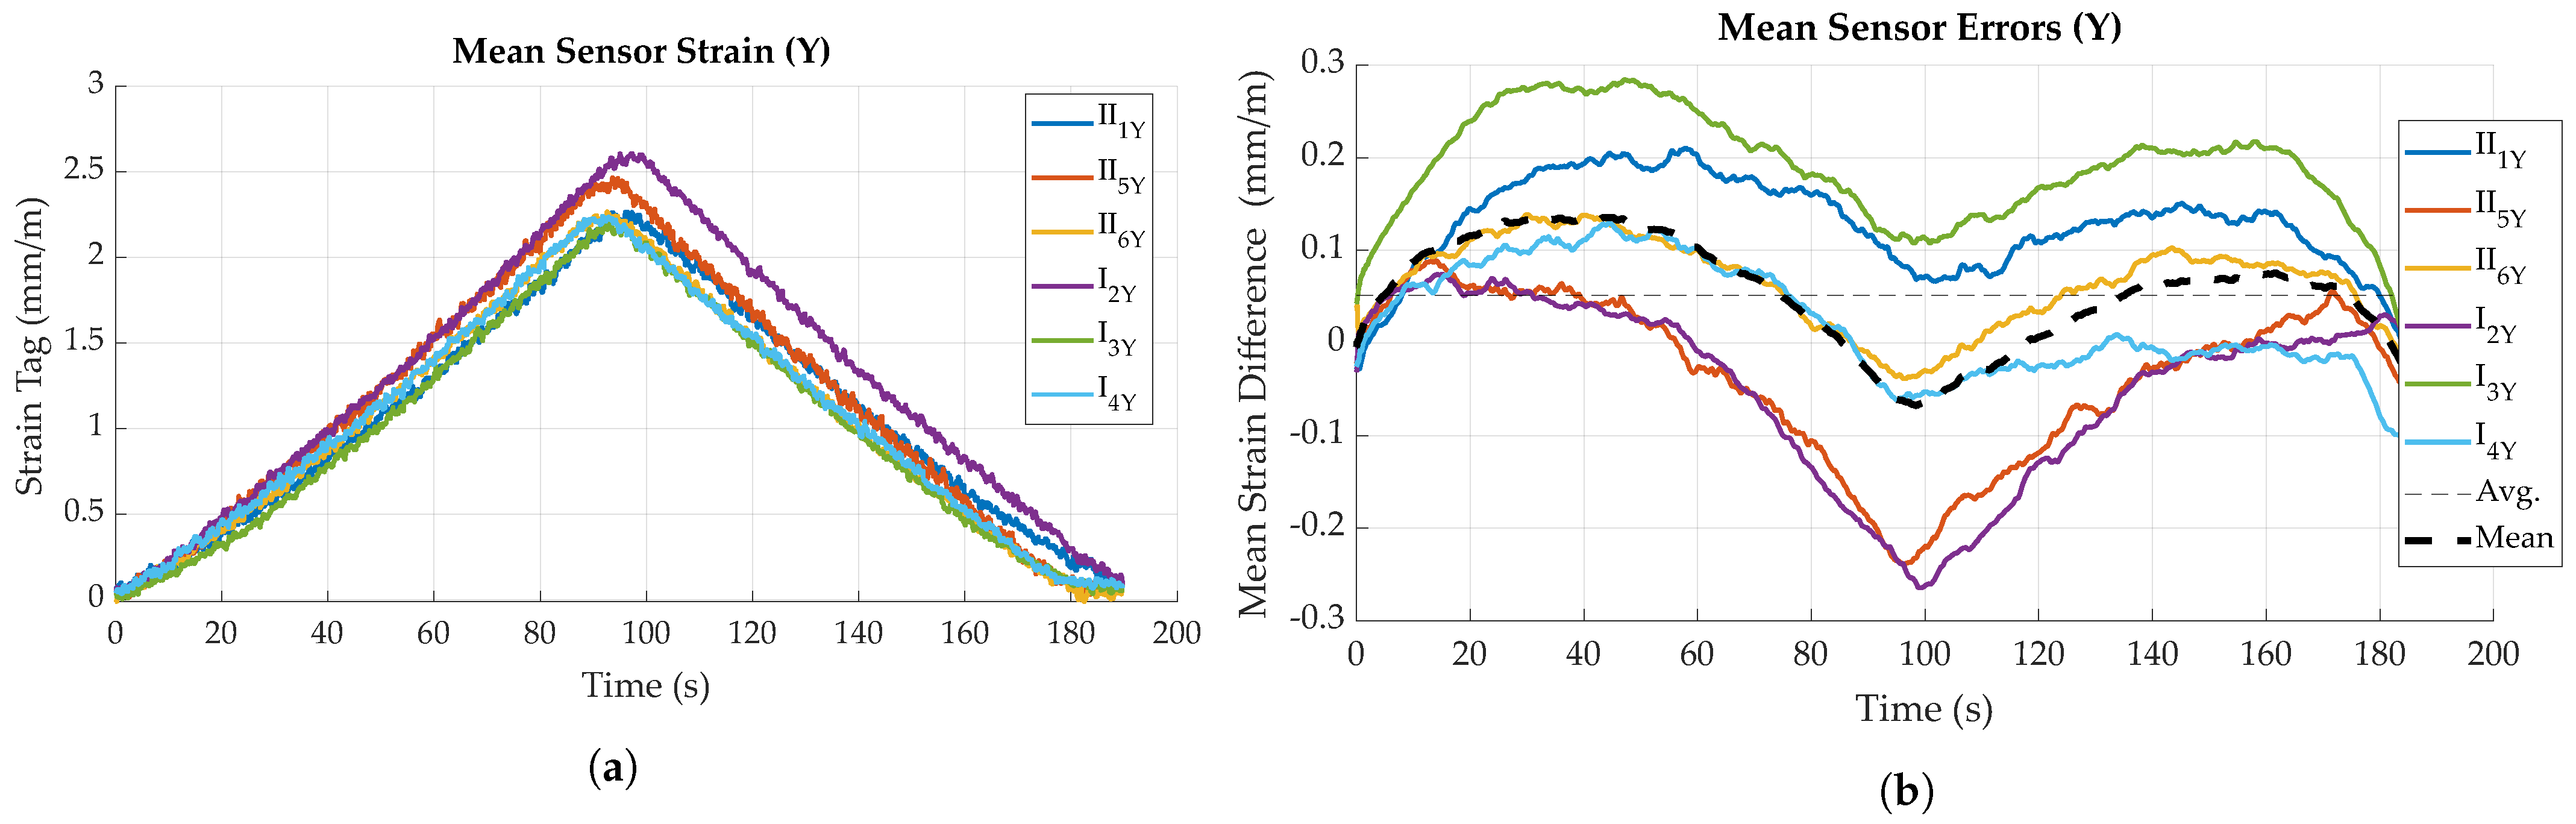
4.2.2. Sensor Error
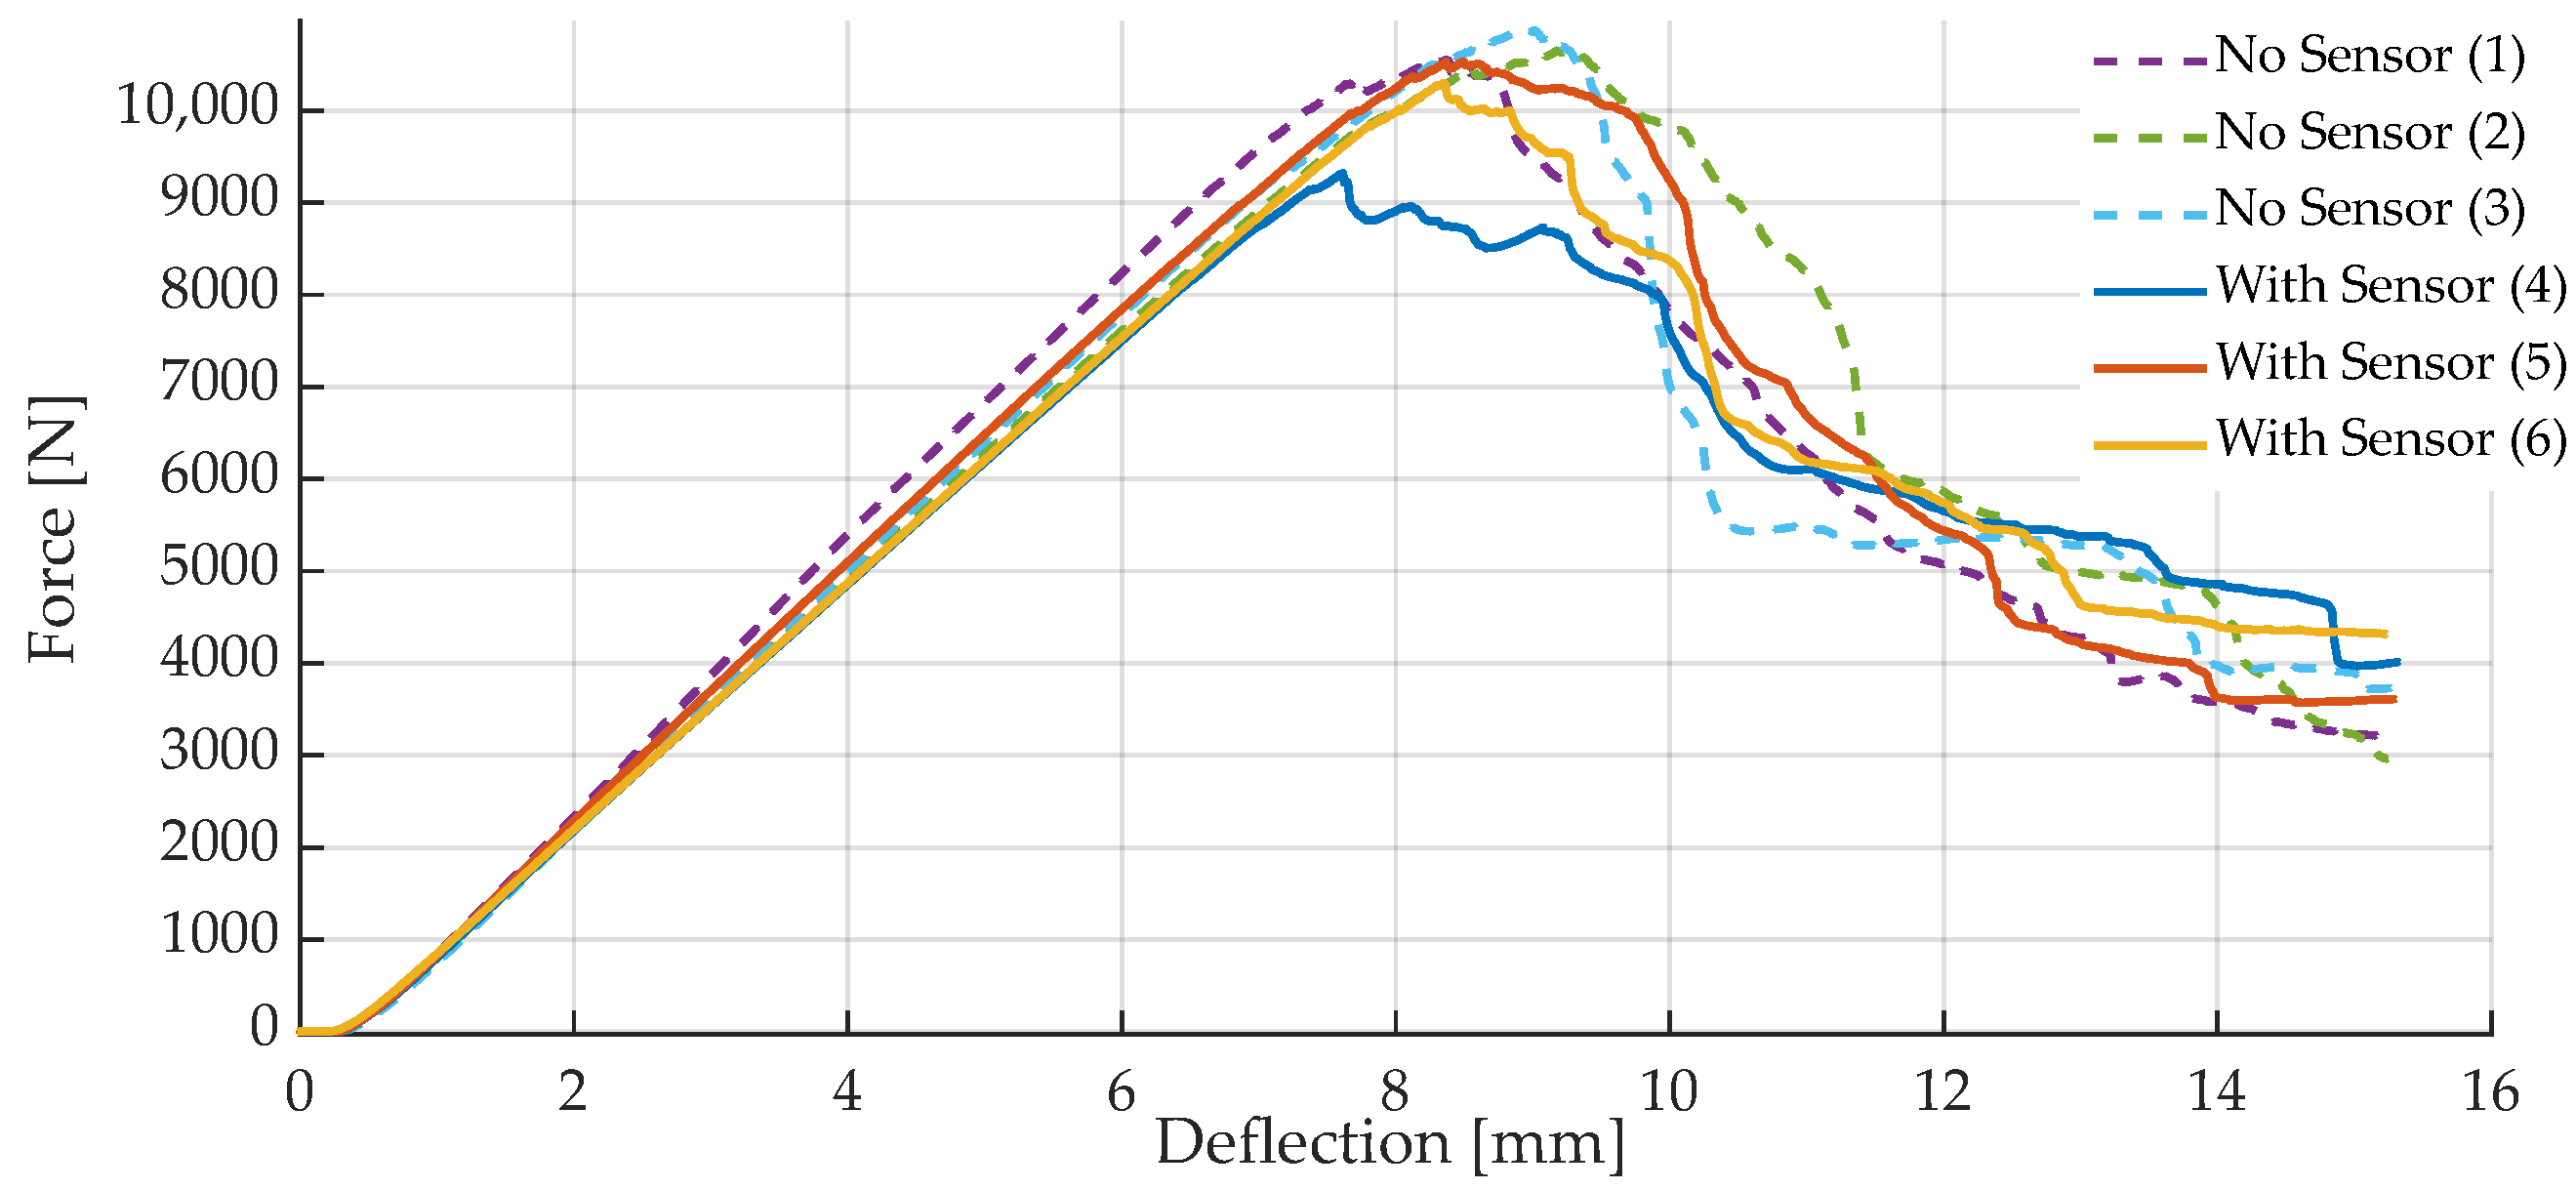
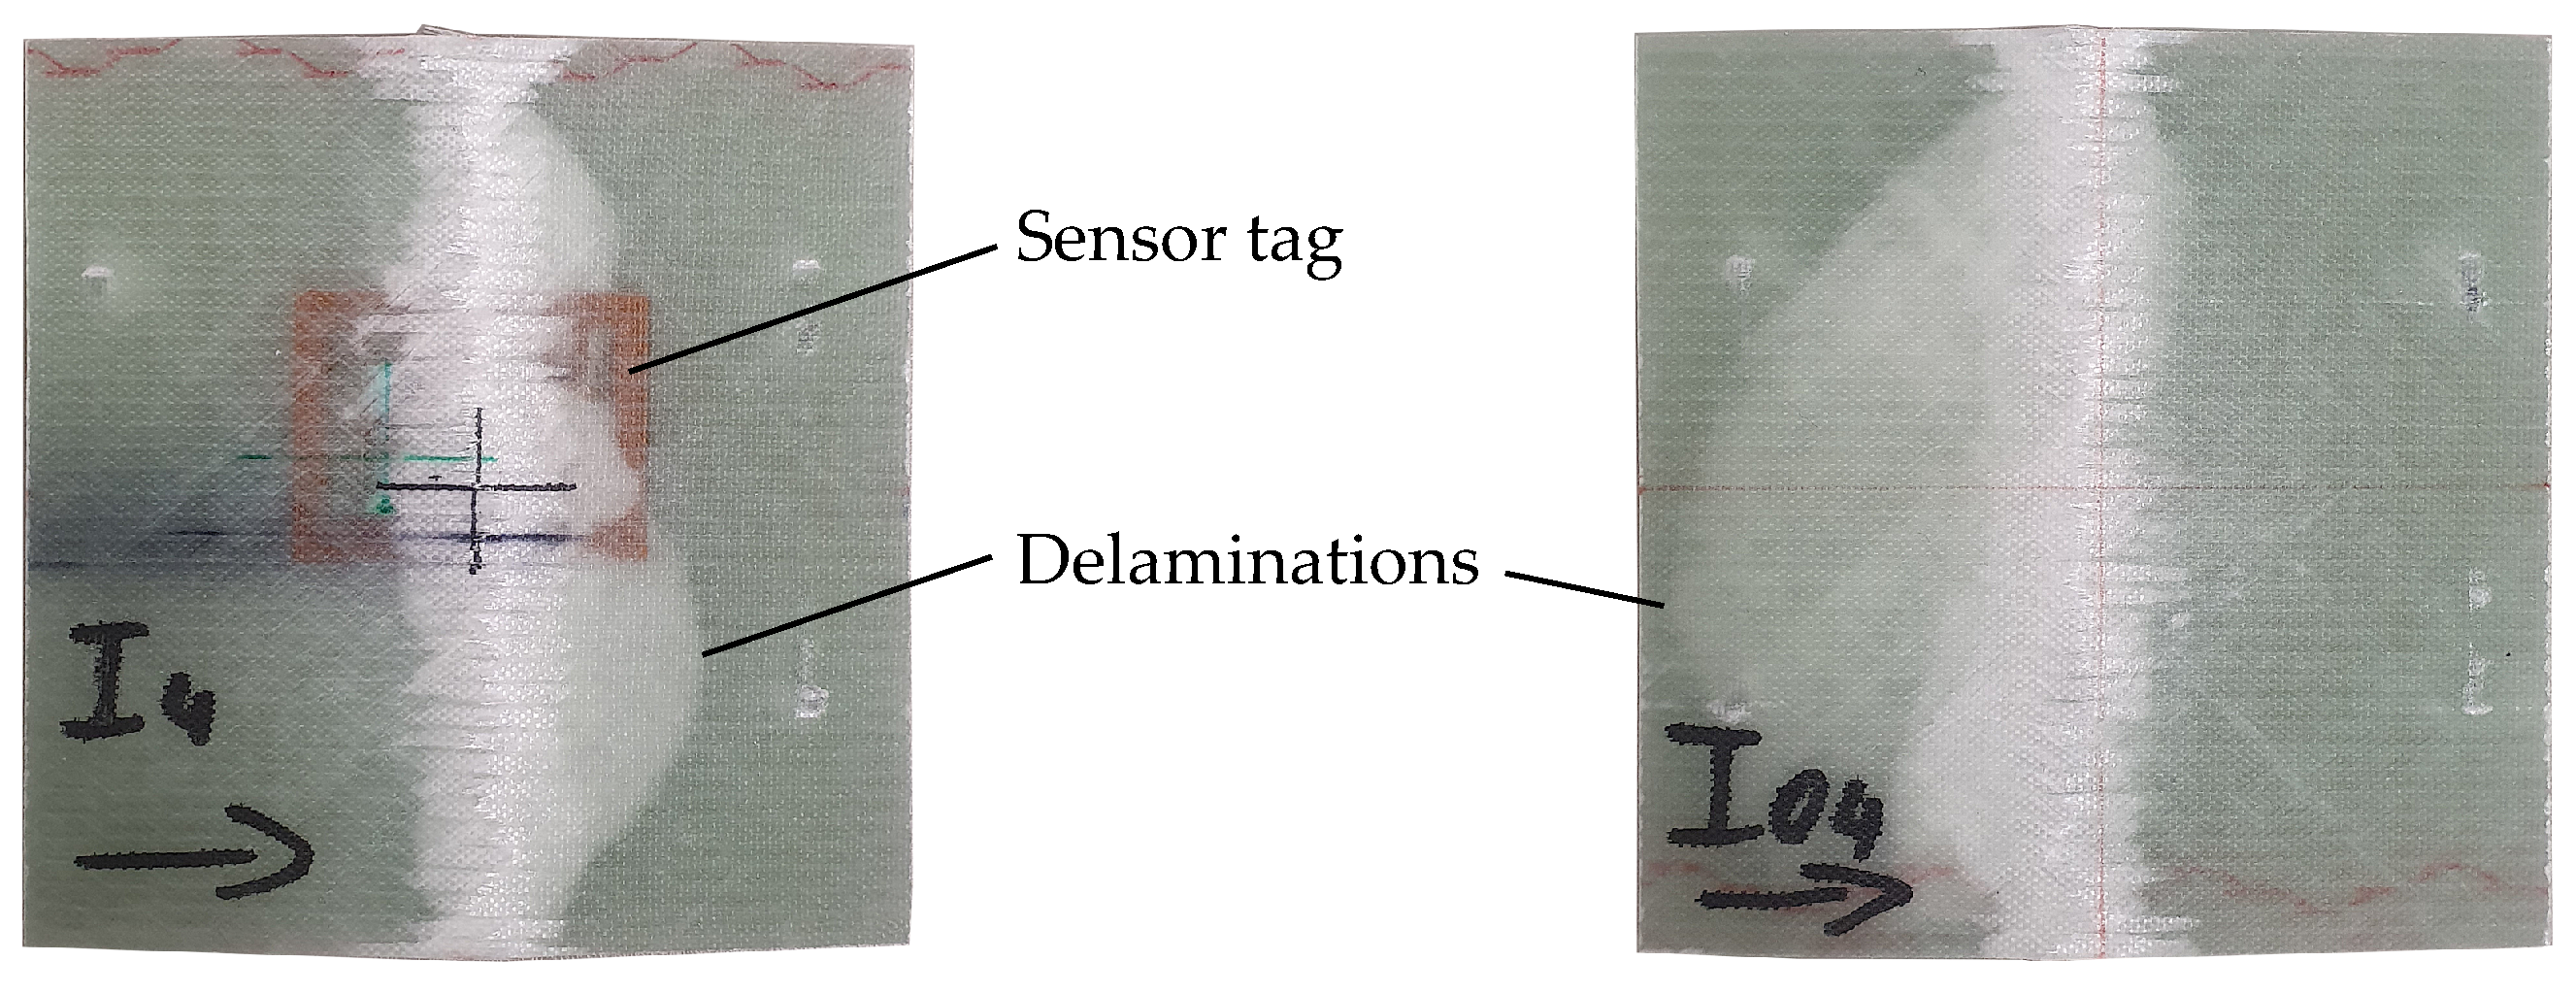
4.3. Tag Influence on FRP Strength
Results
5. Investigation of System Limitations
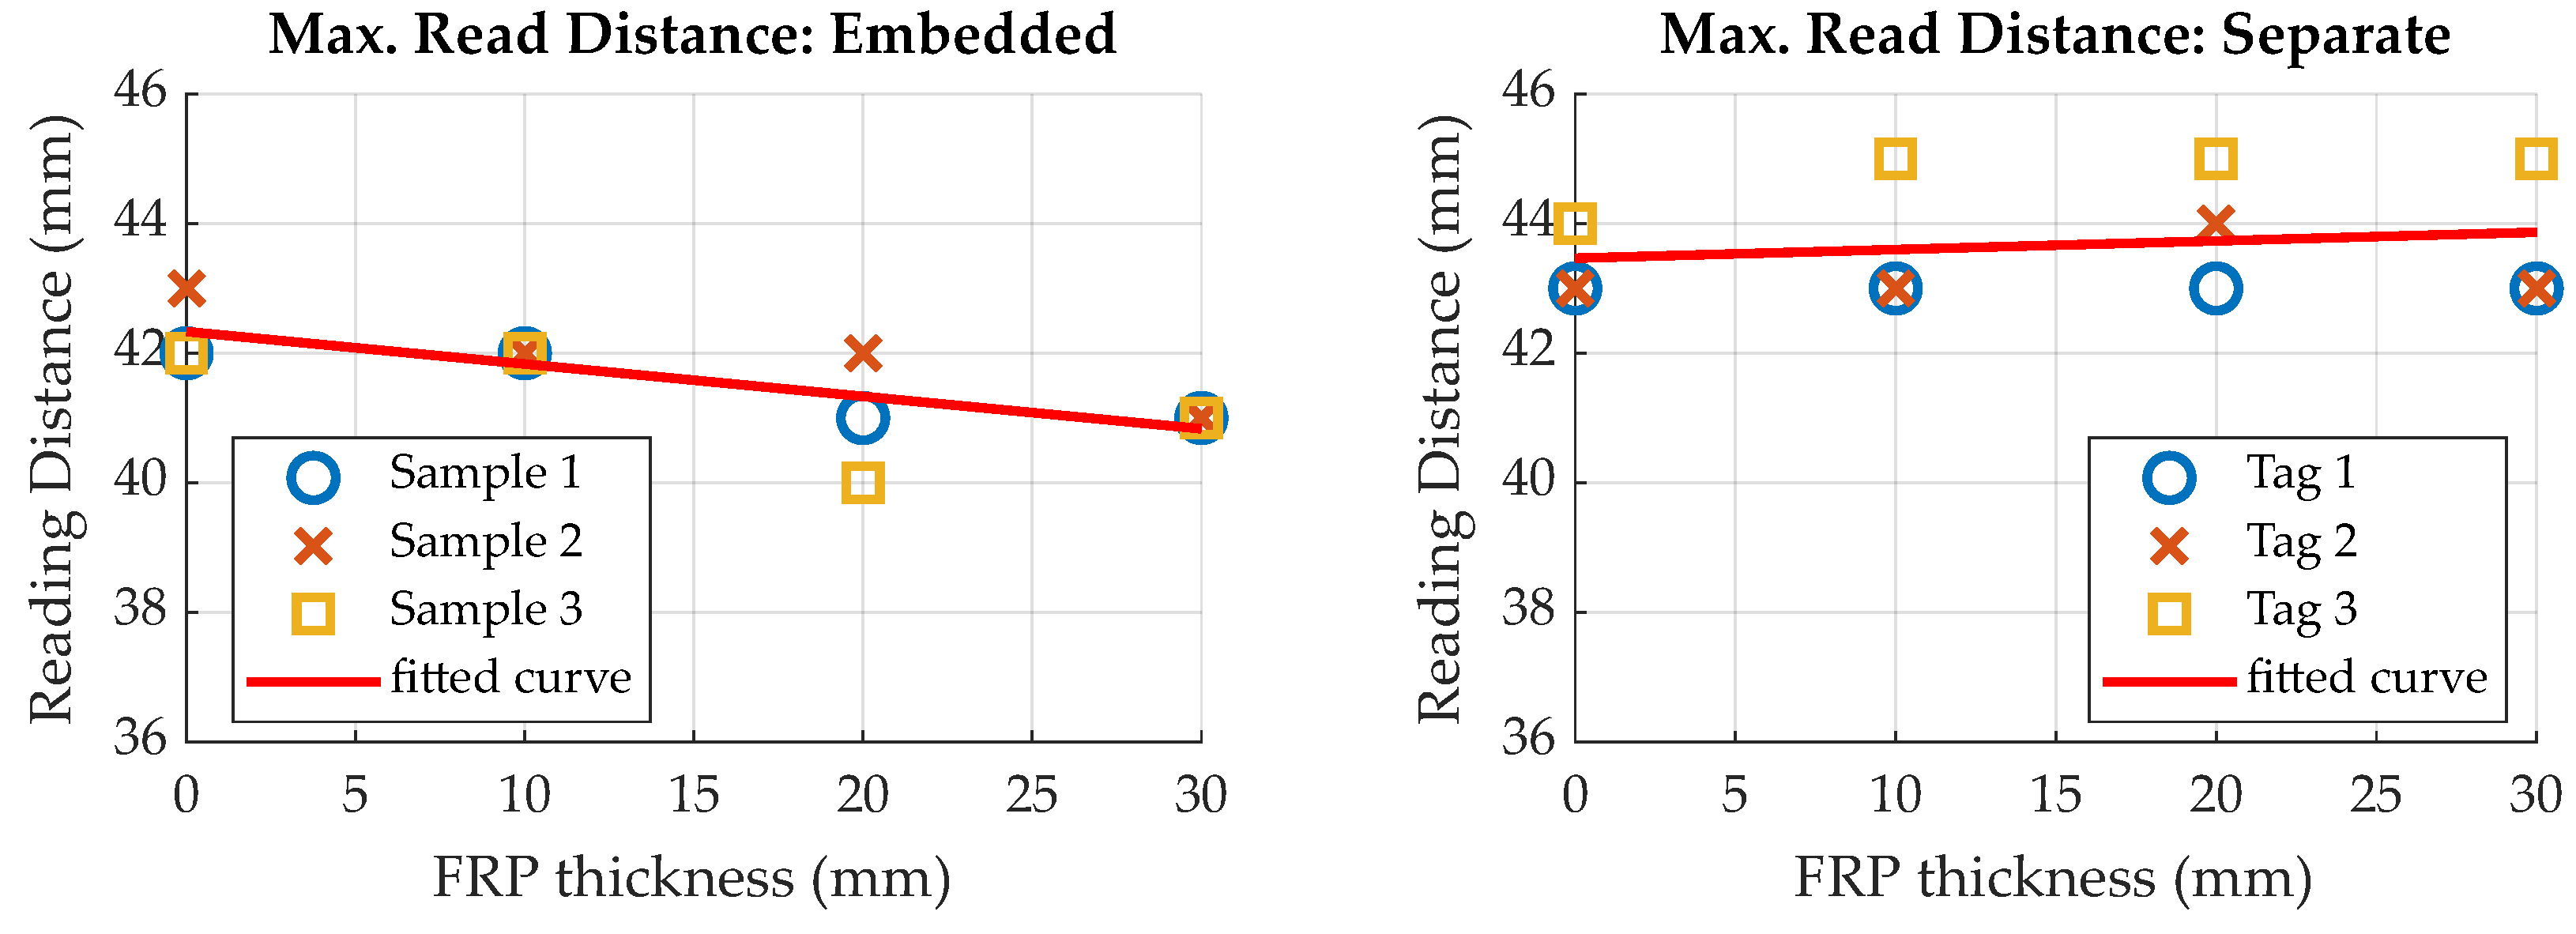
5.1. Maximum Reading Distance
5.2. Operating Temperature
6. Discussion
7. Conclusions
Author Contributions
Funding
Institutional Review Board Statement
Informed Consent Statement
Data Availability Statement
Acknowledgments
Conflicts of Interest
Abbreviations
| ADC | Analog to Digital Converter |
| DEA | Dielectric Analysis |
| DSC | Differential Scanning Calorimetry |
| EDTR | Electric Time Domain Reflectometry |
| FPCB | Flexible Printed Circuit Board |
| FRP | Fiber Reinforced Polymer |
| FBG | Fiber Bragg Grating |
| GFRP | Glass Fiber Reinforced Polymer |
| GPIO | General Purpose Input Output |
| IC | Integrated Circuit |
| INA | Instrumentation Amplifier |
| I2C | Inter-Integrated Circuit |
| PCB | Printed Circuit Board |
| PLC | Programmable Logic Controller |
| SHM | Structural Health Monitoring |
| RSSI | Received Signal Strength |
| SPI | Serial Peripheral Interface |
| RFID | Radio Frequency Identification |
| VARI | Vacuum Assisted Resin Infusion |
| RTM | Resin Transfer Molding |
References
- Schürmann, H. Konstruieren Mit Faser-Kunststoff-Verbunden; Springer: Berlin/Heidelberg, Germany, 2007. [Google Scholar]
- Wu, J.; Zhu, Y.; Li, C. Experimental Investigation of Fatigue Capacity of Bending-Anchored CFRP Cables. Polymers 2023, 15, 2483. [Google Scholar] [CrossRef] [PubMed]
- Soner, M.; Tanoglu, M.; Guven, N.; Karaagac, M.; Akyali, R.; Aksoy, O.; Erdogus, T.; Kanbolat, A. Design and Fatigue Life Comparison of Steel and Composite Leaf Spring; 2012-01-0944, SAE International: Warrendale, PA, USA, 2012. [Google Scholar] [CrossRef] [Green Version]
- Bathias, C. Fatigue of Composite Materials. In Fatigue of Materials and Structures, 1st ed.; Bathias, C., Pineau, A., Eds.; Wiley: Hoboken, NJ, USA, 2013; pp. 179–204. [Google Scholar] [CrossRef]
- Neitzel, M.; Mitschang, P.; Breuer, U. (Eds.) Handbuch Verbundwerkstoffe: Werkstoffe, Verarbeitung, Anwendung; Hanser: München, Germany, 2014. [Google Scholar]
- ISO/IEC 14443-1; Cards and Security Devices for Personal Identification—Contactless Proximity Objects. International Organization for Standardization: Geneva, Switzerland, 2018.
- Lodeiro, M.J.; Mulligan, D.R. Cure Monitoring Techniques for Polymer Composites, Adhesives and Coatings; National Physical Laboratory: Teddington, UK, 2005. [Google Scholar]
- Konstantopoulos, S.; Fauster, E.; Schledjewski, R. Monitoring the production of FRP composites: A review of in-line sensing methods. Express Polym. Lett. 2014, 8, 823–840. [Google Scholar] [CrossRef]
- Kahali Moghaddam, M.; Breede, A.; Chaloupka, A.; Bödecker, A.; Habben, C.; Meyer, E.M.; Brauner, C.; Lang, W. Design, fabrication and embedding of microscale interdigital sensors for real-time cure monitoring during composite manufacturing. Sens. Actuators A Phys. 2016, 243, 123–133. [Google Scholar] [CrossRef]
- Twardowski, T.E.; Lin, S.E.; Geil, P.H. Curing in Thick Composite Laminates: Experiment and Simulation. J. Compos. Mater. 1993, 27, 216–250. [Google Scholar] [CrossRef]
- Ai, Q. Variotherme Verarbeitung von Epoxidharz zur Zyklusverkürzung im RTM Prozess. Ph.D. Thesis, Universitätsverlag der TU Berlin, Berlin, Germany, 2018. [Google Scholar] [CrossRef]
- Hübner, M. Überwachung von Faserverbundwerkstoffen mit Miniaturisiertenflexiblen Interdigital Sensoren. Ph.D. Thesis, Universität Bremen, Bremen, Germany, 2019. [Google Scholar]
- Lee, H.L. The Handbook of Dielectric Analysis and Cure Monitoring, 2nd ed.; Lambient Technologies, LLC.: Cambridge, MA, USA, 2019. [Google Scholar]
- Netzsch Geraetebau GmbH. DEA 288 Ionic—Dielektrische Analyse des Aushärteverhaltens Methode, Technik, Applikationen; Netzsch Geraetebau GmbH: Selb, Germany, 2022; Available online: https://analyzing-testing.netzsch.com/_Resources/Persistent/5/5/b/0/55b048a7ba40c0a196b1ddc94a753609956d4b6c/DEA_288_Ionic_de_web.pdf (accessed on 3 June 2022).
- Dimassi, A.; Vargas Gleason, M.G.; Hübner, M.; Herrmann, A.S.; Lang, W. Using piezoresistive pressure sensors for resin flow monitoring in wind turbine blades. Mater. Today Proc. 2020, 34, 140–148. [Google Scholar] [CrossRef]
- Kuang, K.; Zhang, L.; Cantwell, W.; Bennion, I. Process monitoring of aluminum-foam sandwich structures based on thermoplastic fibre–metal laminates using fibre Bragg gratings. Compos. Sci. Technol. 2005, 65, 669–676. [Google Scholar] [CrossRef]
- Jung, K.; Jin Kang, T. Cure Monitoring and Internal Strain Measurement of 3-D Hybrid Braided Composites using Fiber Bragg Grating Sensor. J. Compos. Mater. 2007, 41, 1499–1519. [Google Scholar] [CrossRef]
- Tsai, L.; Cheng, T.-C.; Lin, C.-L.; Chiang, C.-C. Application of the embedded optical fiber Bragg grating sensors in curing monitoring of Gr/epoxy laminated composites. Smart Sens. Phenom. Technol. Netw. Syst. 2009, 7293, 729307. [Google Scholar] [CrossRef]
- Hübner, M.; Lang, W. Online Monitoring of Composites with a Miniaturized Flexible Combined Dielectric and Temperature Sensor. In Proceedings of the Eurosensors 2017, Paris, France, 3–6 September 2017; p. 627. [Google Scholar] [CrossRef]
- Tuncol, G.; Danisman, M.; Kaynar, A.; Sozer, E.M. Constraints on monitoring resin flow in the resin transfer molding (RTM) process by using thermocouple sensors. Compos. Part Appl. Sci. Manuf. 2007, 38, 1363–1386. [Google Scholar] [CrossRef]
- Wang, P.; Molimard, J.; Drapier, S.; Vautrin, A.; Minni, J. Monitoring the resin infusion manufacturing process under industrial environment using distributed sensors. J. Compos. Mater. 2012, 46, 691–706. [Google Scholar] [CrossRef] [Green Version]
- Rocha, H.; Semprimoschnig, C.; Nunes, J. Sensors for process and structural health monitoring of aerospace composites: A review. Eng. Struct. 2021, 237, 112231. [Google Scholar] [CrossRef]
- Dimassi, M.A.; John, M.; Herrmann, A.S. Investigation of the temperature dependent impact behaviour of pin reinforced foam core sandwich structures. Compos. Struct. 2018, 202, 774–782. [Google Scholar] [CrossRef]
- Kinet, D.; Mégret, P.; Goossen, K.; Qiu, L.; Heider, D.; Caucheteur, C. Fiber Bragg Grating Sensors toward Structural Health Monitoring in Composite Materials: Challenges and Solutions. Sensors 2014, 14, 7394. [Google Scholar] [CrossRef] [Green Version]
- Montazerian, H.; Rashidi, A.; Milani, A.S.; Hoorfar, M. Integrated Sensors in Advanced Composites: A Critical Review. Crit. Rev. Solid State Mater. Sci. 2020, 45, 187–238. [Google Scholar] [CrossRef]
- Grellmann, W.; Seidler, S.; Altstädt, V. (Eds.) Kunststoffprüfung; Hanser: München, Germany, 2015. [Google Scholar]
- Tuloup, C.; Harizi, W.; Aboura, Z.; Meyer, Y.; Khellil, K.; Lachat, R. On the use of in-situ piezoelectric sensors for the manufacturing and structural health monitoring of polymer-matrix composites: A literature review. Compos. Struct. 2019, 215, 127–149. [Google Scholar] [CrossRef]
- Lang, W. Sensors and Measurement Systems; River Publishers Series in Electronic Materials and Devices; River Publishers: Aalborg, Denmark, 2019. [Google Scholar]
- Dumstorff, G. Modellierung und Experimentelle Untersuchung von Materialintegrierten Sensoren. Ph.D. Thesis, University of Bremen, Bremen, Germany, 2015. [Google Scholar]
- Horoschenkoff, A. (Ed.) Structural Integration of Strain Gages; Hottinger Baldwin Messtechnik GmbH: Vienna, Austria, 2006. [Google Scholar]
- Zhou, G.; Sim, L.M. Damage detection and assessment in fibre-reinforced composite structures with embedded fibre optic sensors-review. Smart Mater. Struct. 2002, 11, 925–939. [Google Scholar] [CrossRef]
- Pereira, G.; Frias, C.; Faria, H.; Frazão, O.; Marques, A. On the improvement of strain measurements with FBG sensors embedded in unidirectional composites. Polym. Test. 2013, 32, 99–105. [Google Scholar] [CrossRef] [Green Version]
- Tang, H.Y.; Winkelmann, C.; Lestari, W.; La Saponara, V. Composite Structural Health Monitoring Through Use of Embedded PZT Sensors. J. Intell. Mater. Syst. Struct. 2011, 22, 739–755. [Google Scholar] [CrossRef]
- Finkenzeller, K. RFID-Handbuch: Grundlagen und Praktische Anwendungen von Transpondern, Kontaktlosen Chipkarten und NFC; Hanser: München, Germany, 2015. [Google Scholar]
- Zhang, J.; Tian, G.; Marindra, A.; Sunny, A.; Zhao, A. A Review of Passive RFID Tag Antenna-Based Sensors and Systems for Structural Health Monitoring Applications. Sensors 2017, 17, 265. [Google Scholar] [CrossRef] [PubMed]
- Groh, J.; Lee, W.B.; Schür, J.; Distler, F.; Vossiek, M. Compact Substrate Integrated Wireless Cure Monitoring Sensor for Epoxy Resin. In Proceedings of the 2018 48th European Microwave Conference (EuMC), Madrid, Spain, 23–27 September 2018; pp. 243–246. [Google Scholar] [CrossRef]
- Rajawat, S.; Hübner, M.; Kempen, L.; Lang, W. Flexible passive LC resonator for wireless measurement during curing of thermosets. J. Phys. Conf. Ser. 2021, 1837, 012001. [Google Scholar] [CrossRef]
- Salas, M.; Focke, O.; Herrmann, A.S.; Lang, W. Wireless Power Transmission for Structural Health Monitoring of Fiber-Reinforced-Composite Materials. IEEE Sens. J. 2014, 14, 2171–2176. [Google Scholar] [CrossRef]
- Gleason, M.G.V.; Jedermann, R.; Dimassi, A.; Lang, W. Wireless Piezoresistive Pressure Sensors Used for Quality Control in Glass Fiber Composite Laminates. In Proceedings of the 2018 IEEE Sensors, New Delhi, India, 28–31 October 2018; pp. 1–4. [Google Scholar] [CrossRef]
- Vargas Gleason, M.G.; Jedermann, R.; Dimassi, A.; Lang, W. Embedded Wireless Sensor Systems for Resin Flow Monitoring in Glass and Carbon Fiber Composites. IEEE Sens. J. 2019, 19, 10654–10661. [Google Scholar] [CrossRef]
- Veigt, M.; Hardi, E.; Koerdt, M.; Herrmann, A.S.; Freitag, M. Curing Transponder—Integrating RFID transponder into glass fiber-reinforced composites to monitor the curing of the component. Procedia Manuf. 2018, 24, 94–99. [Google Scholar] [CrossRef]
- Hardi, E.; Veigt, M.; Koerdt, M.; Herrmann, A.S.; Freitag, M. Monitoring of the vacuum infusion process by integrated RFID transponder. Procedia Manuf. 2020, 52, 20–25. [Google Scholar] [CrossRef]
- Bertram, L.; Brink, M.; Thoben, K.D.; Lang, W. A Passive, Wireless Sensor Node for Material-Integrated Strain and Temperature Measurements in Glass Fiber Reinforced Composites. In Advances in System-Integrated Intelligence, Proceedings of the 6th International Conference on System-Integrated Intelligence (SysInt 2022), Genova, Italy, 7–9 September 2022; Springer: Cham, Switzerland, 2023; Volume 546, pp. 182–193. [Google Scholar] [CrossRef]
- NXP Semiconductors B.V. NXP—Therapy Adherence Resistive Monitor. NFC Sensor Tag 2018, NXP Semiconductors B.V. Available online: https://www.nxp.com/docs/en/data-sheet/NHS3152.pdf (accessed on 26 June 2023).
- MicroMeasurements; Vishay Precision Group. Datasheet S5020—Transducer-Class® Strain Gages with Advanced Sensors Technology. 2019. Available online: https://docs.micro-measurements.com/?id=2622 (accessed on 4 April 2022).
- Texas Instruments Inc. TI-INA333 Micro-Power (50uA), Zero-Drift, Rail-to-Rail out Instrumentation Amplifier. 2015. Available online: https://www.ti.com/lit/ds/symlink/ina333.pdf (accessed on 15 October 2022).
- Texas Instruments Inc. TI—ADS7052—14-Bit, 1-MSPS, Single-EndedInput, Small-Size, Low-PowerSAR ADC. 2015. Available online: https://www.ti.com/lit/ds/symlink/ads7052.pdf (accessed on 30 April 2021).
- Texas Instruments Inc. TMP117 High-Accuracy, Low-Power, Digital Temperature Sensor with SMBus™- and I2C-Compatible Interface. 2021. Available online: https://www.ti.com/lit/ds/symlink/tmp117.pdf (accessed on 16 June 2022).
- Domininghaus, H.; Elsner, P.; Hirth, T.; Altmann, O. Die Kunststoffe und Ihre Eigenschaften; Springer: Berlin/Heidelberg, Germany, 2005. [Google Scholar]
- Hexion Inc. EPIKOTE™ Resin MGS BPR 135G-Series and EPIKURE™ Curing Agent MGS BPH 134G-137GF. 2020. Available online: https://www.hexion.com/en-US/product/–archive–epikote-resin-mgs-bpr-135g-series-and-epikure-curing-agent-mgs-bph-134g-137gf (accessed on 4 July 2023).
- Texas Instruments Inc. TI-Passive NFC Temperature Patch Reference Design. 2016. Available online: https://www.ti.com/lit/ug/tidubt8/tidubt8.pdf (accessed on 4 July 2023).
- Bertram, L.; Brink, M.; Lang, W. Material-Integrated Temperature Sensors for Wireless Monitoring of Infusion and Curing in Composite Production; AMA Service GmbH: Nuremberg, Germany, 2023; pp. 261–263. [Google Scholar] [CrossRef]
- Ohlendorf, J.H.; Richrath, M.; Franke, J.; Brink, M.; Thoben, K.D. Towards automation of wind energy rotor blade production: A review of challenges and application examples. Adv. Manuf. Polym. Compos. Sci. 2020, 6, 173–190. [Google Scholar] [CrossRef]
- SAERTEX GmbH. SAERfix® EP//SAERfix® uP KLEBEMATERIALIEN—Produktflyer. 2022. Available online: https://www.saertex.com/de/service/downloads/saerfix/file/3a01f3af1d97f092dedccf5256905b94/0143-14-066_SAERTEX_Produktflyer_SAERfix_DEU.pdf (accessed on 9 November 2022).
- MicroSensys GmbH. M30 RFID HEAD Datasheet. 2020. Available online: https://www.microsensys.de/fileadmin/user_upload/pdf-dateien/ds_reader_industry/M30head-05.pdf (accessed on 25 November 2022).
- Bertram, L.; Brink, M.; Lang, W. A Wireless Strain Sensor for Measurement in Composites. In Proceedings of the Eurosensors XXXIV, Lecce, Italy, 10–13 September 2023. (Accepted for presentation). [Google Scholar]


| Error | X (mm/m) | Y (mm/m) |
|---|---|---|
| Average error (overall) | +0.059 | +0.049 |
| Max. positive | +0.290 | +0.284 |
| Max. negative | −0.290 | −0.264 |
| Specimen | Max. Force (kN) | Specimen Nr. |
|---|---|---|
| No Sensor (1) | 10.3 kN | I02 |
| No Sensor (2) | 10.4 kN | I03 |
| No Sensor (3) | 10.5 kN | I04 |
| With Sensor (4) | 9.2 kN | I2 |
| With Sensor (5) | 10.4 kN | I3 |
| With Sensor (6) | 10.3 kN | I4 |
Disclaimer/Publisher’s Note: The statements, opinions and data contained in all publications are solely those of the individual author(s) and contributor(s) and not of MDPI and/or the editor(s). MDPI and/or the editor(s) disclaim responsibility for any injury to people or property resulting from any ideas, methods, instructions or products referred to in the content. |
© 2023 by the authors. Licensee MDPI, Basel, Switzerland. This article is an open access article distributed under the terms and conditions of the Creative Commons Attribution (CC BY) license (https://creativecommons.org/licenses/by/4.0/).
Share and Cite
Bertram, L.; Brink, M.; Lang, W. Wireless, Material-Integrated Sensors for Strain and Temperature Measurement in Glass Fibre Reinforced Composites. Sensors 2023, 23, 6375. https://doi.org/10.3390/s23146375
Bertram L, Brink M, Lang W. Wireless, Material-Integrated Sensors for Strain and Temperature Measurement in Glass Fibre Reinforced Composites. Sensors. 2023; 23(14):6375. https://doi.org/10.3390/s23146375
Chicago/Turabian StyleBertram, Lukas, Michael Brink, and Walter Lang. 2023. "Wireless, Material-Integrated Sensors for Strain and Temperature Measurement in Glass Fibre Reinforced Composites" Sensors 23, no. 14: 6375. https://doi.org/10.3390/s23146375
APA StyleBertram, L., Brink, M., & Lang, W. (2023). Wireless, Material-Integrated Sensors for Strain and Temperature Measurement in Glass Fibre Reinforced Composites. Sensors, 23(14), 6375. https://doi.org/10.3390/s23146375