

A Comprehensive Study on Measurement Accuracy of Distributed Fiber Optic Sensors Embedded within Capillaries of Solid Structures
Abstract
:1. Introduction
2. Methodology
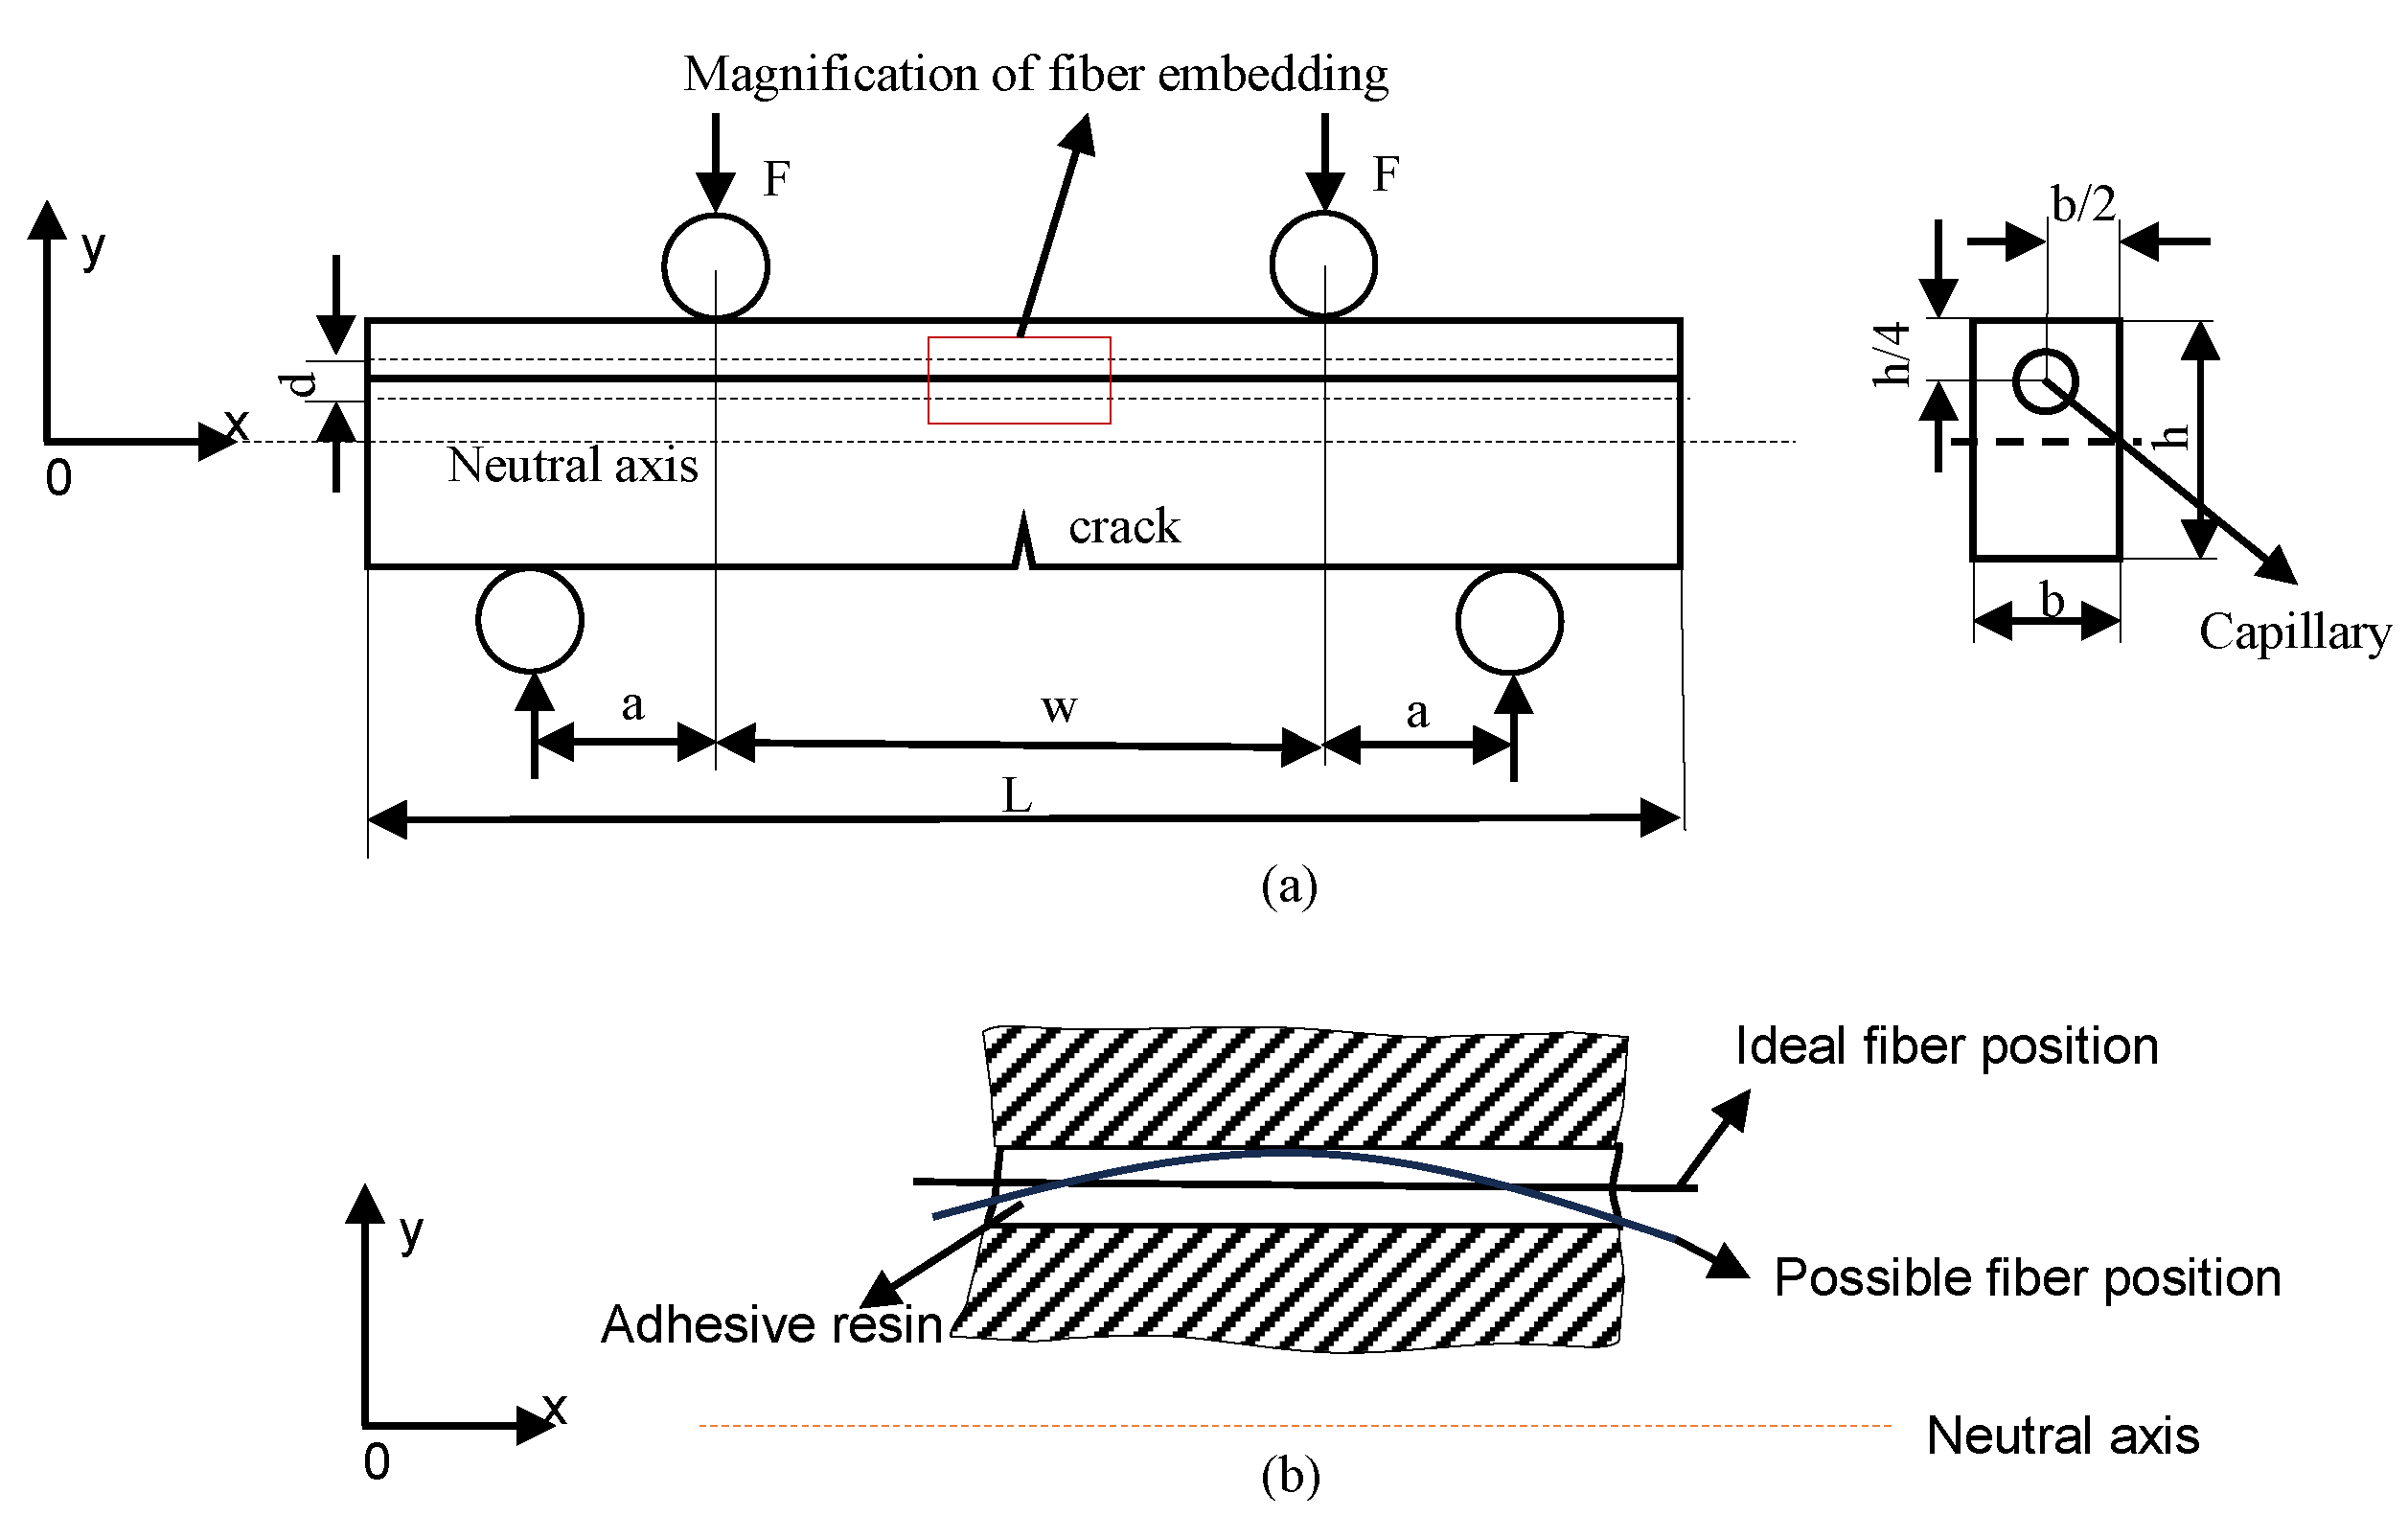
2.1. Reference Specimen Geometry
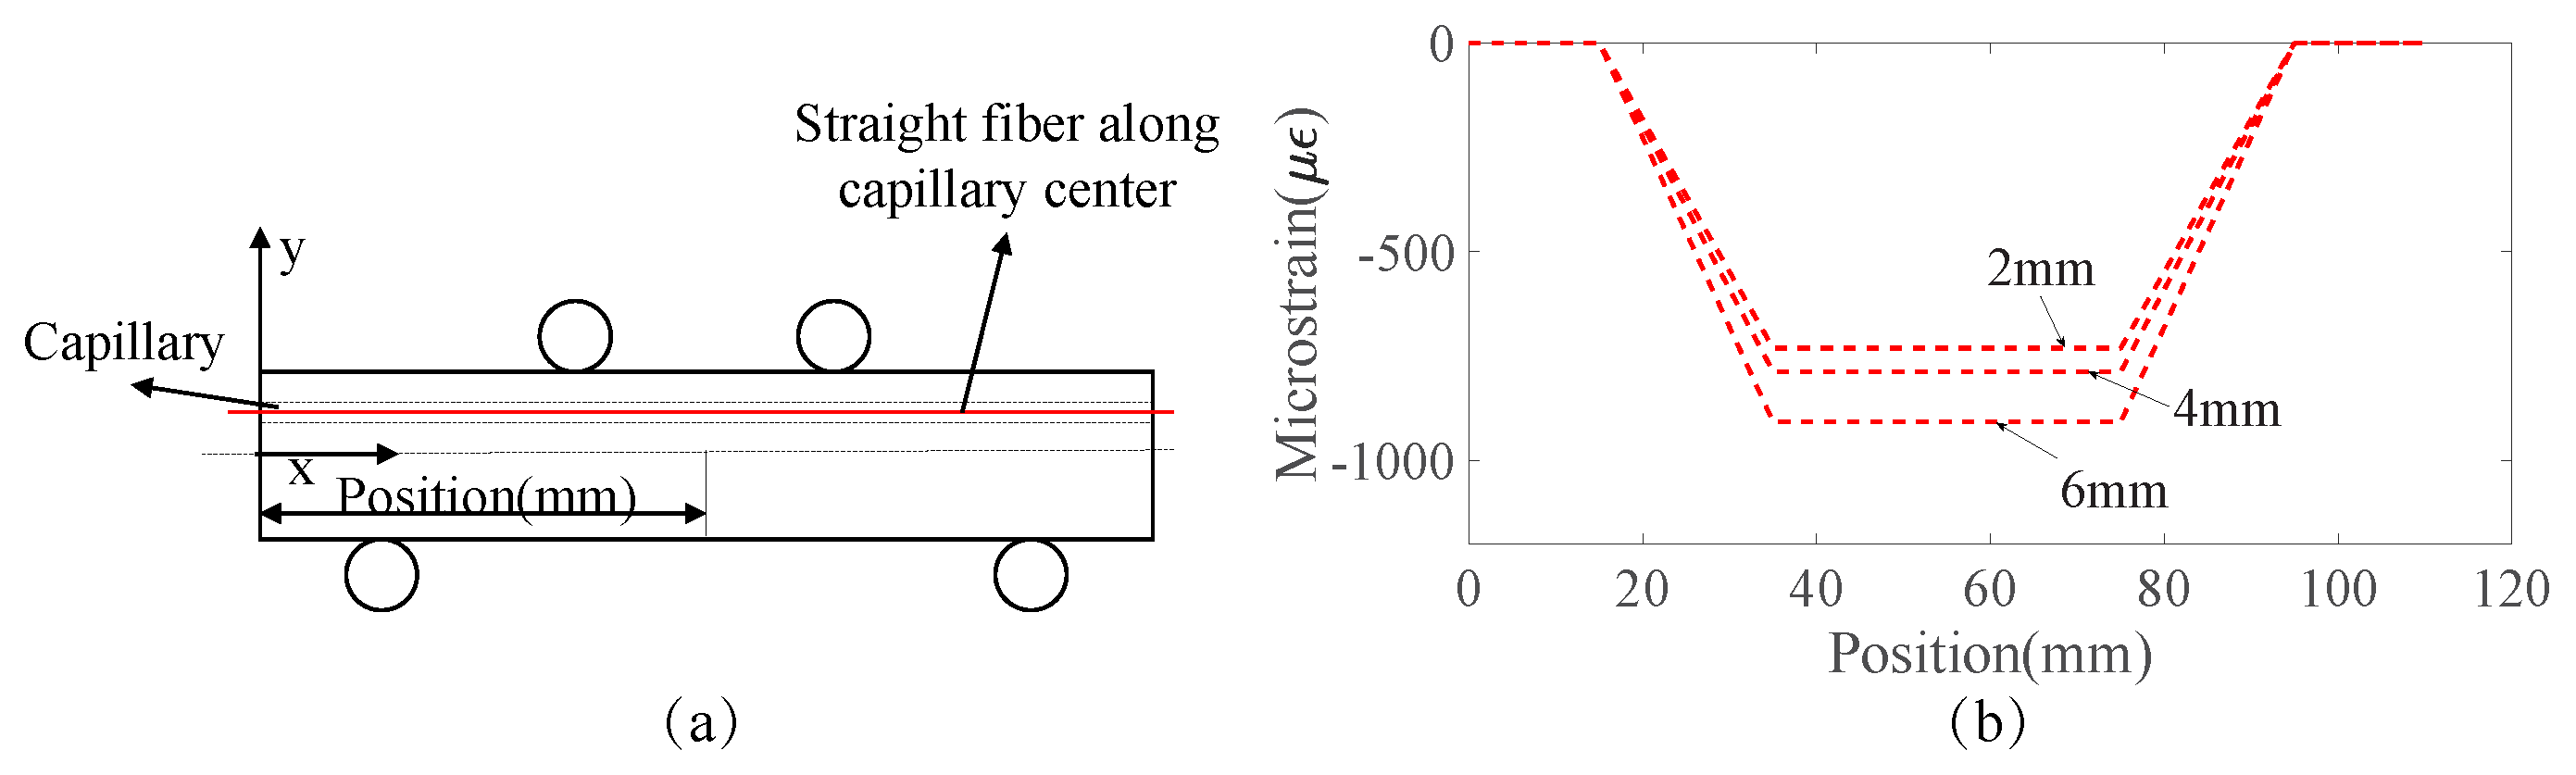
2.2. Strain Distribution Prediction with a Simplified Analytical Model
2.3. Strain Distribution Prediction with a Finite Element Model (FEM)
2.3.1. Material Model
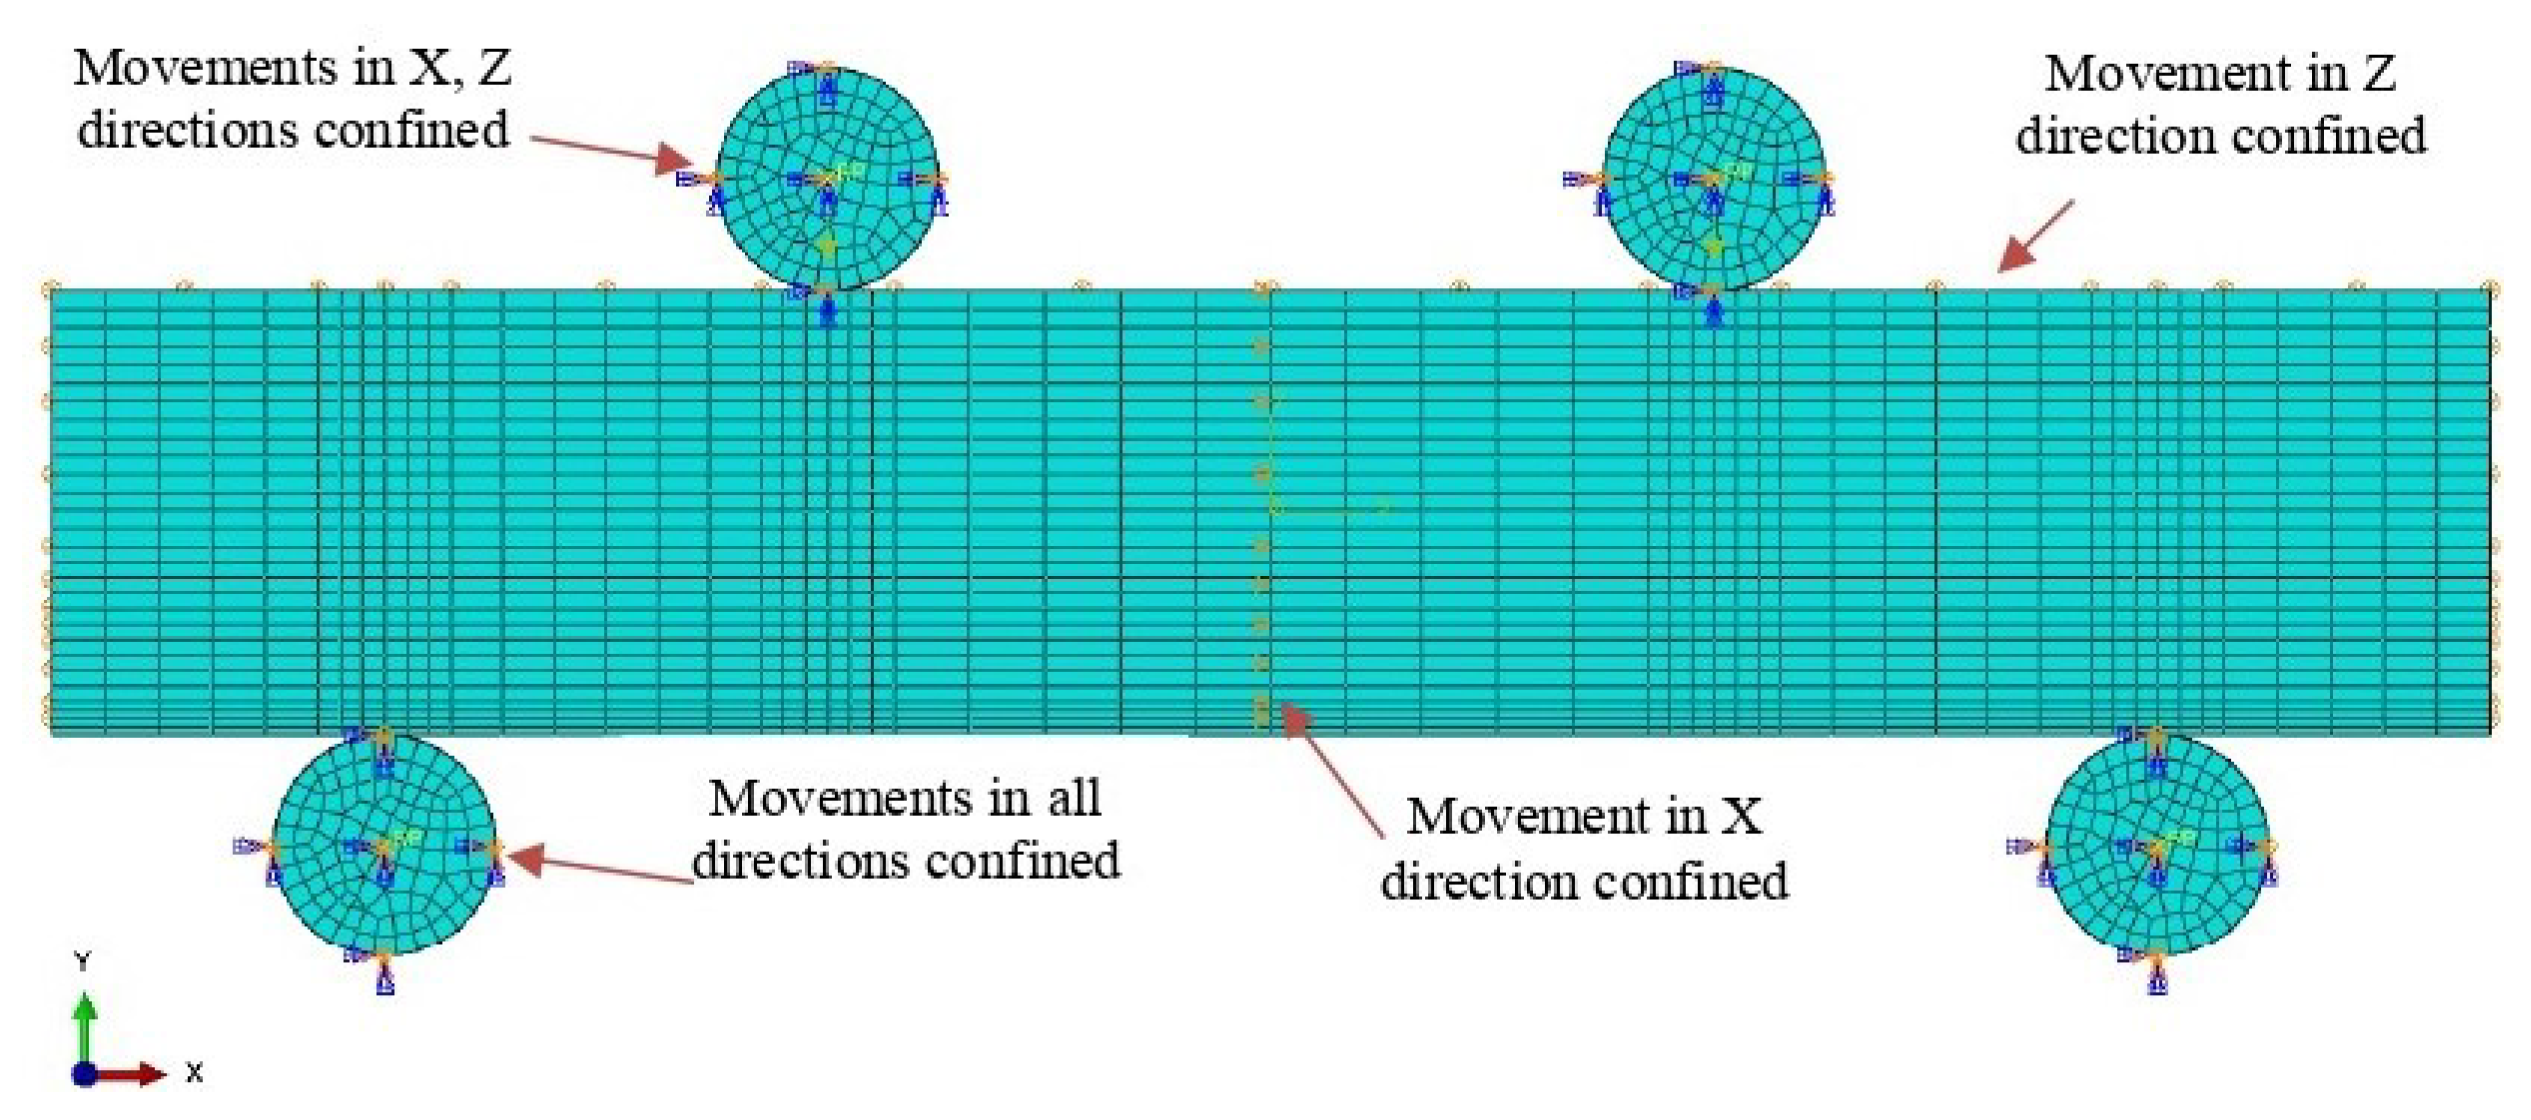
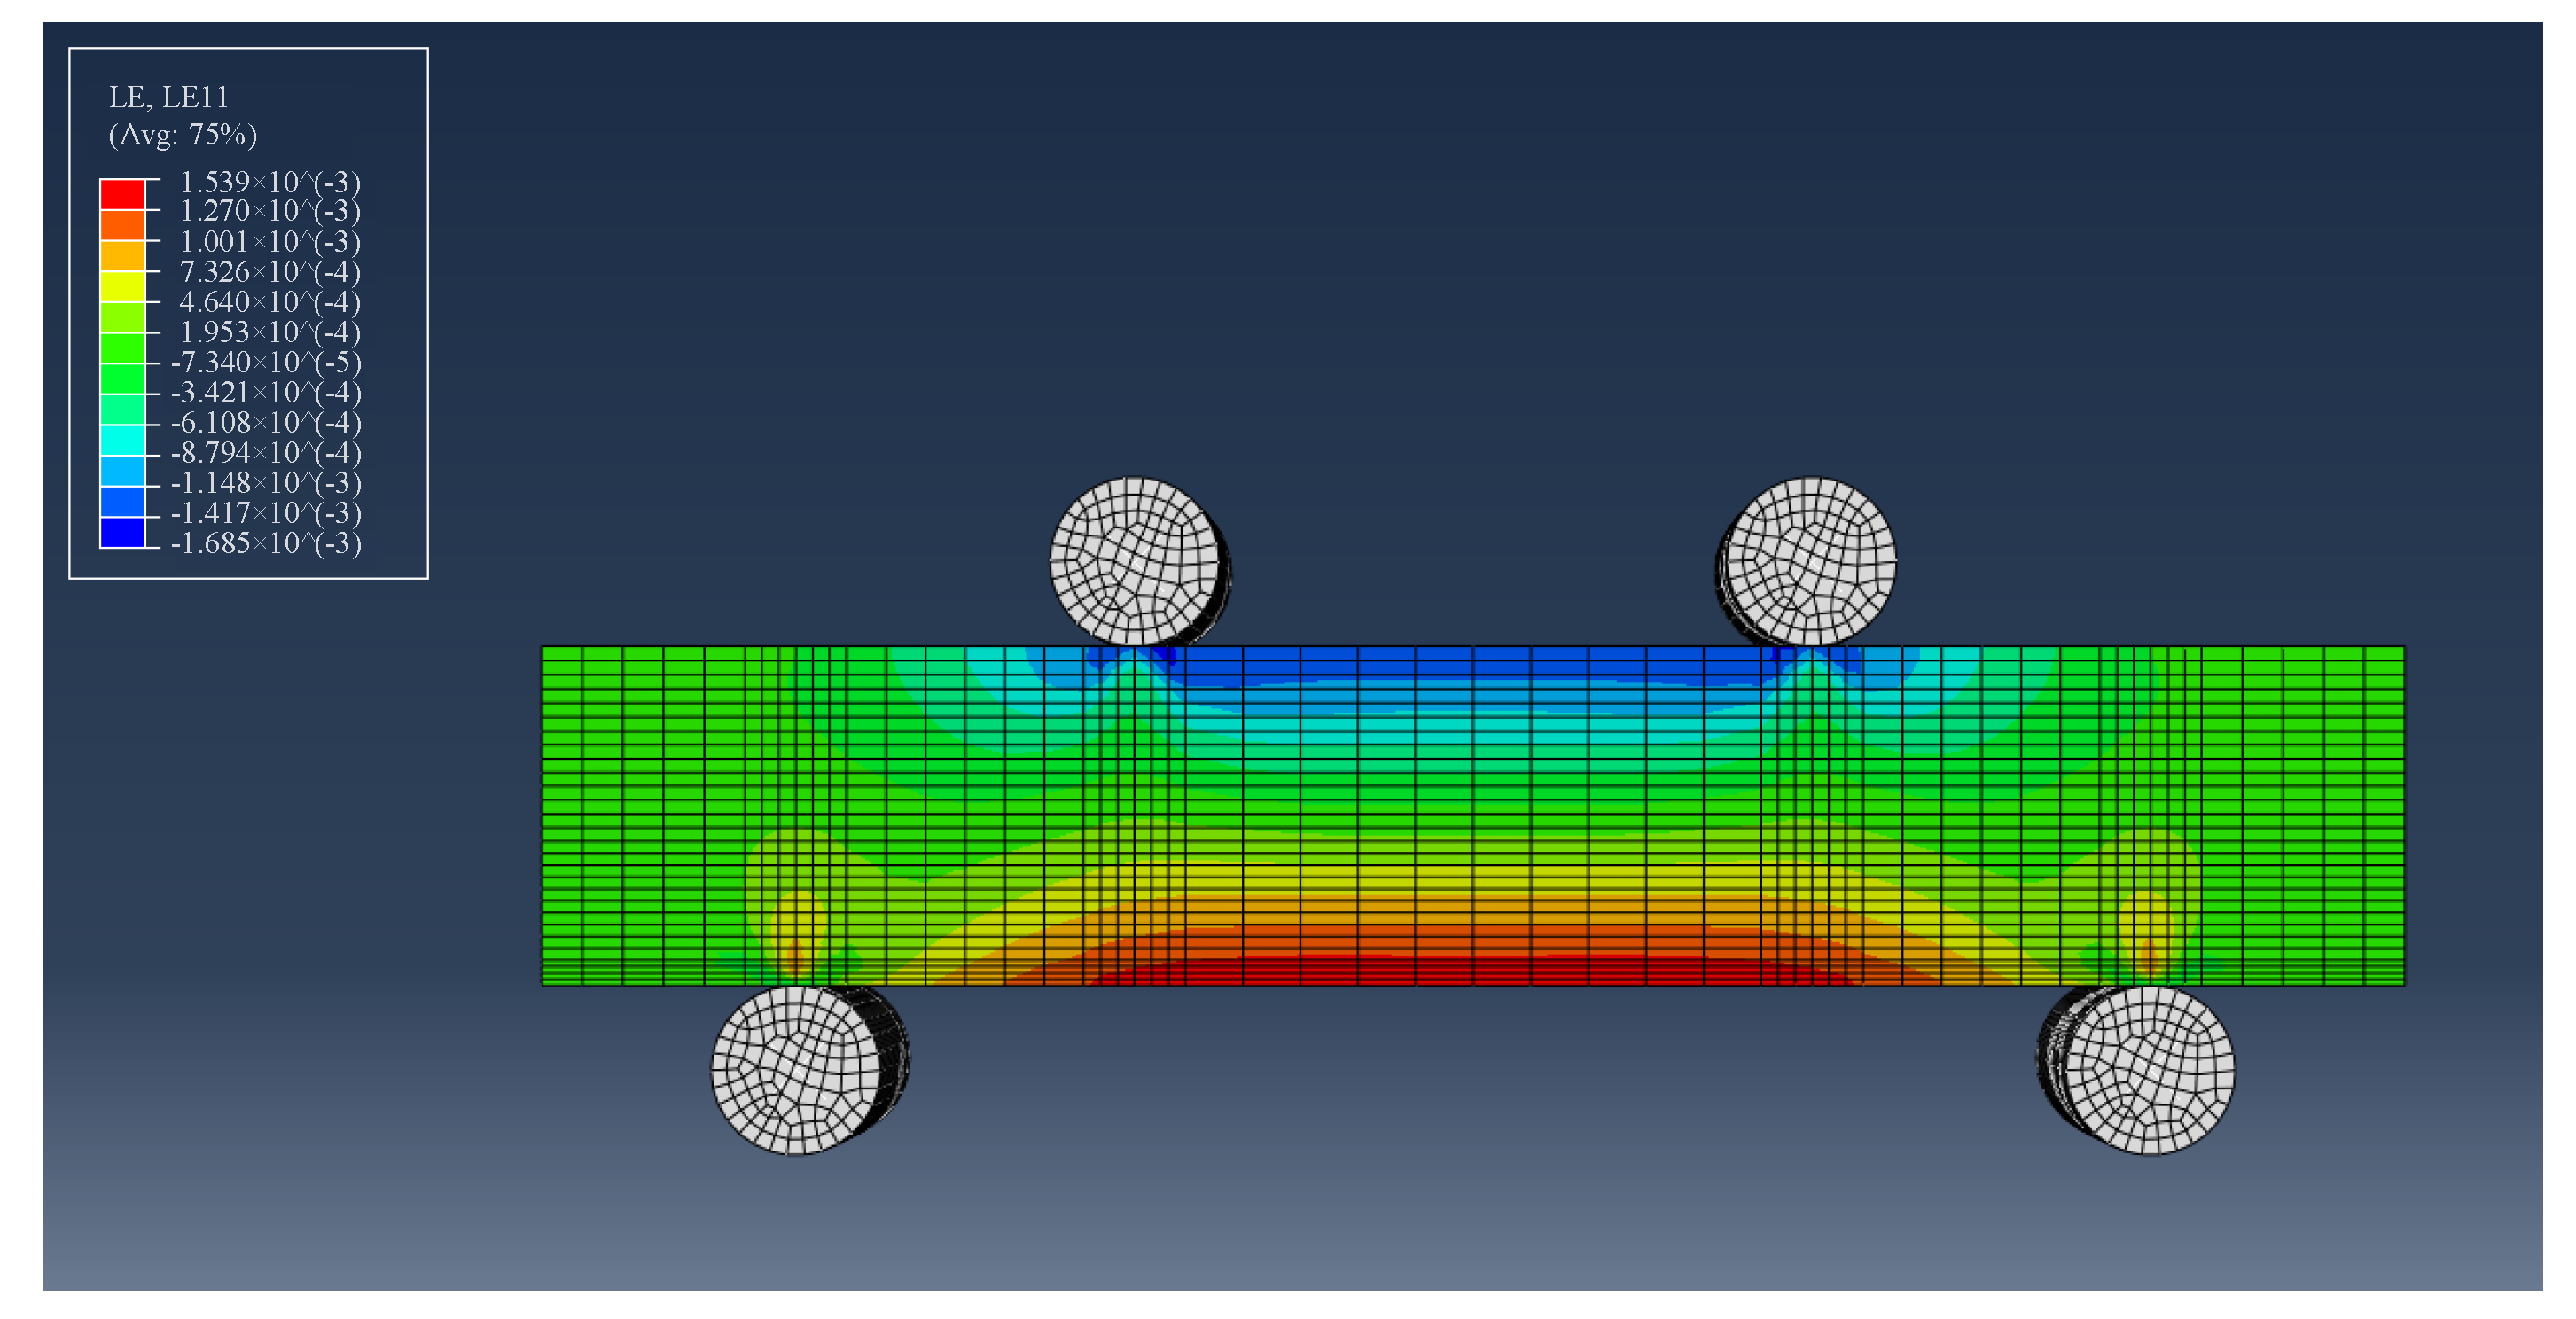
2.3.2. Finite Element Model
2.3.3. Loading and Boundary Conditions
2.4. Verification of the Predictive Models
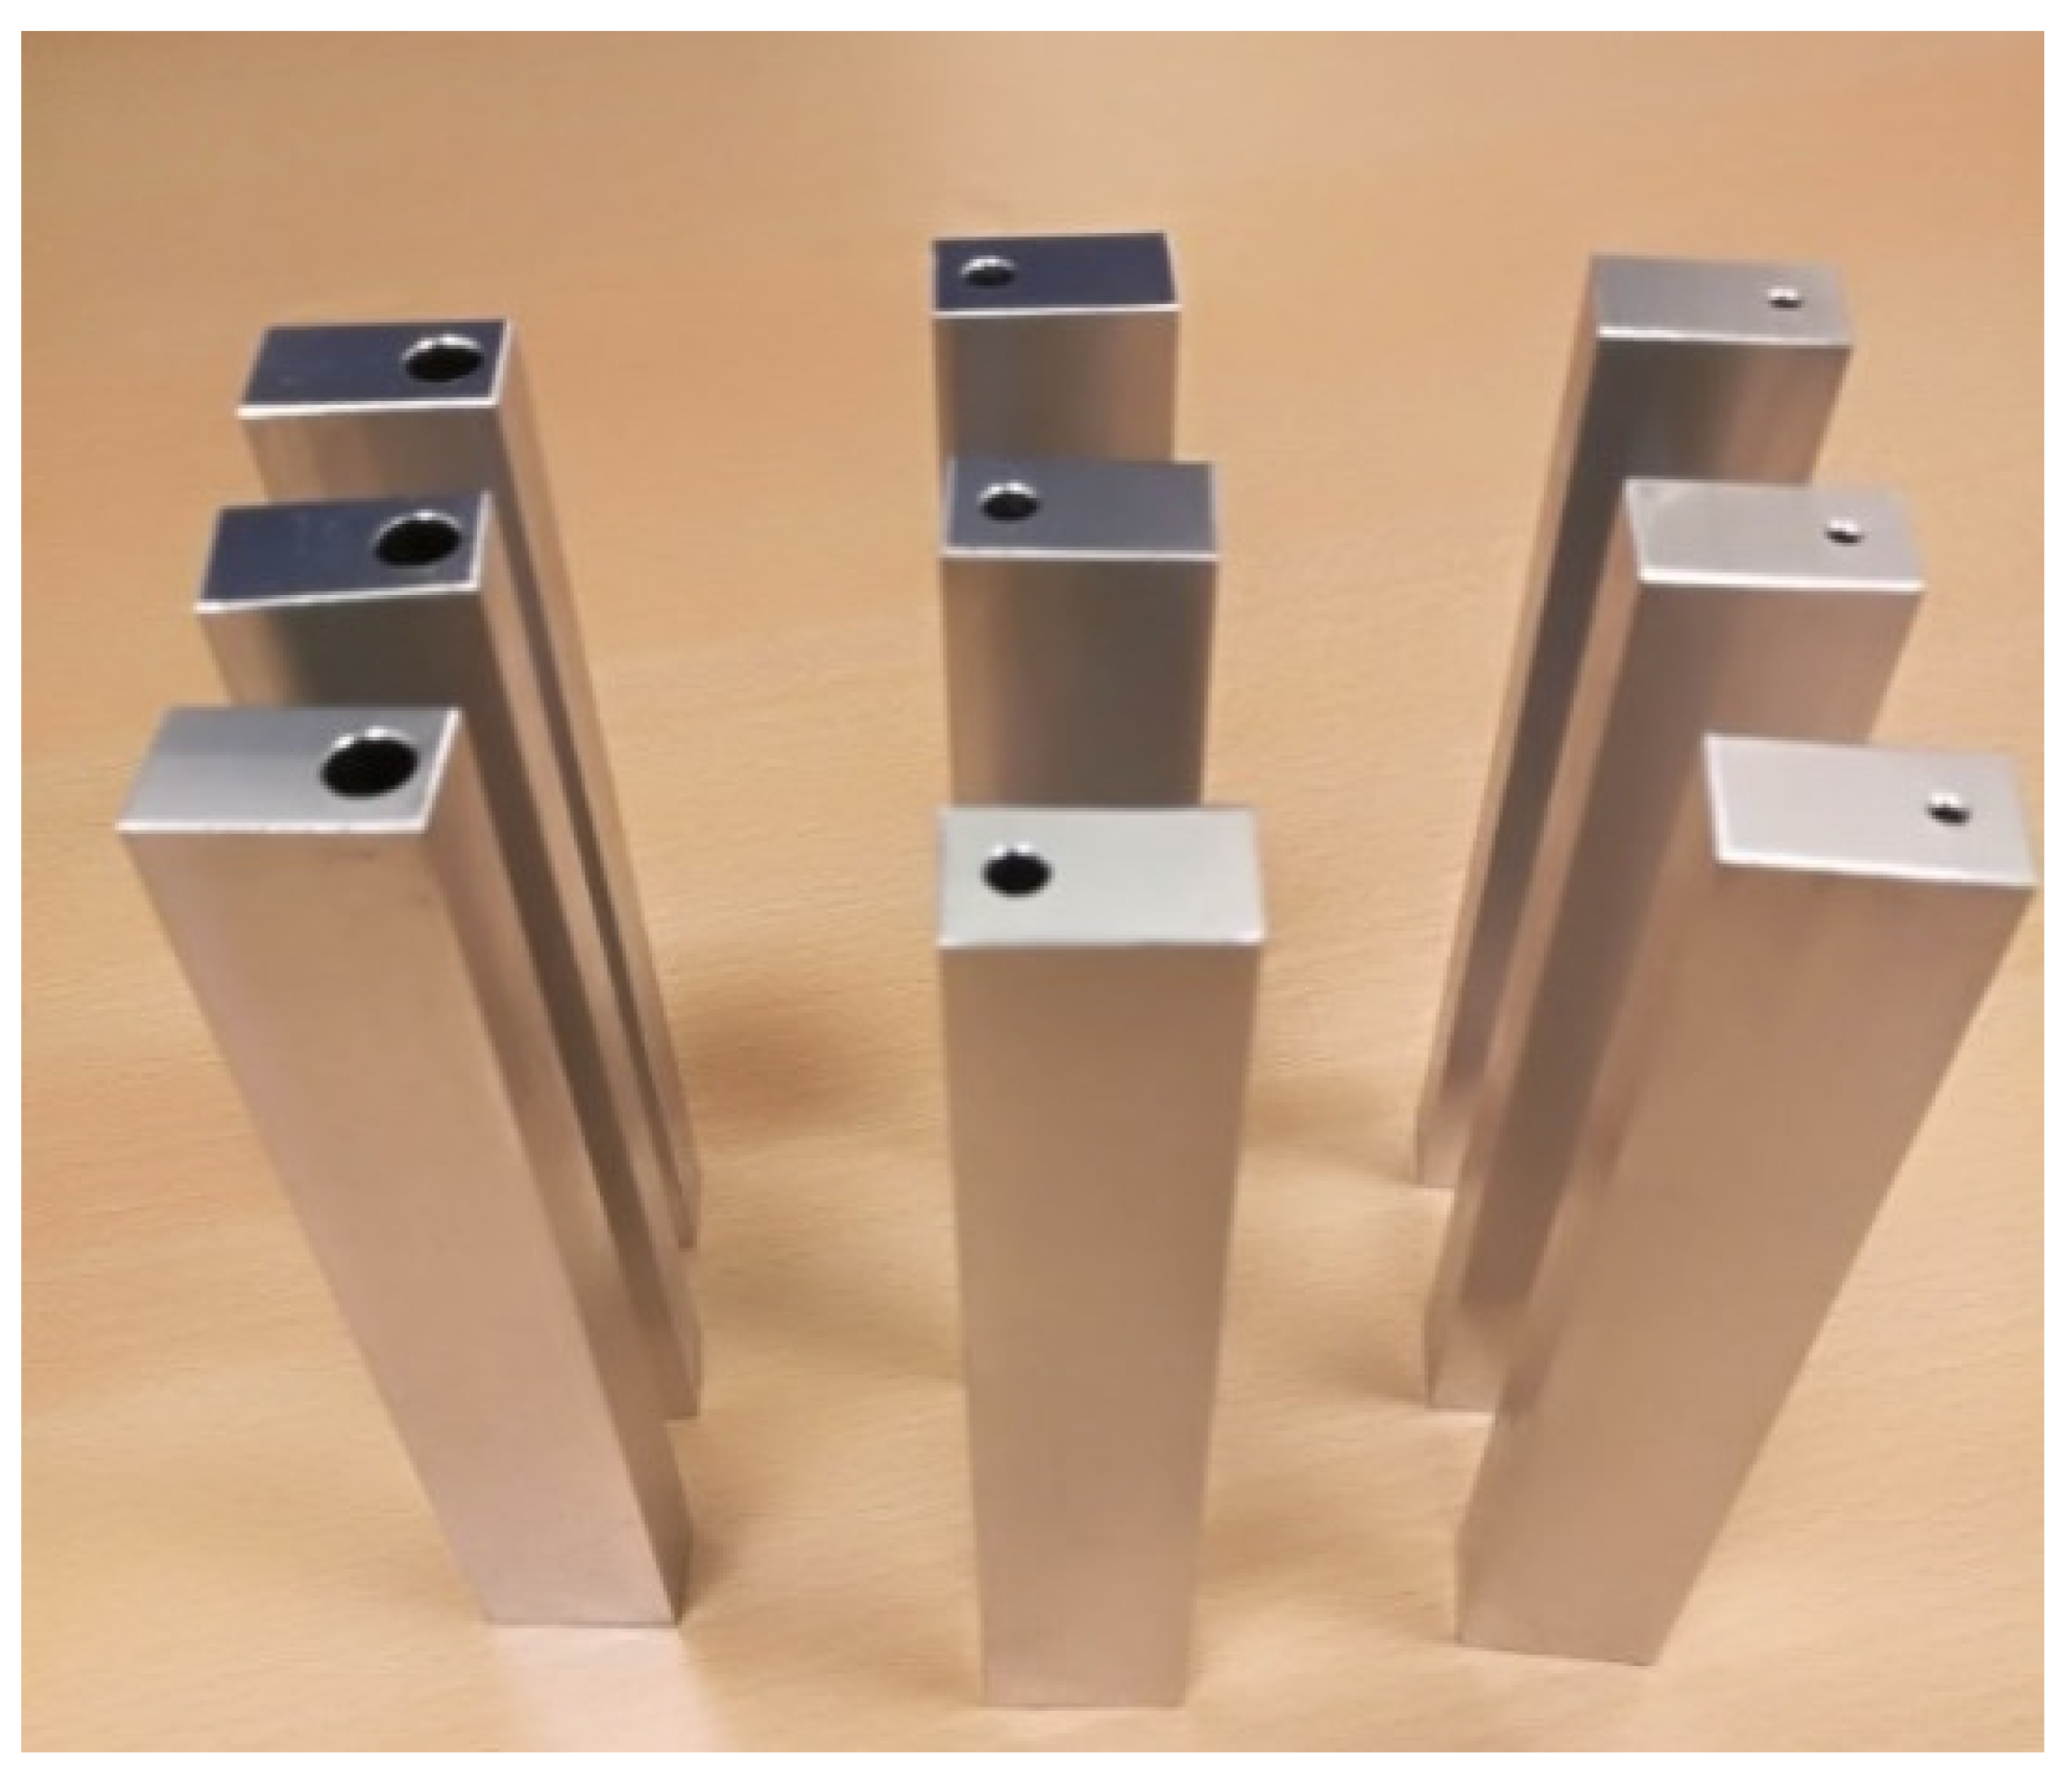
2.4.1. Specimen Fabrication
2.4.2. Four-Point Bending Test
2.4.3. Specimen Sectioning
3. Results
3.1. Analytical Model Results
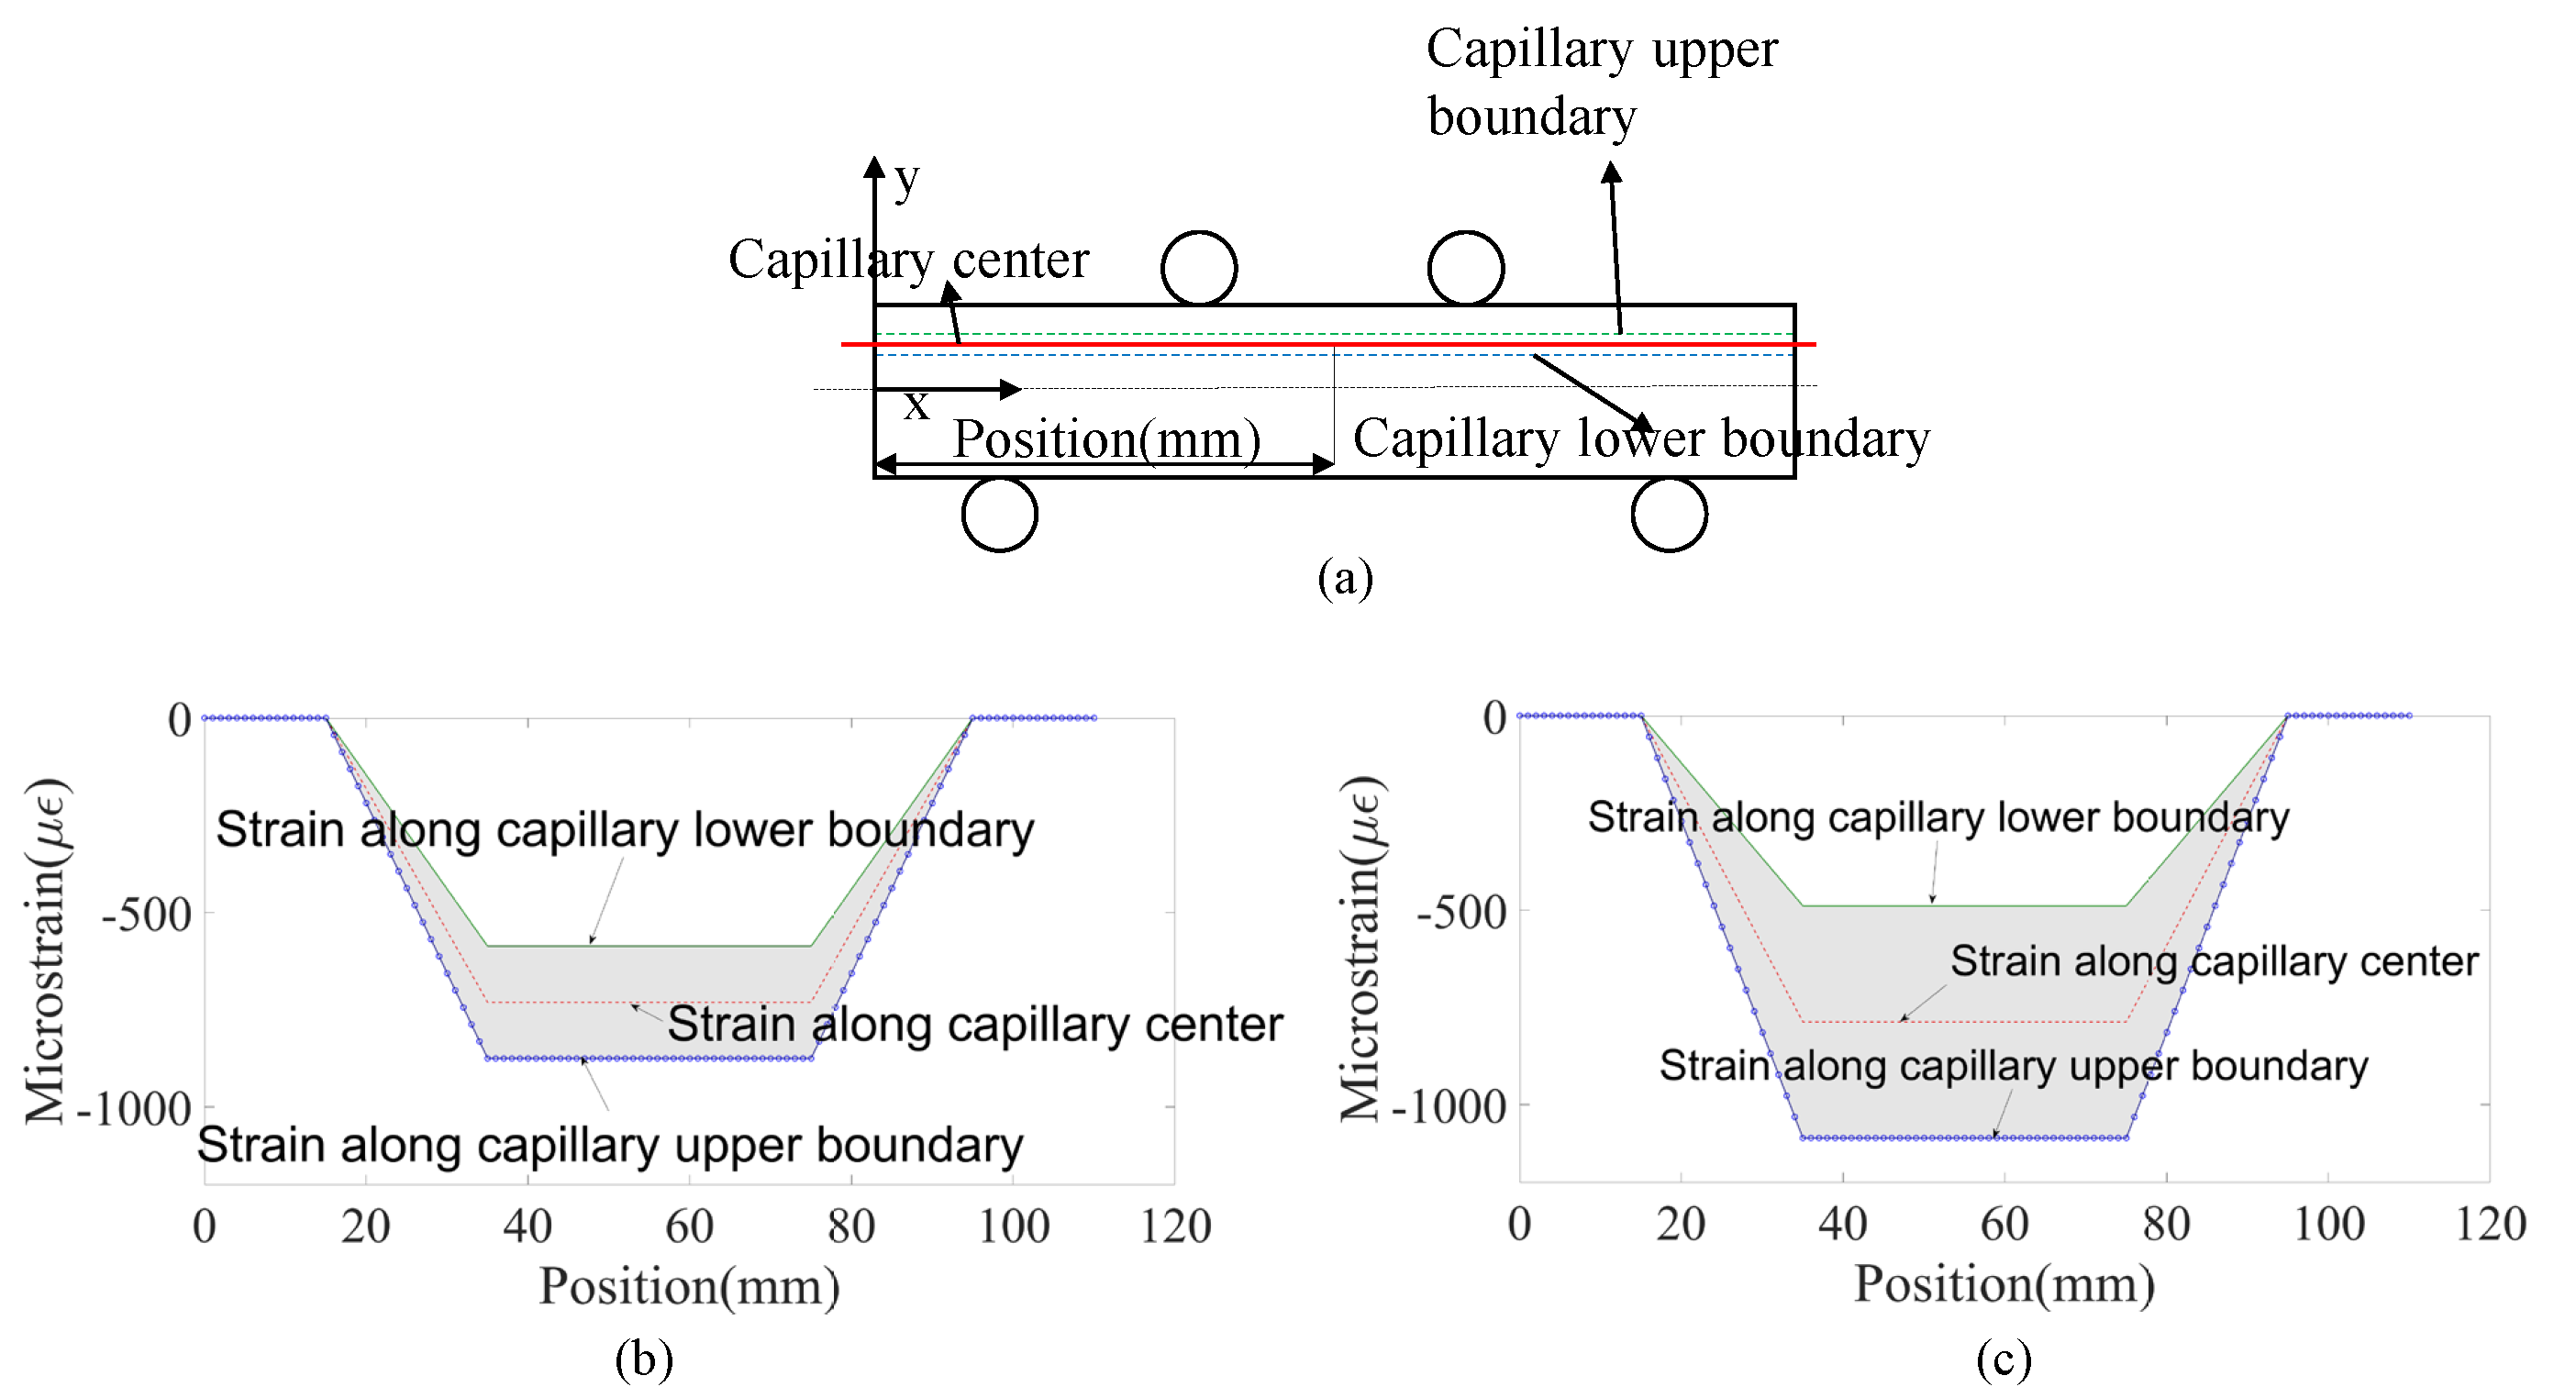
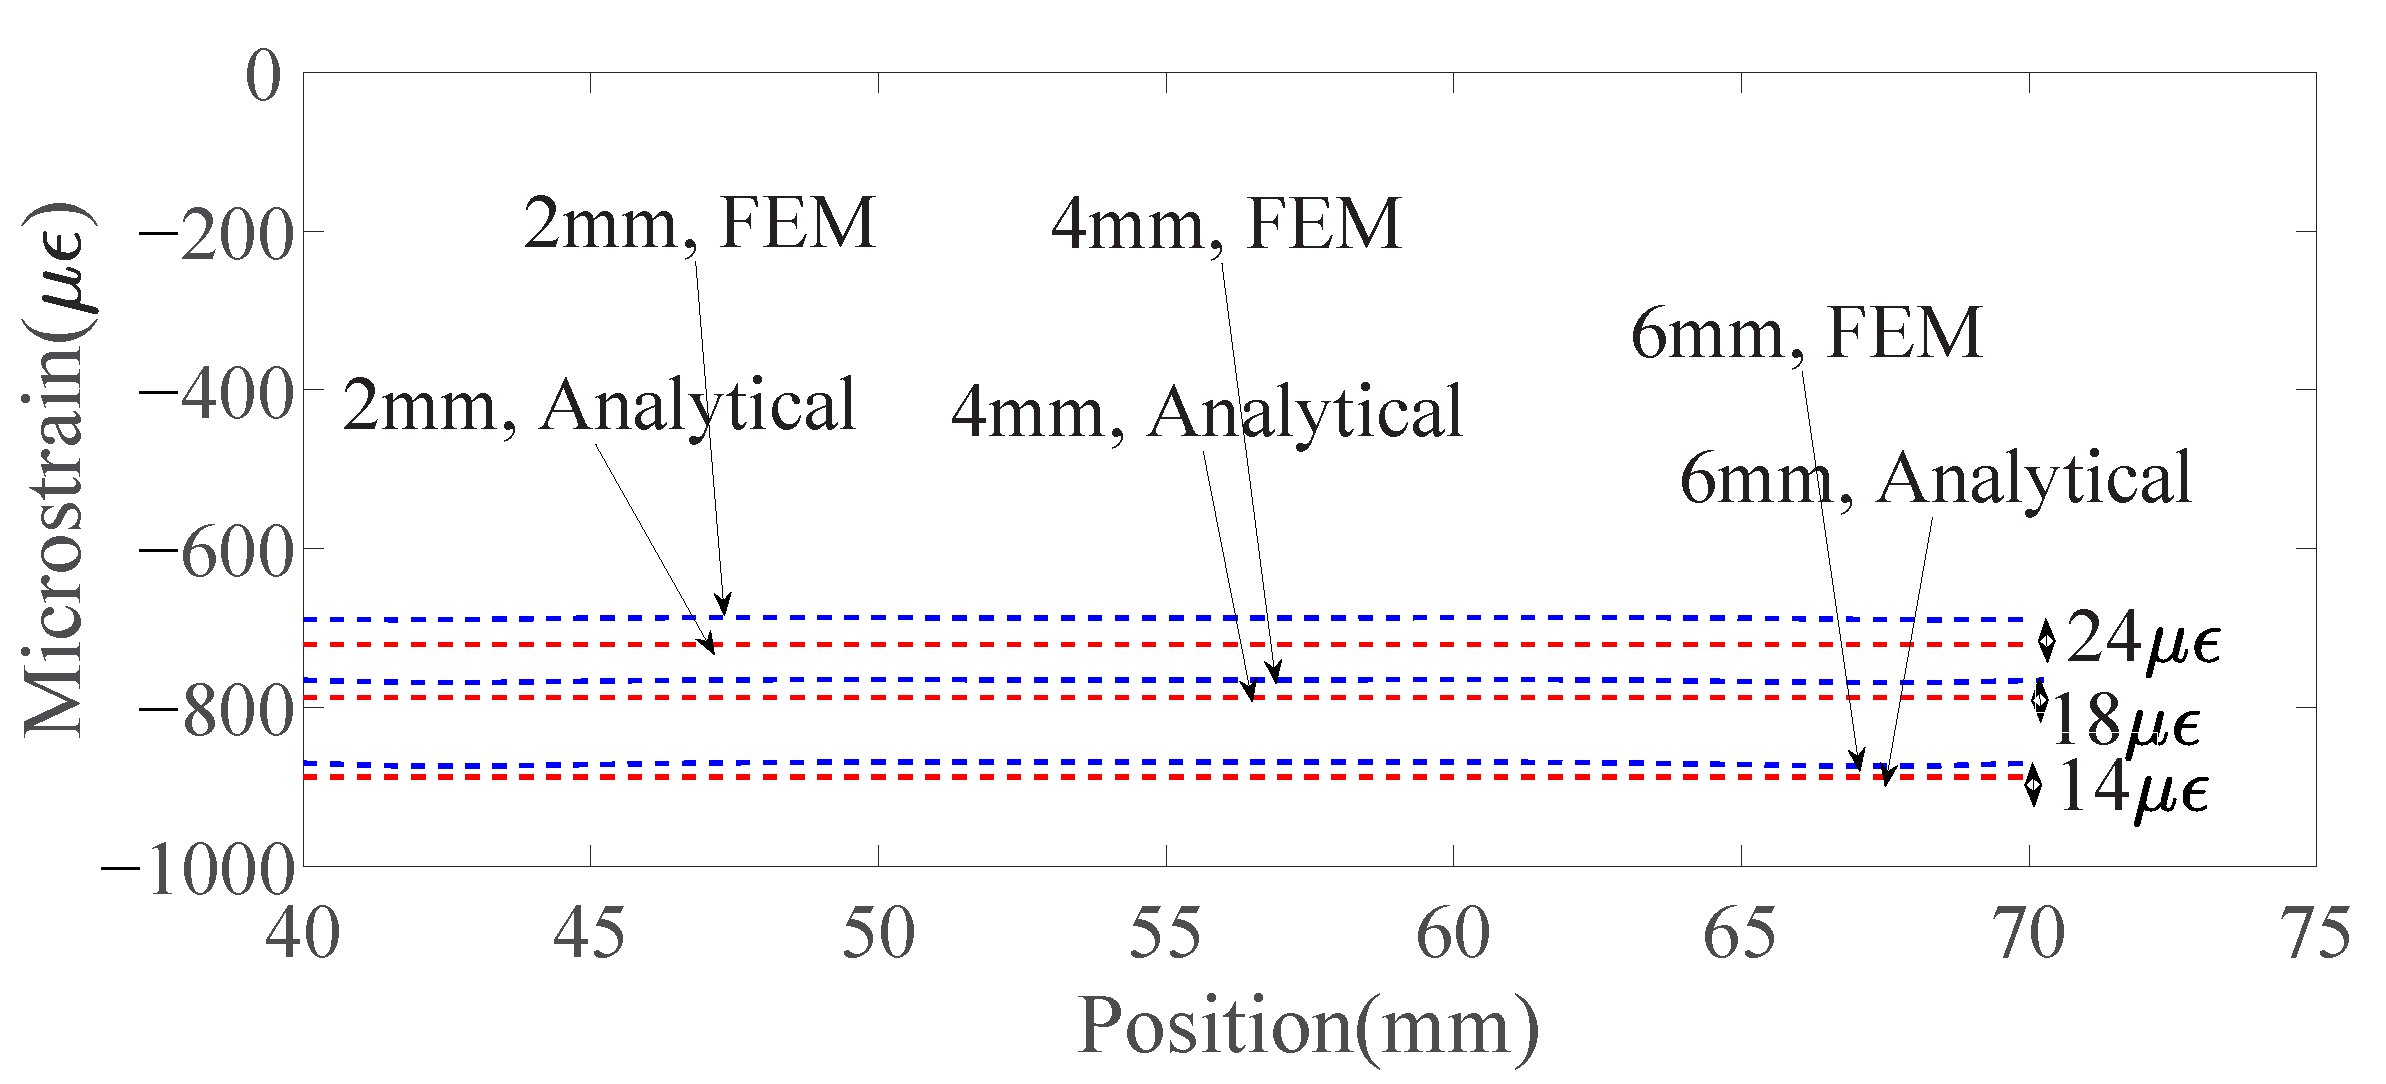
3.2. Numerical Results
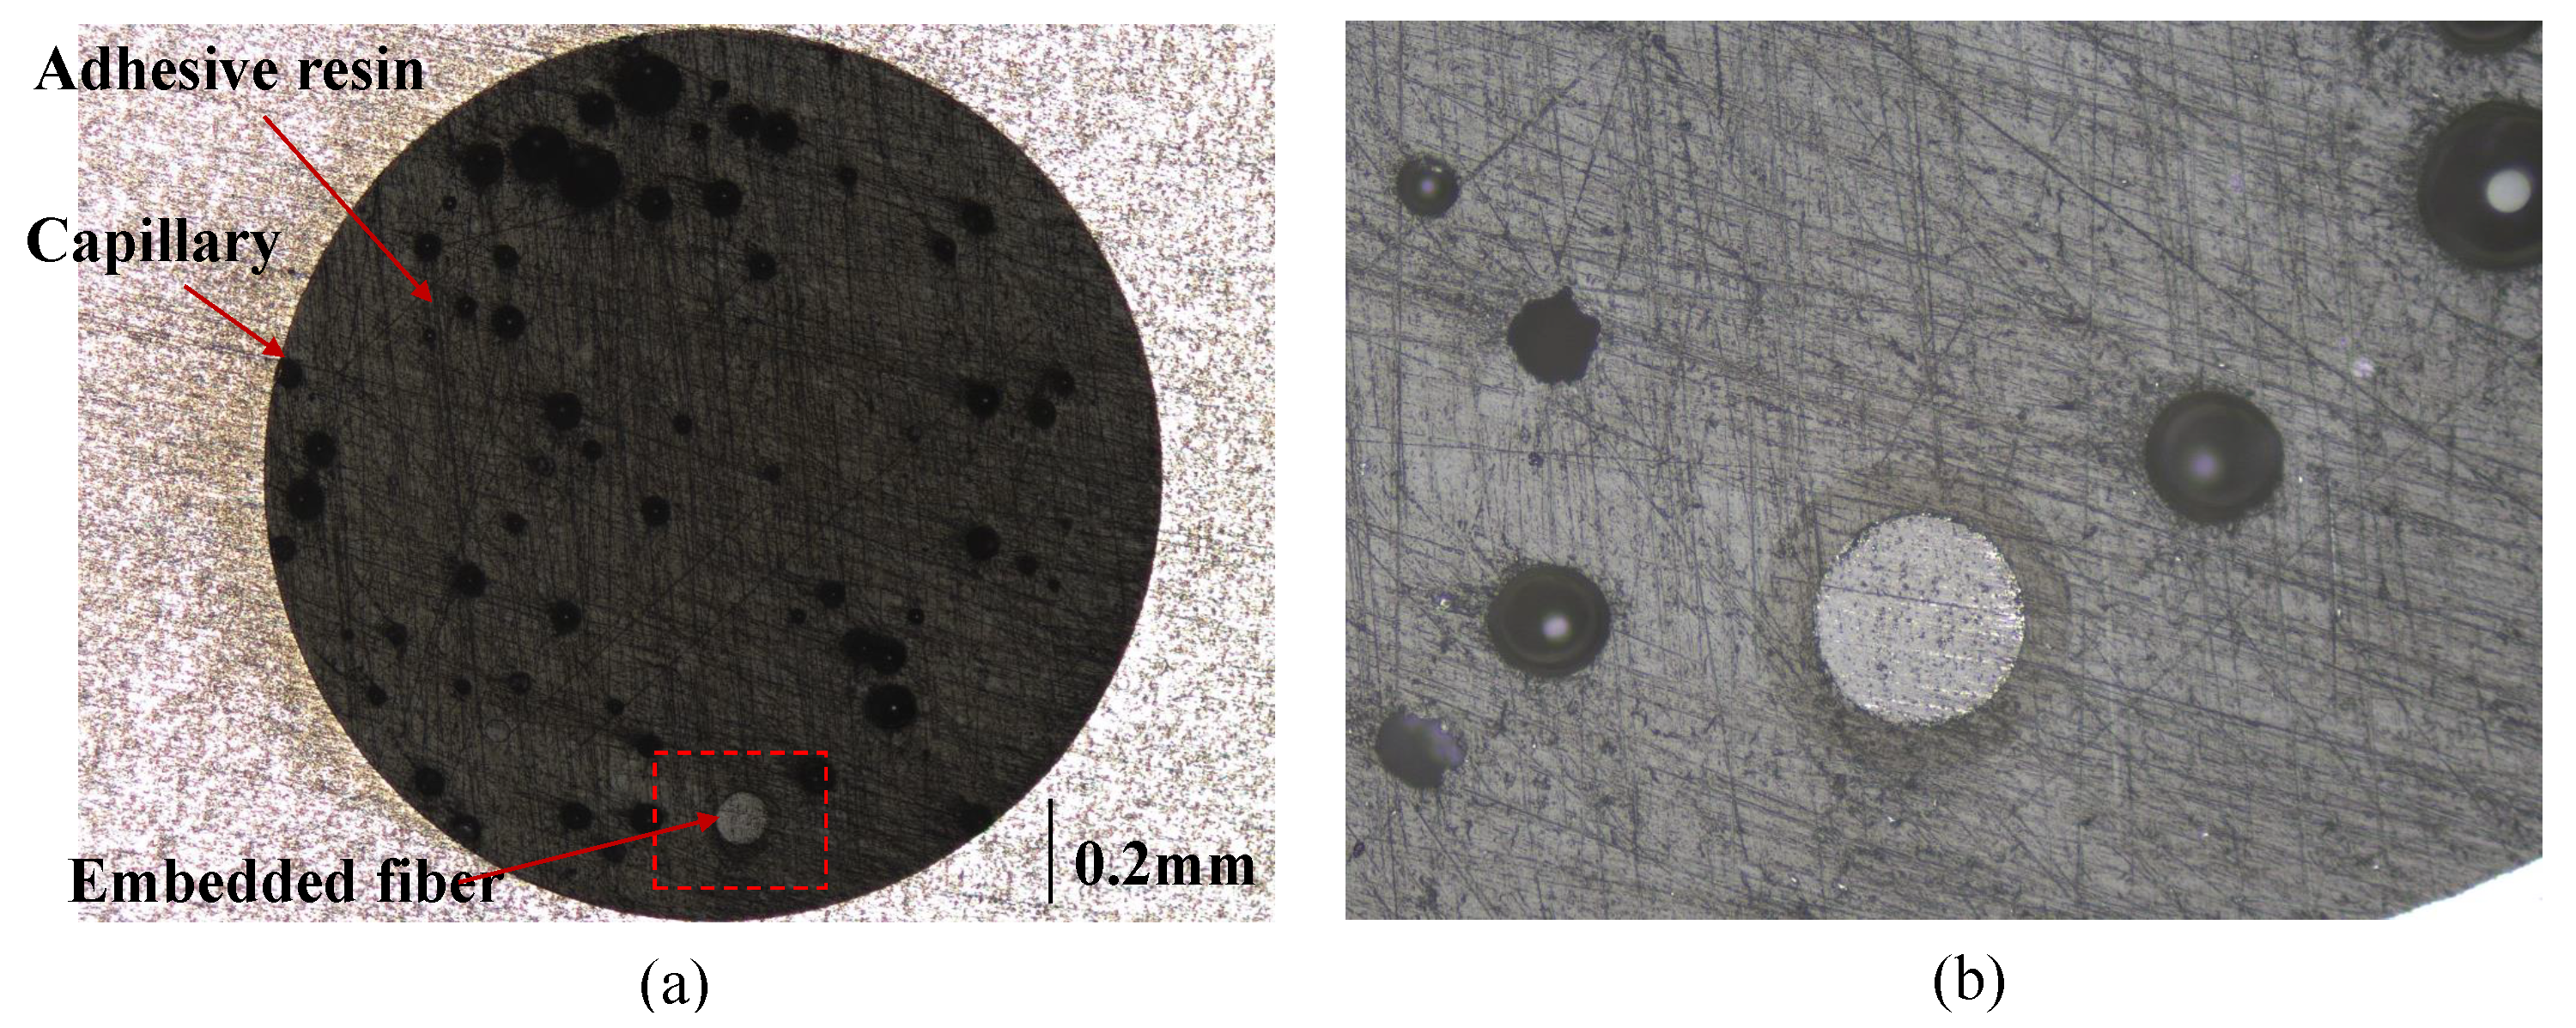
3.3. Cross Sections of the Capillary with Embedded Fiber
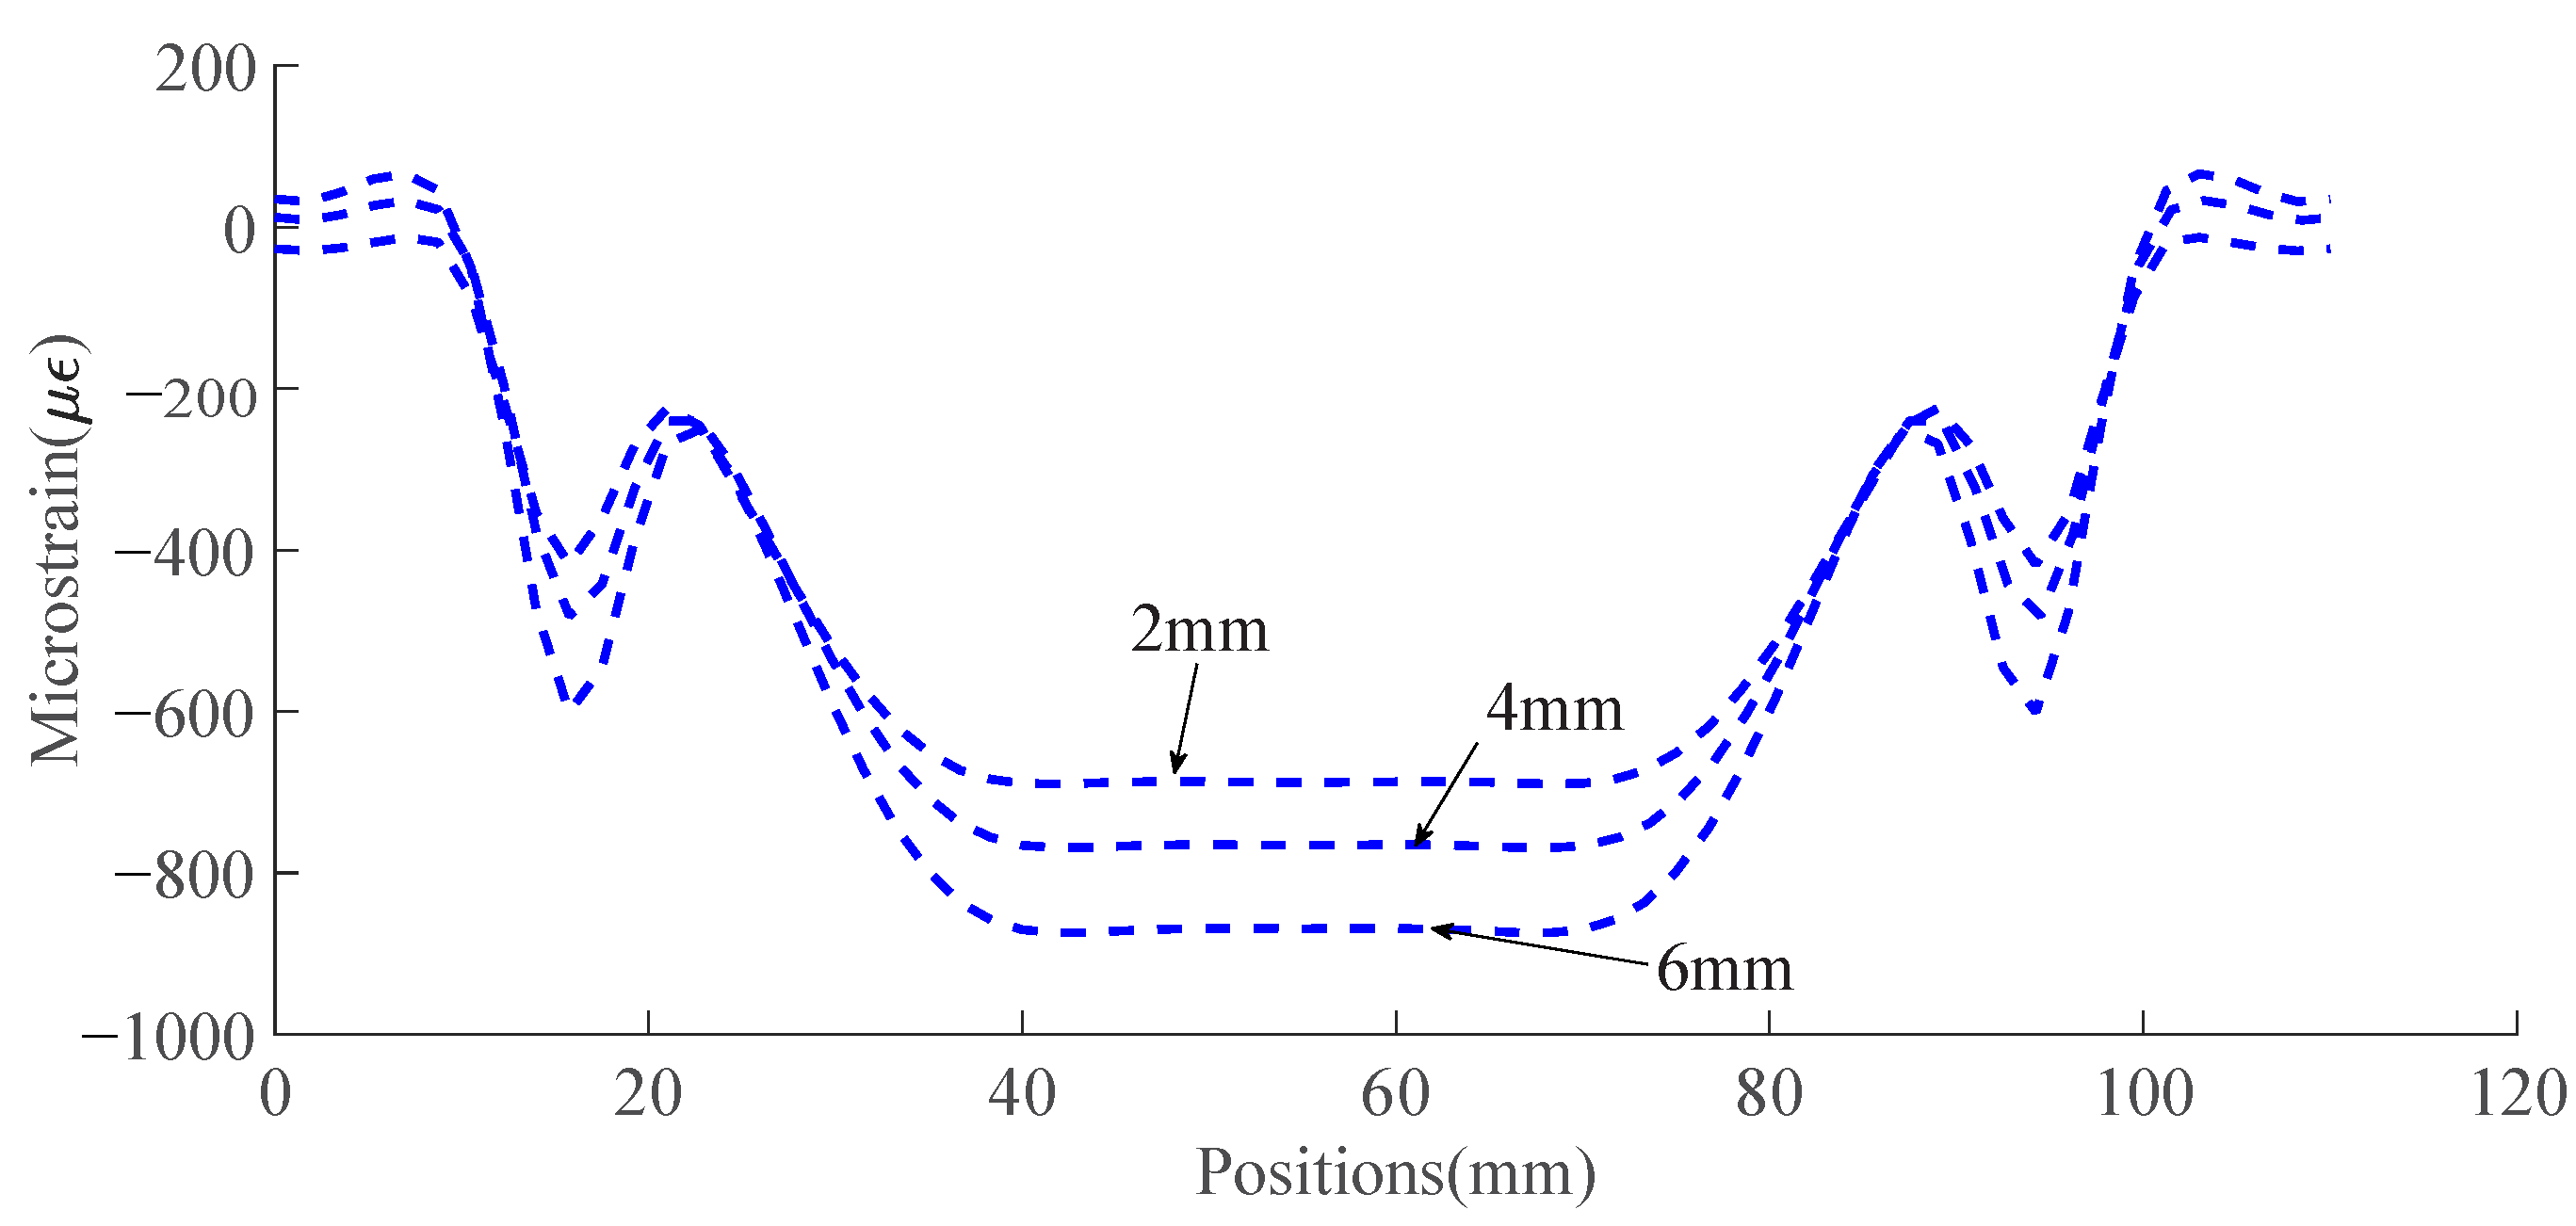
3.4. Four-Point Bending Test Results of Al6082-T651
4. Discussion
4.1. Comparison of the Analytically Predicted Strain, Numerically Predicted Strain and Measured Strain
4.2. Influence of Fiber Position and Orientation Variations on Strain Measure Accuracy
4.3. Relative Measurement Error Associated with Capillary
5. Conclusions and Future Work
- 1.
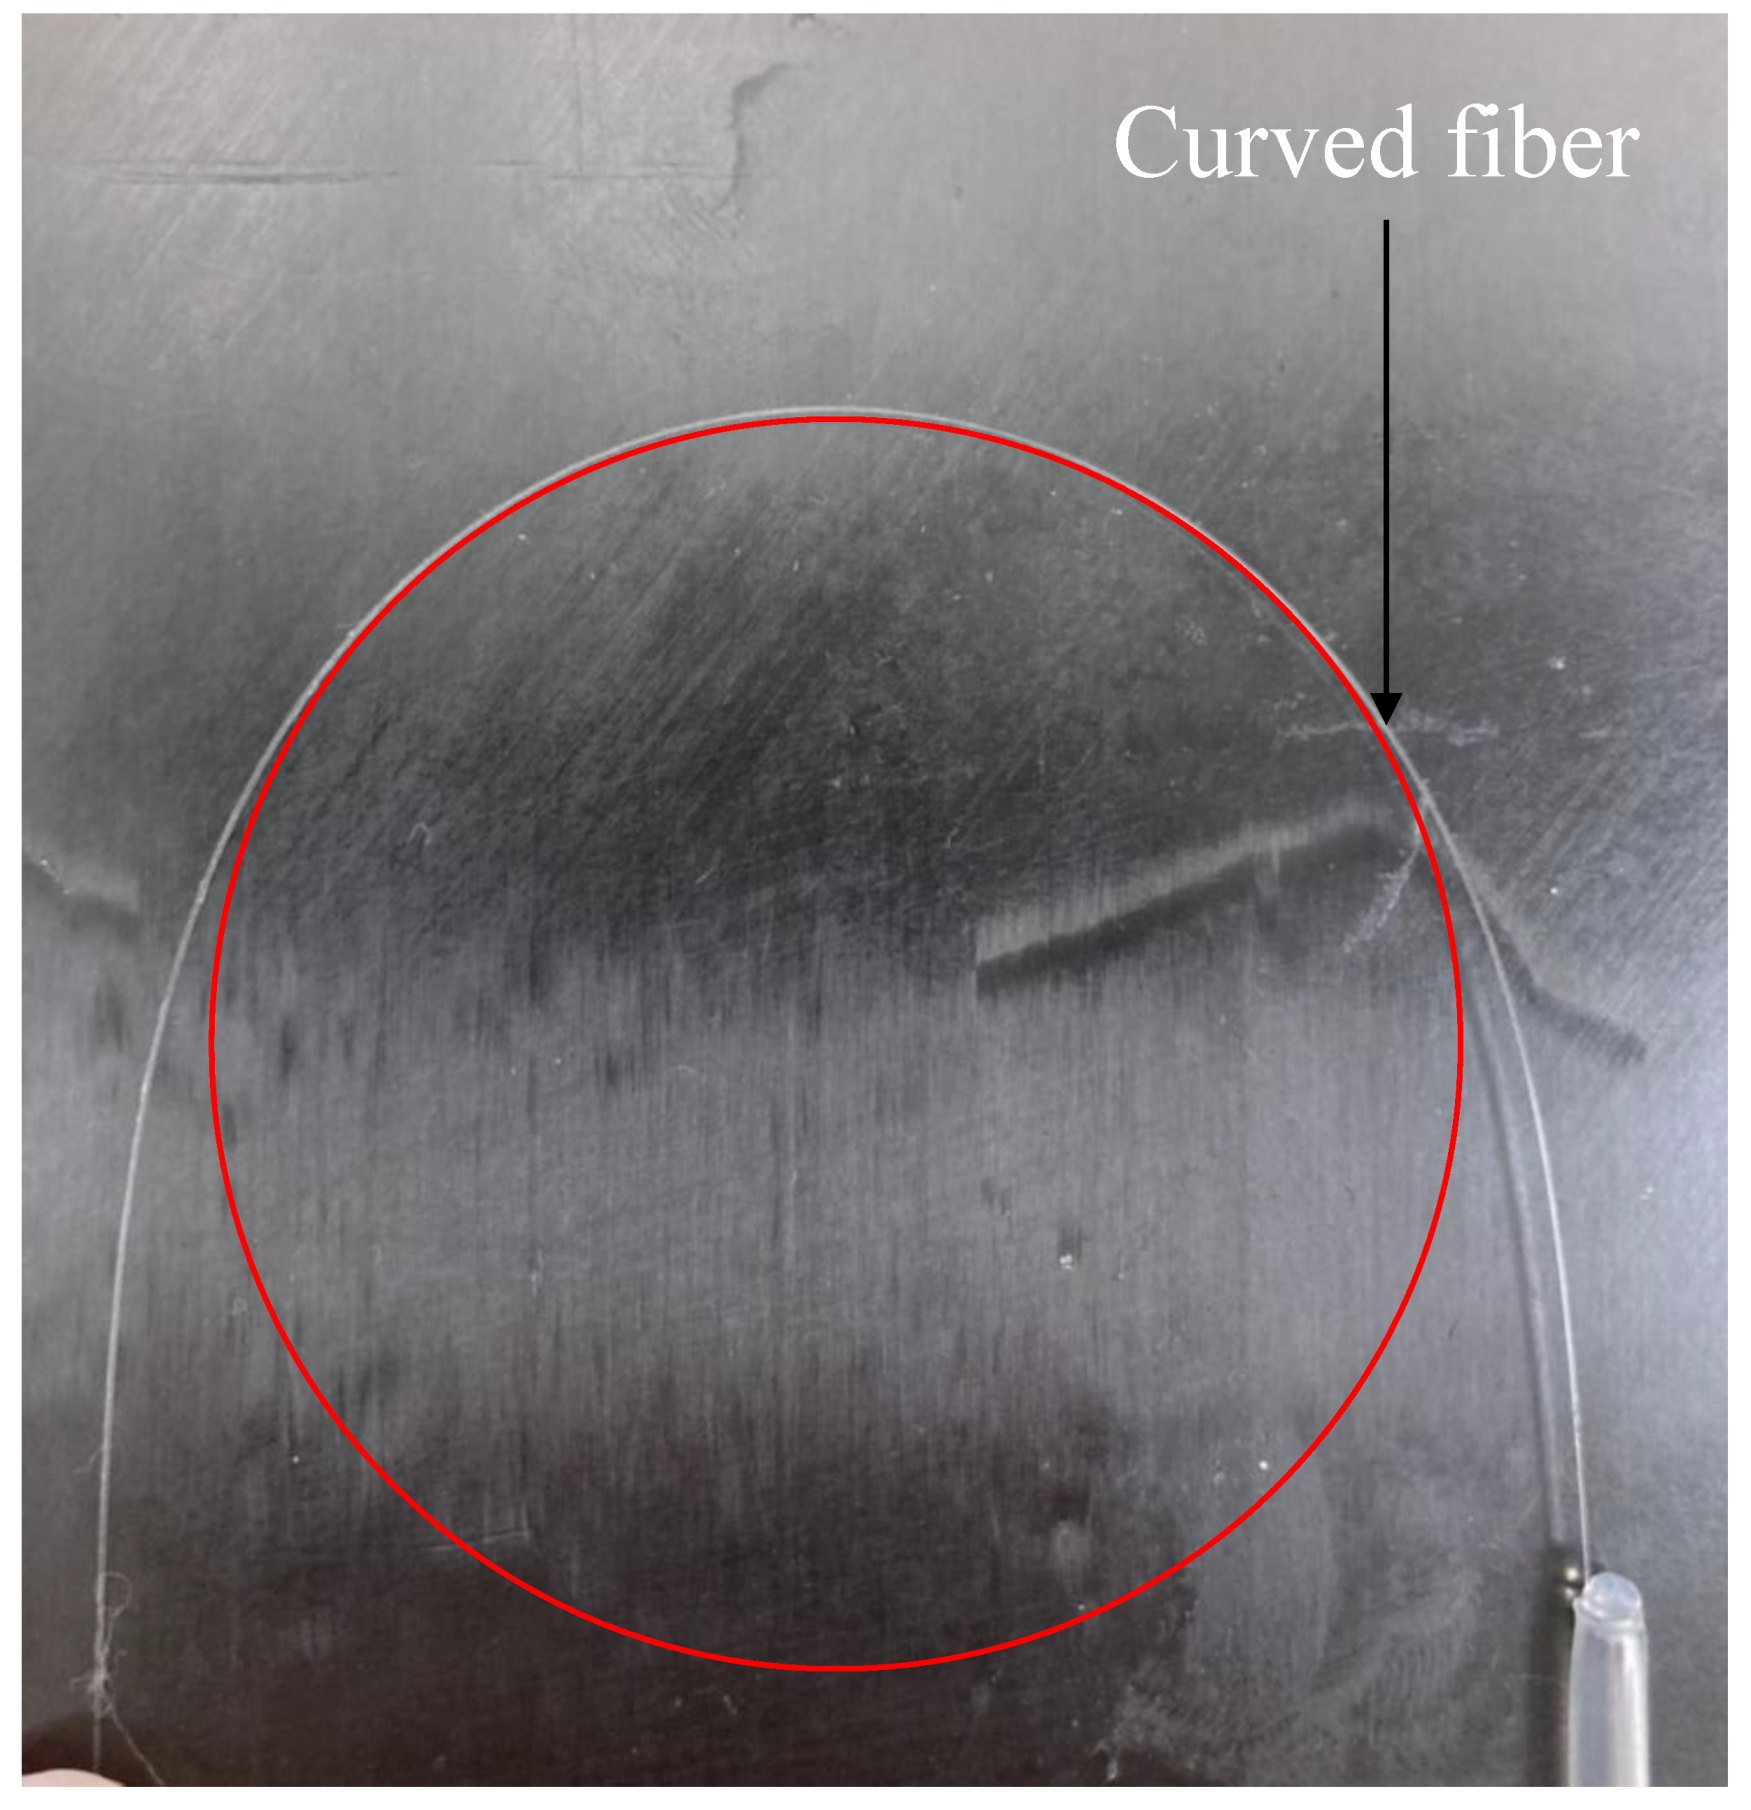
- When an optical fiber is embedded within a specimen using capillaries, both the fiber positions and orientations may vary along the fiber. Variations of the fiber orientations have a negligible influence on the strain measurement compared with fiber position variations. Therefore, fiber position uncertainty is the main factor influencing strain measurement accuracy.
- 2.
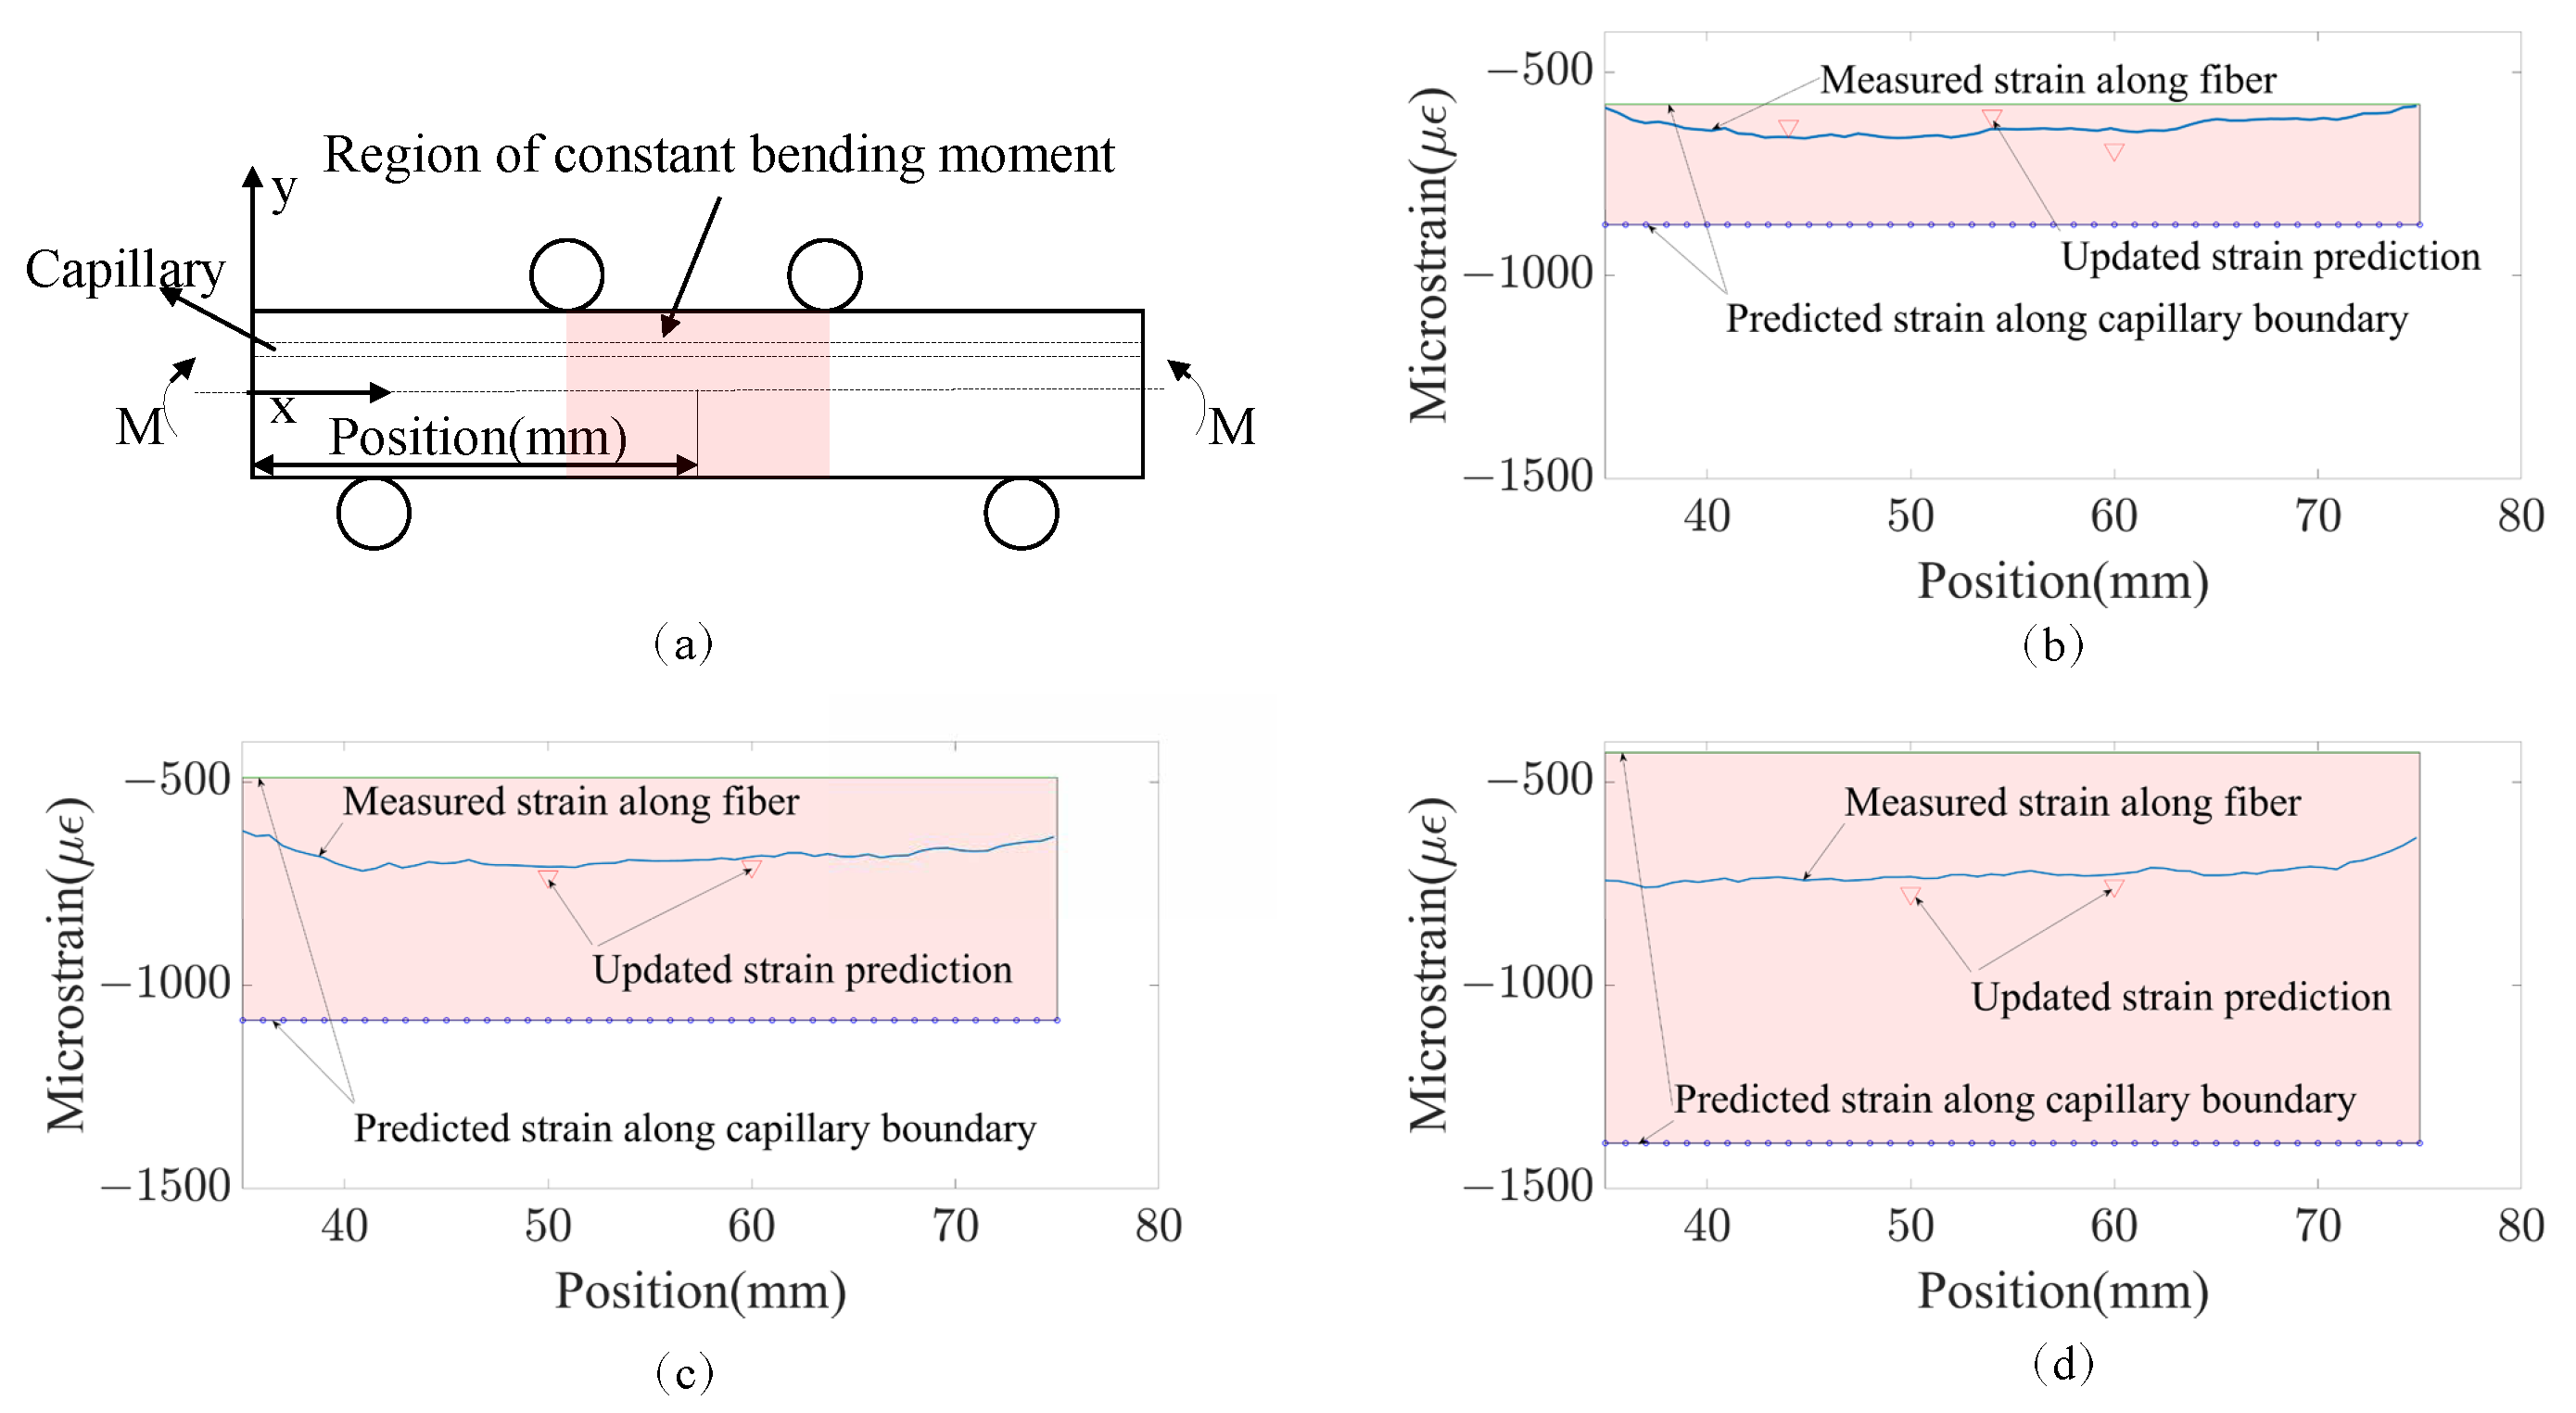
- Even the positional uncertainties of the embedded fiber within capillaries can cause strain measurement uncertainties; the measured strain distributions lie within the strain windows defined by the strain distribution along the capillary boundary when there are no cracks in the specimen. It is possible to perform crack detection using the strain window.
6. Source Code
Author Contributions
Funding
Institutional Review Board Statement
Informed Consent Statement
Data Availability Statement
Conflicts of Interest
References
- Glisic, B.; Inaudi, D. Fiber Optic Methods for Structural Health Monitoring; John Wiley & Sons: Hoboken, NJ, USA, 2008. [Google Scholar]
- Maier, R.; Havermann, D.; Schneller, O. Optical fiber sensing in metals by embedment in 3D printed metallic structures. In Proceedings of the 23rd International Conference on Optical Fiber Sensors, Santander, Spain, 2–6 June 2014. [Google Scholar]
- Ramakrishnan, M.; Rajan, G.; Semenova, Y. Measurement of thermal elongation induced strain of a composite material using a polarization maintaining photonic crystal fiber sensor. Sens. Actuator A Phys. 2013, 190, 44–51. [Google Scholar] [CrossRef]
- Yuan, S.; Huang, R.; Rao, Y. Internal strain measurement in 3 D braided composites using co-braided optical fiber sensors. J. Mater. Sci. Technol. 2004, 20, 199–202. [Google Scholar]
- Boisse, P.; Zouari, B.; Gasser, A. A mesoscopic approach for the simulation of woven fiber composite forming. Compos. Sci. Technol. 2005, 65, 429–436. [Google Scholar] [CrossRef]
- Havermann, D.; Mathew, J.; MacPherson, W.N.; Maier, R.R.; Hand, D.P. Temperature and strain measurements with fiber Bragg gratings embedded in stainless steel 316. J. Light. Technol. 2014, 33, 2474–2479. [Google Scholar] [CrossRef]
- Li, X. Embedded Sensors in Layered Manufacturing. Ph.D. Thesis, Stanford University, Stanford, CA, USA, 2001. [Google Scholar]
- Li, Y.; Hua, Z.; Yan, F. Metal coating of fiber Bragg grating and the temperature sensing character after metallization. Opt. Fiber Technol. 2009, 15, 391–397. [Google Scholar] [CrossRef]
- Sandlin, S.; Kosonen, T.; Hokkanen, A.; Heikinheimo, L. Use of brazing technique for manufacturing of high temperature fiber optical temperature and displacement transducer. Mater. Sci. Technol. 2007, 23, 1249–1255. [Google Scholar] [CrossRef]
- Schomer, J.J.; Hehr, A.J.; Dapino, M.J. Characterization of embedded fiber optic strain sensors into metallic structures via ultrasonic additive manufacturing. In Proceedings of the Sensors and Smart Structures Technologies for Civil, Mechanical, and Aerospace Systems, Berlin, Germany, 20–25 July 2016. [Google Scholar]
- Yer, H.C.; Sweeney, D.C.; Petrie, C.M. Functional fiber-optic sensors embedded in stainless steel components using ultrasonic additive manufacturing for distributed temperature and strain measurements. Struct. Health Monit. 2022, 52, 622–632. [Google Scholar]
- Strantza, M.; De Baere, D.; Rombouts, M.; Maes, G.; Guillaume, P. Feasibility study on integrated structural health monitoring system produced by metal three-dimensional printing. Struct. Health Monit. 2015, 14, 622–632. [Google Scholar] [CrossRef]
- Xiao, Y.; Rans, C.; Zarouchas, D.; Benedictus, R. Measurement Accuracy of Distributed Sensing Fibers Embedded Within Capillaries of Solid Structures. In Proceedings of the 12th International Workshop on Structural Health Monitoring, Stanford, CA, USA, 10–12 September 2019. [Google Scholar]
- Bauchau, O.A.; Craig, J.I. Structural Analysis; Springer: Dordrecht, The Netherlands, 2009. [Google Scholar]
- FBGS. Available online: https://fbgs.com/faq/what-is-the-minimum-bend-radius-of-the-fiber/ (accessed on 8 April 2019).
- Tan, A.J.Y.; Ng, S.M.; Stoddart, P.R.; Chua, H.S. Theoretical model and design considerations of U-shaped fiber optic sensors: A review. IEEE Sens. J. 2020, 20, 14578–14589. [Google Scholar] [CrossRef]
- KRAYDEN. Available online: https://krayden.com/technical-data-sheet/huntsman-araldite-aw-106-hardener-hv-953-tds/ (accessed on 12 March 2019).


| Material | Elastic Modulus (GPa) | Yield Strength (MPa) | Poisson’s Ratio |
|---|---|---|---|
| Aluminum 6082-T651 | 70 | 270 | 0.33 |
| AW106/HV953U epoxy adhesives | 1.9 [17] | - | - |
| Specimen ID | Specimen Material | Capillary Diameter d [mm] | Specimen Length L [mm] | Specimen Width b [mm] | Specimen Height h [mm] |
|---|---|---|---|---|---|
| 01 | Aluminum 6082-T651 | 2 | 110 | 12 | 20 |
| 02 | Aluminum 6082-T651 | 2 | 110 | 12 | 20 |
| 03 | Aluminum 6082-T651 | 2 | 110 | 12 | 20 |
| 04 | Aluminum 6082-T651 | 4 | 110 | 12 | 20 |
| 05 | Aluminum 6082-T651 | 4 | 110 | 12 | 20 |
| 06 | Aluminum 6082-T651 | 4 | 110 | 12 | 20 |
| 07 | Aluminum 6082-T651 | 6 | 110 | 12 | 20 |
| 08 | Aluminum 6082-T651 | 6 | 110 | 12 | 20 |
| 09 | Aluminum 6082-T651 | 6 | 110 | 12 | 20 |
| Test Case No. | Specimen ID | Specimen Capillary Diameter (mm) |
|---|---|---|
| 1 | 01 | 2 |
| 2 | 02 | 2 |
| 3 | 03 | 4 |
| 4 | 04 | 4 |
| 5 | 05 | 6 |
| 6 | 06 | 6 |
Disclaimer/Publisher’s Note: The statements, opinions and data contained in all publications are solely those of the individual author(s) and contributor(s) and not of MDPI and/or the editor(s). MDPI and/or the editor(s) disclaim responsibility for any injury to people or property resulting from any ideas, methods, instructions or products referred to in the content. |
© 2023 by the authors. Licensee MDPI, Basel, Switzerland. This article is an open access article distributed under the terms and conditions of the Creative Commons Attribution (CC BY) license (https://creativecommons.org/licenses/by/4.0/).
Share and Cite
Xiao, Y.; Rans, C.; Zarouchas, D.; Benedictus, R. A Comprehensive Study on Measurement Accuracy of Distributed Fiber Optic Sensors Embedded within Capillaries of Solid Structures. Sensors 2023, 23, 8083. https://doi.org/10.3390/s23198083
Xiao Y, Rans C, Zarouchas D, Benedictus R. A Comprehensive Study on Measurement Accuracy of Distributed Fiber Optic Sensors Embedded within Capillaries of Solid Structures. Sensors. 2023; 23(19):8083. https://doi.org/10.3390/s23198083
Chicago/Turabian StyleXiao, Yuzhe, Calvin Rans, Dimitrios Zarouchas, and Rinze Benedictus. 2023. "A Comprehensive Study on Measurement Accuracy of Distributed Fiber Optic Sensors Embedded within Capillaries of Solid Structures" Sensors 23, no. 19: 8083. https://doi.org/10.3390/s23198083