A Field Study of Nonintrusive Load Monitoring Devices and Implications for Load Disaggregation
Abstract
:1. Introduction
- A review of key findings from NILM field evaluations;
- A protocol for field evaluations of NILM products;
- A field evaluation of a state-of-the-art NILM product, using recommended metrics by a technical advisory group (TAG);
- A hybrid load-disaggregation approach using NILM and complementary technologies.
2. Related Work
Findings from Prior NILM Field Evaluations
3. Methodology
3.1. Field Evaluation Performance Assessment Metrics
3.2. Performance Assessment Protocol
4. Experimental Design and Setup
4.1. Evaluation Design
4.2. Installation, Configuration, and Maintenance
5. Results
6. Discussion
6.1. Key Findings
6.2. Broader Implications
7. Conclusions
Author Contributions
Funding
Institutional Review Board Statement
Informed Consent Statement
Data Availability Statement
Conflicts of Interest
Appendix A
- Select the end-use categories of interest for evaluating the NILM product. These end uses should be monitored directly to collect ground-truth power data for comparison with NILM outputs.
- From all disaggregated loads of each NILM in each home, determine all possible combinations up to m disaggregated loads. For evaluation purposes, m = 3 is recommended. For example, if an NILM product provides three disaggregated outputs labeled “Stove/Range”, “Load 2”, and “Load 3”, as shown in Table A1, the seven possible combinations for up to three loads are “Stove/Range”, “Load 2”, “Load 3”, “Stove/Range” + “Load 2”, “Stove/Range” + “Load 3”, “Load 2” + “Load 3”, and “Stove/Range” + “Load 2” + “Load 3”.
| Time | Stove/ Range (kWh) | Load 2 (kWh) | Load 3 (kWh) |
|---|---|---|---|
| 19 October 2016 0:00 | 2.888 | 0.306 | 0.228 |
| 19 October 2016 0:01 | 4.641 | 0.306 | 0.228 |
| 19 October 2016 0:02 | 5.258 | 0.306 | 0.228 |
| 19 October 2016 0:03 | 5.258 | 0.306 | 0.228 |
| 19 October 2016 0:04 | 5.258 | 0.306 | 0.228 |
| 19 October 2016 0:05 | 5.258 | 0.306 | 0.228 |
| ⋮ | ⋮ | ⋮ | ⋮ |
- 3.
- Sum the NILM energy estimates of the loads within each disaggregated load combination, determined in step 2, to get the total power at each time interval. Table A2 provides an example.
| Time | Stove/Range (kWh) | Load 2 (kWh) | Load 3 (kWh) | Stove/Range + Load 2 (kWh) | Stove/Range + Load 3 (kWh) | Load 2 + Load 3 (kWh) | Stove/Range + Load 2 + Load 3 (kWh) |
|---|---|---|---|---|---|---|---|
| 19 October 2016 0:00 | 2.888 | 0.306 | 0.228 | 3.186 | 3.116 | 0.534 | 3.414 |
| 19 October 2016 0:01 | 4.641 | 0.306 | 0.228 | 4.947 | 4.869 | 0.534 | 5.175 |
| 19 October 2016 0:02 | 5.258 | 0.306 | 0.228 | 5.564 | 5.486 | 0.534 | 5.792 |
| 19 October 2016 0:03 | 5.258 | 0.306 | 0.228 | 5.564 | 5.486 | 0.534 | 5.792 |
| 19 October 2016 0:04 | 5.258 | 0.306 | 0.228 | 5.564 | 5.486 | 0.534 | 5.792 |
| 19 October 2016 0:05 | 5.258 | 0.306 | 0.228 | 5.564 | 5.486 | 0.534 | 5.792 |
| ⋮ | ⋮ | ⋮ | ⋮ | ⋮ | ⋮ | ⋮ | ⋮ |
- 4.
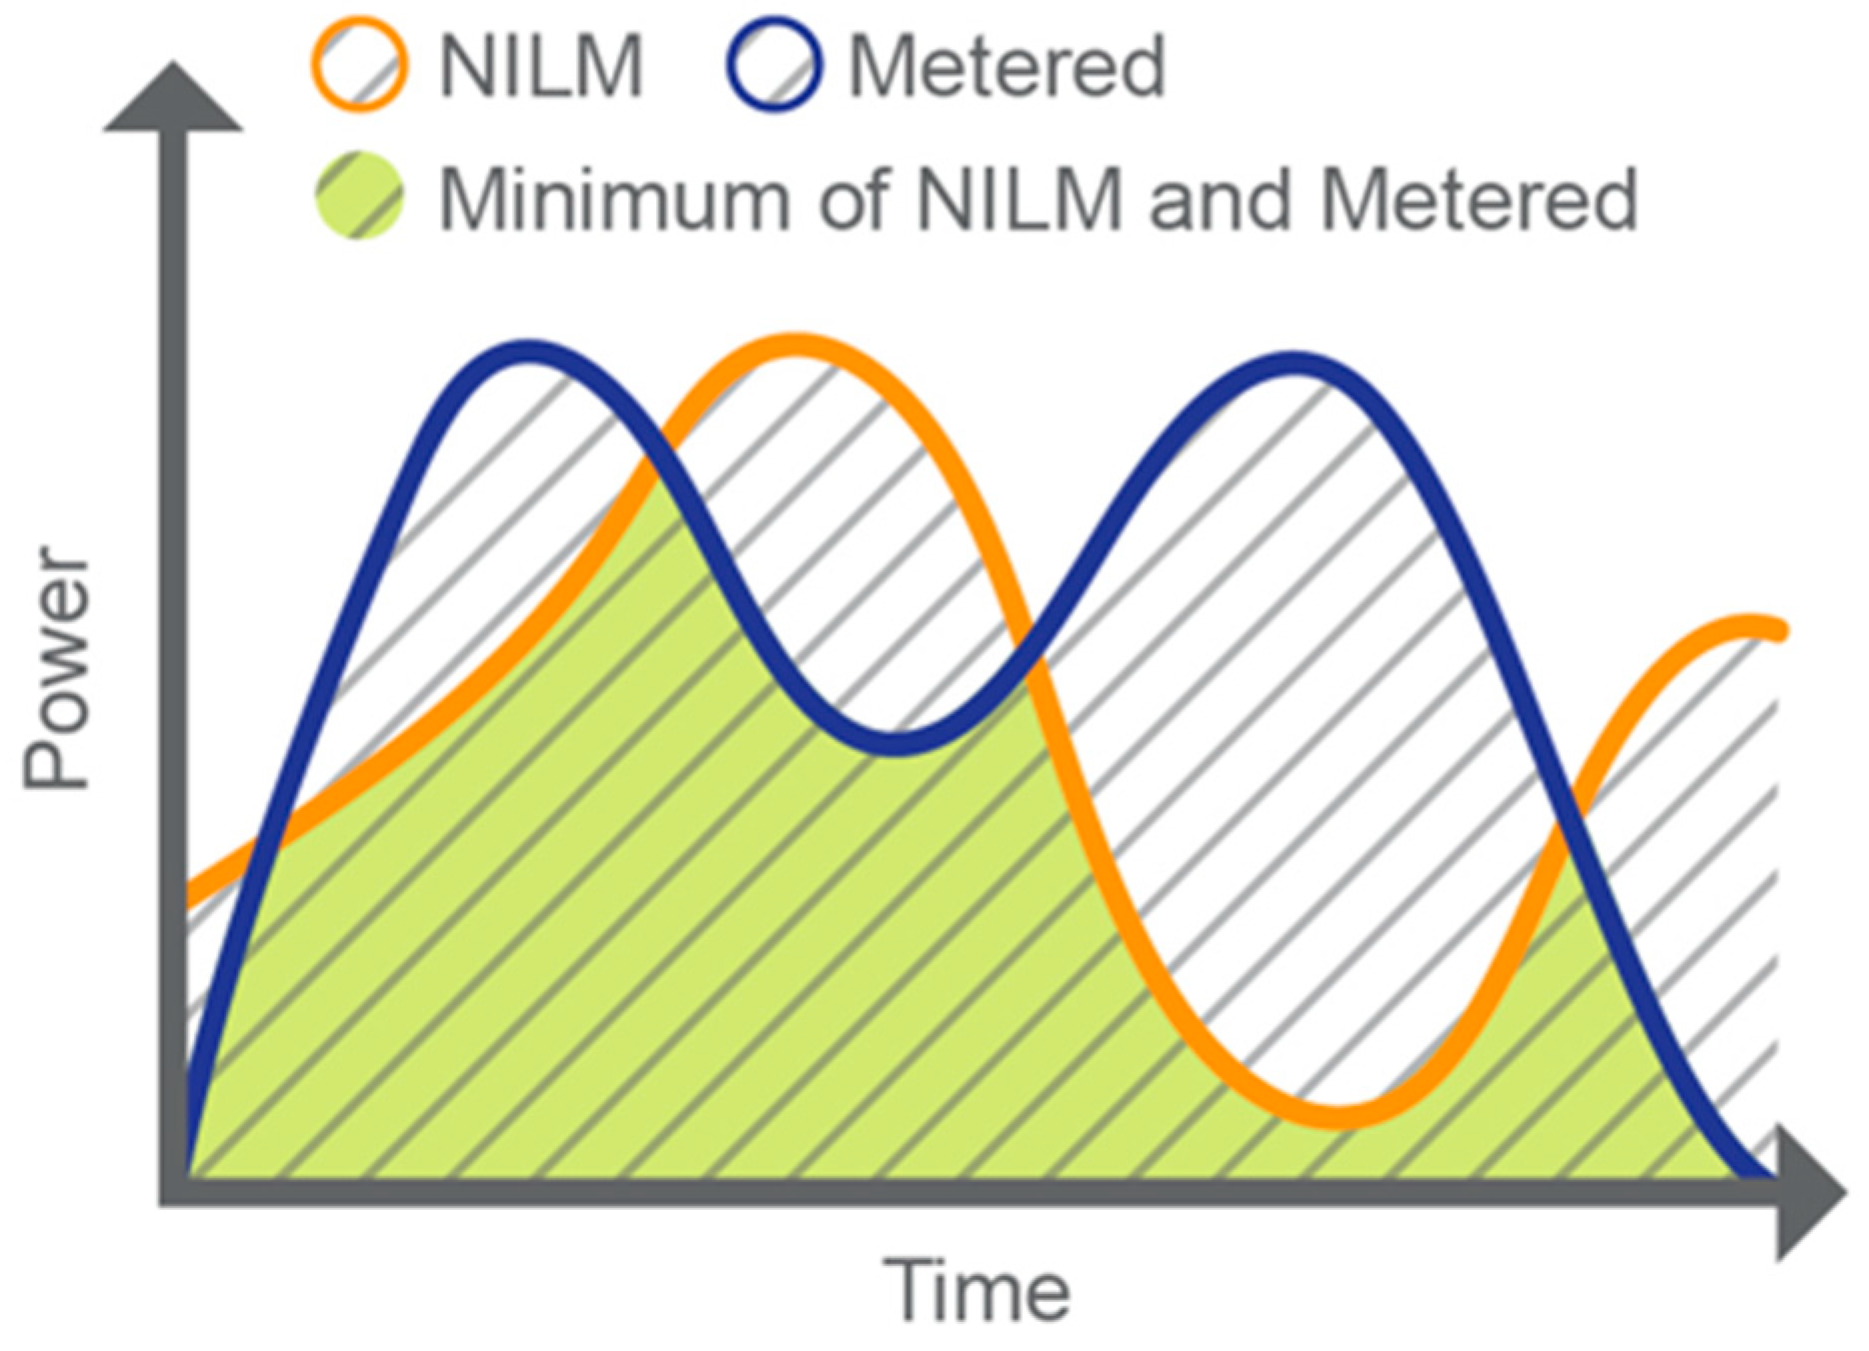
- Identify which disaggregated load combinations demonstrate the best fit with the ground-truth data for each end-use category. Find the closest NILM output match for each end-use category by comparing the ground truth collected for each category to each disaggregated load combination determined in step 3. The r2 metric below can be used for this comparison to examine the “goodness in fit” between power profiles.
| Stove/ Range | Load 2 | Load 3 | Stove/Range + Load 2 | Stove/Range + Load 3 | Load 2 + Load 3 | Stove/Range + Load 2 + Load 3 | |
|---|---|---|---|---|---|---|---|
| Refrigerator/Freezer | |||||||
| Clothes washer | |||||||
| Clothes dryer | |||||||
| Dishwasher | |||||||
| Water heater | |||||||
| Central air conditioner/Heat pump | |||||||
| Cooking range | |||||||
| Lighting |
- 5.
- For each best match in ground truth and NILM disaggregated load combinations (determined in step 4), roll up the energy data into the daily energy consumption. Then, apply the MR and MBE performance metrics.
- 6.
- Repeat steps 1–5 for each NILM product assessment in each home.
- 7.
- Summarize the overall performance across homes using the weighted averages of each metric based on the data available.
References
- Mayhorn, E.T.; Sullivan, G.P.; Petersen, J.; Butner, R.S.; Johnson, E.M. Load Disaggregation Technologies: Real World and Laboratory Performance. In Proceedings of the ACEEE 2016 Summer Study on Energy Efficiency in Buildings, Pacific Grove, CA, USA, 21–26 August 2016. [Google Scholar]
- Pereira, L.; Nunes, N. Performance evaluation in non-intrusive load monitoring: Datasets, metrics, and tools—A review. Wiley Interdiscip. Rev. Data Min. Knowl. Discov. 2018, 8, e1265. [Google Scholar] [CrossRef]
- Parson, O.; Fisher, G.; Hersey, A.; Batra, N.; Kelly, J.; Singh, A.; Knottenbelt, W.; Rogers, A. Dataport and NILMTK: A Building Data Set Designed for Non-Intrusive Load Monitoring. In Proceedings of the 2015 IEEE Global Conference on Signal and Information Processing (GlobalSIP), Orlando, FL, USA, 14–16 December 2015; pp. 210–214. [Google Scholar] [CrossRef]
- Reinhardt, A.; Klemenjak, C. How Does Load Disaggregation Performance Depend on Data Characteristics? Insights from a Benchmarking Study. In Proceedings of the Eleventh ACM International Conference on Future Energy Systems, E-Energy ’20, Virtual Event, Australia, 22–26 June 2020; Association for Computing Machinery: New York, NY, USA; pp. 167–177. [Google Scholar] [CrossRef]
- Mayhorn, E.T.; Sullivan, G.P.; Butner, R.S.; Hao, H.; Baechler, M.C. Characteristics and Performance of Existing Load Disaggregation Technologies; PNNL-24230; Pacific Northwest National Laboratory: Richland, WA, USA, 2015. [CrossRef]
- McWilliams, J.; Getachew, L.; Dyson, C. At Long Last: Realizing the Promise of Non-Intrusive Load Monitoring. In Proceedings of the ACEEE 2022 Summer Study on Energy Efficiency in Buildings, Pacific Grove, CA, USA, 21–26 August 2022. [Google Scholar]
- Meier, A.; Cautley, D. Practical Limits to the Use of Non-Intrusive Load Monitoring in Commercial Buildings. Energy Build. 2021, 251, 111308. [Google Scholar] [CrossRef]
- Norford, L.K.; Leeb, S.B. Non-Intrusive Electrical Load Monitoring in Commercial Buildings Based on Steady-State and Transient Load-Detection Algorithms. Energy Build. 1996, 24, 51–64. [Google Scholar] [CrossRef]
- Batra, N.; Parson, O.; Berges, M.; Singh, A.; Rogers, A. A Comparison of Non-Intrusive Load Monitoring Methods for Commercial and Residential Buildings. arXiv 2014, arXiv:1408.6595. [Google Scholar] [CrossRef]
- Yadav, A.; Sinha, A.; Saidi, A.; Trinkl, C.; Zörner, W. NILM Based Energy Disaggregation Algorithm for Dairy Farms. In Proceedings of the 5th International Workshop on Non-Intrusive Load Monitoring, Virtual Event, Japan, 18 November 2020. [Google Scholar] [CrossRef]
- Pecan Street Smart Grid Demonstration Project. Setting the Benchmark for Non-Intrusive Load Monitoring: A Comprehensive Assessment of AMI-Based Load Disaggregation. 2015. Available online: https://www.pecanstreet.org/dataport/papers/ (accessed on 26 August 2015).
- White, B.; Esser, M. Residential Disaggregation—Final Report. NegaWatt Consulting, Inc. 2014. Available online: http://www.etcc-ca.com/sites/default/files/reports/et13sdg1031-residential_disaggregation.pdf (accessed on 7 February 2016).
- Butzbaugh, J.B.; Mayhorn, E.T.; McNary, B. Residential Electricity End-use Disaggregation Using Whole Home Disaggregation Technologies. In Proceedings of the International Energy Program Evaluation Conference, Denver, CO, USA, 20–22 August 2019. [Google Scholar]
- Zhou, M.; Shao, S.; Wang, X.; Zhu, Z.; Hu, F. Deep Learning-Based Non-Intrusive Commercial Load Monitoring. Sensors 2022, 22, 5250. [Google Scholar] [CrossRef] [PubMed]


| Mean Bias Error | Home ID | Refrigerator (kWh) | Dryer (kWh) | Dishwasher (kWh) | Cooking (kWh) | Furnace Fan (kWh) | AC (kWh) | Water Heater (kWh) | Clothes Washer (kWh) |
|---|---|---|---|---|---|---|---|---|---|
| Product A | 1 | NM | 0.38 | 0.05 | −0.16 | ND | ND | NA | NM |
| 2 | −0.60 | NA | −0.34 | ND | −0.69 | NA | NA | −0.22 | |
| 3 | −0.77 | ND | −0.21 | −0.49 | ND | NA | −3.50 | NM | |
| 4 | ND | −1.20 | −0.36 | −0.52 | ND | ND | −0.20 | ND | |
| 5 | 0.12 | ND | NA | NM | −0.19 | NA | NA | NM | |
| 6 | −0.22 | −0.37 | −0.13 | NA | −1.78 | −0.09 | −0.52 | NM | |
| 7 | NM | NA | −0.46 | −0.70 | −3.03 | −0.21 | NM | −0.05 | |
| 8 | −2.18 | ND | NM | −0.49 | −0.26 | NA | ND | −0.03 | |
| Overall | −0.76 | −0.67 | −0.23 | −0.48 | −1.25 | −0.14 | −1.41 | −0.07 |
Disclaimer/Publisher’s Note: The statements, opinions and data contained in all publications are solely those of the individual author(s) and contributor(s) and not of MDPI and/or the editor(s). MDPI and/or the editor(s) disclaim responsibility for any injury to people or property resulting from any ideas, methods, instructions or products referred to in the content. |
© 2023 by the authors. Licensee MDPI, Basel, Switzerland. This article is an open access article distributed under the terms and conditions of the Creative Commons Attribution (CC BY) license (https://creativecommons.org/licenses/by/4.0/).
Share and Cite
Mayhorn, E.; Butzbaugh, J.; Meier, A. A Field Study of Nonintrusive Load Monitoring Devices and Implications for Load Disaggregation. Sensors 2023, 23, 8253. https://doi.org/10.3390/s23198253
Mayhorn E, Butzbaugh J, Meier A. A Field Study of Nonintrusive Load Monitoring Devices and Implications for Load Disaggregation. Sensors. 2023; 23(19):8253. https://doi.org/10.3390/s23198253
Chicago/Turabian StyleMayhorn, Ebony, Joshua Butzbaugh, and Alan Meier. 2023. "A Field Study of Nonintrusive Load Monitoring Devices and Implications for Load Disaggregation" Sensors 23, no. 19: 8253. https://doi.org/10.3390/s23198253
APA StyleMayhorn, E., Butzbaugh, J., & Meier, A. (2023). A Field Study of Nonintrusive Load Monitoring Devices and Implications for Load Disaggregation. Sensors, 23(19), 8253. https://doi.org/10.3390/s23198253


